1. Introduction
Frequent large-scale environmental disasters, such as haze and water pollution, have raised concerns among researchers and the public [
1]. Such social pressure forces the government to actively explore new instruments of governance to control environmental pollutions [
2,
3], and employ new methods such as machine learning to evaluate its policies.
Environmental Taxes are a particular type of economic instrument to handle environmental problems by internalizing environmental costs and creating economic incentives for the public and businesses to promote ecologically sustainable activities [
1,
4].
For thirty years, environmental tax reform has developed rapidly in the globe [
4]. European Union (EU) has implemented series of green growth policies since 1990s [
5,
6,
7]. In Canada, British Columbia (BC) became the first jurisdiction to approve a revenue-neutral carbon tax in 2008 [
8]. Environmental tax reform has also spread to developing countries in Asia [
9]. The major concern of environment tax in these countries is to adjust the tax bases and to bring about “double dividend” [
10], as to improve the environment and economic efficiency simultaneously. Since having gradually getting rid of the dilemma of “treatment after pollution”, the object of taxation in developed countries is mainly carbon [
11]. Likewise, the research on the environmental tax has also focused on relationship between environmental management, economic development and social activities [
12,
13,
14]. Typical evaluation methods include CGE (Computable General Equilibrium) [
6] such as General Equilibrium Model for Economy-Energy-Environment (GEM-E3,
http://www.gem-e3.net), Asia-Pacific Integrated Model (AIM,
http://www-iam.nies.go.jp) and Global Trade Analysis Project (GTAP,
http://www.gtap.agecon.purdue.edu/models), and time-series-based macro-econometric models [
15], such as GINFORS [
16] and E3ME [
17].
With the growing prominence of environmental issues, the study of environmental tax reform in China has also followed the international trends [
3]. China’s environmental policy assessment originated from the study of pollution levy system [
18,
19,
20,
21], focusing on the analysis of the effect, mechanism of sewage fees and collection system aiming to reduce the charges. With the internationalization of China’s environmental problems, the central focus has also shifted to environmental taxes [
2] and the interaction between environmental policy and economic development [
22], such as double dividend [
23] and the theoretical mechanism on EFT reform. CGE [
24,
25] and other simulation methods are applied in the evaluations. The research on environmental tax in China is still in its infancy and focuses mainly on tracking research on international hot topics and methods while lacks in-depth quantitative analysis on China’s own environmental pollution control policy assessment. China is still suffering from serious environmental pollution. Unlike developed countries that focus on carbon emissions, China pays more attention on SO
2 and other pollutants control in its Environmental Protection Tax Law (Draft) and other environmental policies. In China, environmental taxes were first introduced in “Energy Saving and Emission Reduction Comprehensive Work Plan, 2007”. Essentially, the most important part of the environmental tax reform is the “Environmental Fee to Tax (EFT)” reform. This EFT reform was first piloted in Hubei Province in October 2007. After years of repeated debates, the State Council Legislative Affairs Office released the Environmental Protection Tax Law (Draft) in June 2015 and officially extended Hubei Province’s EFT reform mode nationwide.
The environmental implication of this EFT reform is still in controversy [
1]. Supporters of this law believe that EFT is changing the pollutant discharge fees, a soft constraint into environmental taxes, an obligatory constraint, greatly enhancing the intensity and rigidity of law enforcement. EFT is an effective way to avoid rent-seeking in the environmental protection departments and interference to the collection of pollutant discharge fees by protectionisms, and reduce the shelter to polluters, so as to promote polluting enterprises to make efforts on reducing emissions [
22,
24].
Opponents argued that the main reason for the poor effect of pollutant discharge fees is that the fee rate of pollutants is too low; this cannot generate incentives for emission reductions. Enterprises would rather pay than reduce emissions [
21]. When the pollutant discharge fees are changed into environmental taxes, while pollutant tax rates are not greatly increased, the emission reduction will not be promoted. Therefore, a reasonable assessment of the policy effect of EFT not only has theoretical significance but also has important practical meaning for the legislation of environmental protection tax [
1,
23].
As many important reforms in China, China’s legislation on environmental taxes follows the line of thinking—from pilot to popularization. Ordinary measurement methods are difficult to have performance for the implementation of pilot policy on a small scale. The limitations of CGE model and macroeconomic model in the environmental emissions effect evaluation are also prompting China to seek another way to assess the effect of environmental tax reform [
24,
25].
Experimental economics presents an objective and effective evaluation of experimental results, and provides a new perspective and solution for the policy makers and scholars [
26,
27]. The reasonable environment system design can change the behavior of pollution through both of constraint and incentive, and then reach the expected goal of environmental performance, and therefore, the organic combination of system, behavior and performance is an effective strategy for the research and analysis of EFT policy.
Experimental economics has a quasi-natural experimental method. The experimental group, where the policy is implemented, is compared with the control group, where the policy is not implemented. The effect of policy can be seen by the difference of the two groups. The core of quasi-natural experiment method is to find the appropriate control group, and the main methods include difference-in-differences (DIDS), regression discontinuity design (RD design), synthetic control method (SCM), etc. Among them, the DIDS is the longest method costing most study efforts, and moreover its credibility is higher [
27]. However, DIDS has two major problems for the performance study of EFT as follows: (1) subjectivity of control group select; and (2) policy endogenesis [
28].
RD design is the most widely used in the specific space or in a field, there are obvious natural boundaries. SCM has the shortest time of birth which uses machine learning for fitting; this is a method highly suitable for the study of small samples [
29,
30].
SCM is a new policy evaluation method proposed by Abadie [
29], and its basic idea is to construct a good control city through a weighted combination of multi control cities, so as to seek for a control city that is completely similar to the target city; this is still an important and difficult problem, which has long plagued the research of policy assessment. SCM’s advantages are as follows: (1) SCM is suitable for fine quantitative analysis of small samples; (2) by machine learning method based on big data, SCM can determine the weight of control city group to decrease the error of subjective choice [
30]; and (3) SCM uses independent modeling, provides corresponding control object for the study of individual, and avoids average evaluation [
31].
The basic logic of this method is that it is difficult to find a similar comparison city for each city in the treatment group, but we can construct a good comparison city with other no-EFT cities outside Hubei Province by multiple computing iterations in machine learning algorithm. Because synthetic control avoids the limitation of the traditional method, it has been widely used in the field of policy evaluation in recent years, including crime interventions [
32], tropical deforestation [
33] and local impacts of nuclear power facilities [
34]. In the field of environmental policy, Zhang [
35] has used the synthetic control method to evaluate whether the 2008 Olympic Games improved Beijing’s air quality.
In this study, we employ the synthetic control method, a new approach based on machine learning algorithm, to assess the impacts of EFT reform among 12 cities in Hubei Province. By creating a synthetic city with multi cities to replicate the target city, we obtained the excess reductions of SO2 emission caused by the reform. The results demonstrate that the EFT reform can effectively restrain the pollutant discharge, but the effect has regional heterogeneity.
The rest of the paper is organized as follows:
Section 2 is background of policy.
Section 3 introduces the method and data.
Section 4 estimates the influence of EFT reform on the SO
2 emission intensity. Finally,
Section 5 is the discussion and conclusions.
3. Method and Data
3.1. Synthetic Control Method and Machining Learning
In the public domain, from the national level, a series of policy intervention may be implemented. How to identify the path and influence size of a correct policy is very difficult, especially the effect of a pilot policy [
28]. There are two main reasons:
- (1)
Policy endogeneity, which means that there is a systematic difference between pilot cities and other cities, and this difference is exactly the reason for why the cities to become pilot cities;
- (2)
The time and regional restrictions of the pilot areas cannot provide a large number of policy implementation samples; this is not applicable to the traditional econometric methods. Synthetic control method provides a new approach to identifying the effectiveness of the policy. This approach conducts classification and clustering learning according to the characteristics of a large number of non-pilot cities through machine learning, and extracts the core elements to establish a multidimensional model image of pilot cities. By means of linkage of small samples of pilot and big data, the effective assessment of performance on the pilot cities is implemented.
In this section, we attempt to reveal the causal effect of EFT reform by imputing the missing potential emission intensity reductions, which is the counterfactual outcome that would have prevailed if cities had not implemented the EFT reform. For this purpose, we invoke the synthetic control method, first developed by Abadie and Gardeazabal [
29] and then extended by Abadie et al. [
31].
EFT reform in Hubei Province began at the end of 2007. Since other provinces did not adopt the reform policy, we can take the environmental tax reform in Hubei Province as a natural experiment. In accordance with the theory of policy evaluation, we put the pilot cities after 2007 into the treatment group, other cities into the control group, and then by comparing the differences between the control group and the treatment group, we will be able to assess the effect of the EFT reform. Suppose there are
K + 1 cities, as indexed by
i = 1, 2, …,
K + 1 over all T periods,
t = 1, 2, …,
T. Only city
i = 1 passed the EFT reform and the remaining K cities are the potential control cities that did not pass the reform, also called the donor pool. Then there are
T0 number of pre-reform periods, and
T1 number of post-reform periods so
T0 +
T1 =
T. The general effect of tax reform for city
i at period
t is then given by
where
is the pollutants emission intensity of city
i if the reform is started in
T0 + 1 to
T and
is the pollutants emission intensity in the absence of the reform. Since only city
i = 1 starts EFT reform, we need to estimate (
). We can first estimate
by the factor model:
where
is an unidentified common factor invariant across the units,
is the covariate vector not affected by the reform,
is a vector of unidentified time-specific parameters,
is a vector of unidentified common factors, while
is the city-specific non-observable and also the error term
is the zero-mean variable following the random distribution. The existence of anticipatory effects are irrelevant in this case, indicating that all the essential elements in
that belong to pre-reform period are not impacted by the reform. Equation (1) allows the effect of non-observable city heterogeneity to differ over time.
In our study, all the factors, such as economic factors, population factors, factors of openness, administrative factors, technological factors and industrial structure factors , are the inputs, as the of the model from Equation (1).
With the panel DIDS estimator, the consequence of non-observable heterogeneity, is supposed to be fixed over time. Thus, the synthetic control method makes a substantial improvement on the DIDS method and handles endogeneity caused by the existence of non-observable confounders varying over time.
The method intends to construct the missing counterfactual,
from the cities not impacted by the reform. Let
be
vector of weights such that
for
and
. Each vector
W presents a possible synthetic control, which means a distinct weighted average of control cities. The outcome variable value for each particular synthetic control is:
Suppose that there are
such that:
Abadie et al. [
28] prove if
is non-singular, then
is applied as unidentified common factors to present the unknown variables, which may also influence the model. There are many ways to guarantee that non-singular condition is satisfied, such as feeding the vectors as constant.
Abadie et al. [
30] shows the estimate of the effect of the reform for the enacted cities, Equation (5) is an unbiased estimator of
:
where
the weight is assigned to the kt cities that did not enact the reform.
Equation (4) can hold exactly only if actually belongs to the convex hull of . This means it is possible that the pre-reform SO2 emissions intensity of some of the reform-enacted states will not be synthetized properly using the pre-reform features of the cities that did not enact such reform.
The vector
is designed to minimize the distance relationship between the vector of pre-reform features for the exposed city
and the weighted matrix that does contain the pre-reform features of the unexposed cities
where
is a positive semi-definite symmetric matrix. The minimization procedure is strictly subject to certain constraints that the weight specifically assigned to unexposed city varies between zero and one, and the sum of weights is bounded by one.
For Equation (6), we used the quadratic programming, which is a typical optimization method in machine learning [
36], in order to optimize the minimization process of the loss function of the weights. The machine learning method in the synthetic control method enables us to evaluate the model not only with big size of samples, but also with small ones by constructing a virtual synthetic match groups.
Synthetic control method promotes the effective usage of data-driven processes to automatically generate suitable comparison groups. This enables researchers to use quantitative and qualitative methodologies, to effectively analyze similarities and differences between the participating units representing the particular case of interest and the synthetic control, to evaluate the impact of the individual cases rather than a single average value of impact [
34]. This method can be particularly useful for our study, of which the sample data are relatively small and evaluation of an average effect could be rather difficult or potentially misleading. However, we notice the limitations of the analytical method, and make recommendations for empirical practice. Although synthetic controls are defined as convex combinations of unexposed individual units, weights above one or negative weights can also be used by allowing the extrapolation. For example, for either China’s highest industrial sulfur dioxide emissions intensity city Chongqing or the lowest emission intensity city Sanya, the control group cannot be weighted to reach the same industrial sulfur dioxide emissions, so synthetic control method is no longer appropriate in this case. Fortunately, most of the cities in Hubei Province does not have this problem; it is suitable for synthetic control method.
3.2. Data and Sample Selection
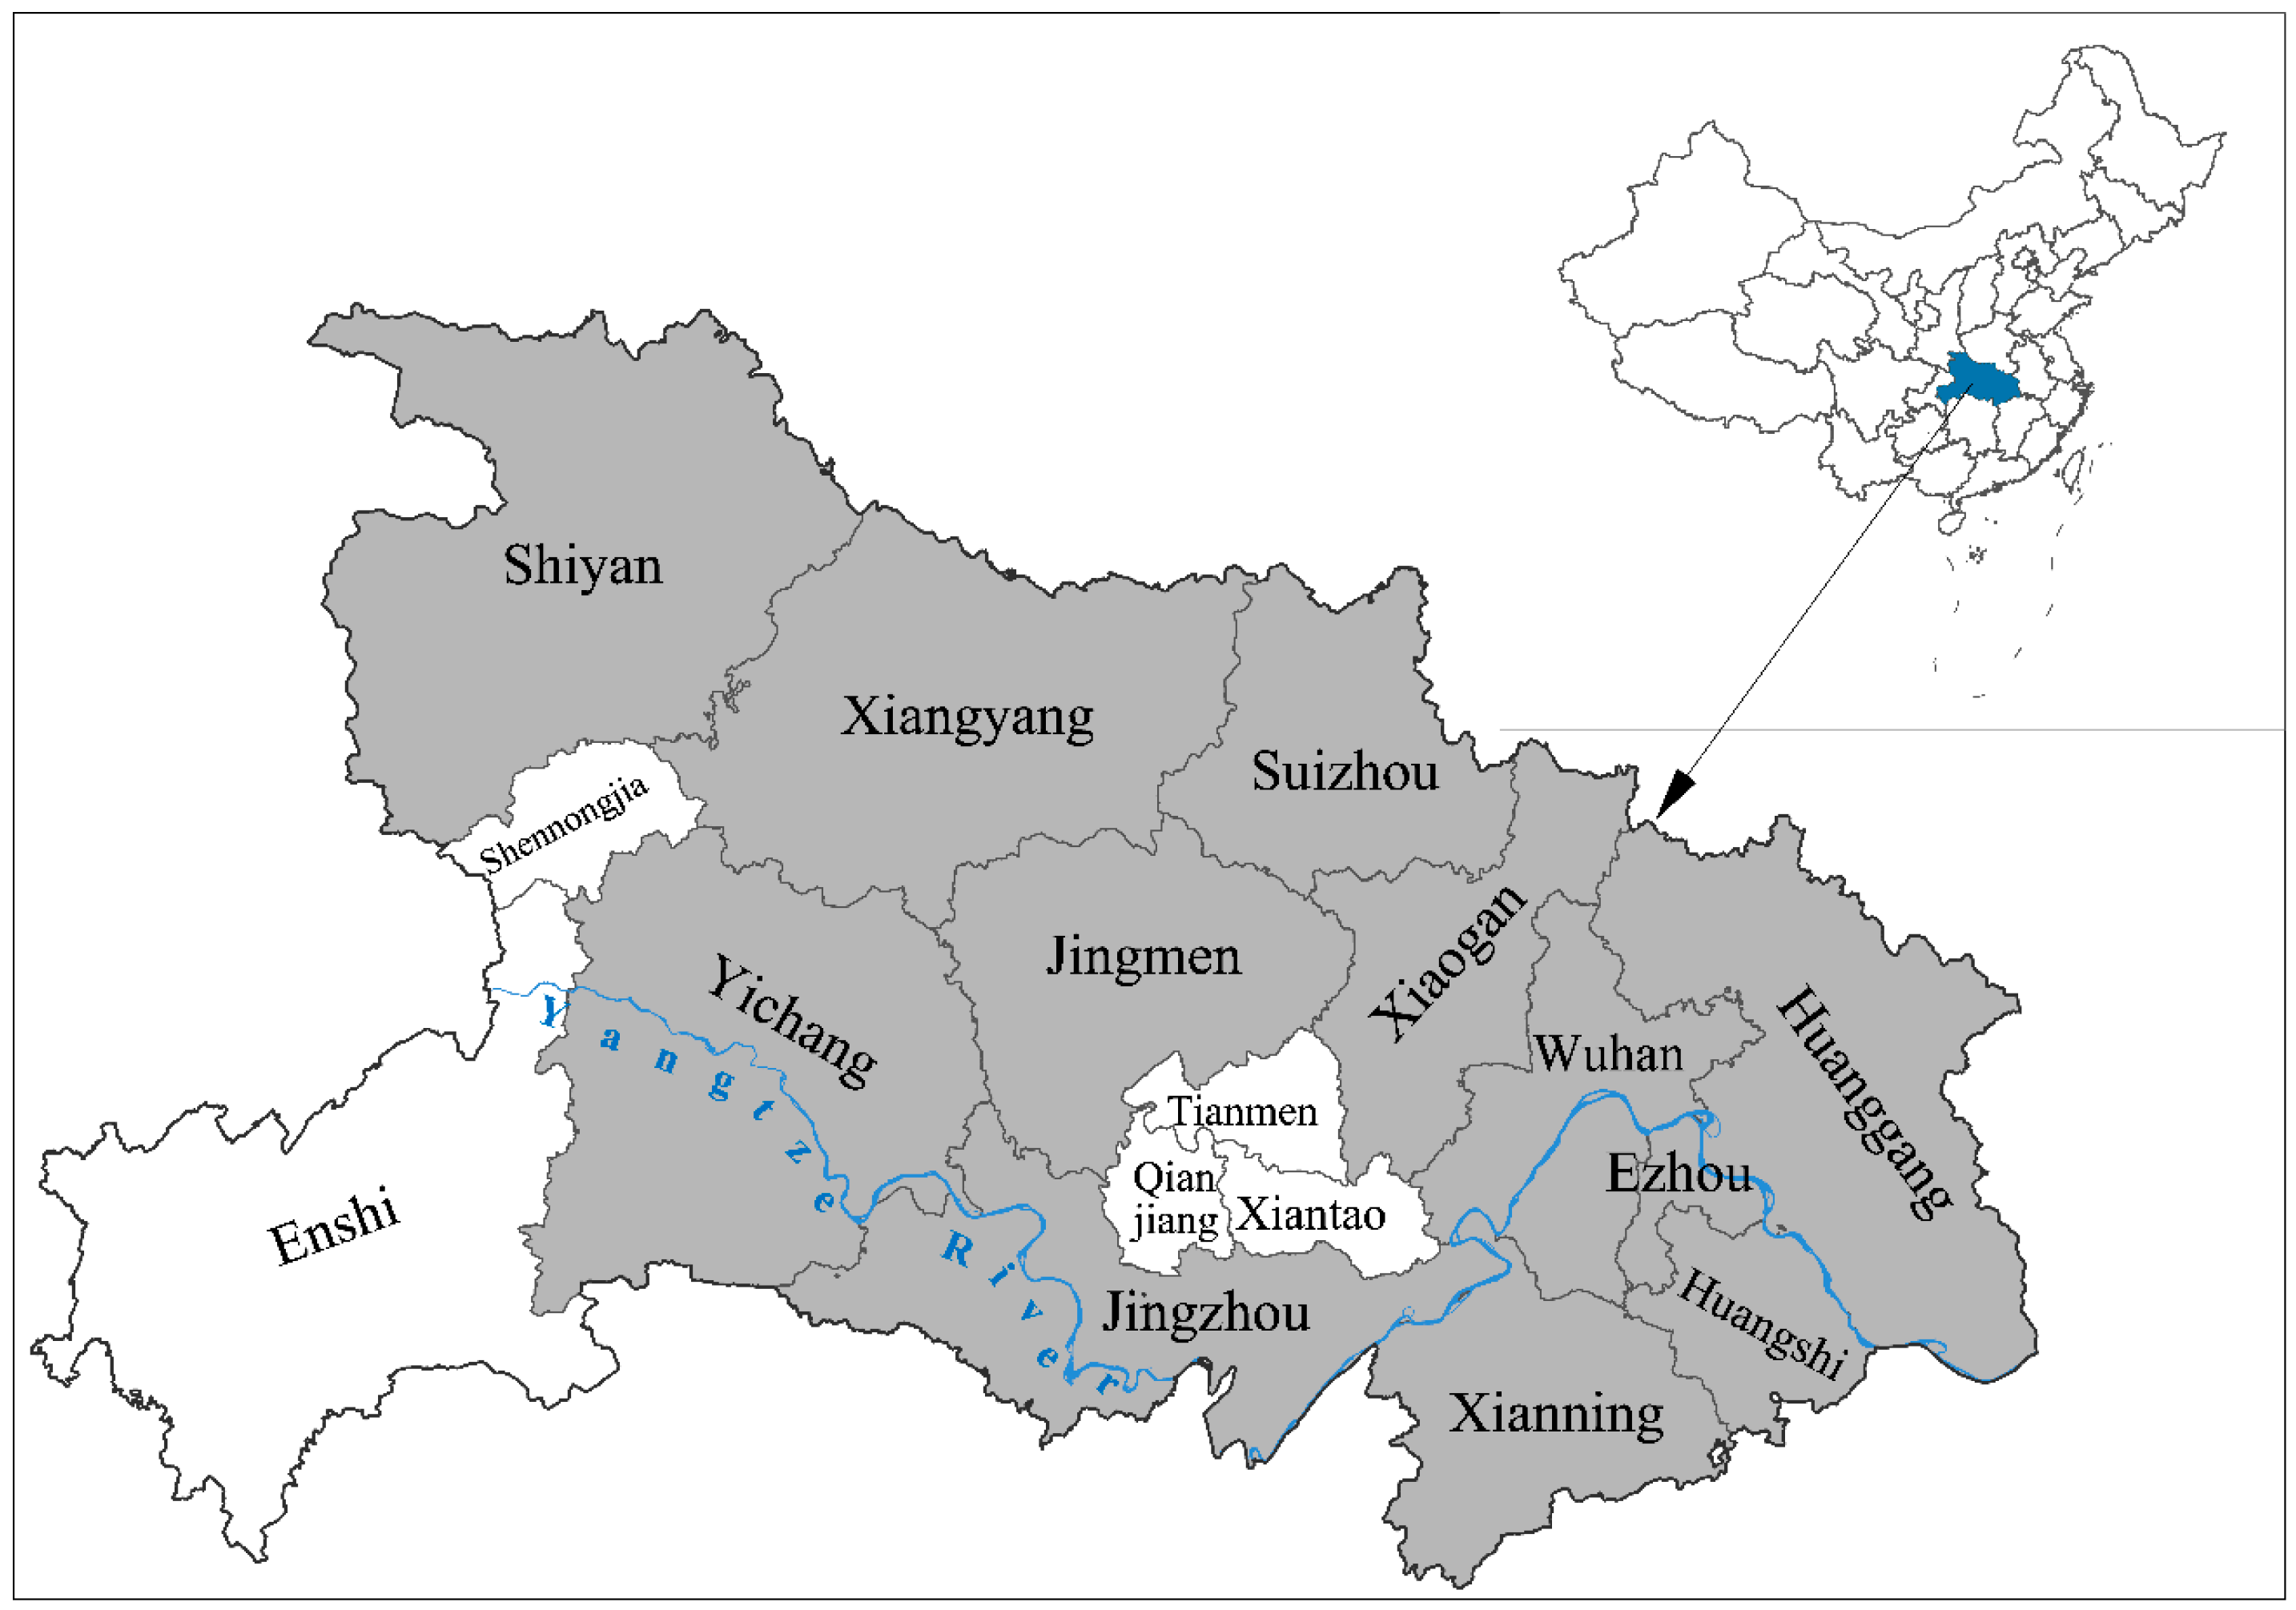
We used balanced panel data during 2003–2013 of 12 pilot cities in Hubei Province (
Figure 1) and the other 262 cities in China. The city data come from the CHINA CITY STATISTICAL YEARBOOK [
37] and the official websites of these cities’ Statistics Bureaus, while national and provincial data come from the CHINA ENVIRONMENT YEARBOOK [
38].
According to lots of previous work, such as the study of Peng et al. [
39] and Lehoczki and Sleszynski [
40], this study chooses industrial SO
2 emissions intensity (GDP and per capita GDP used in this paper are based on the benchmark of 2003 at constant price) as an EFT reform evaluation indicator, and the specific equation such as Equation (7). Due to the difference of each city’s SO
2 emission intensity, the direct use of the difference of emission reduction intensity is not scientific. This study takes β difference ratio to represent the effect of EFT, named decline rate hereinafter referred to as the emission reduction effect, and the specific equation such as Equation (8).
China is currently the world’s largest source of SO
2 emissions; meanwhile, SO
2 is the main air pollutant [
41] in China, causing various environmental disasters such as acid rain [
42] and haze weather [
43]. Industrial SO
2 emissions accounted for more than 90% of China’s total pollutant emissions. Thus, controlling such pollution is an urgent task for environmental protection authorities. This study chooses industrial SO
2 emission intensity, namely the ratio of SO
2 emissions to GDP, and the tax reform effect in improving the regional environment.
The sample of this study has the typical “treatment after pollution” characteristics. In March 2004, Premier Wen Jiabao proposed the “Rise of Central China” [
44], followed by a series of plans to stimulate the central region’s economy, including Hubei Province. Correspondingly, Hubei Province experienced rapid economic growth—its GDP grew at an average annual rate of 13.2% between 2004 and 2007. We have also found that Hubei Province’s GDP growth rate has been higher than the national average from 2008 onwards.
With the rapid economic development, pollution has become more and more serious in central China. From 2004 to 2005, emissions of pollutants in Hubei Province rose despite a national trend of decline. In order to improve the environment, Hubei Province implemented the EFT reform in all the subordinate cities. This spontaneous policy represents a clear endogeneity, and in this case, the synthetic control method has the advantage over traditional DIDS method. Due to data availability, 12 cities in Hubei Province are included into this research: Wuhan, Xiangyang, Ezhou, Jingzhou, Jingmen, Xianning, Xiaogan, Huangshi, Huanggang, Yichang, Suizhou and Shiyan. We define these 12 cities as the target cities, and select 262 other cities outside Hubei Province as the control group. Because October 2007 is the EFT reform’s starting point, the annual data before 2008 are used for the synthesis control cities, and data from 2008 onwards are used for assessing the policy effect.
Predictive variables are good indicators for measuring the effect of fitting results [
31].
- (a)
Economic factors: Grossman and Krueger [
45] first discovered inverted U shape curve of relationship between the degree of environmental pollution and per capita GDP, during the research on the environmental effect of North American Free Trade Agreement, which was later called “Environmental Kuznets Curve” (EKC). Shen [
46] found that China’s SO2 emissions are also in line with the characteristics of EKC. In this paper, we use per capita GDP to measure economic development level, recorded as GDP.
- (b)
Population factors: Urbanization promotes population concentration, which may lead to the scale effect of energy use and reduce pollution emissions [
46,
47], while the increase of per capita emissions may appear in sparsely populated areas due to the reduction of environmental regulations [
48]. In addition, Wang [
21] found that people with higher educational degrees to have a stronger awareness of environmental protection, and also to actively fight against pollution. This paper uses the population density, which is the ratio of population at the end of a year and the area of the administrative area, to measure population concentration, and the education population ratio, which is the ratio of number of college students and population at the end of a year, to measure education level. The two variables are recorded as population (pop, thereafter) and education (edu, thereafter) respectively.
- (c)
Factors of openness: In accordance with the principle of comparative advantage, the pollution intensive industries will be transferred from developed countries to developing countries, or from countries with strong environmental regulations to control weak countries. This is called Pollution Haven Hypothesis [
49]. Research [
50,
51] found that the opening up to foreign investment and the trade openness [
52] are related to the SO2 pollution. This paper uses the ratio of foreign industrial output and industrial output to measure the degree of economic openness, recorded as open.
- (d)
Administrative factors: Wang et al. [
53] pointed out that the Chinese enterprises have a strong bargaining power with local environmental protection agencies, resulting in environmental legislation not being fully implemented. The will and enforcement of environmental protection agencies have a great influence on the actual effects of policies. This paper uses the local fiscal dependence on industries, that is, the ratio of VAT payable of Industrial Enterprises above Designated Size and budgetary revenue for measurement, recorded as dependence (dep, thereafter).
- (e)
Technological factors: Progress of environmental protection technologies and R&D investment will directly improve the environmental protection effects. [
46] This paper uses the ratio of expenditure on science and technology to government’s budgeted expenditures for measurement, recorded as technologies (tech, thereafter).
- (f)
Industrial structure factors: EKC curve shows that environmental pollution is closely related to transformation of industrial structure [
54]. Industrialization in the early stage of economic development often leads to rapid increase of natural resources consumption and waste emissions. At later stages of development, the proportion of service industry normally increases, reducing the dependence on the exploitation of resources and energy consumption. The environmental pressure of industrial production is also reduced by technological and management innovation. In this paper, the environmental effect of industrial structure adjustment is measured by the ratio of second industry GDP to the tertiary industry GDP, recorded as second industry (seci, thereafter) and tertiary industry (teri, thereafter).
3.3. Enterprise Interview
In this paper, semi-structured in-depth interview method is adopted to conduct research on 27 enterprises from 12 pilot cities of Hubei Province. The aim of interview is to understand the specific changes with regard to the government’s management of enterprise pollution behavior, and learn whether the changes of regulatory actions can bring corresponding changes of enterprise emission strategy.
We mainly focus on studying EFT’s effect on enterprise pollution emissions, thus we select some enterprises with serious pollution emissions. The surveyed enterprises cover a plurality of polluting industries including thermal power, steel, chemical industry, etc. In addition, enterprises in different scales have different pollution abatement strategies, meanwhile, the scale of enterprises will also affect the degree of game between the enterprise and government, and therefore we survey enterprises in the different scale. Enterprise scale is divided into large enterprises (listing corporation; the number of employees is more than 2000), medium-sized enterprises (the number of employees is more than 300 people) and small businesses (the number of employees is below 300). Respondents are mostly administrators from the enterprise’s governmental affairs department and the technical department.
4. Results
4.1. Constructing a Synthetic Version of City
In view of the differences in administrative enforcement and subjective initiative, this paper does not take the methods of the previous studies to mix all the pilot cities, but uses the method of city-by-city analysis by constructing the synthetic control city for each pilot city. Effect of EFT reform is measured by the difference in SO
2 emission intensity between each pilot city and its synthetic control city. Taking Wuhan for example, this paper utilizes SO
2 emission intensity and predictive control variable (per capita GDP, industrial structure, population density, etc.) from 2003 to 2007 to synthesize the control city of Wuhan. The effect of EFT reform on Wuhan is measured with the difference in SO
2 emission intensity after 2008. The principle of choosing the weight of cities is the minimum of the mean square error of SO
2 emission intensity before the EFT reform. Based on Equation (5), the weight of the synthetic control group of Wuhan can be calculated as shown in
Table 2.
Table 3 compares the pre-reform features of Wuhan to the synthetic Wuhan, and to those of an average of the 262 cities in our donor pool. Results in
Table 3 suggest that the synthetic Wuhan draws a better comparison for Wuhan than the average of the sample of other cities. The synthetic Wuhan is very similar to the real Wuhan for the pre-2008 period. In particular, SO
2 emissions in 2003, 2005, and 2007 of the synthetic of Wuhan all fit very well with that of real Wuhan.
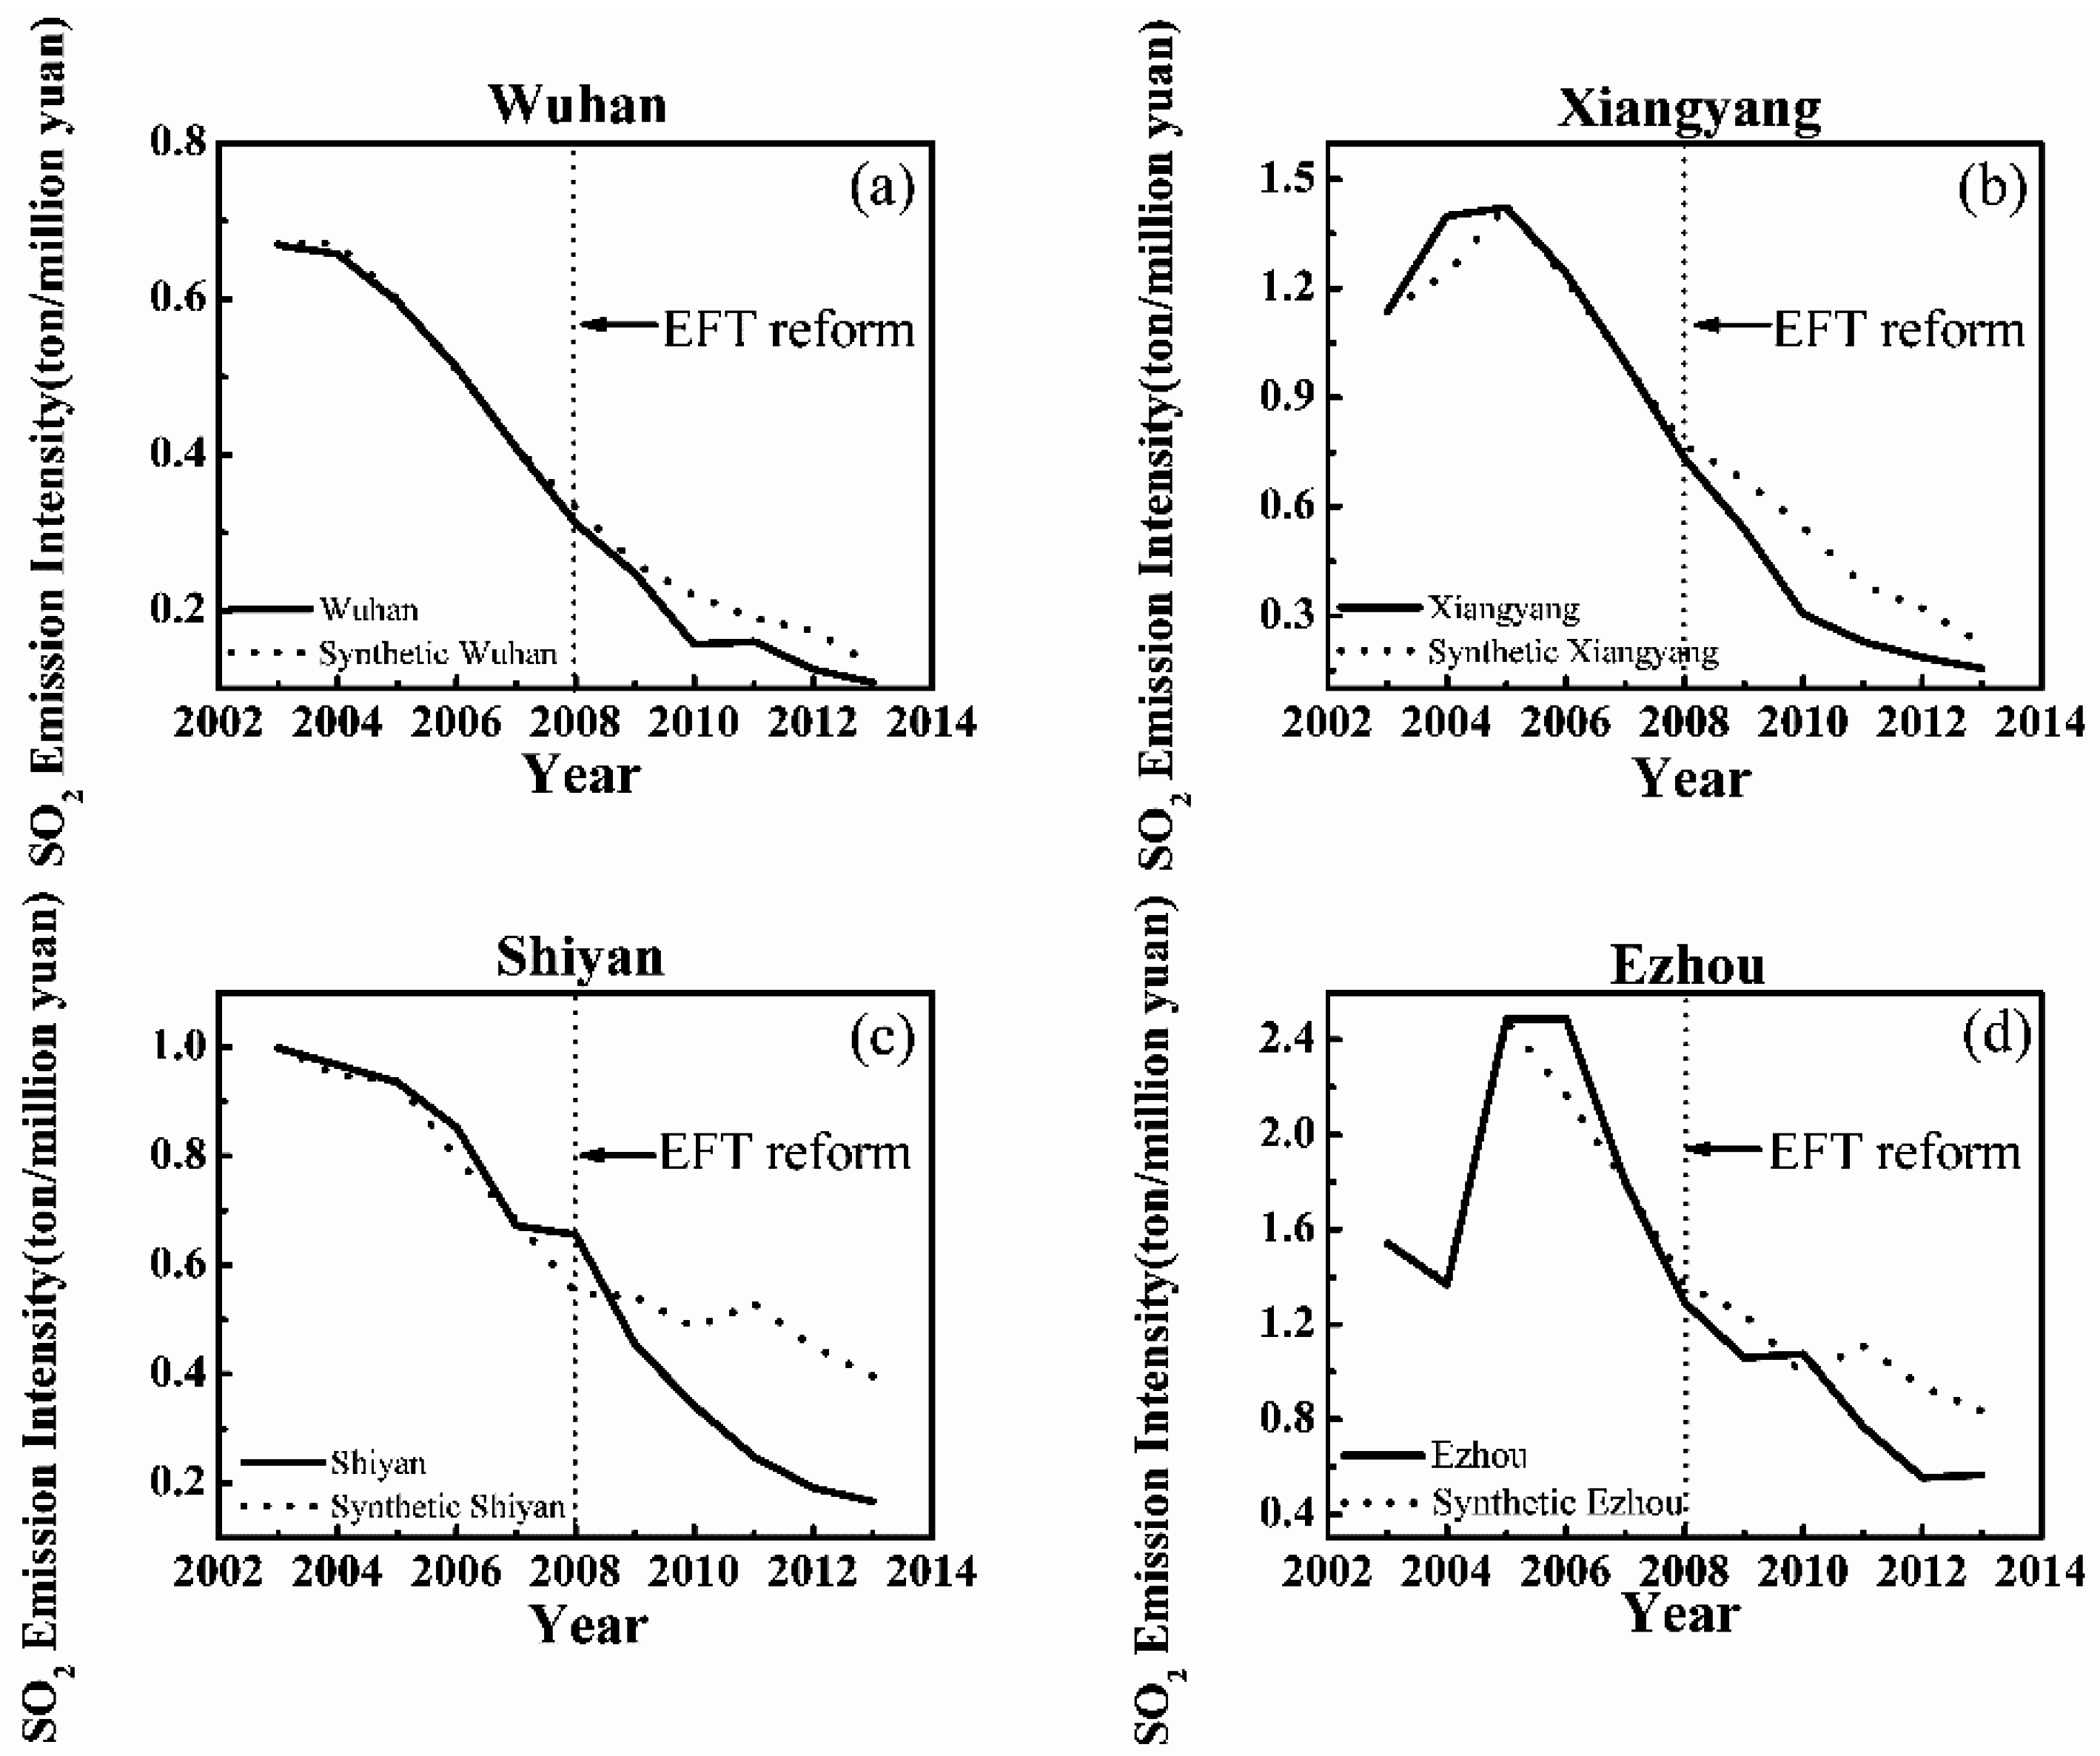
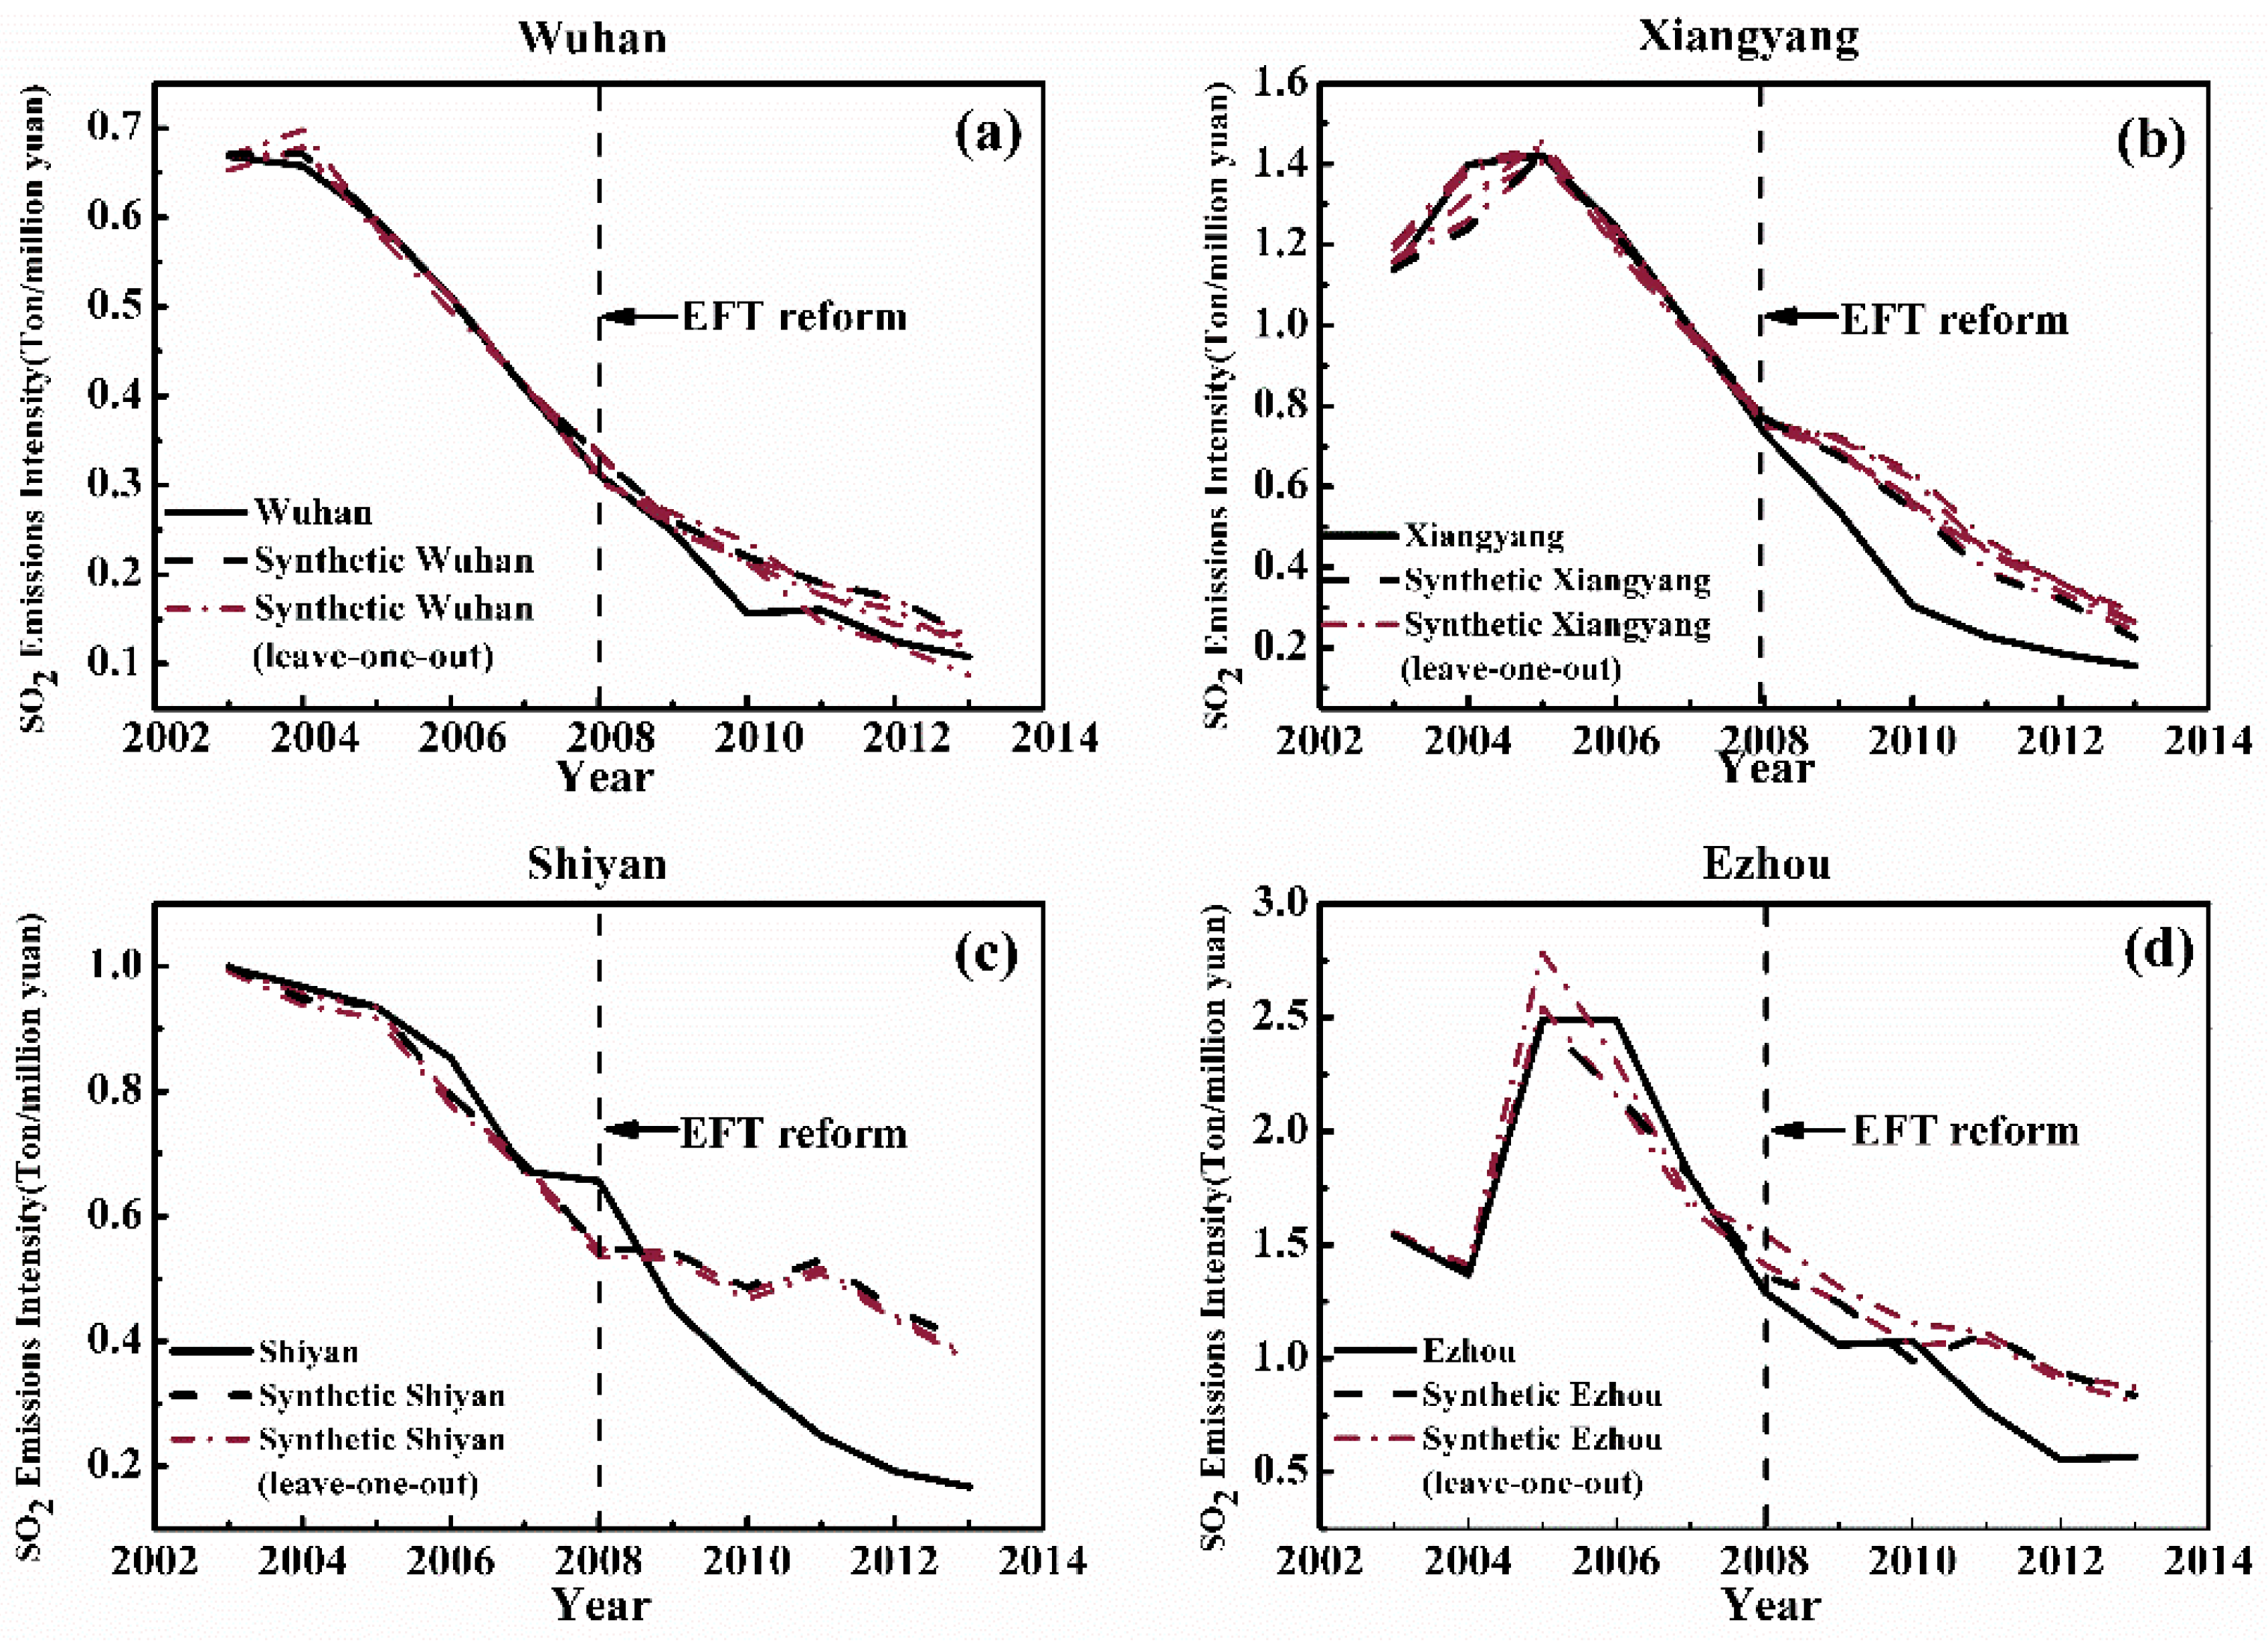
Figure 2,
Figure 3 and
Figure 4 show the SO
2 emission intensity of each treated city and the corresponding synthetic city, in which the vertical dashed line represents the beginning year of the EFT reform. The SO
2 emission intensity in most of the pilot cities and their synthetic control cities are very close on the left side of the line, while they gradually deviate on the right side. For example, the results of SO
2 emission intensity in Wuhan and synthetic Wuhan are very close to each other between 2003 and 2007, but from 2008 onwards, the latter is higher, with the gap between them representing the effect of the EFT reform. Depending on the reform’s impact on SO
2 emission intensity, the results of the 12 pilot cities are divided into three groups. The first group includes cities that are sensitive to the reform with a significant reduction of SO
2 emission. These cities are Wuhan, Shiyan, Xiangyang and Ezhou (
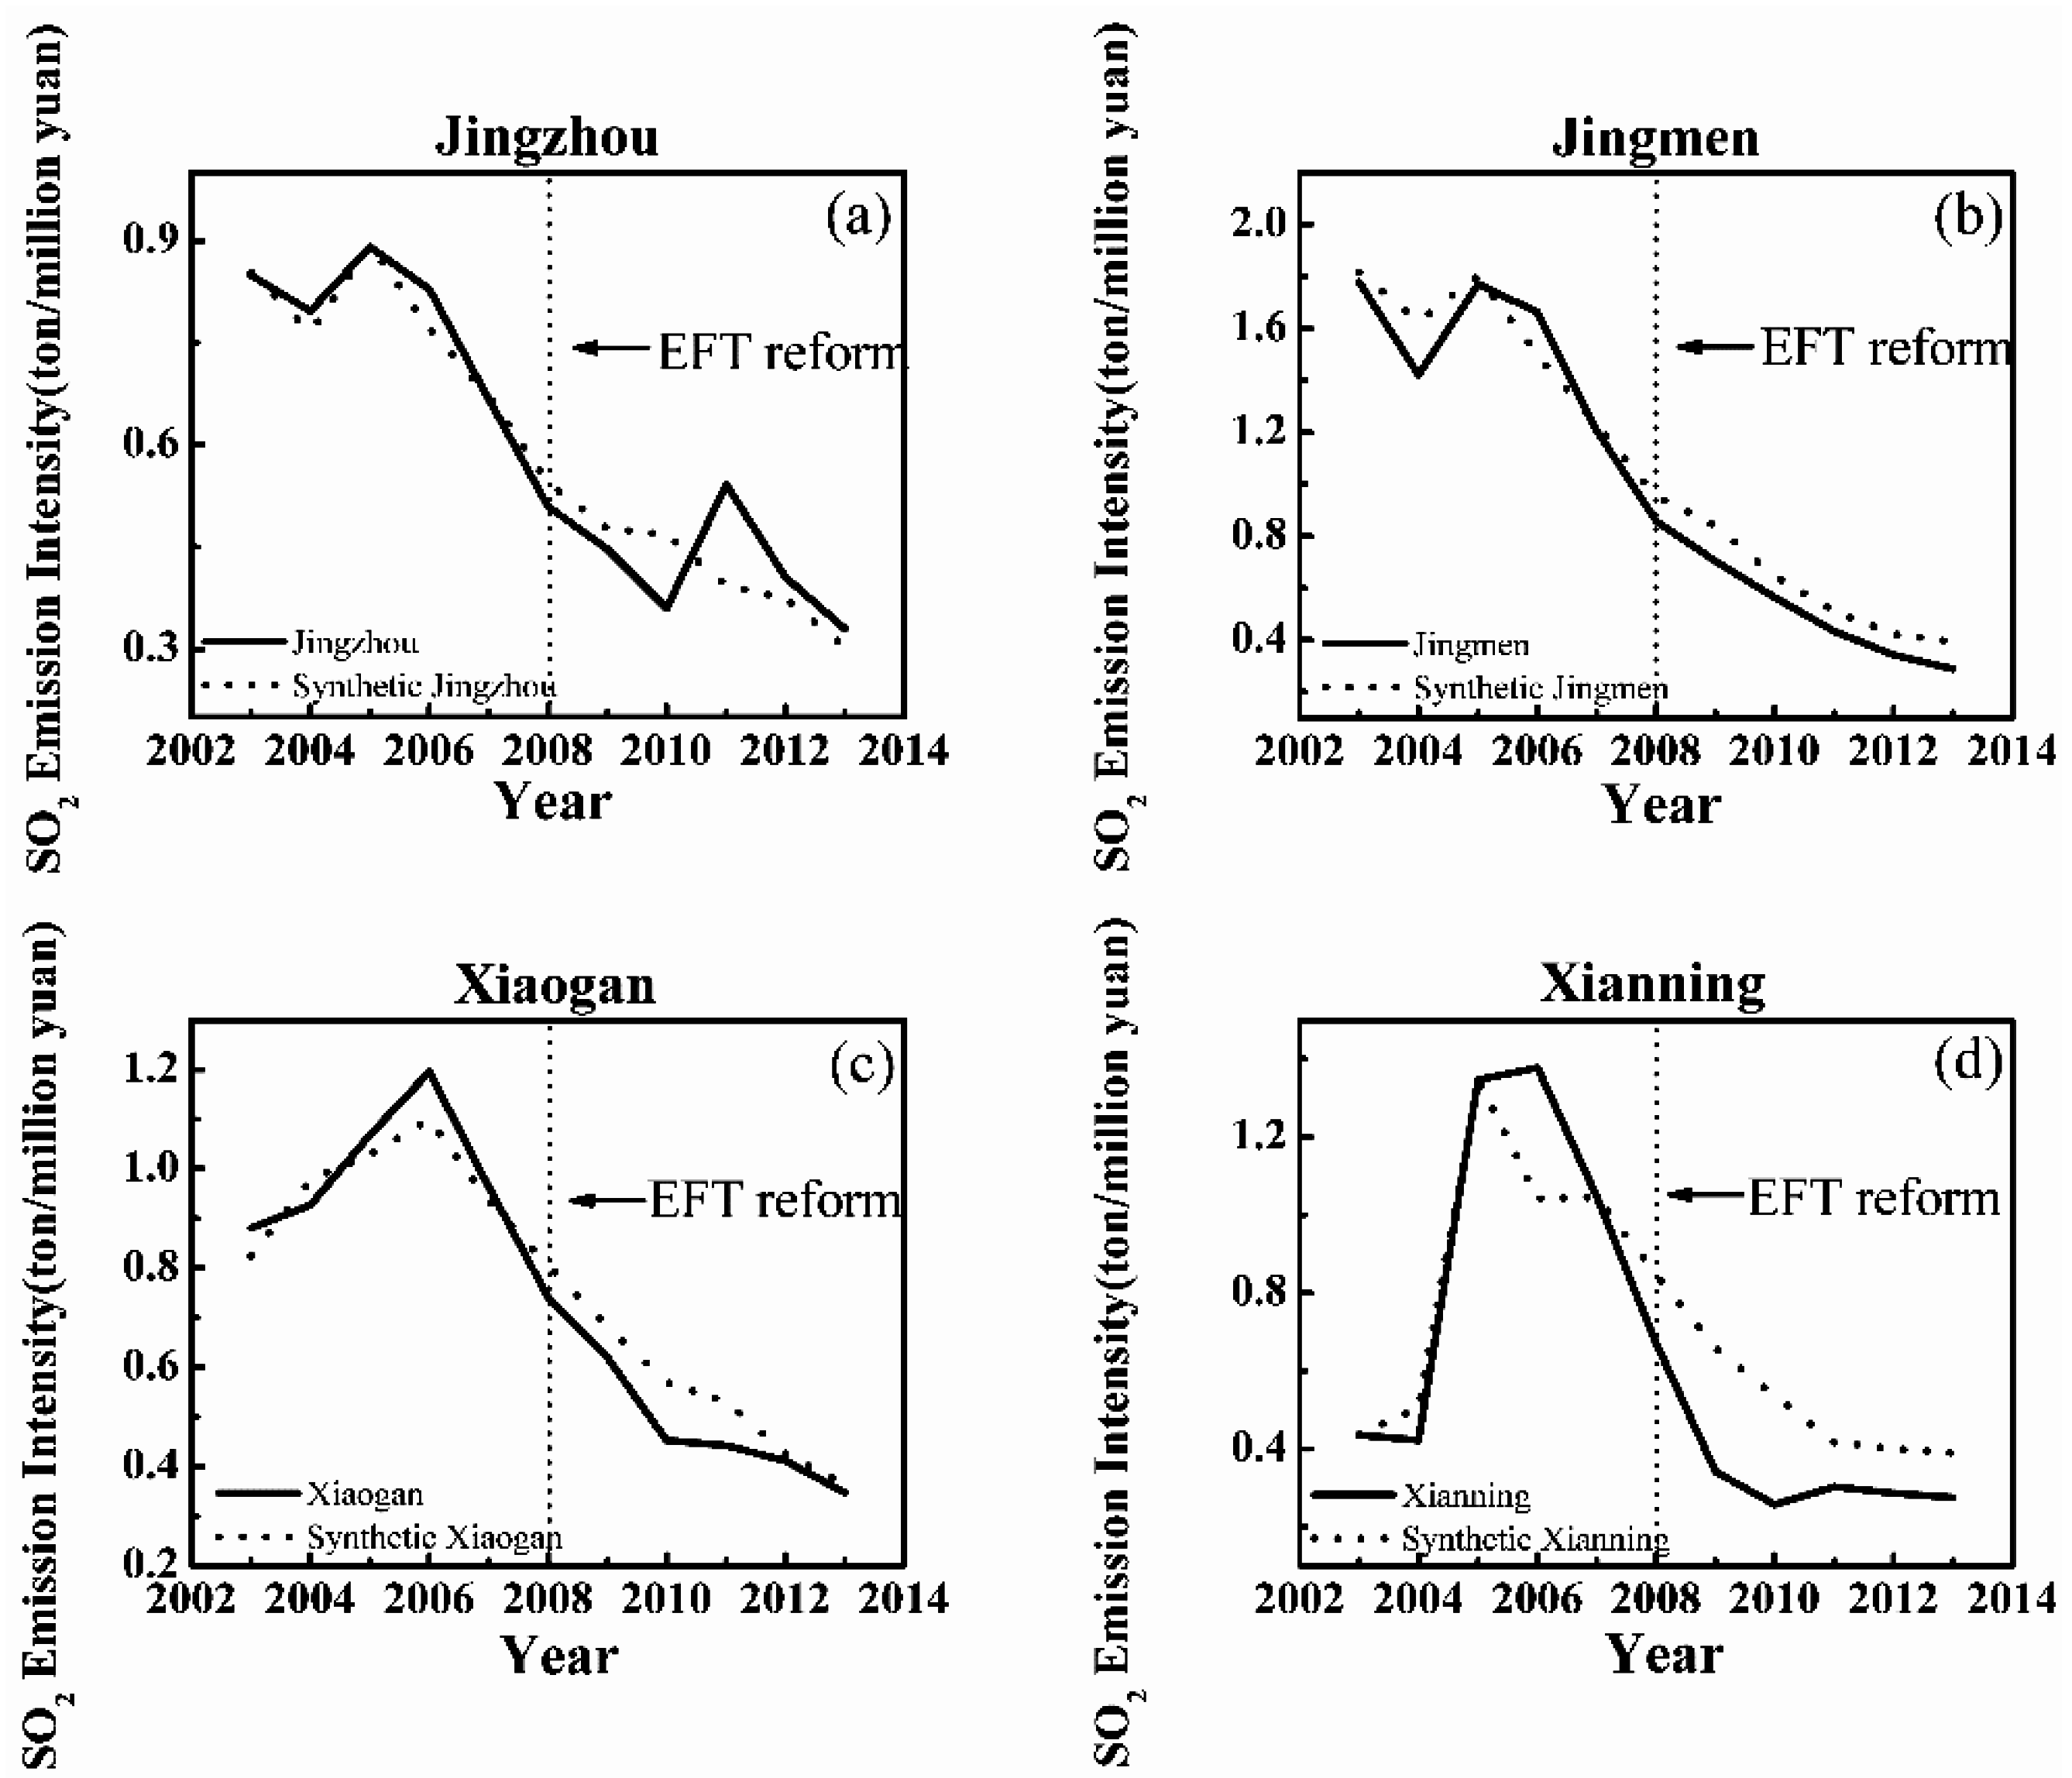
Figure 2). The second group includes Xiaogan, Jingmen, Xianning, and Jingzhou (
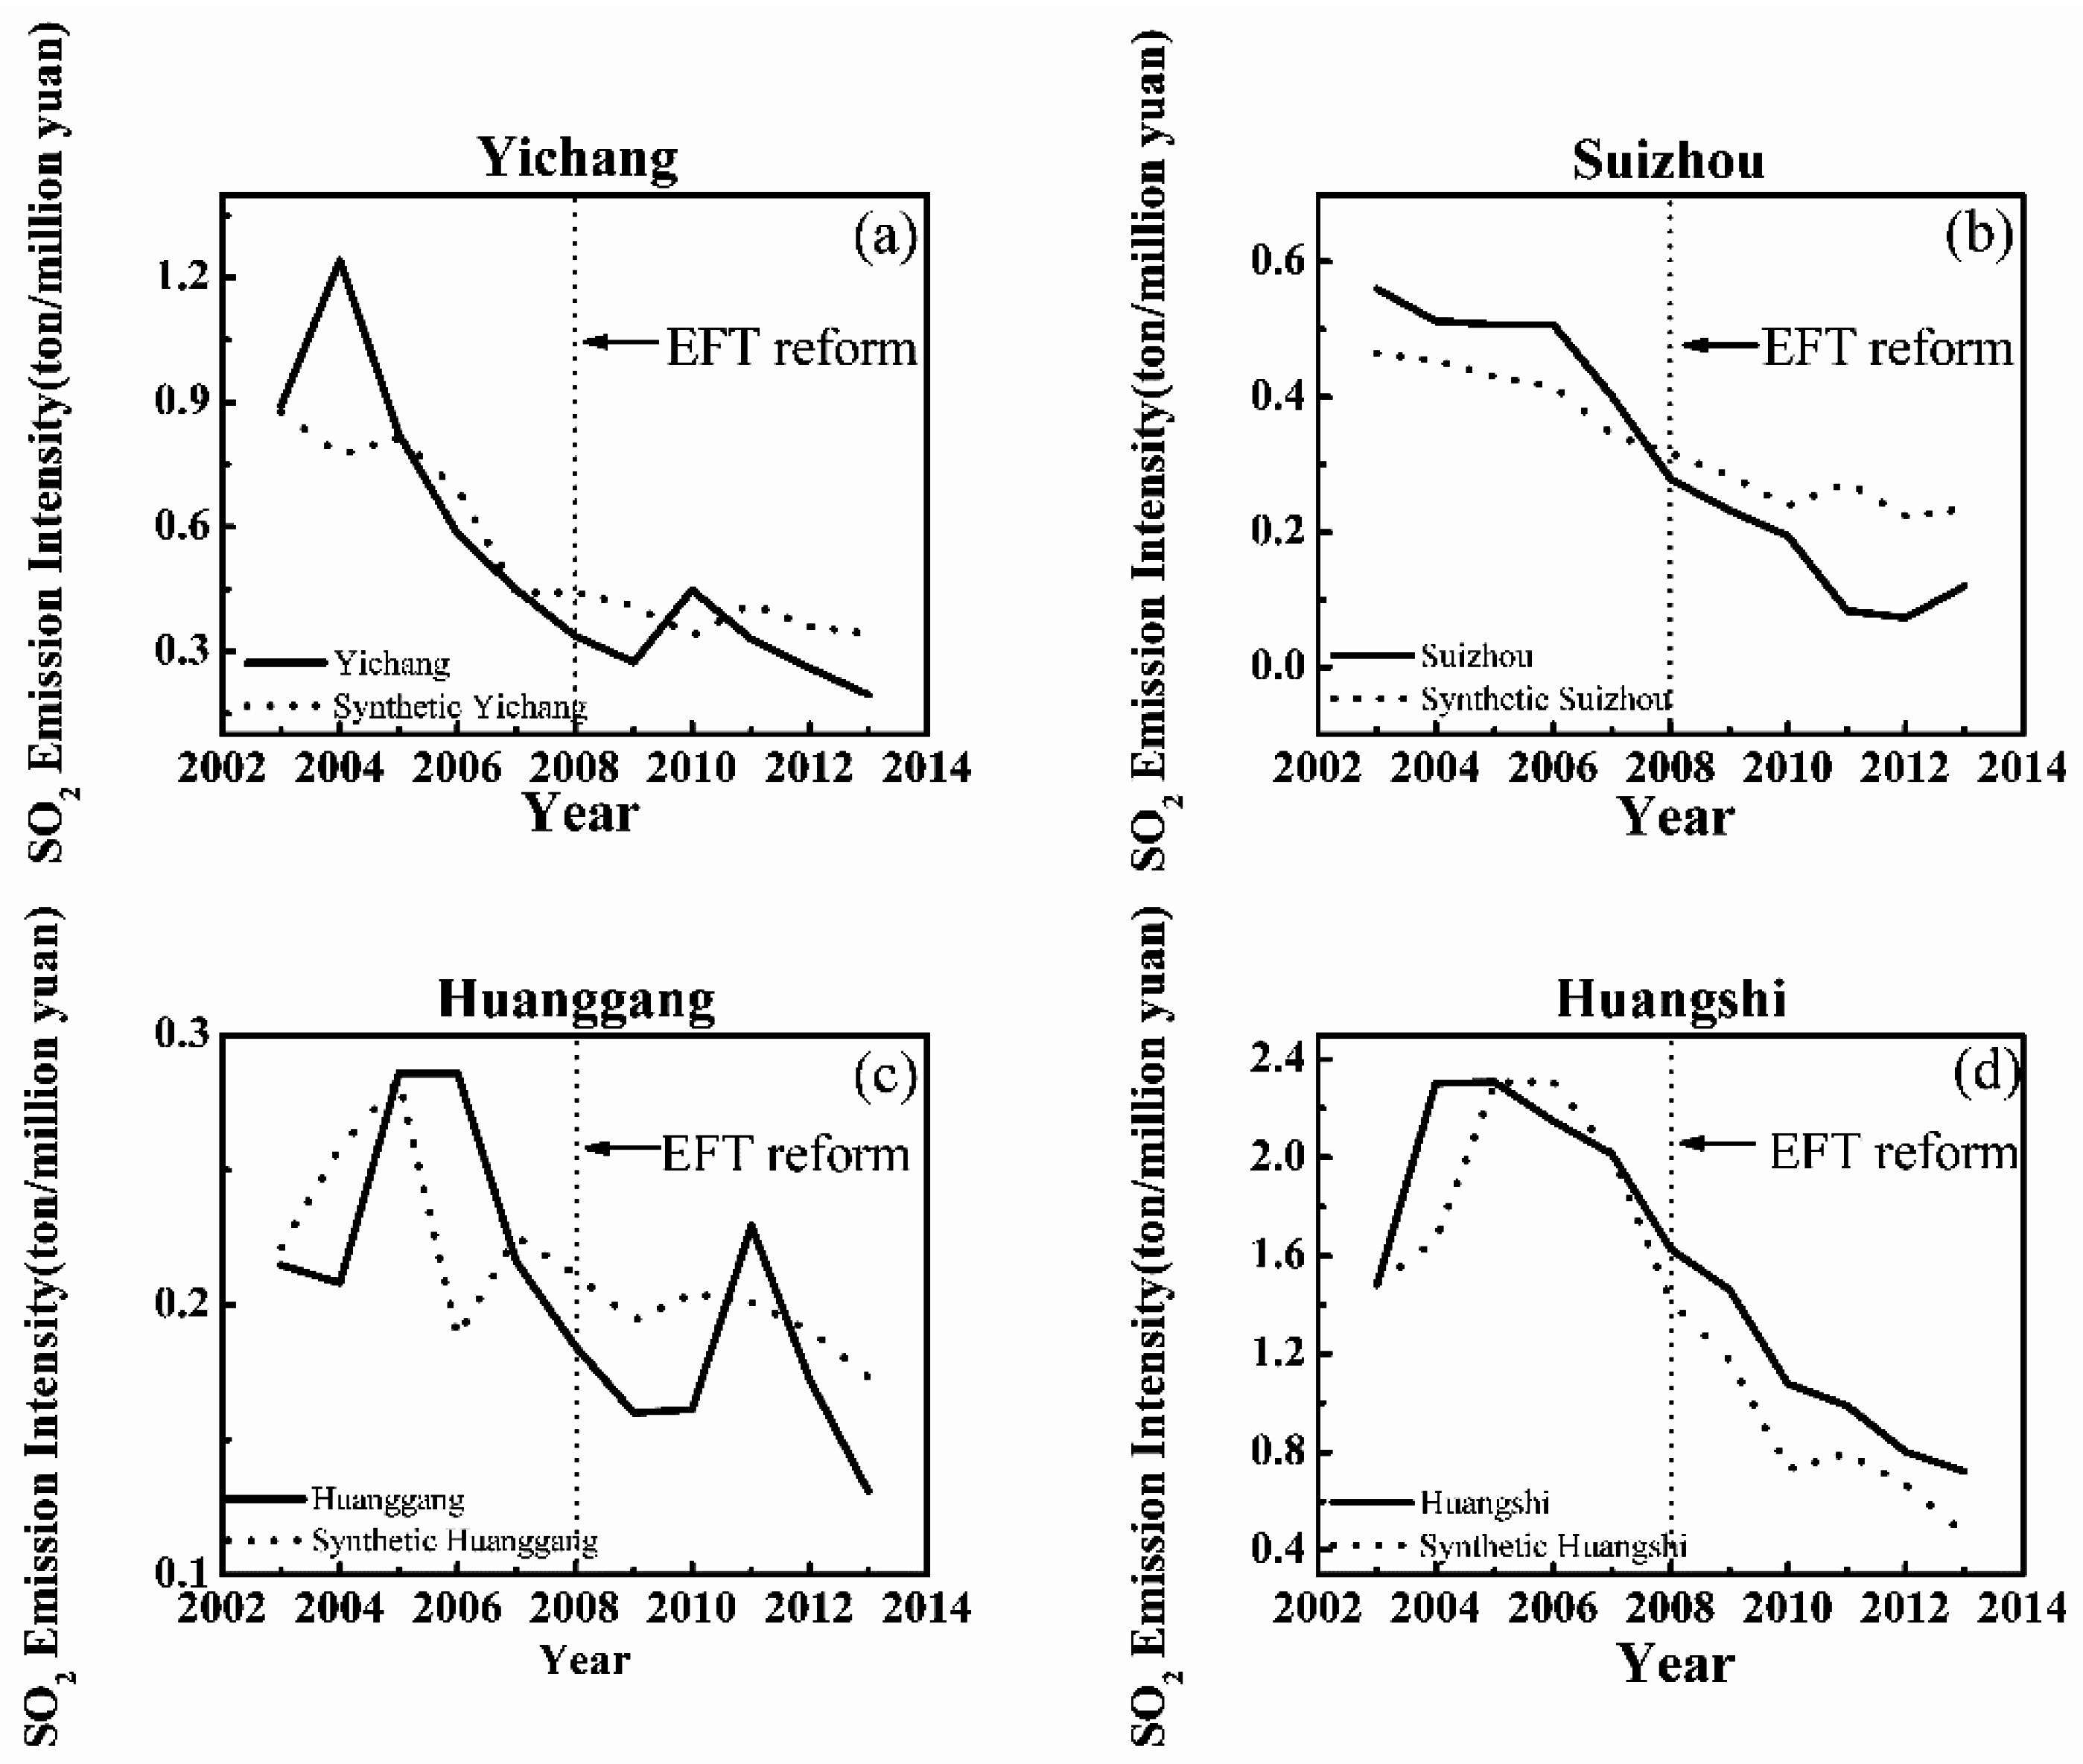
Figure 3), which have obtained good synthetic objects before the reform but show relatively weak effects after that. The third group includes Yichang, Huangshi, Huanggang and Suizhou (
Figure 4) with poor fitting results before the reform.
At the same time, we notice that: (1) SO2 emissions in some cities and their synthetic control cities reached the lowest point in 2010, followed by a slight rebound. The possible reason is that SO2 emissions serve as one of the pollution assessment indicators according to the government’s 11th Five-Year Plan. As a result, the reduction is a mandatory task for local authorities. Since 2010 is the final and the evaluation year of the 11th Five-Year Plan, cities across the country took a variety of measures to cut SO2 emissions, including shutting down high-emission plants. With the lifting of such temporary measures, the intensity of SO2 emissions rebounded in 2011. (2) Not all target cities can find a suitable synthetic control object. Because of the low SO2 emissions, it is difficult to find adequate control cities for Huanggang and Suizhou. As to Huangshi and Yichang, the synthetic control method is unable to reproduce the pre-reform trajectory, making it difficult to determine whether the difference is caused by the EFT reform.
The effect of the EFT reform is evaluated according to the decline in emission of the actual city compared to the synthetic city after the implementation of the policy. The average reductions of the emission intensity of SO
2 in the treated cities from 2008 to 2013 are listed in
Table 4. The average reduction is of 0.11 tons/million Yuan, with an average decline rate of 19.6%. SO
2 emission intensity in Shiyan, Xiangyang and Xianning dropped more relative to the target cities in the past six years, with the average decline rate of over 30%.
4.2. Placebo Studies
To estimate the reliability and validity of the results, and to identify the effect of EFT reform on the reduction of SO
2 emissions, we perform placebo studies as in [
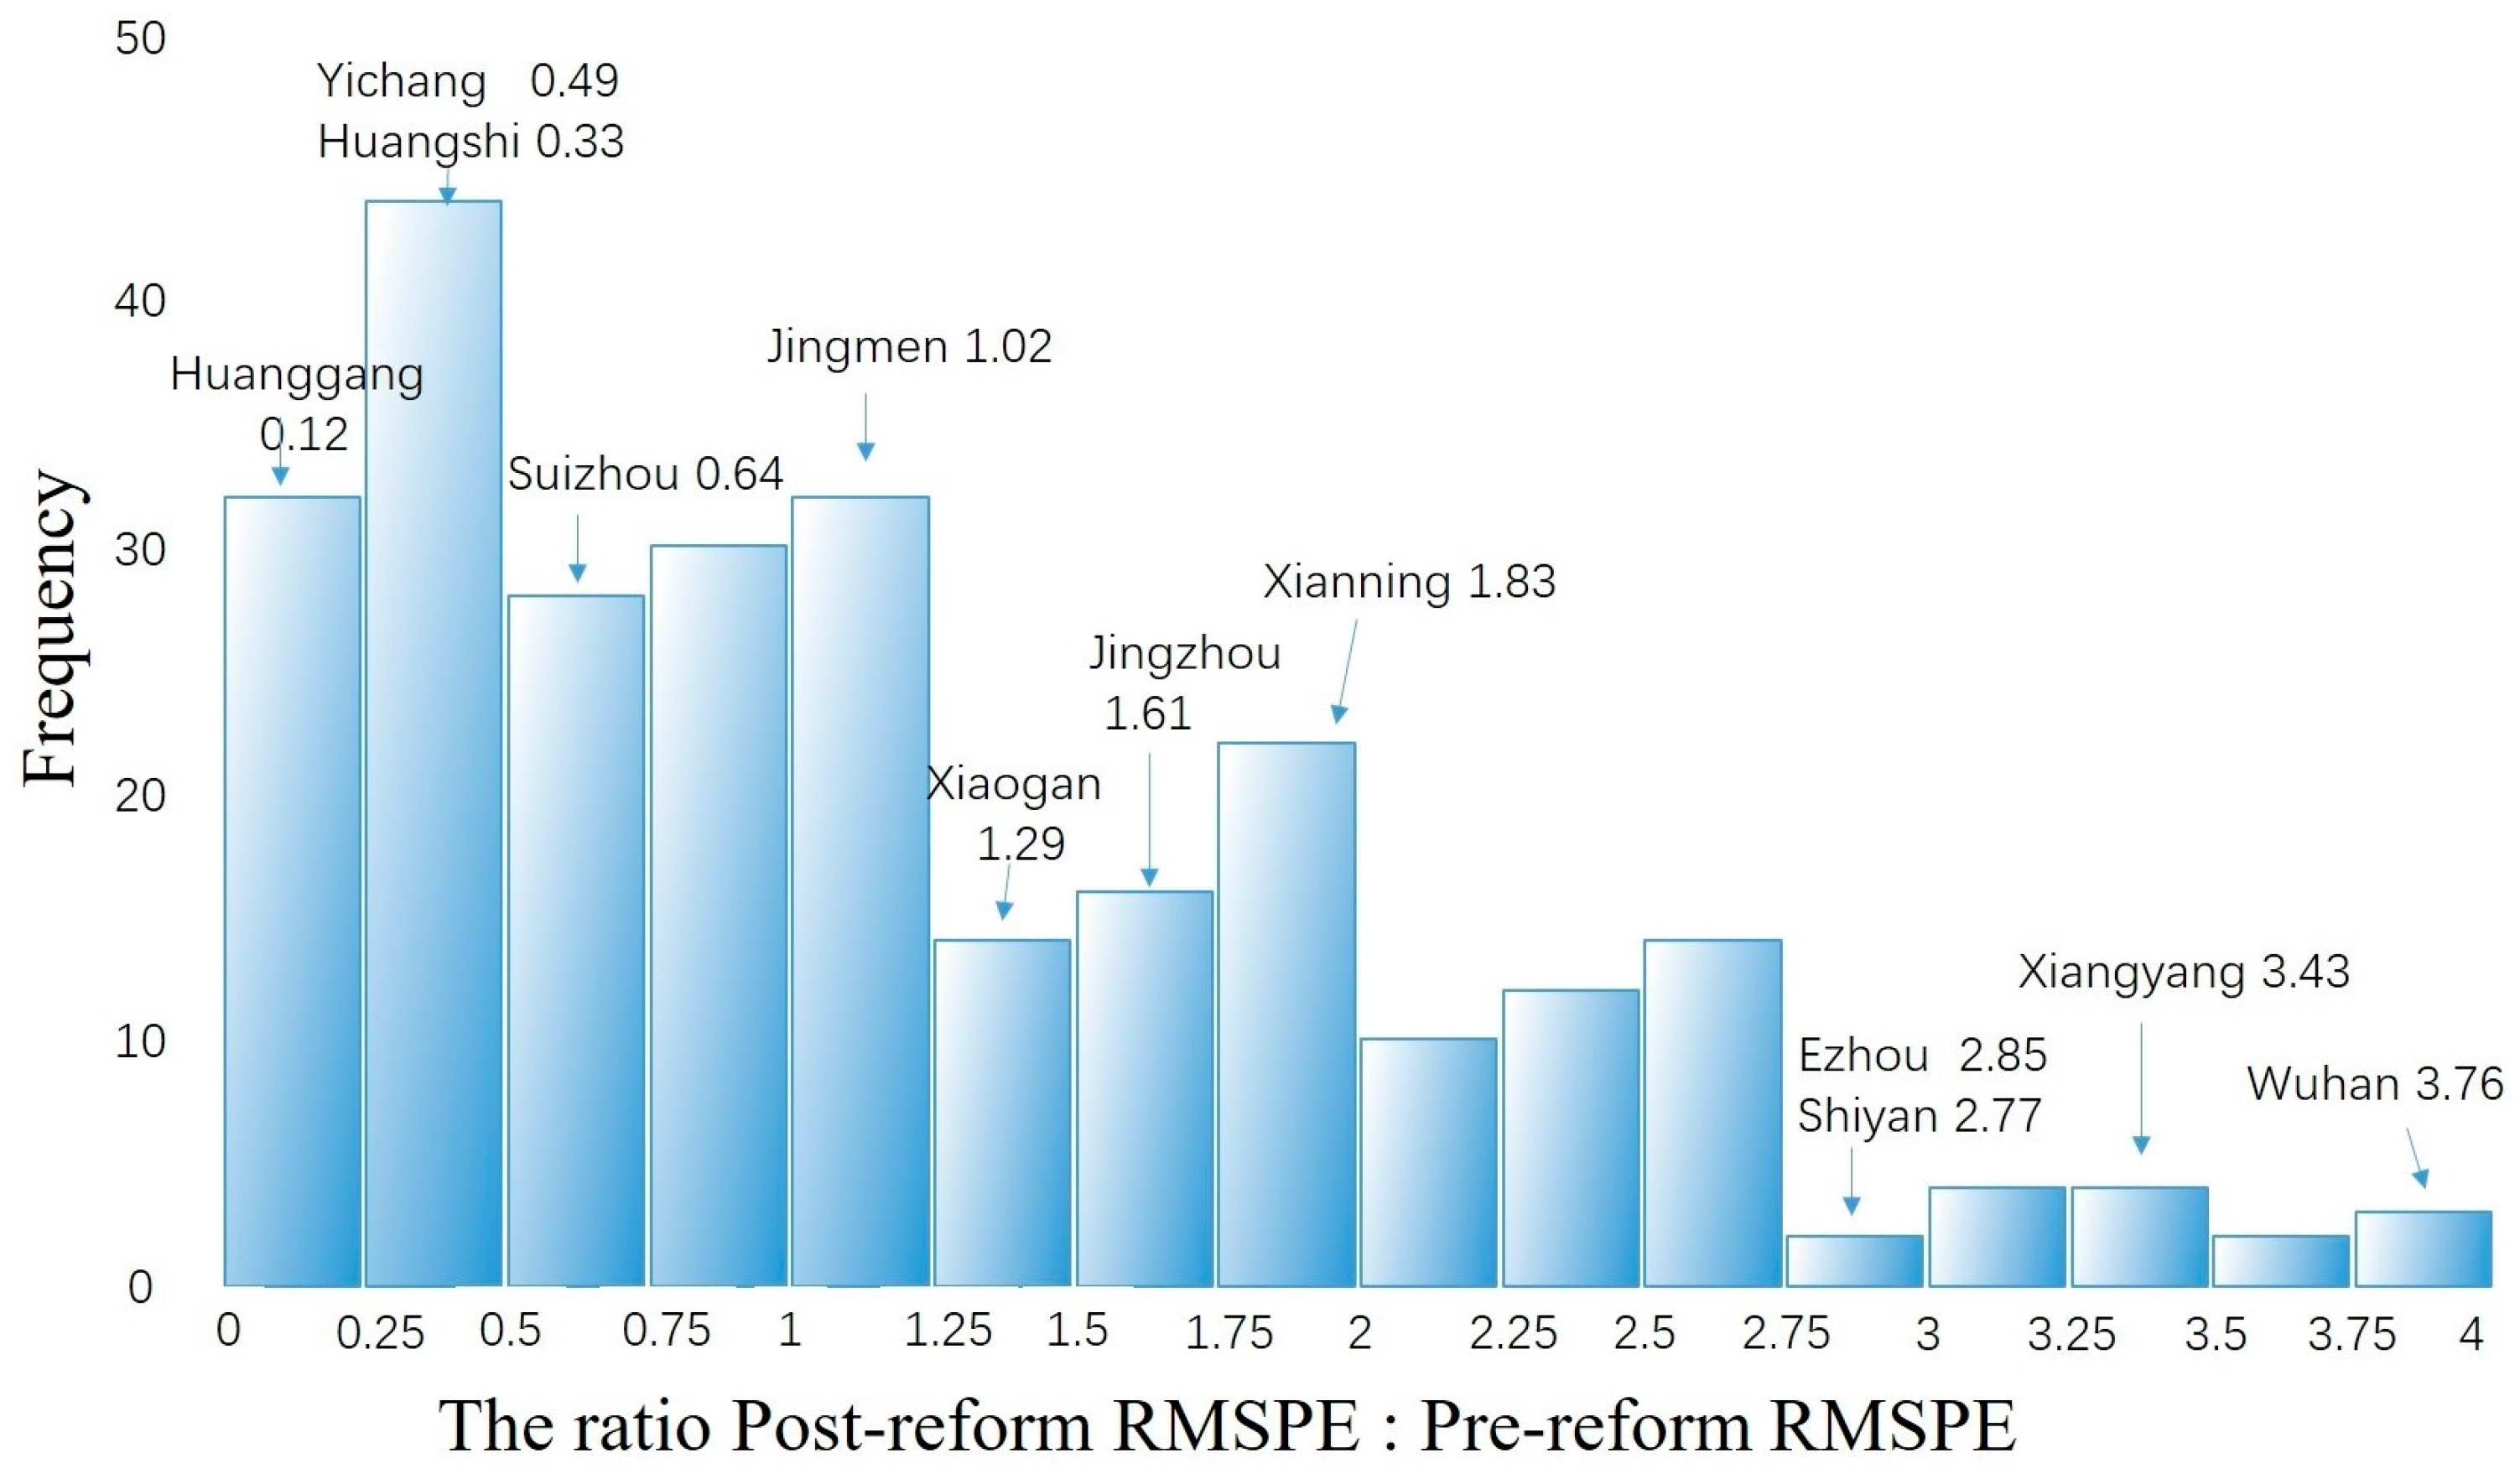
31], where the particular treatment of interest is reassigned in the research data to cities different from pilot cities. Thus, we can acquire synthetic control estimates for cities that did not implement the reform. Applying the idea to each city in the donor pool enables us to compare the assessed effects of the EFT reform on the treatment cities, to the particular distribution of placebo effects obtained from other cities. We will define the effects of the EFT reform significant if the assessed impact on treatment cities is unusually highly related to the particular distribution of placebo effects.
The Root Mean Square Prediction Error (RMSPE, thereafter) [
31] estimates the actual magnitude of the gap in the primary outcome variable of interest between each city and its equivalent synthetic counterpart.
Figure 5 indicates ratio distributions of post-reform RMSPE, the specific equation such as Equation (9), to pre-reform RMSPE, the specific equation such as Equation (10), for the treatment units and for the cities in the donor pool.
where
T is the total periods number;
T0 is the number of pre-reform periods;
T1 is the number of post-reform periods, so
T0 +
T1 =
T; and
is the representation of
(see Equation (5)).
A large numeric post-intervention RMSPE is not indicative of a large main effect of the particular intervention, as if the synthetic control does not rather closely reproduce the primary outcome of interest prior to the particular intervention [
31]. In other words, a large numeric post-reform RMSPE is not generally indicative of a large main effect of the reform if the pre-period RMSPE is also rather large. As for each city, we simply divide the post-reform RMSPE by its pre-reform RMSPE. In
Figure 5, Wuhan obviously stands out as the city with the largest RMSPE ratio. For Wuhan, the post-reform gap is about 3.76 times bigger than the pre-reform gap, which means that the reduction in SO
2 emissions is indeed indicative of the effects of EFT reform.
Results indicate that RMSPE rates of four cities, Wuhan, Xiangyang, Ezhou and Shiyan, are measurably higher than others, which means the EFT reform effects are more workable in these four cities.
4.3. Robustness Evaluation
To examine the sensitivity of the main results, we run a robustness check to the changes in the city weights. Taking Wuhan for example, the synthetic Wuhan is currently constructed by the weighted average of ten cities, namely Shanghai, Beijing, Changsha, Shantou, Haikou, Daqing, Xiangtan, Jiayuguan, Benxi, and Jinzhou, with weights decreasing orderly (
Table 3). Iteratively, we re-estimate our baseline model, to properly construct a synthetic Wuhan that omit in each iteration one of the cities that had a positive weight in
Table 2. The robustness evaluation enables us to estimate to what extent the results are driven by any control city.
Figure 6 shows the results and reproduces itself (solid and dashed black lines), while incorporating the leave-one-out estimates (dot-dashed lines). The figure indicates that the results of the previous statistical analysis are robust to the exclusion of any city of the comparison unit. The leave-one-out estimates of Xiangyang (
Figure 6b), Shiyan (
Figure 6c) and Ezhou (
Figure 6d) also yield good fits, consistent with the conclusions mentioned above, suggesting the synthetic control method is robust to our case study.
4.4. Spatial and Temporal Variation of EFT Effect
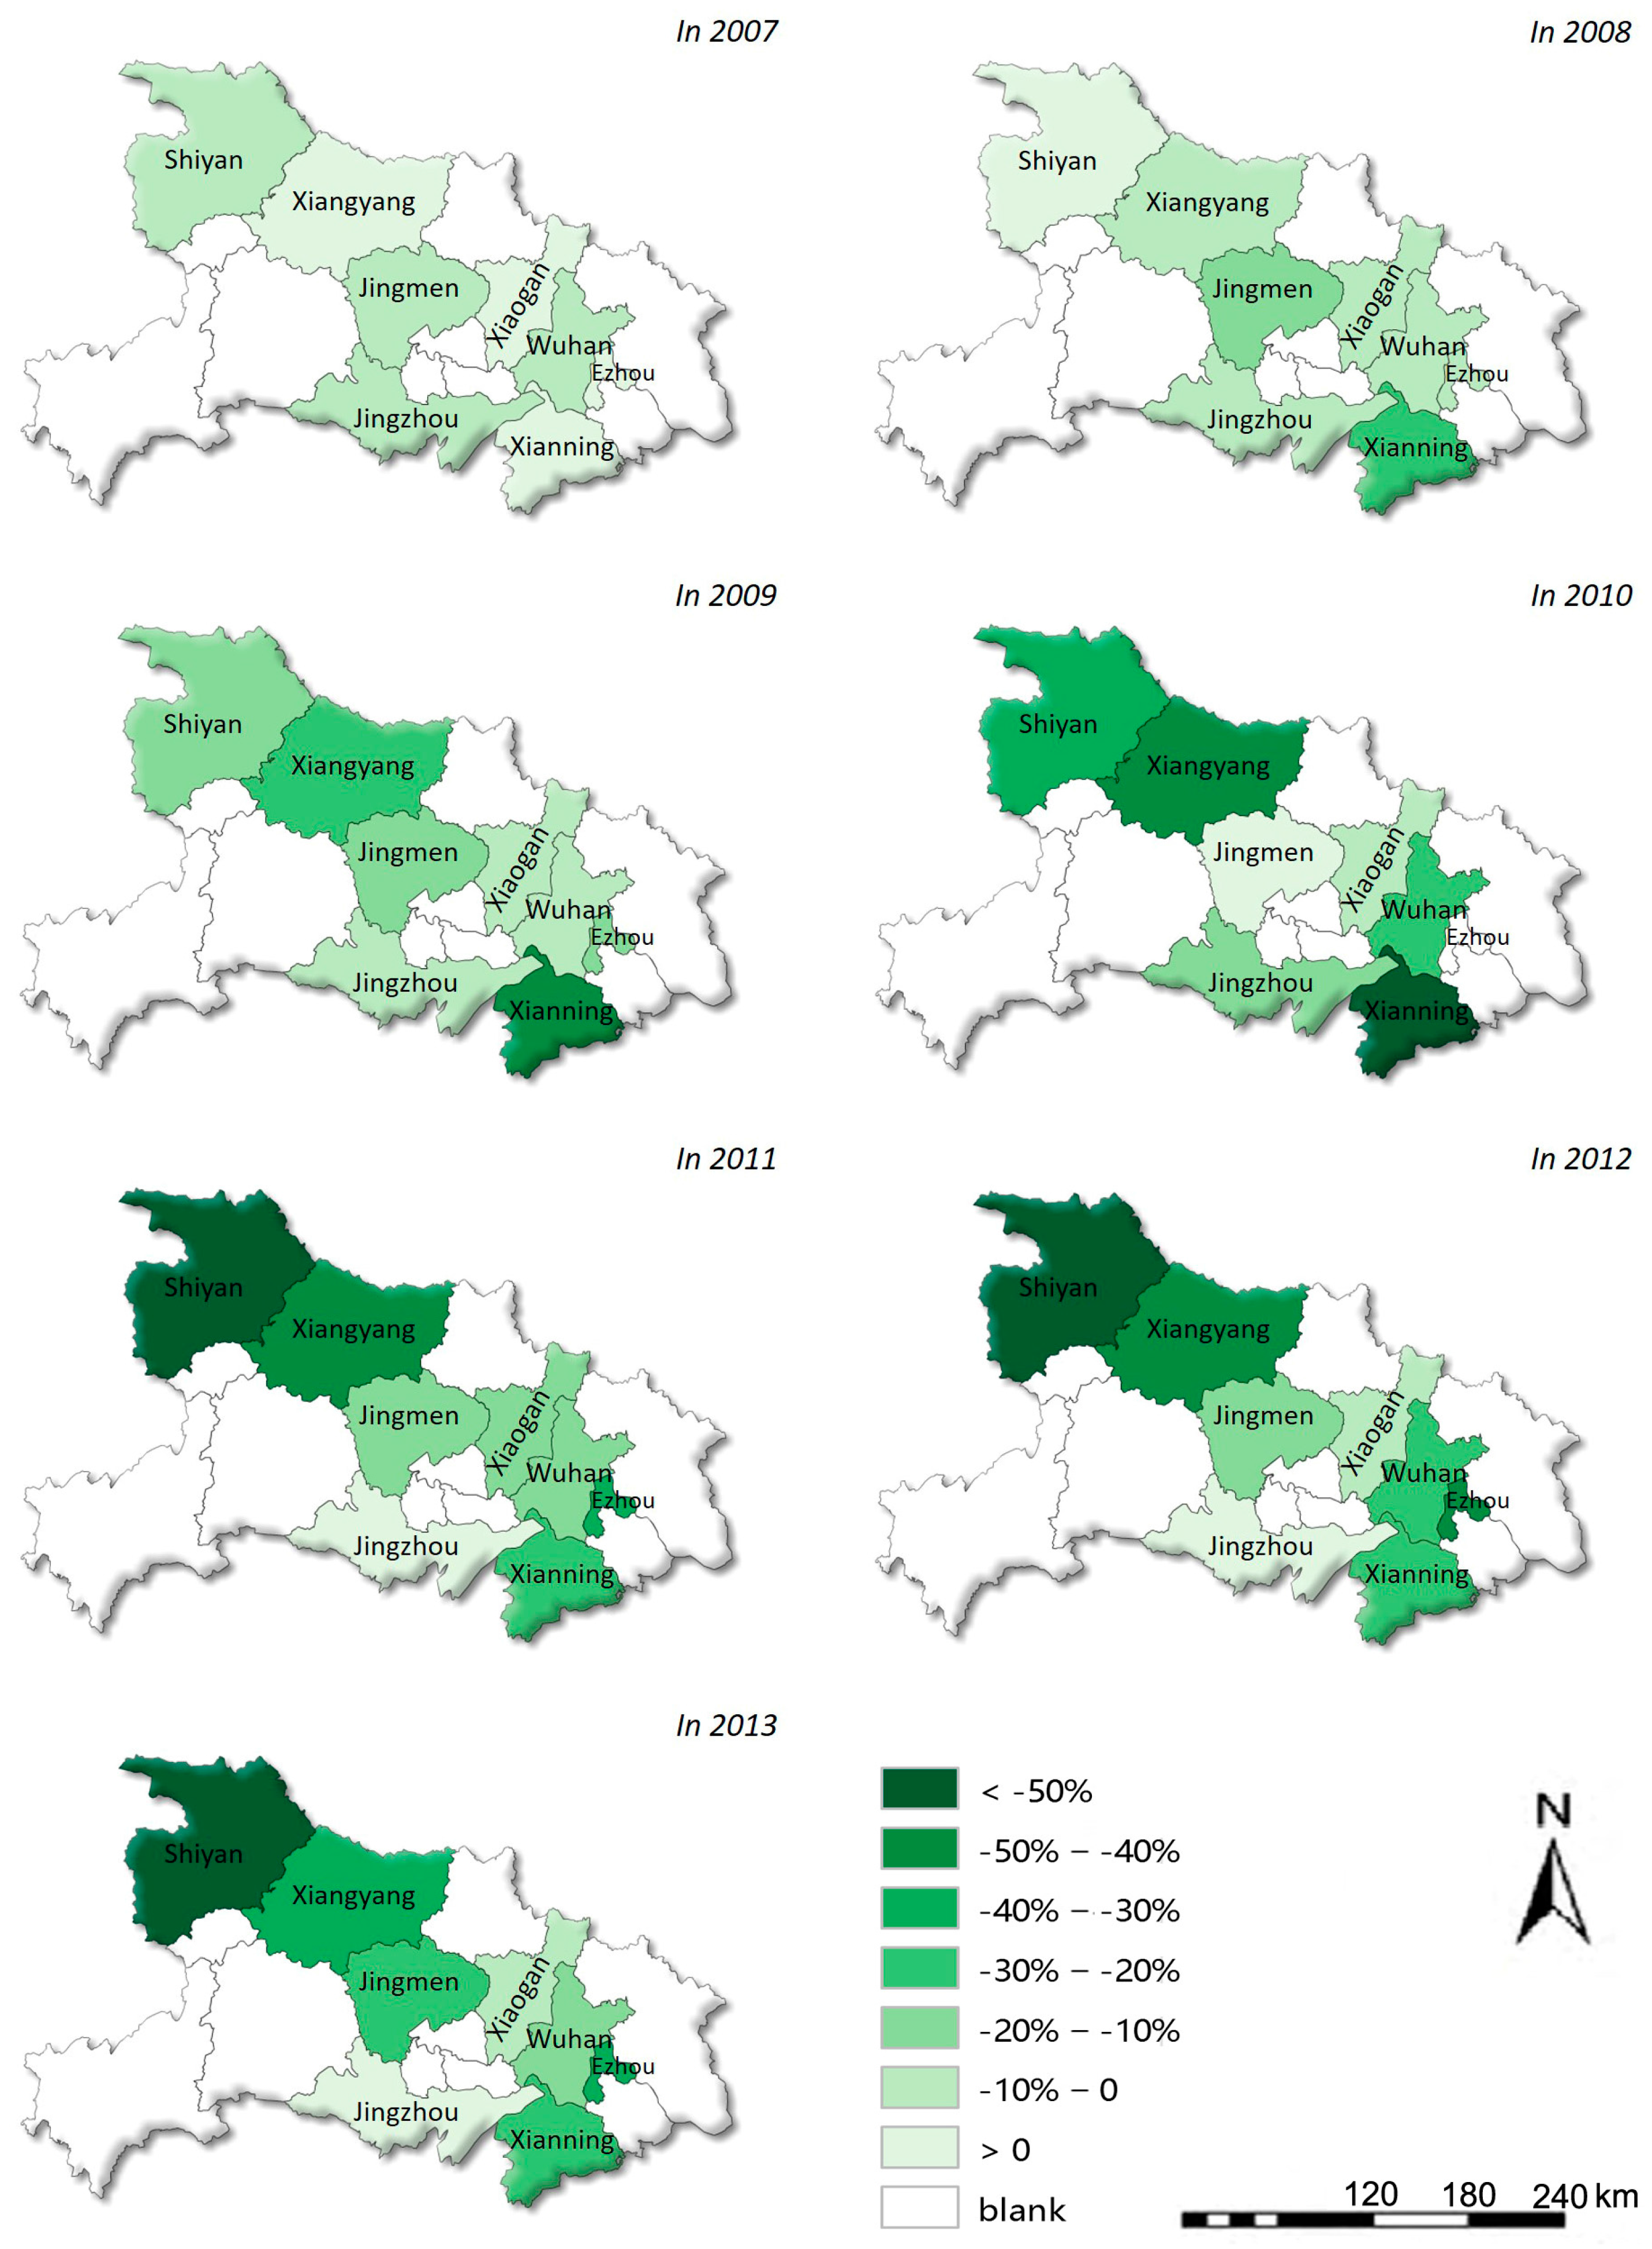
We notice that EFT has a different effect in the different space and time. We use decline rate to estimate the effect of EFT on emission intensity reduction by which the “extra” contribution of EFT policy to the environmental improvements of the target city is measured. The effect of EFT policy is divided into eight grades, less than −50%, −50%–−40%, −40%–−30%, −30%–−20%, −20%–−10%, −10%–0, and more than 0. Accordingly, the spatial variation of emission intensity reduction effect in Hubei Province from 2007 to 2013 is presented (see
Figure 7). From the spatial transfer path of emission intensity reduction effect, it can be seen that the emission intensity reduction ability is embodied as following spatial differentiation and evolution characteristics of three stages.
Start-up Phase (2007–2009): Hubei Province’s EFT had an effect on enhancing the capacity of emission intensity reductions; this shows characteristics of diffusion from the Wuhan metropolitan circle and Western Hubei region. Since 2007, EFT policy started in Hubei Province, the emission intensity reduction effect of pilot cities and synthetic control is close to 0. In 2008 Wuhan metropolitan circle and Western Hubei region took on significant governance effect, among them, the emission intensity of Xianning reached −20.9%, and the emission intensity of Shiyan reached to −19.5%. In 2009, Xianning further enhanced to −48.2%, and the emission intensity difference of Xiangyang located in Western Hubei region also reached −20.2%.
Mature Stage (2010–2012): Since 2010, the effect of EFT on pollution emission intensity reductions in the most of pilot cities in Hubei Province has been significantly improved, and Wuhan metropolitan circle and Western Hubei region have showed “double” spatial agglomeration effect and obvious regional spillover effect. The emission intensity reduction strength of Wuhan and Xiangyang, the two major urban centers in Hubei Province, reached −28.7% and −43.9%. Xiaogan in Wuhan metropolitan circle, and Shiyan and Jingzhou in Western Hubei region reached −52%, −30% and −23%, respectively, and Xianning in Wuhan metropolitan circle even reached −52%. Hence, we can draw the conclusion that, after EFT policy has been implemented for 2–3 years, its effect on regional environmental governance is generally substantively improved. During 2011 and 2012, the effect of emission intensity reduction policy continued to enlarge, and Western Hubei region became a center of emission intensity reductions instead of Wuhan metropolitan circle. Xiangyang continued to maintain a high ratio of −40%, and moreover Shiyan in Western Hubei region even reached −53% and −57.4%, a high ratio of “extra” effect, correspondingly, only Ezhou in the Wuhan metropolitan circle reached −30.7% and −40.8%, and Xianning reached −27.2% and −28.6%, respectively.
Continuous Phase (2013): After a rapid increase of 2010–2012 pollution emission intensity reductions, the effect of reductions in the pilot cities of Hubei Province began to enter the stationary phase. In 2013, Xiangyang, the center city in Western Hubei region, remained a high level of −30%, Shiyan continued to maintain an extremely high “extra” effect of −57.8%, and Jingmen and Xianning in Wuhan metropolitan circle reached a high level of −26.6% and −29.2%, respectively. For the rest of cities, the effect of reductions kept balanced or declined slightly; this shows those cities have sustained substantial emission intensity reduction effect compared with synthetic control cities without the implementation of EFT.
4.5. Results of Enterprise Interview
Based on 27 enterprises interview in Hubei Province, this study shows that all enterprises claimed that, after EFT, the environmental protection departments have strengthened their supervision, increasing the cost of the overall environment. After EFT, many environmental protection departments have increased the frequency and scope of on-site supervision. The initiative has a significant impact on enterprises and directly effects enterprises’ emissions. We find that, through the comparison between enterprises of different cities, in the region where there is a more adequate financial security or the city where the local economy is relatively developed, the supervision is more powerful; this is consistent with the survey results of the Environmental Planning Institute.
At the same time, the study shows that the open information of pollutant discharge fees has enhanced the justice and transparent of fees collection, not only making the enterprises realize the seriousness and righteousness to pay the pollutant discharge fees, but also making the public understand the situation of enterprise pollution to strengthen the pressure of public opinion. Open mechanism is relatively good in such areas as Ezhou, Wuhan, Xiangyang and Shiyan, where the effect is obvious.
Additionally, EFT got rid of a lot of intervention from local government to the collection of pollutant discharge fees. Taking Xianning as an example, the local tax authorities abolished the local government's own policy on the reduction of pollutant discharge fees, improving the environmental tax levy rate, and thus promoting the reduction of pollutants.
From the perspective of enterprise behavior, most enterprises reduced emissions by means of the replacement of fuel, such as natural gas instead of coal fuel, sewage equipment purchase, technology research and development, unified treatment of pollutants in the industrial park. Some enterprises relocated to other regions or shut down, reflecting the truth that they could not afford to increase the cost of environmental tax after EFT.
Interview results show that different scale enterprises adopt different coping mechanisms after the implementation of EFT policy. Listing corporations and large enterprises strengthened their pollution control and increased their investment in environmental protection and facilities, and tried for more environmental subsidies from the government. Some medium-sized enterprises were required by the local government to move into a special industrial park and take a unified approach to pollutant emission intensity reductions. A large number of small enterprises, which were unable to carry out the improvement of facilities, are still a direct part of the pollution and they will face closure.
6. Conclusions
The EFT reform is an important measure for the Chinese government to deal with environmental problems along with the economic development. The policy experiences derived from the pilot cities are of great implications to improve the environmental protection tax system. For the first time, this study quantitatively assesses the impact of Hubei Province’s environmental tax reform on SO2 emissions. By creating a synthetic control city for every pilot city, this study simulates the pollutant trend under a scenario with no EFT reform for each target city, which allows us to assess the actual impact of pollution intensity.
Built on top of the previous work, our research presents the following contributions:
First, the machine learning theory is suggested to be a novel application in the policy evaluation area. Compared with the traditional DIDS method, the Synthetic control method can provide a flexibility to evaluate the model on both big and small size of samples without considering the control group selection and policy endogenesis problems.
Second, the results demonstrate that the EFT reform can effectively restrain pollutant discharges, but the effects vary with regional heterogeneity. In cities with higher administrative and economic development levels, the policy has been implemented more efficiently. For example, in the four cities of Wuhan, Xiangyang, Ezhou and Shiyan, the intensity of SO2 emissions decreased significantly after the EFT reform. While other pilot cities show similar trends, the results are not statistically significant. The findings indicate that nationwide promotion of the environmental tax reform may show a wave-like progressive trend from more developed regions compared to less developed regions.
Third, EFT reform is found to benefit the global environmental tax reform.
Based on our results, we propose the following suggestions for the implementation of China’s Environmental Protection Tax Law:
The first is to take the regional heterogeneity issue into consideration during the nationwide implementation process. To improve China's environment overall, we should not only focus on the environmental policies implementation in more developed cities, but also improve the administrative capacity and incentives of the environmental protection agencies in underdeveloped areas.
The second is to enhance information openness and promote public participation. The cooperation among different departments is necessary. In addition, the pollution fee of different companies can be published by the media and Internet to draw public attention in monitoring environment pollution.
The third is to improve and optimize the environment monitoring system and build information sharing platform. The automatic online monitoring system, which is currently only available in big cities, should also be expanded to small cities to improve its spatial coverage and information sharing.


