Article

Remediation in Situ of Hydrocarbons by Combined Treatment in a Contaminated Alluvial Soil due to an Accidental Spill of LNAPL

1
School of Engineering, University of Basilicata, Viale dell’Ateneo Lucano 10, I-85100 Potenza, Italy
2
Department of Science and High Technology, University of Insubria, Via G.B. Vico 46, I-21100 Varese, Italy
3
Department of Civil, Environmental and Mechanical Engineering, University of Trento, Via Mesiano 77, I-38123 Trento, Italy
4
Department of Biotechnologies and Life Sciences, University of Insubria, Via G.B. Vico 46, I-21100 Varese, Italy
*
Author to whom correspondence should be addressed.
Sustainability 2016, 8(11), 1086; https://doi.org/10.3390/su8111086
Submission received: 2 May 2016 / Revised: 23 September 2016 / Accepted: 15 October 2016 / Published: 25 October 2016

Abstract

:
Soil contamination represents an environmental issue which has become extremely important in the last decades due to the diffusion of industrial activities. Accidents during transport of dangerous materials and fuels may cause severe pollution. The present paper describes the criteria of the actions which were operated to remediate the potential risk and observed negative effects on groundwater and soil originating from an accidental spill of diesel fuel from a tank truck. With the aim to evaluate the quality of the involved environmental matrices in the “emergency” phase, in the following “safety” operation and during the remediation action, a specific survey on hydrocarbons, light and heavy, was carried out in the sand deposits soil. Elaboration of collected data allows us to observe the movement of pollutants in the unsaturated soil. The remediation action was finalized to improve the groundwater and soil quality. The former was treated by a so called “pump and treat” system coupled with air sparging. A train of three different technologies was applied to the unsaturated soil in a sequential process: soil vapour extraction, bioventing and enhanced bioremediation. Results showed that the application of sequential remediation treatments allowed us to obtain a state of quality in unsaturated soil and groundwater as required by Italian law.

1. Introduction

Handling, storage or transfer of oil substances, following accidental spills, can cause release of fuels and oils, petrol (gasoline), diesel, heating oils and jet fuel (kerosene).
These substances are hydrophobic liquid organic chemicals immiscible with water. When discharged, they may occur in soils in different forms, mainly in a liquid phase, and contaminants may dissolve in water according to their solubility. They may be present as an individual phase, in an immiscible phase and contaminants, generally known as NAPL, Non-Aqueous Phase Liquid. Other forms are a gas phase in which contaminants may volatilize, and as a solid phase the contaminants may adsorb onto solid particles [1,2,3].
NAPL constituents may partition or move from one phase to another depending on environmental conditions: the tendency for a contaminant to associate to one phase or another may be examined by empirical partition coefficients dependent on the properties of the pollutant and the subsurface materials [4,5,6]. NAPLs can be divided into two groups according to their density: denser than water, dense non-aqueous phase liquids (DNAPLs) and less dense than water, light non-aqueous phase liquids (LNAPLs). LNAPLs migrate through the unsaturated zone where they can be trapped in pore spaces by capillary forces as “immobile residuals” and, if subjected to an adequate driving head, they can permeate to the water table and the “capillary fringe”, where assume a typical “pancake” shape, a free-phase layer distributed across the water table capillary fringe interface. The migration into the deeper geological strata encounters resistance due to both increasing water content and associated buoyancy forces.
Lateral spread of LNAPLs near the water table, mainly in the direction of the groundwater flow, depends on the subsurface geology, on the size of the release, and on the physical-chemical properties of the compound; the flow of water in contact with LNAPLs can take in solution the soluble compounds of the mixture, forming a plume that develops in the flow direction.
Residual NAPL potentially provides a long-term source for Hydrocarbon species, such as benzene and recognised carcinogens, which are mobile when dissolved in groundwater.
In the case of pollution events, actions must be evaluated and planned for removal and control of potential risk in soil and groundwater originating from NAPLs [7,8,9,10].
Figure 1 shows the main guidelines for activity pollution control in contaminated sites.
Once the state of pollution is determined, technologies have to be applied for the treatment of soils and groundwater. The main applied technologies are: air sparging, soil vapour extraction, pumping remediation, enhanced bioremediation and microbial uptake and “pump and treat” system [7,8,9,10,11,12,13,14,15].
The present paper examines a case study of an accidental spill of diesel fuel from a tank truck that affected the soil in alluvial sediments along surface watercourses. In such a case, the environment of incoherent sediments seems to be the most relevant because of the possible occurrence of the interaction with pollutants. A complete understanding of the pollutant diffusion process in water and sediments environment requires theoretical studies, use of computational modelling and laboratory experiments. During an “emergency” phase following an accidental event in real scale and the following remediation, planning a satisfactory methodological activity to collect data on pollutant behaviour in natural systems is not generally feasible. In the present case, the main environmental impact of the spill was evaluated by characterization of hydrocarbons in soil and groundwater along the different phase and remediation actions.

2. Materials and Methods

2.1. The Case Study

Approximately 15 m3 of diesel fuel, equal to about 12,533 kg, were dispersed from a tank truck over the road S.P. 34 in the area of Treviso (Northern Italy).
Immediately after the accidental spill occurred, local administration recommended the inhabitants not to use water from shallow groundwater, such as artesian wells and fountains, within a radius of three kilometres from the site of the accident.
Measures for “emergency” and “safety” of contaminated site were carried out in order to avoid or to reduce the migration of the contaminated plume towards other environmental matrices.
Among them, the following:
(1)
laying of an absorbing barrier and diesel recovery from the soil near the roadway;
(2)
capping in polyethylene to preserve the contaminated area from meteoric events;
(3)
removal of the most contaminated soil and its temporary storage in a waste storage area;
(4)
the dedicated area.
A “Pump and Treat” system was implemented as “emergency” and “safety” measure procedure to prevent the downward migration of contaminated groundwater. In order to avoid or to reduce the “tailing and rebound” effect, the system was coupled with an air sparging remediation technique. Water was then extracted from four wells and treated by stripping and filtering with activated carbon, by preliminarily removing course and raw solids by settling. The treated water was then discharged, through another well, into the same geological unit.
In order to achieve the prescribed quality in soil by the current national law, a clean-up strategy was defined and based on the application of three different technologies to the unsaturated soil in a sequential manner, advancing step by step: soil vapour extraction (SVE) (Figure 2), bioventing (BV) and enhanced bioremediation (EB). This solution was adopted because the equipment and facilities that are used are very similar and can be arranged to work in different operational phases.

The Contaminated Site

The area has important and quite shallow reserves of drinking water. The hydrogeological unit is represented by high permeability deposits, with a main groundwater flow direction from West to East.
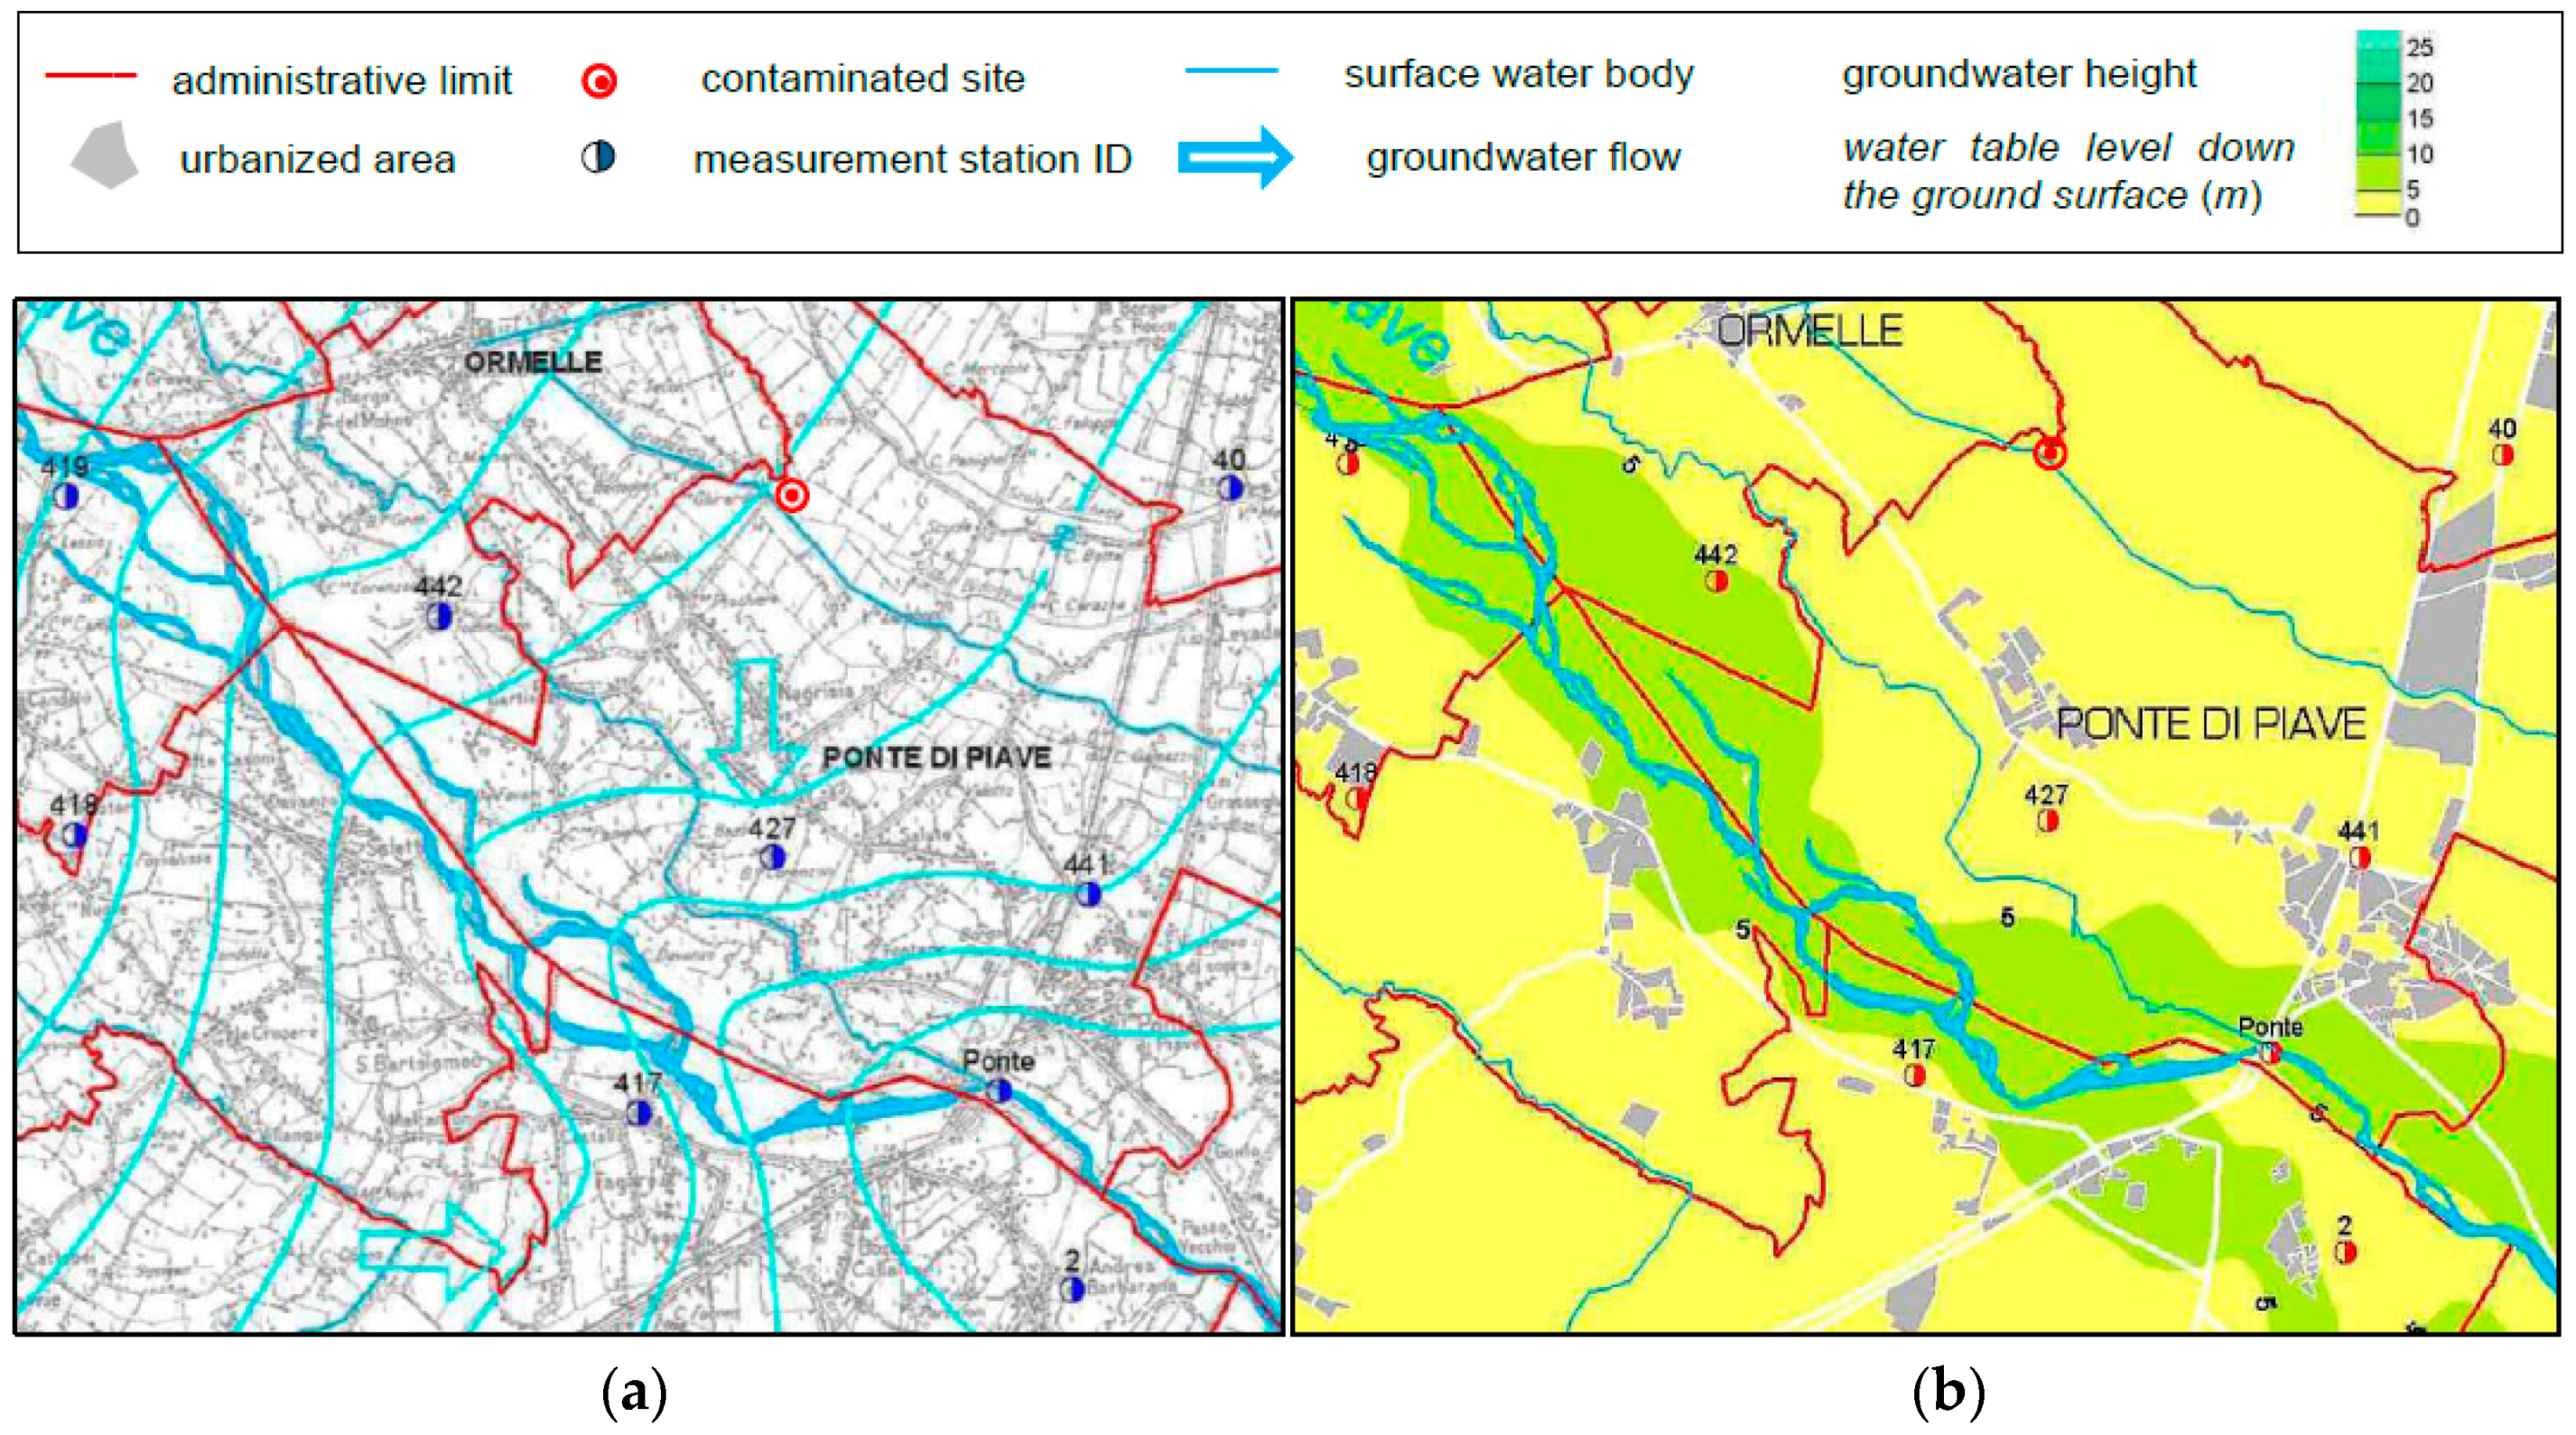
The geological and hydrogeological characteristics of the area subject to the pollution were determined by the literature analysis [16] and field observations. The analysed area lies within sand deposits characterized by an important gravel skeleton: from the top to the bottom, it is possible to meet a short layer of natural coverage land, followed by sand layer and gravel in a sand matrix and grey clay at a depth of 12 m from the ground surface. The hydrogeological map at local scale is reported in Figure 3.

2.2. Sampling and Analysis

Different analytical investigations were performed to analyse water and soils samples:
(1)
evaluating the state and the extent of contamination in soil and groundwater (perimeter of the contaminated area);
(2)
collecting data on geo-morphology and groundwater;
(3)
defining the contamination level and the law limit concentrations;
(4)
determining the efficacy of the remediation technologies of groundwater and soil.
The choice of number and location of the sampling points was established on the basis of site morphology and hydrogeological characteristics.
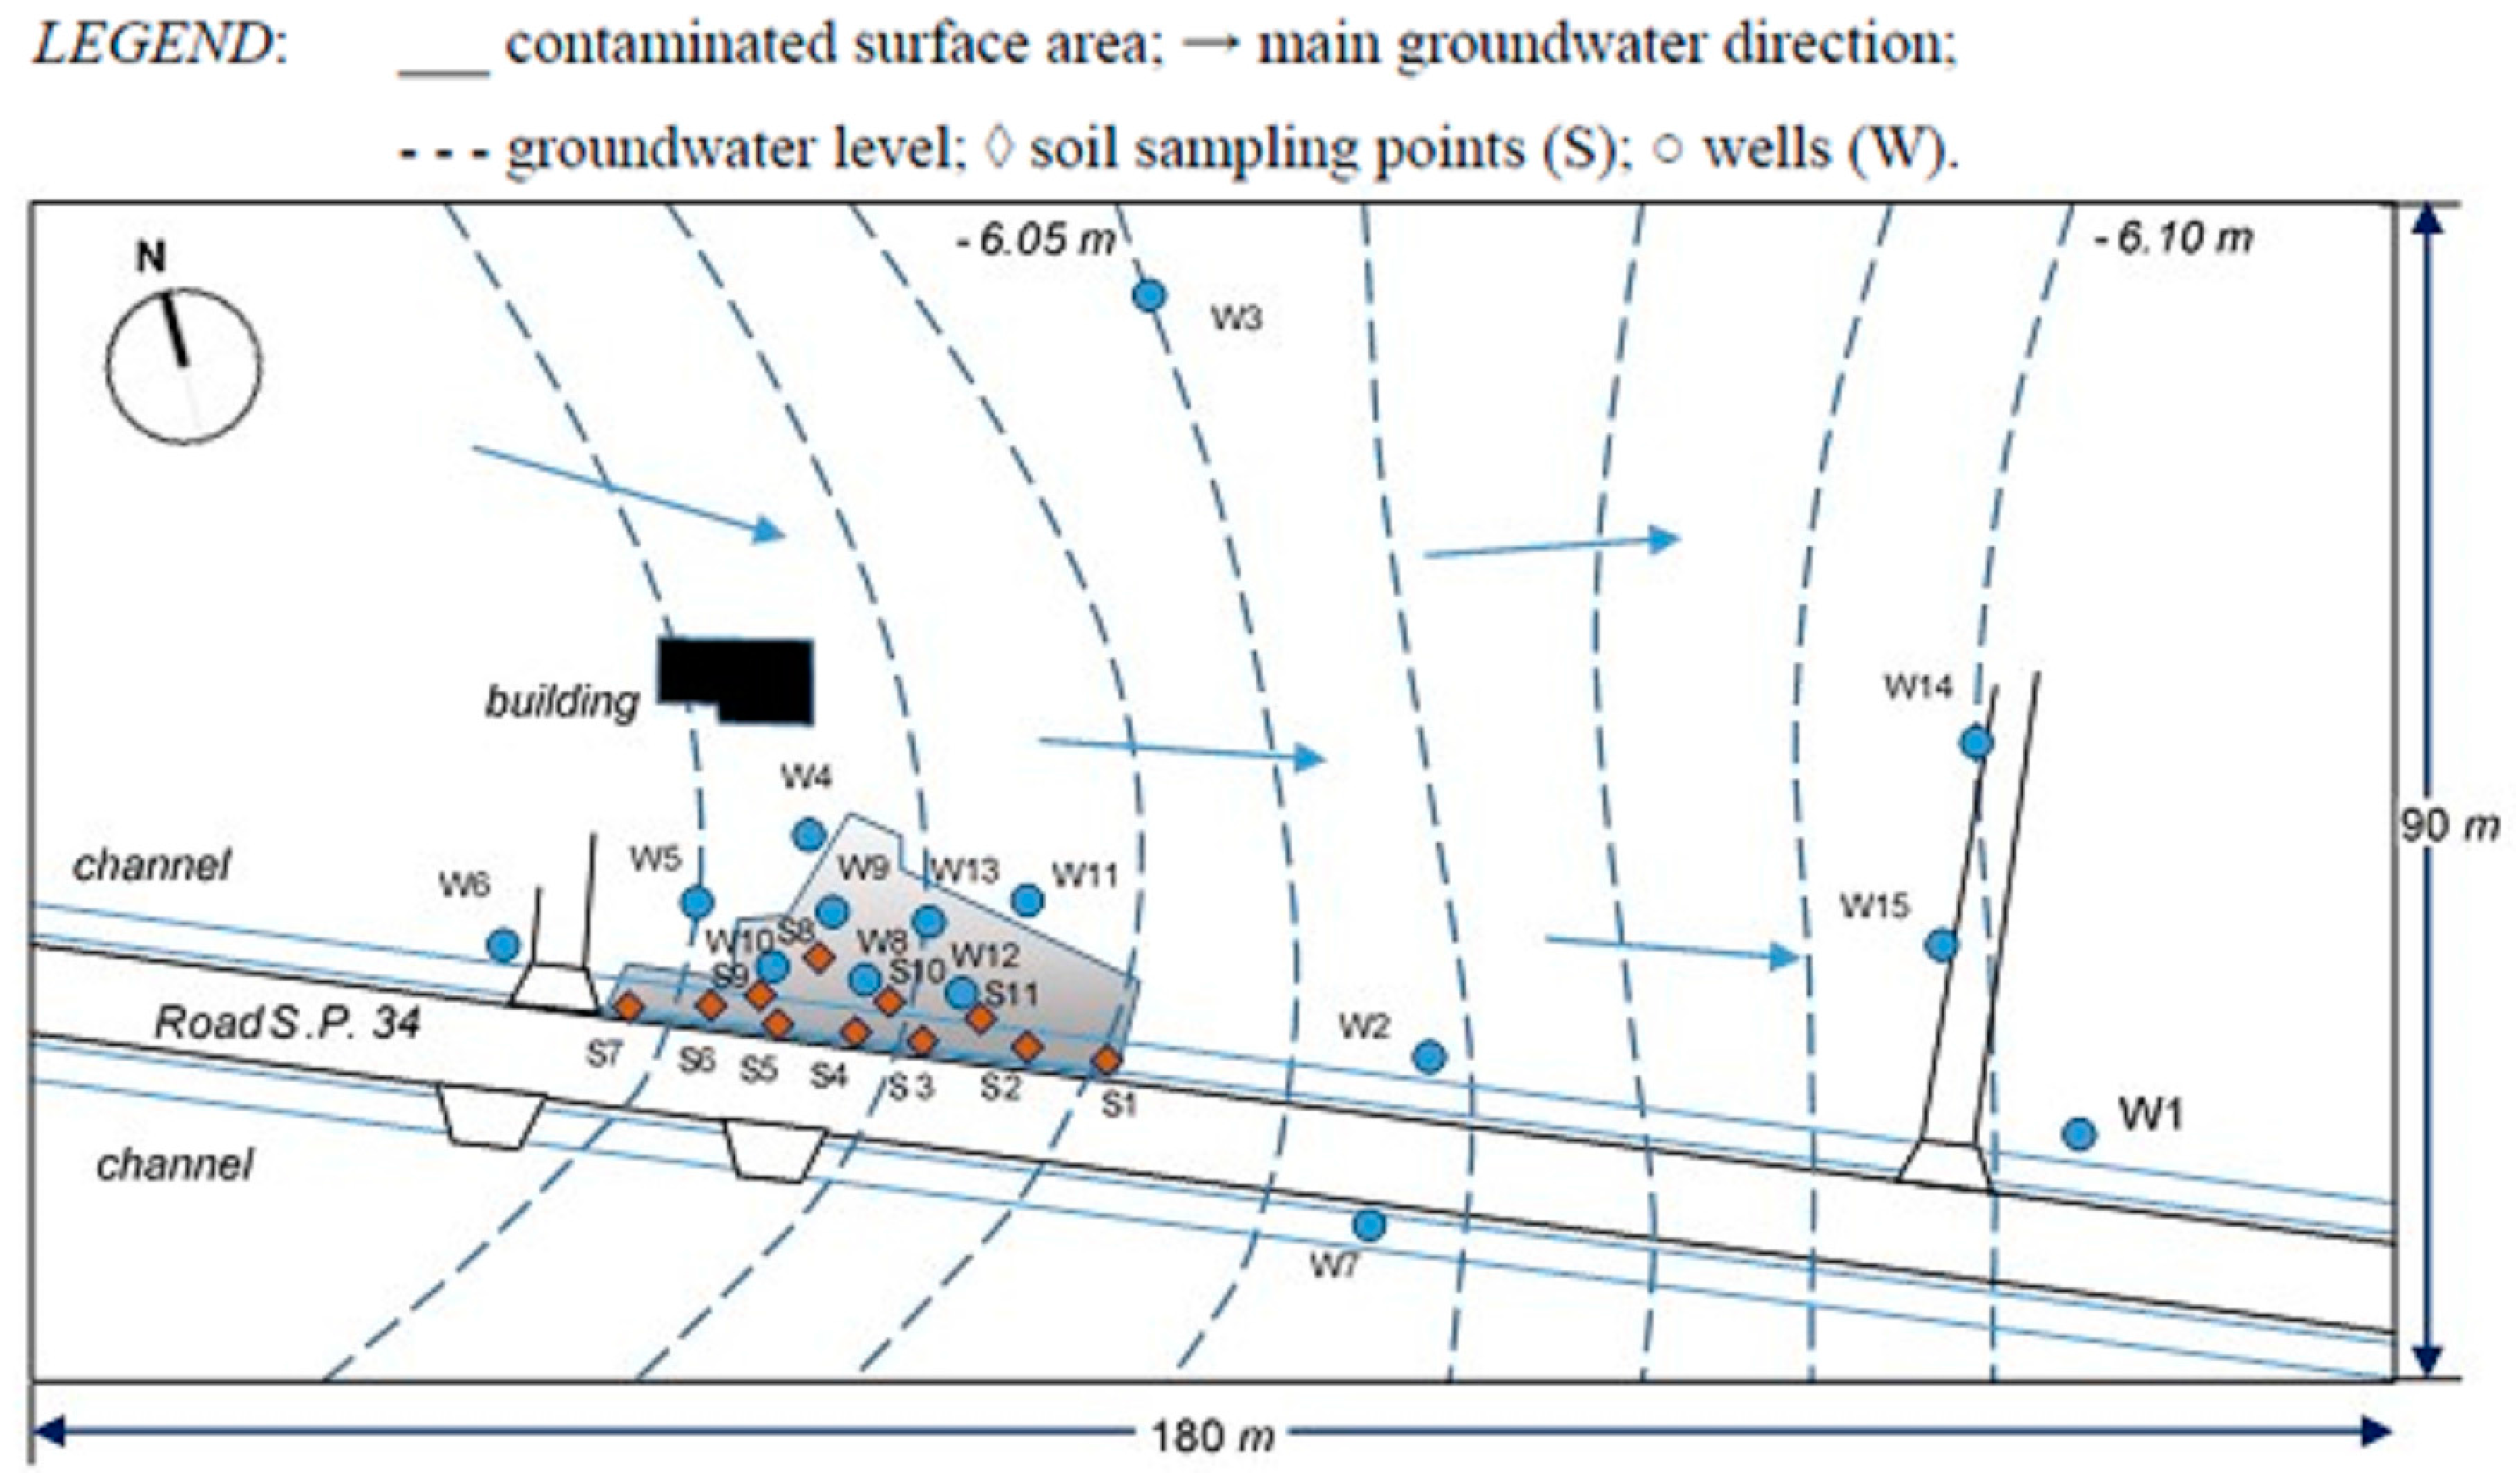
Figure 4 shows the hydrogeological map of the contaminated site and the location of wells and soil sampling points.
The methodologies and standard methods for samples analysis was based on the current national law [17,18], taking into account the different involved environmental matrices.
In the “emergency” and “safety” phase the following monitoring activity of the site were carried out with the aim to evaluate the extent of the contamination and define measures to be adopted:
  • hand soil sampling was realized at a depth varying in the range −0.3 ÷ −2.4 m; suitable protocols was adopted to avoid any contamination and preserve the samples such as use of latex gloves, replaced at each sampling point, and metal scoop, decontaminated at each sampling point; the sample sieving was realized with a sieve with a 2 cm mesh; soil samples were packed in glass jars tightly sealed and stored at a temperature of 4 °C; transport of samples to a certified laboratory was carried out in insulated refrigerated bags;
  • micro-drilling at 5.50 m from the ground level by a direct-push portable equipment and a 30 mm diameter core barrel, equipped with internal sample tube holder;
  • survey based on seven internal perforations, plus an external one as a blank, realized with a rotary drilling technique with no fluids circulation, by using a 101 mm diameter core barrel and a 127 mm diameter cover tube;
  • determination of the phreatic level in 15 piezometers, with a maximum depth of 9 m from the ground surface;
  • in order to verify a possible plume migration water samples were taken in wells.
At the end of the “emergency” and “safety” phase, following the removal of the most contaminated soil, a three-dimensional model of the contamination in the unsaturated soil was elaborated on the basis of the soil analysis and taking into account the local conformation of the ground surface. In order to take into account the possible pathway of vertical leaching, the extent of the contamination source was determined by comparing the concentration values of hydrocarbons in function of location and depth of the soil samples, both before and after the excavation activities [17]. The results were then compared to what was prescribed by the national law in terms of threshold values for unsaturated soil and groundwater.
In order to evaluate the efficacy of the remediation action in unsaturated soil, different drilling campaigns were performed to collect soil samples for analytical investigations. The results were then compared to what is prescribed by the national law in terms of threshold values for residential and green soil use. As regards the unsaturated zone, the current national law [16] imposes, as a clean-up target for residential and green soil use, the achievement of 10 and 50 mg/kg dry weight for light (C ≤ 12) and heavy (C > 12) hydrocarbons respectively.
The results of the remediation technologies applied to groundwater were tested by sampling water in different piezometric campaigns. The current national law [16] imposes, as a clean-up target, the achievement of 350 μg∙L−1 for Total hydrocarbons (as n-hexane) in groundwater.

3. Results and Discussion

3.1. Hydrocarbons in Groundwater

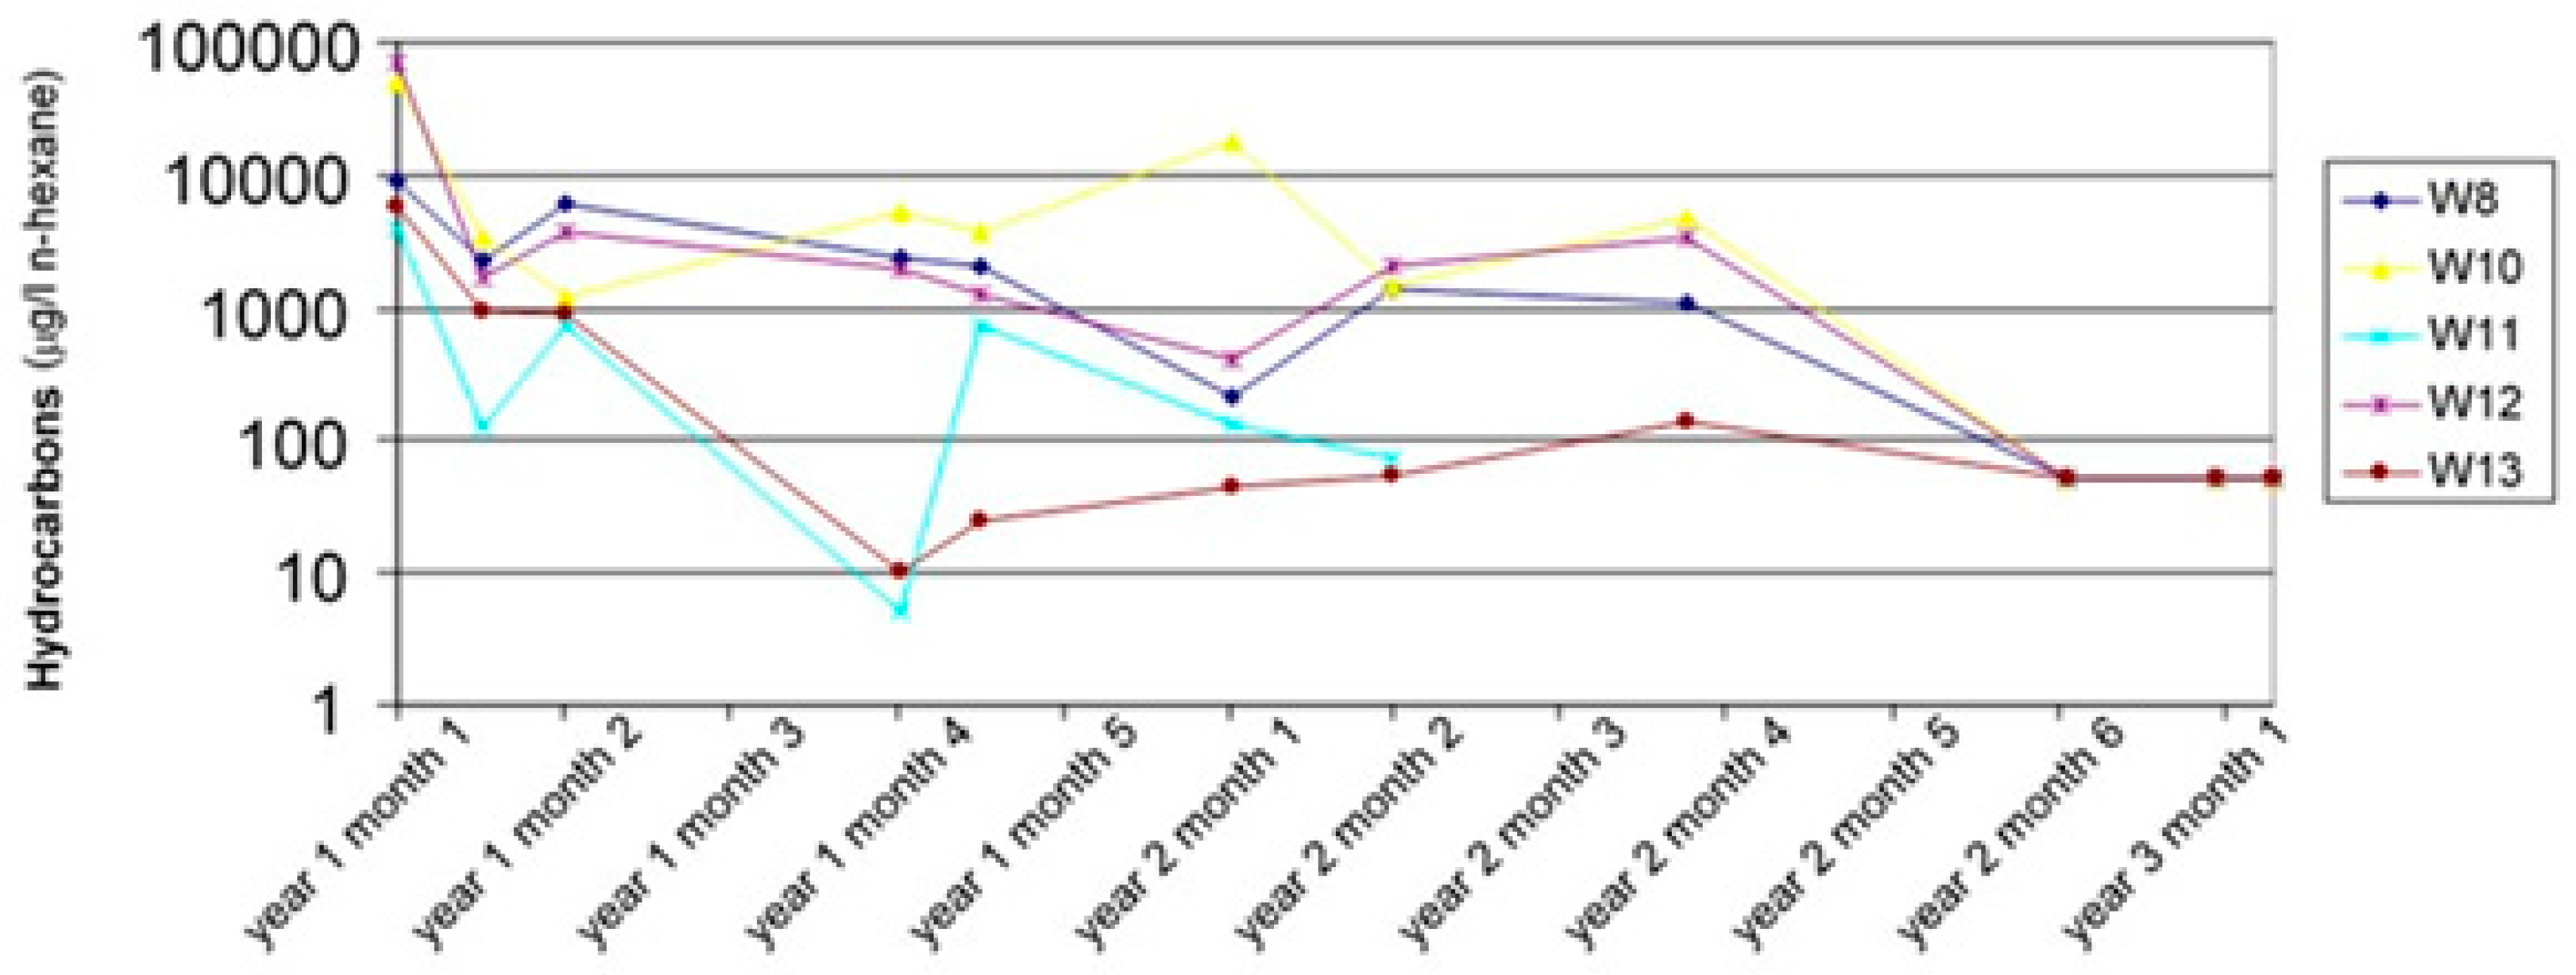
The results of analytical activities during the “emergency” and “safety” phase showed in water samples concentration values of Total hydrocarbons exceeding the threshold value of 350 μg∙L−1 in 5 out of 37 examined samples, with a peak of 6000 μg∙L−1.
Figure 5 shows the trend of the concentrations of total hydrocarbons (as n-hexane) during the piezometric campaigns (in red the threshold value for groundwater).
The analytical results show the achievement of the remediation goal starting from the sixth month of the second year, thus highlighting the efficacy of the treatment applied.

3.2. Hydrocarbons in Soil and Remediation Treatment

3.2.1. The Phase of the “Emergency” and “Safety” Operation

In this phase, the results of hand sampling of soil showed that six out of 10 samples exceeded the threshold value of 50 mg·kg−1 for heavy hydrocarbons, up to 400 times, and for light hydrocarbons in four cases they also exceeded the threshold value of 10 mg·kg−1 up to 540 times.
In the investigations by micro-drilling, the soil samples up to 5.40 m from the ground level showed exceedances of the threshold value both for heavy hydrocarbons and light hydrocarbons: the former with a maximum value of 13,000 mg·kg−1, the latter with a maximum value of 2100 mg·kg−1.
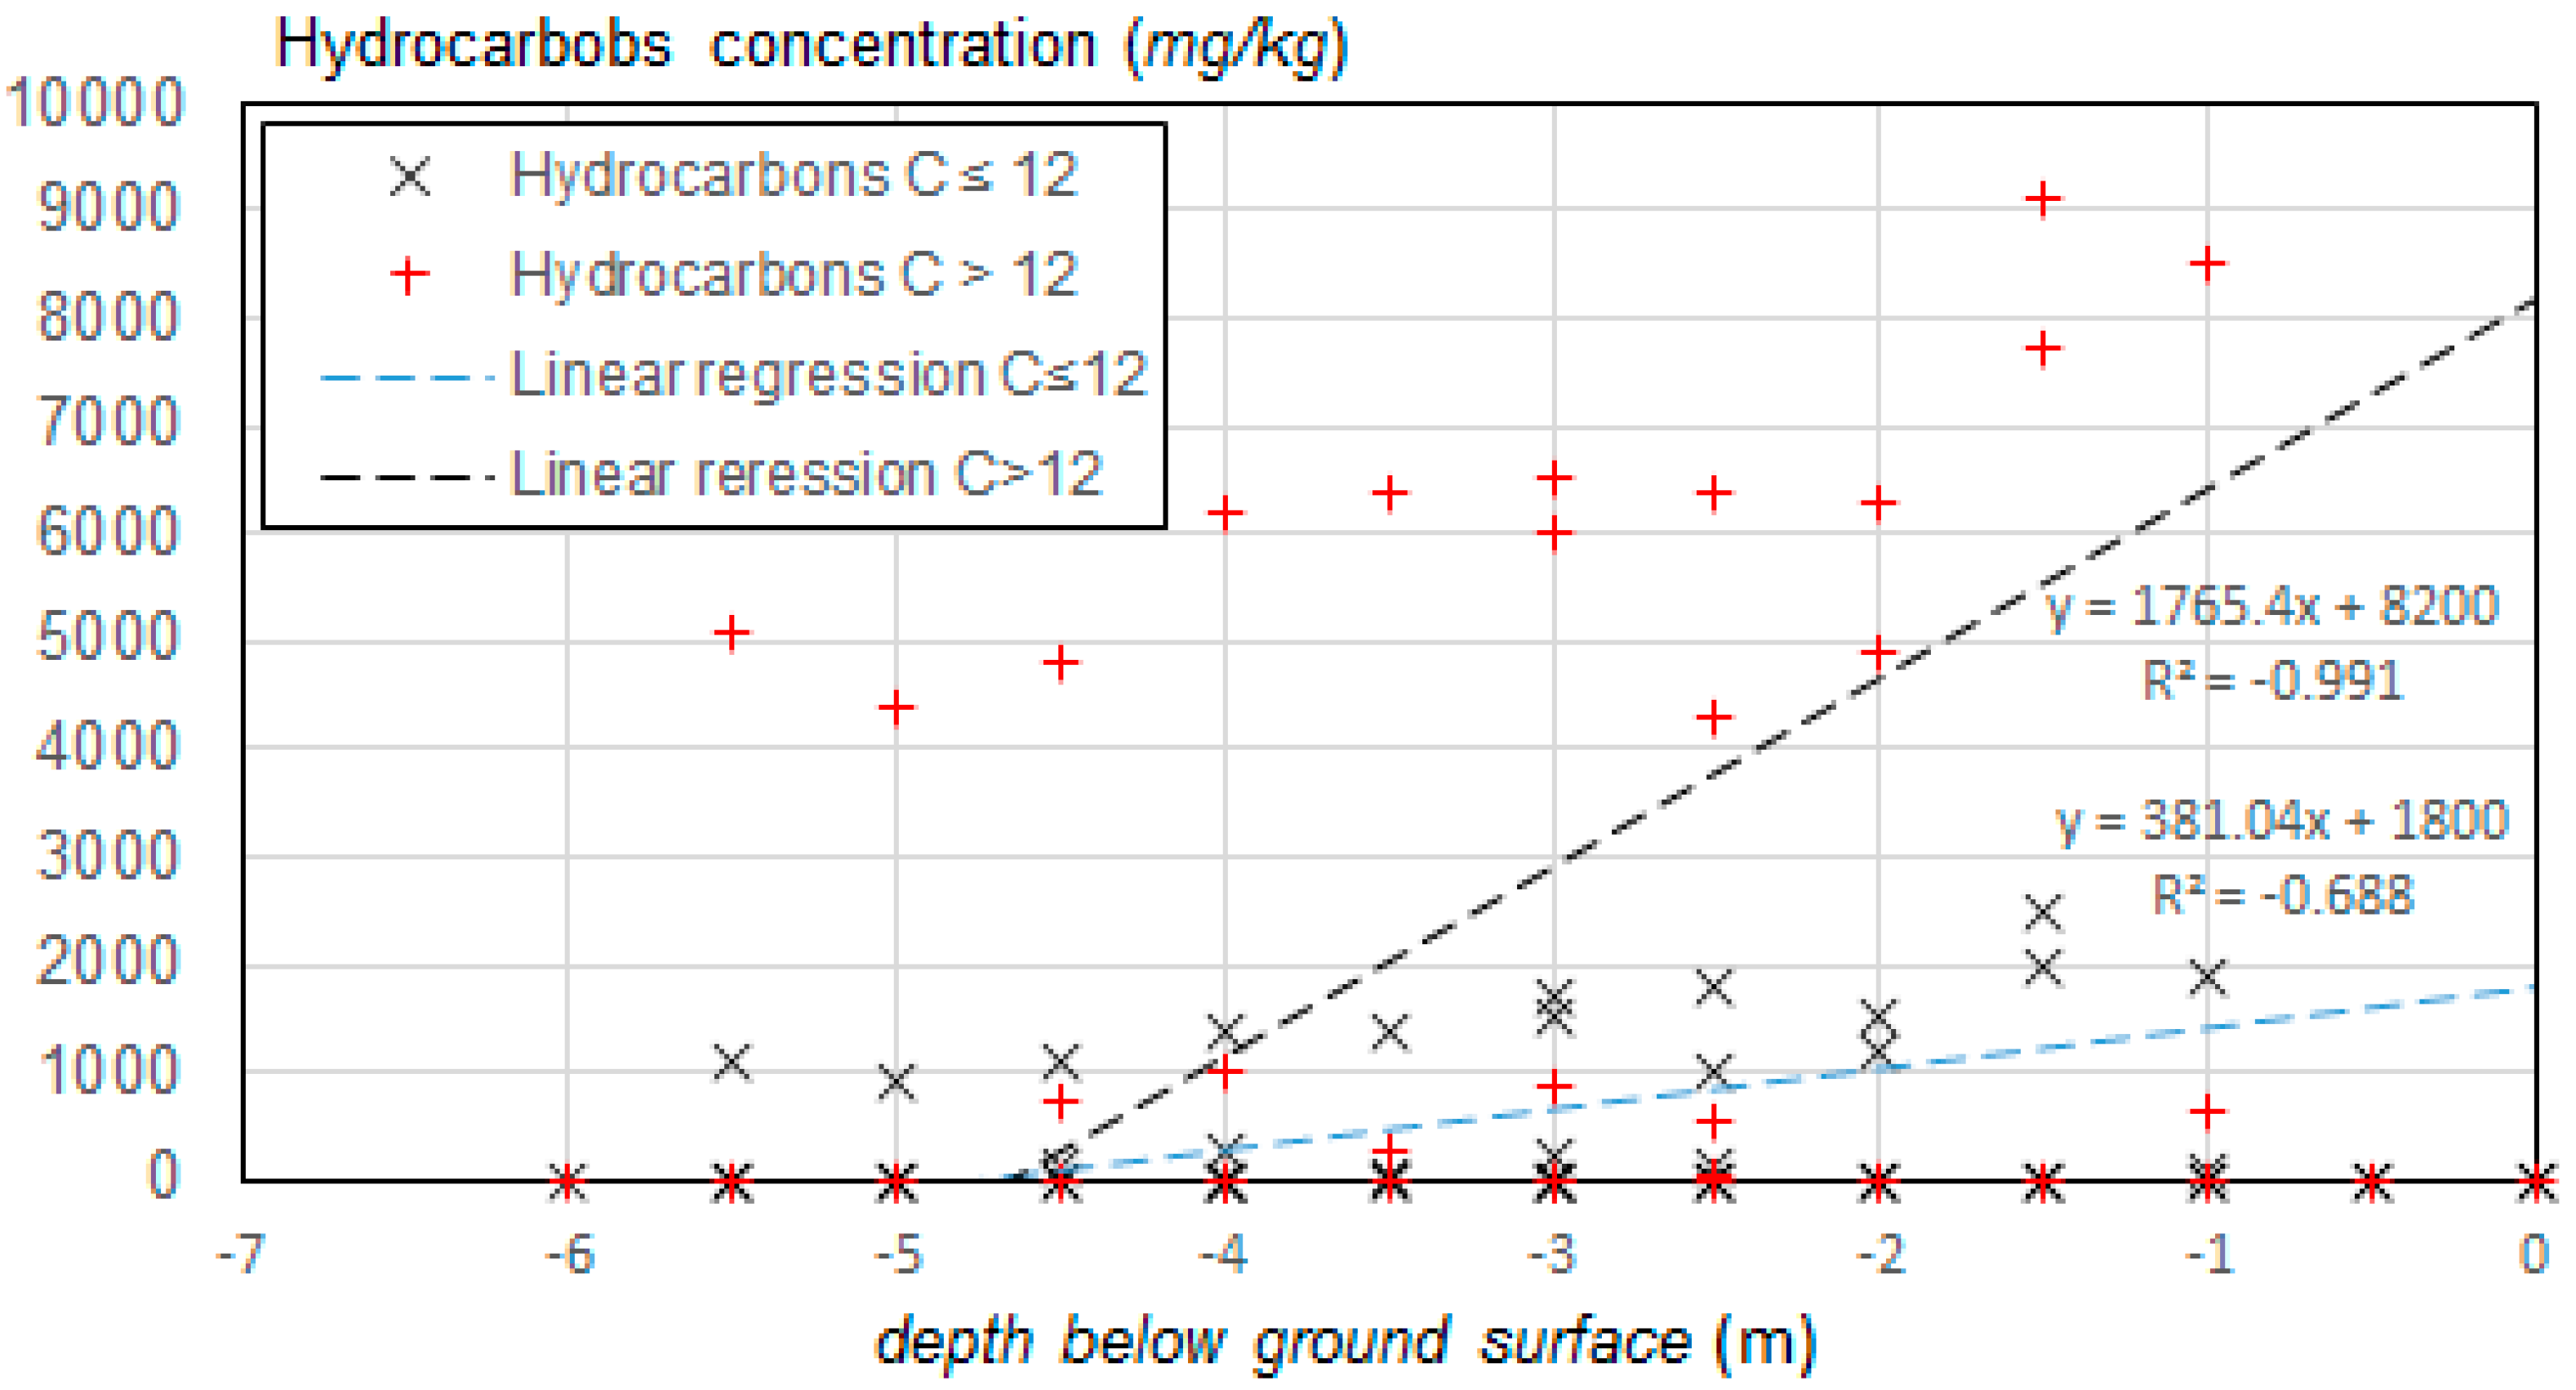
During the survey carried out in the “emergency” phase, the maximum values registered were of 9100 mg·kg−1 and of 2500 mg·kg−1 for heavy and light hydrocarbons respectively.
Figure 6 shows the concentrations of hydrocarbons in unsaturated soil of seven sampling points below ground surface. A main diffusion of pollutants was observed in the soil layers next to the surface. It is evident that the diffusion process of the pollutant mass, down the deeper layer, had just started.
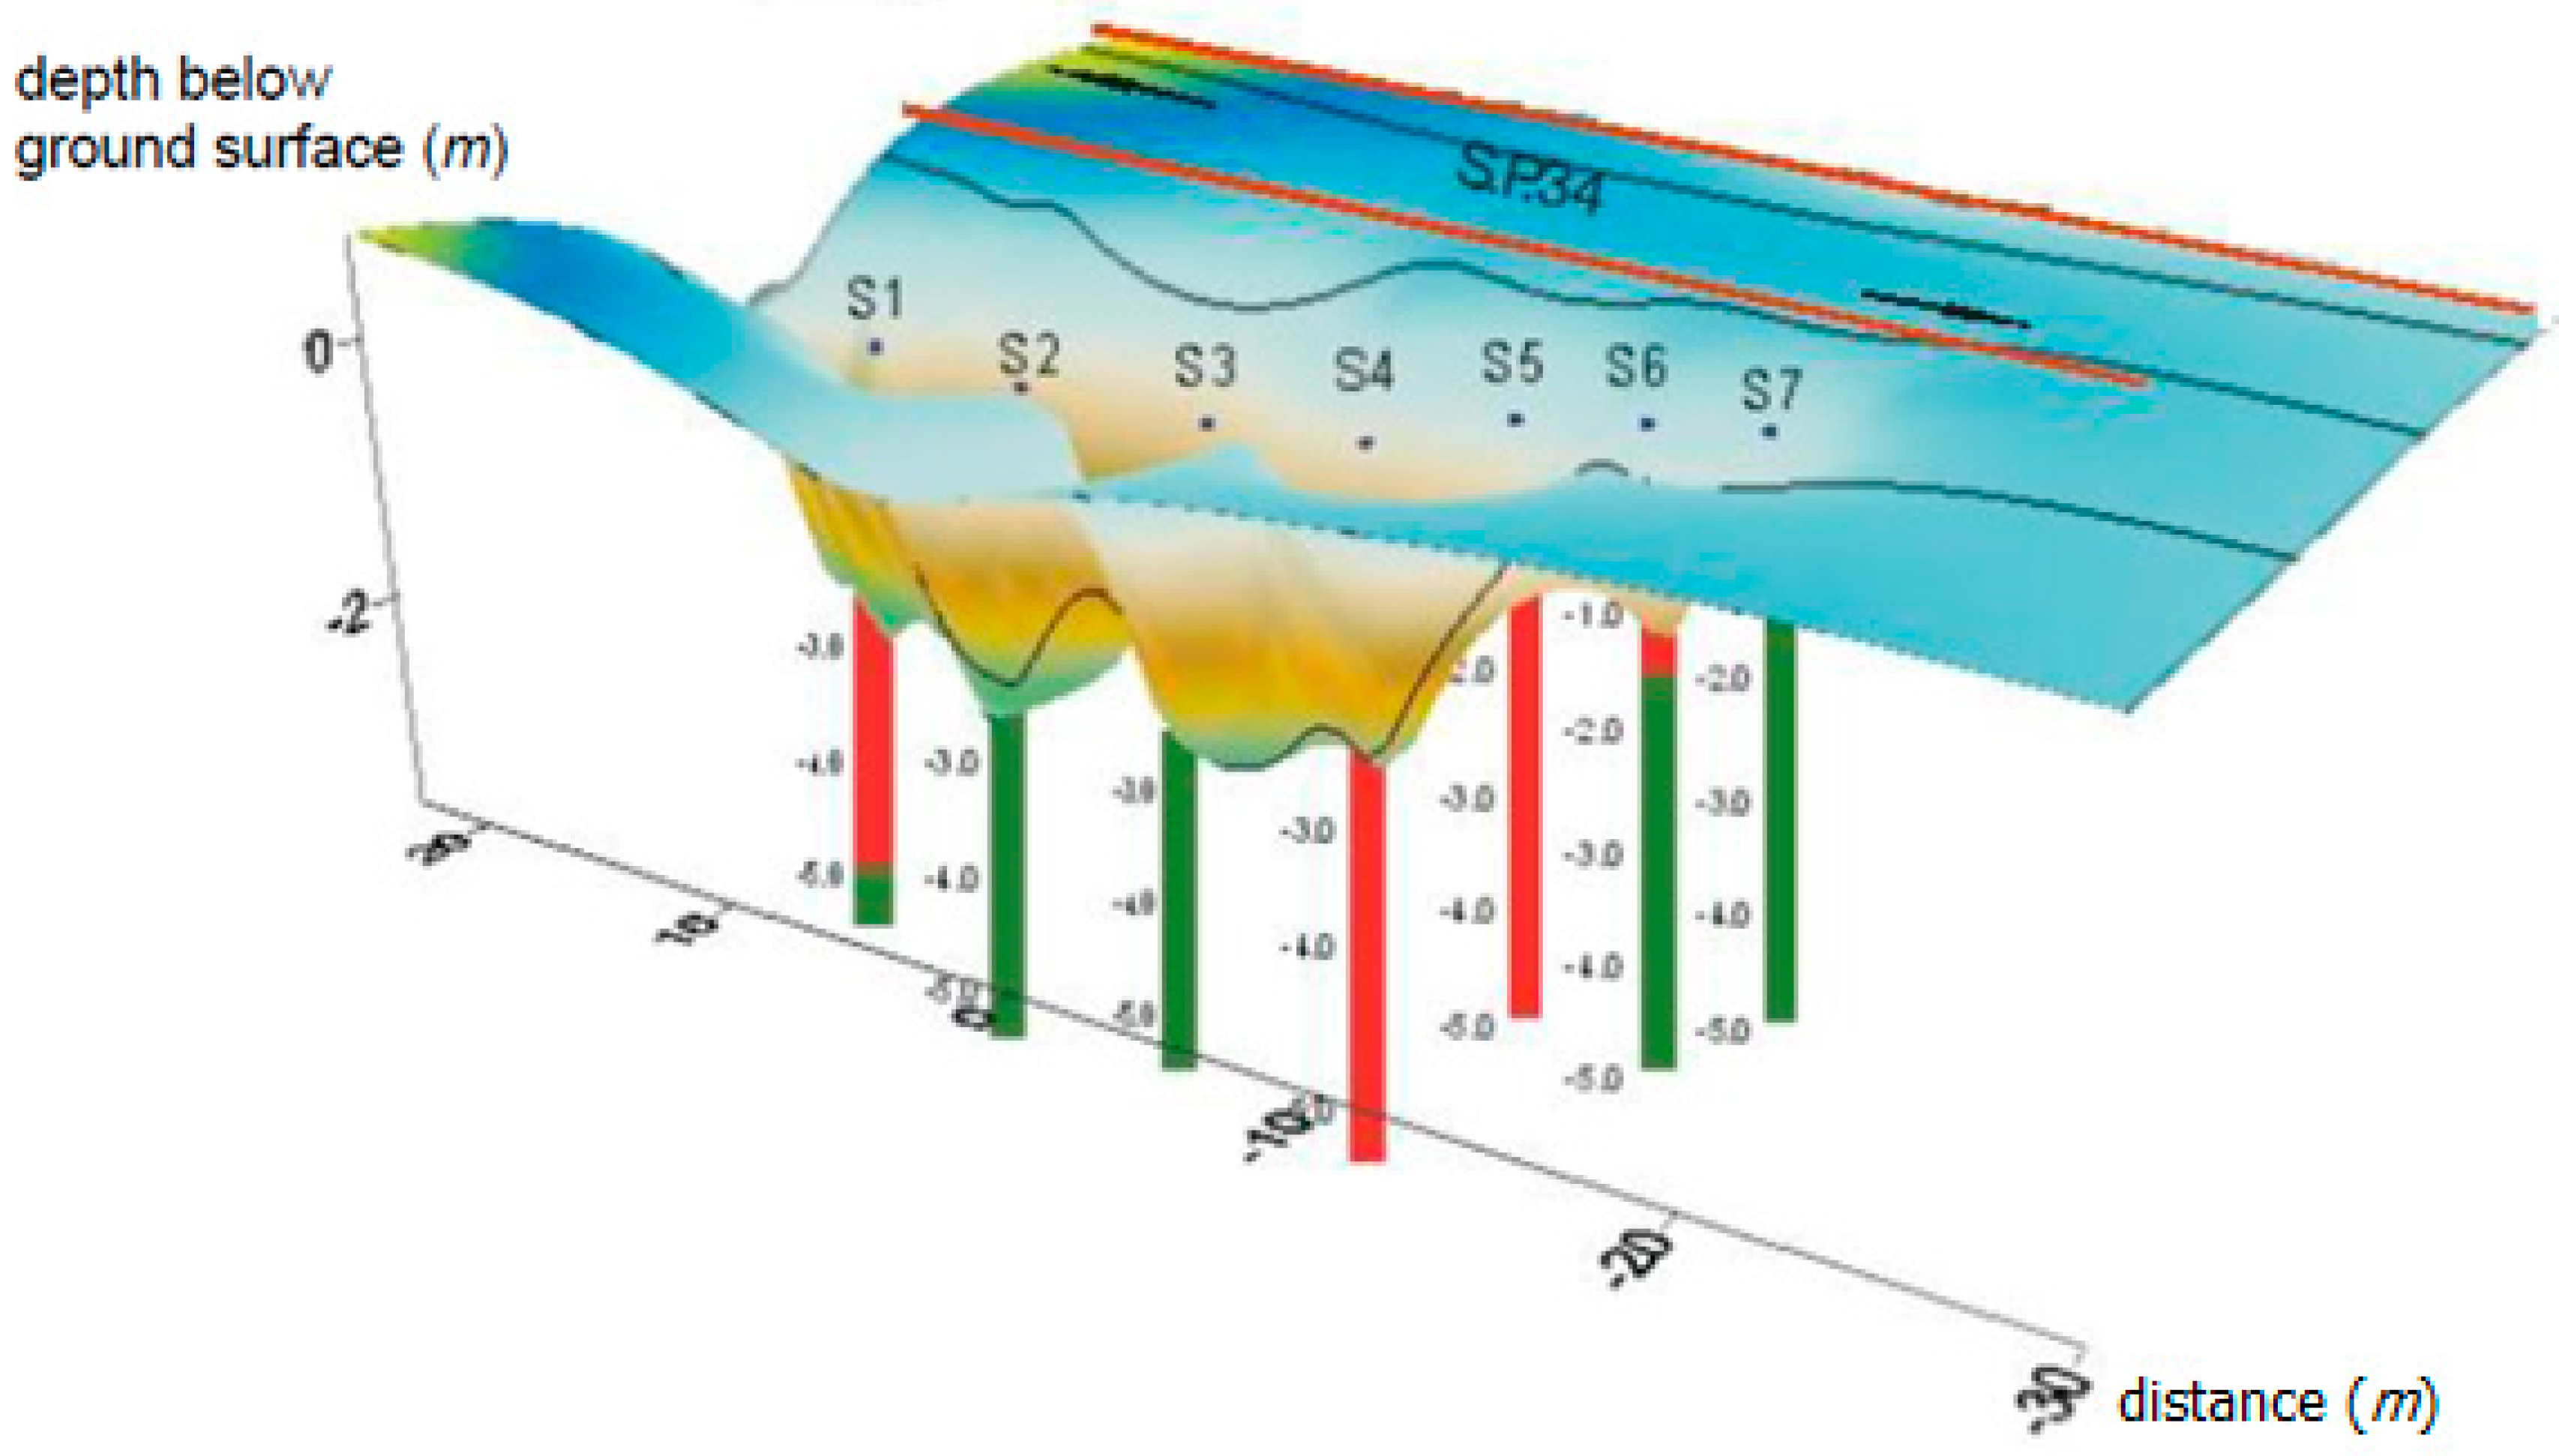
Figure 7 shows a view of the contaminated site and distribution of the observed hydrocarbons content in soil at different depths in seven sampling points.
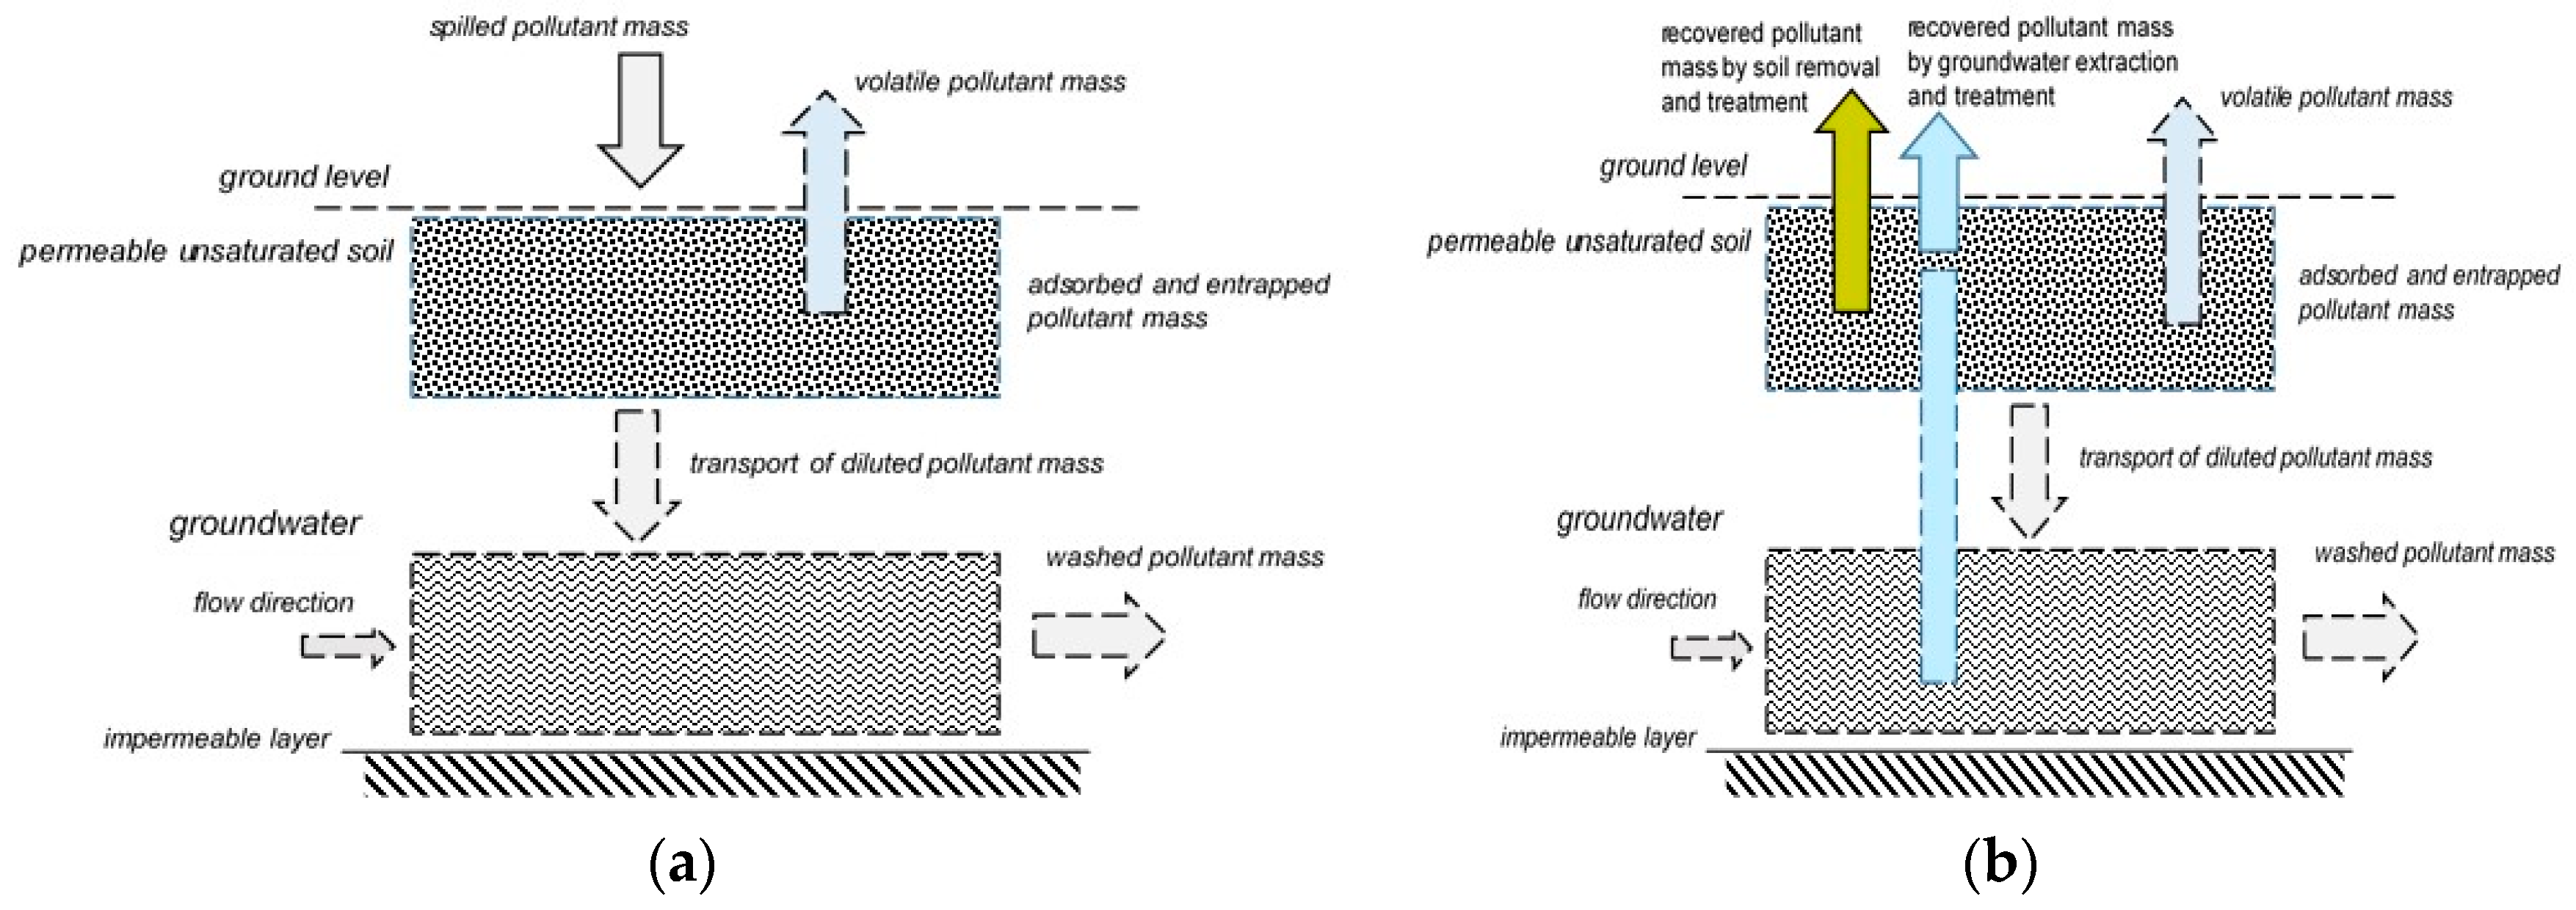
After the “safety” measures were carried out, a mass balance was elaborated in order to estimate how much diesel was recovered during the “emergency” phase following the movement and extraction of soil and the groundwater treatment (Figure 8). Calculation was carried out on the hypothesis that in the first phase of pollution process, most of the pollutant mass was retained in the unsaturated soil. Results showed that a mass of about 7550 kg of pollutant was recovered by the 12,500 kg of spilled pollutant mass of 12,500 kg. A mass of about 5000 kg of missing diesel was estimated.

3.2.2. The Second Phase of Remediation Treatment

After about 24 months following the event, the remediation of the unsaturated soil started. In the presence of heavier hydrocarbons, a first step by SVE technology was realized with the aim to promote a gradual decontamination of the unsaturated zone. The process was started by injecting heated air into the subsoil: that acts on the vapour pressure of the adsorbed compounds, favouring their volatilization. An air depression was then realized in the extraction wells, by using pumps. Permeating into the soil, the volatilization of volatile compounds which were adsorbed onto the soil was induced. The mass of air-steam extracted from the wells, either continuously or intermittently, was treated using an activated carbon process.
When no more volatile organic compounds were present, the second step of bio-venting was operated.
The third treatment step of the “Enhanced Bioremediation” started when bioventing comes to an end. It was based on a bio-augmentation technique, consisting of improving the biological activity through the inoculation of exogenous microorganisms, specially selected and acclimated, inserted into the soil matrix through the injection wells, already present on site as an integral part of the plant.
The microbial activity was further enhanced by the addition of aqueous solutions enriched with nutrients, such as phosphate and nitrate, through the same wells.
In Table 1, a preliminary evaluation of the presence, in soil, of hydrocarbons and micronutrients for the biomass growth is reported. In order to stimulate the activity and the growth of microorganisms able to aerobically biodegrade the hydrocarbons, the environmental conditions were optimized. Humidification and intake of specific nutrients in the environment was implemented by oxygenation of the sub-soil.
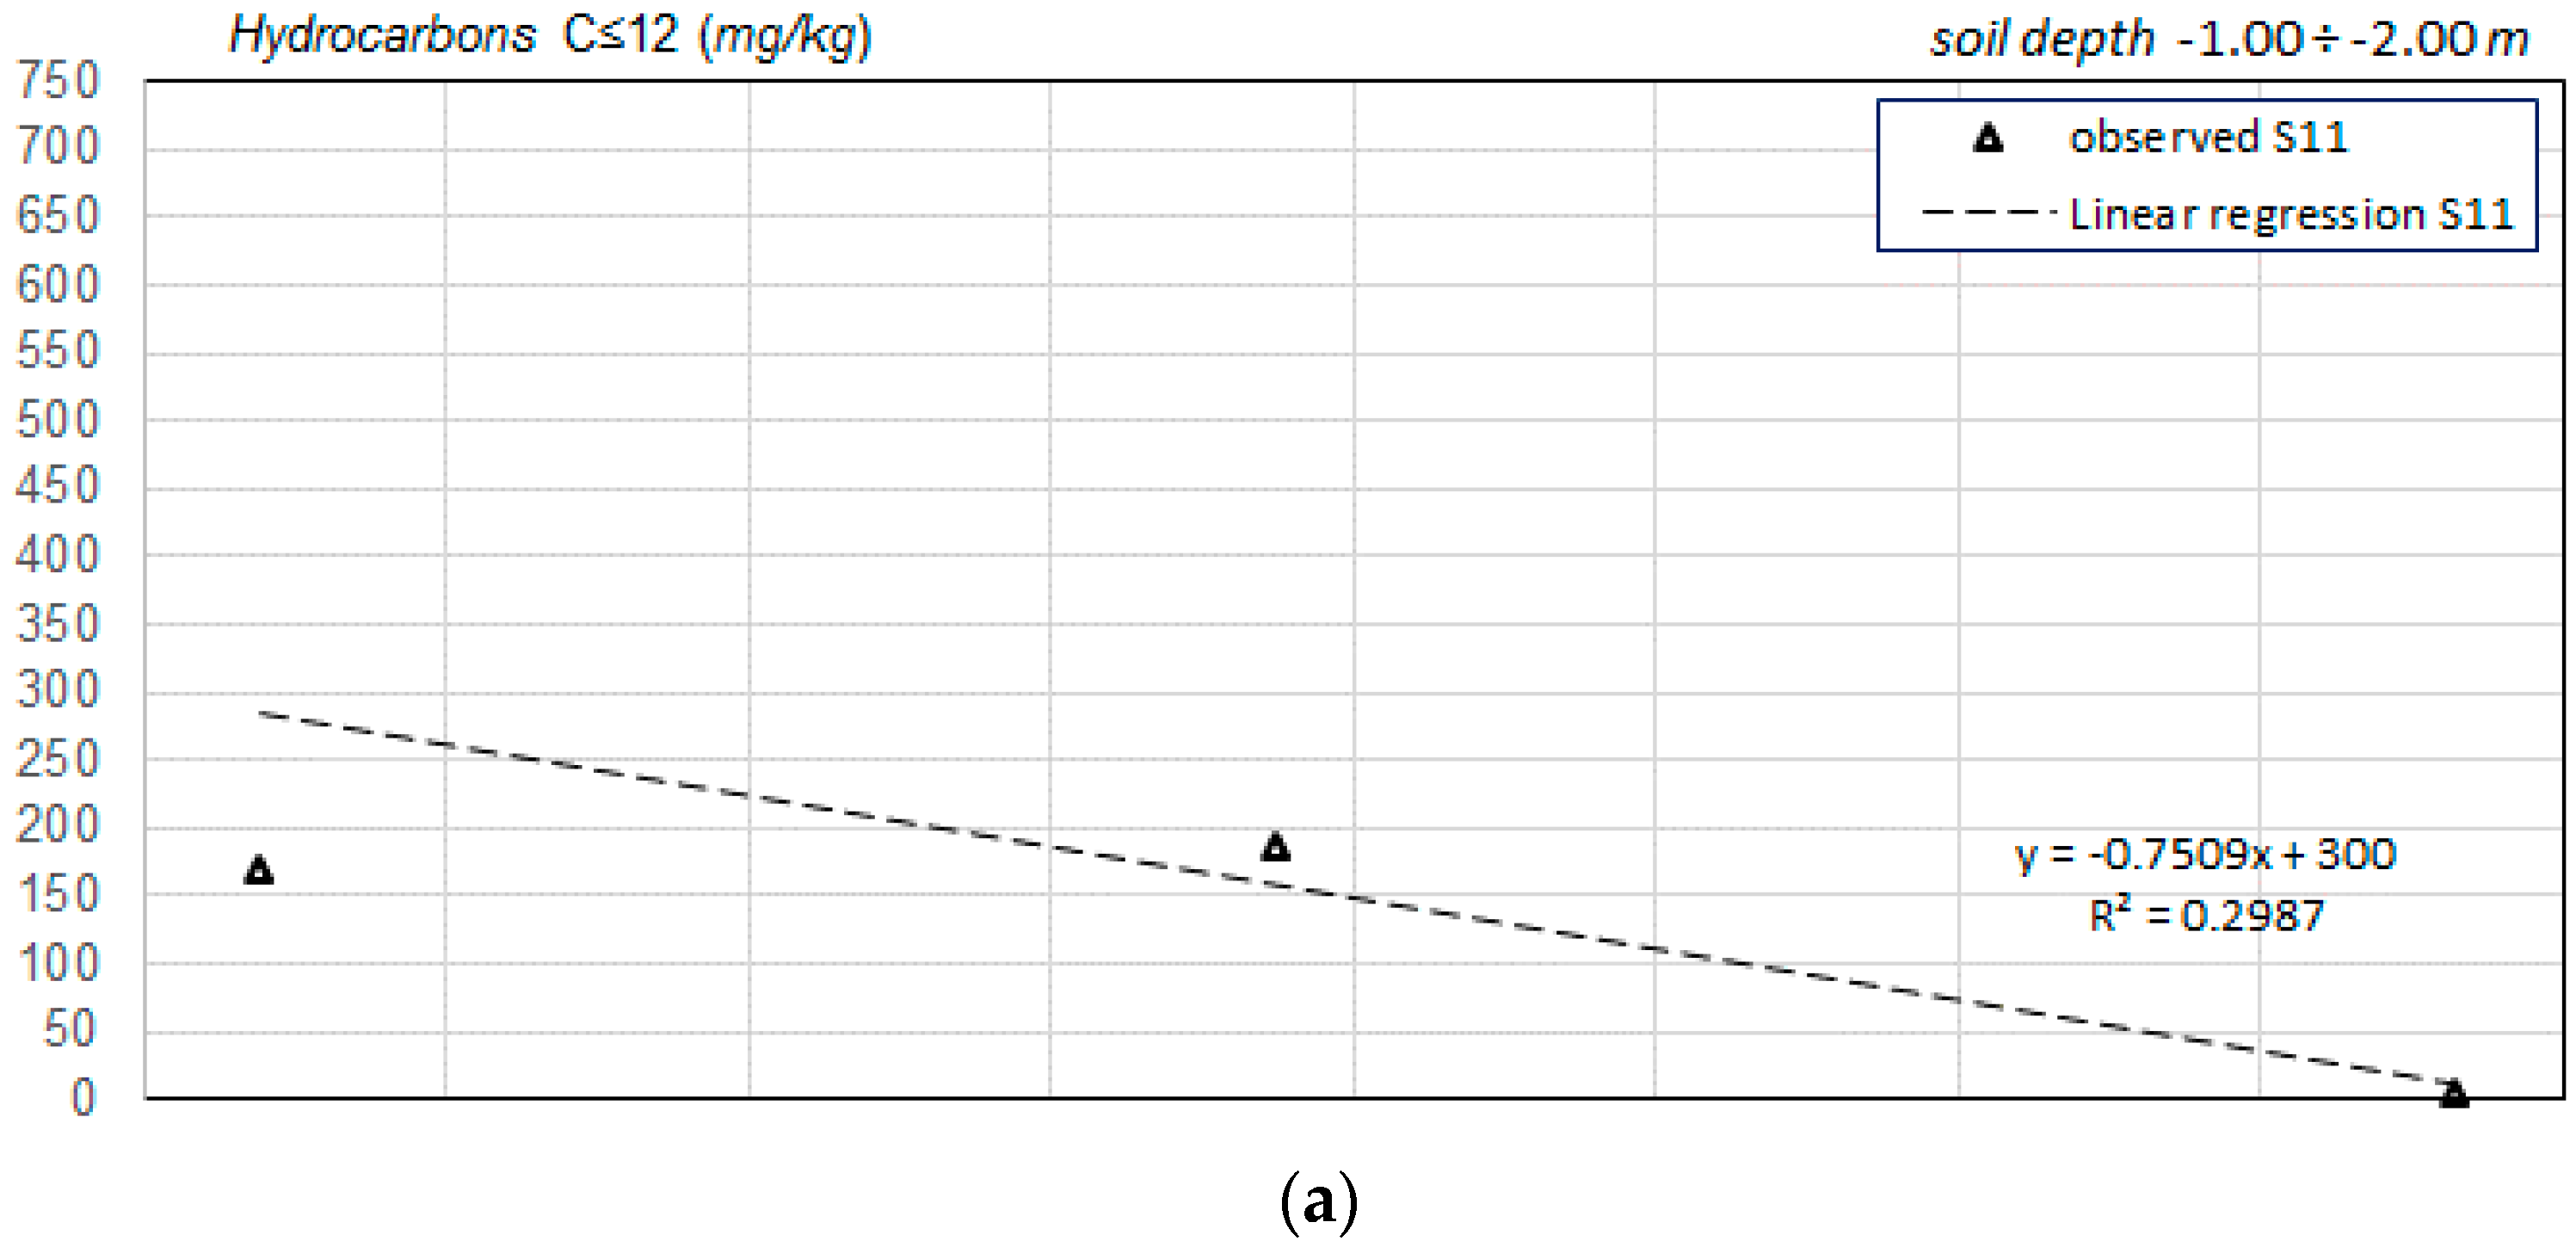
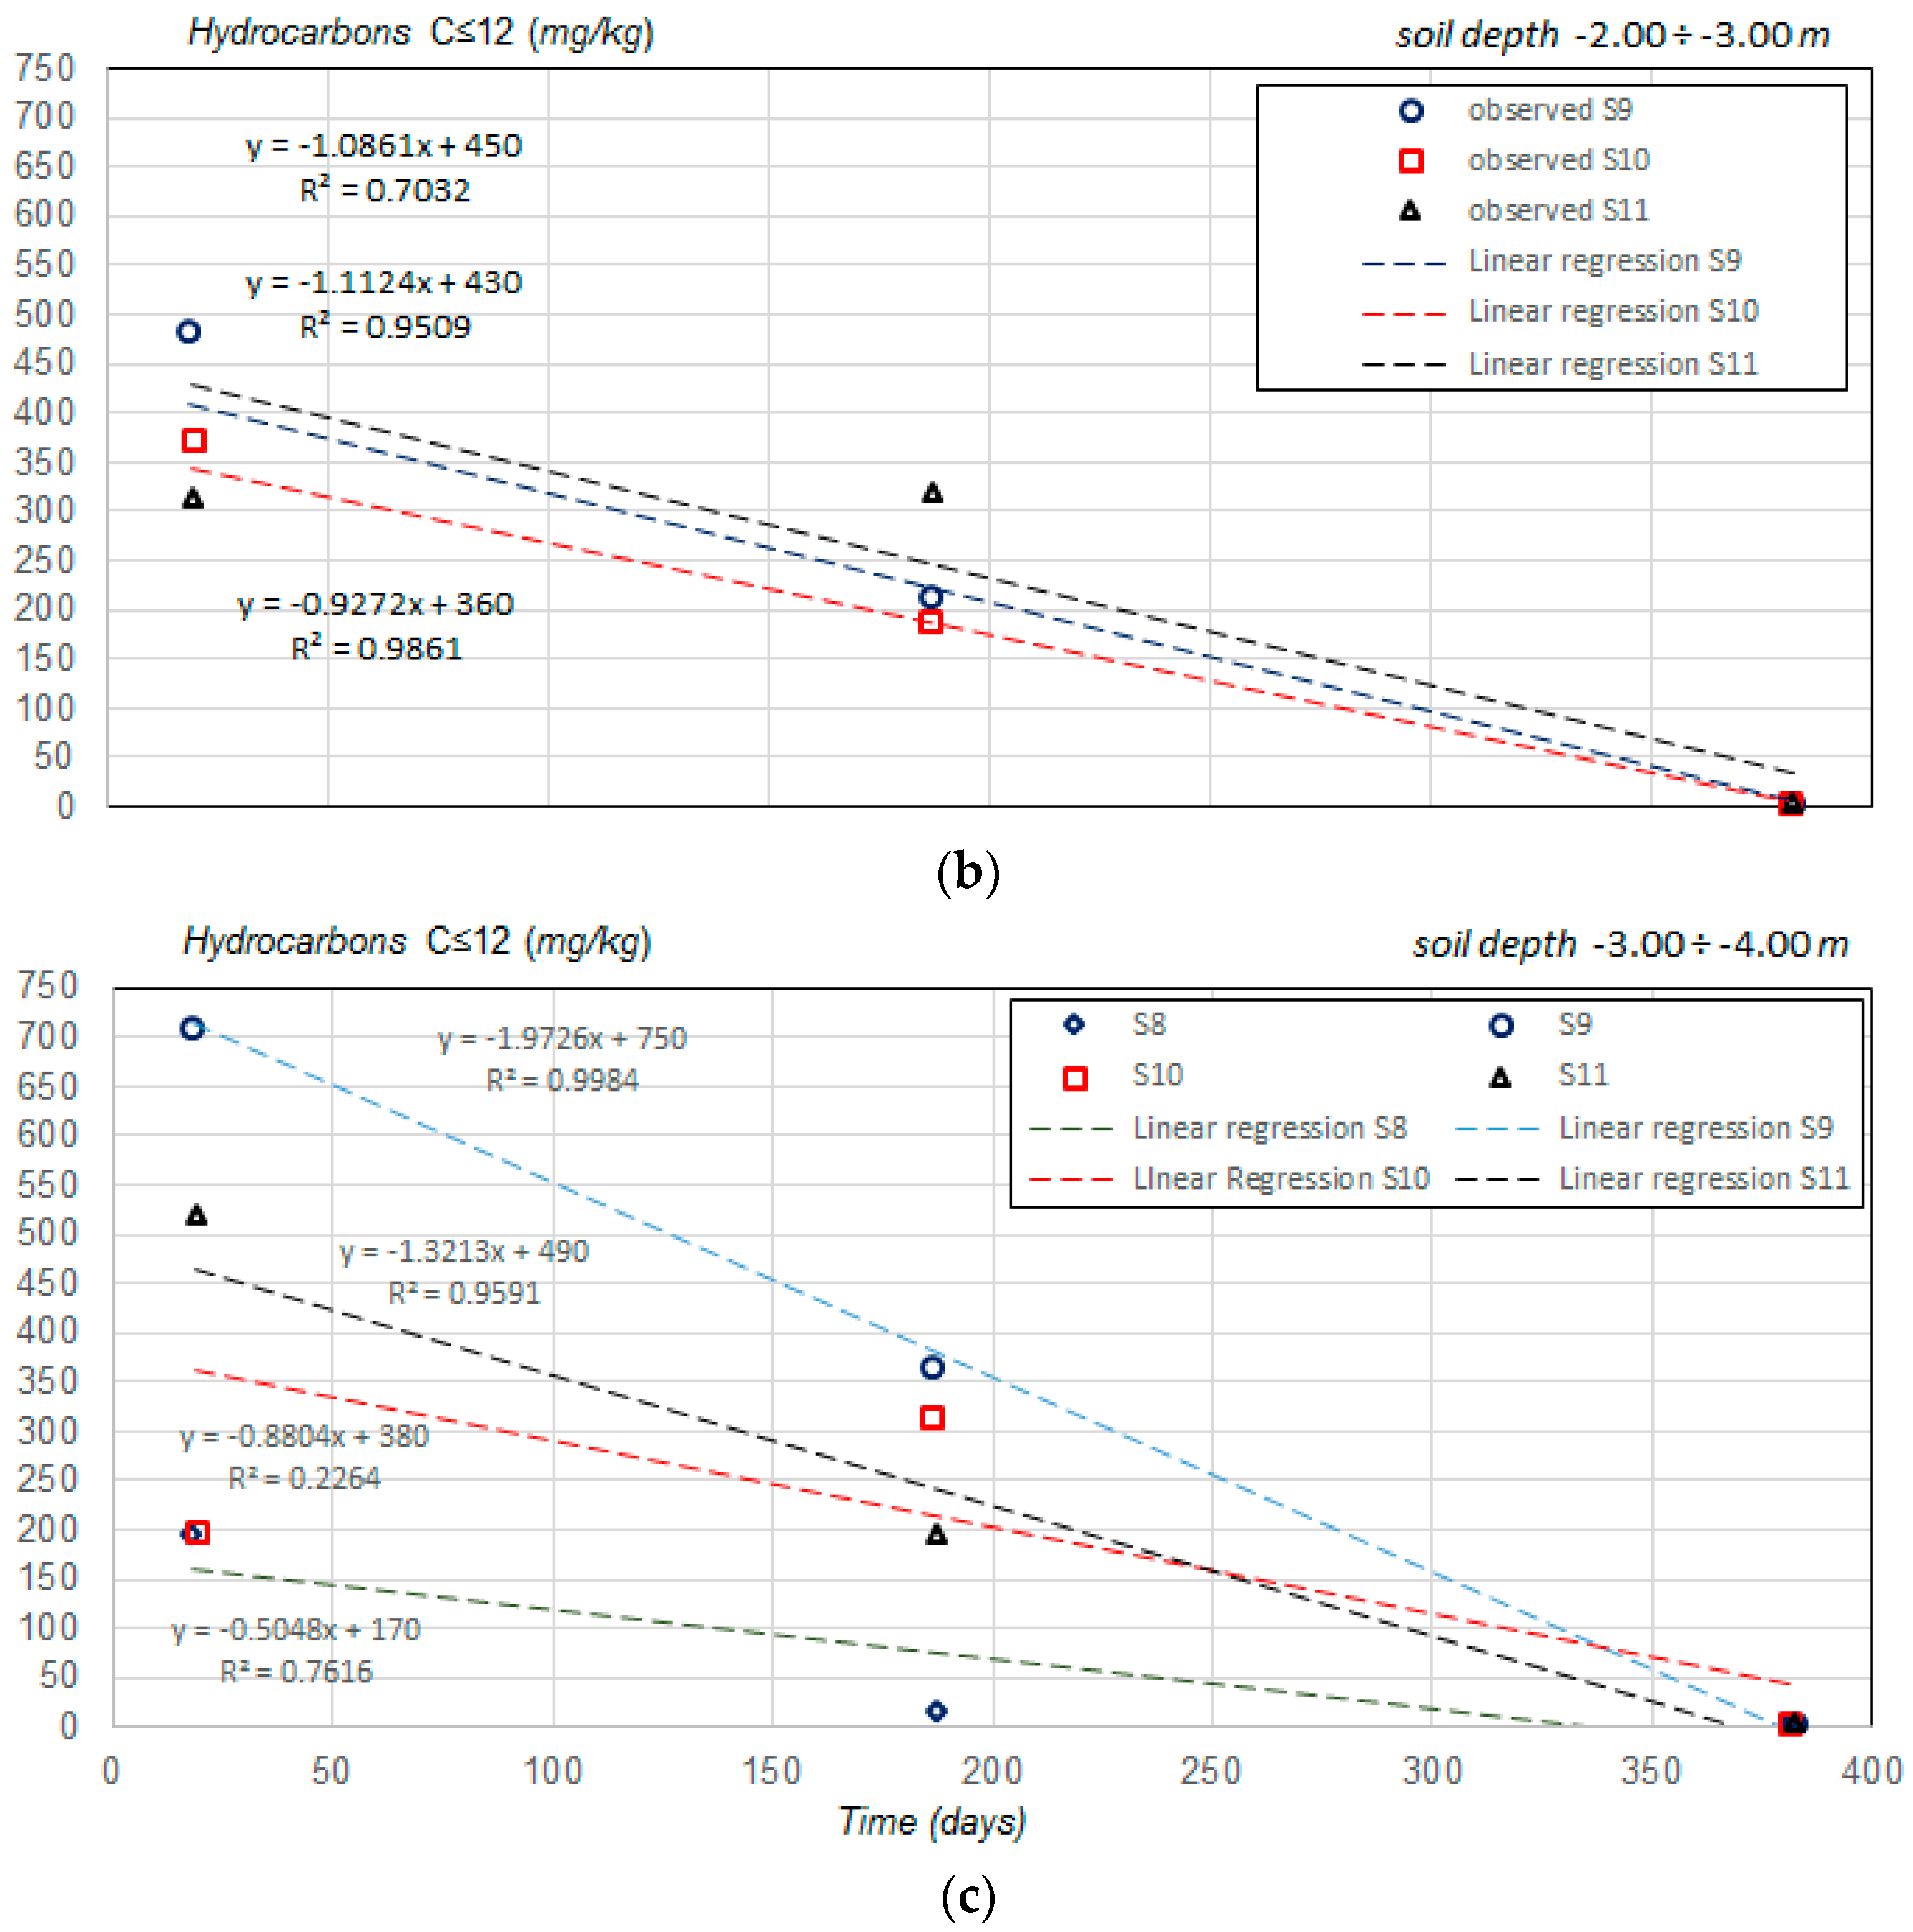
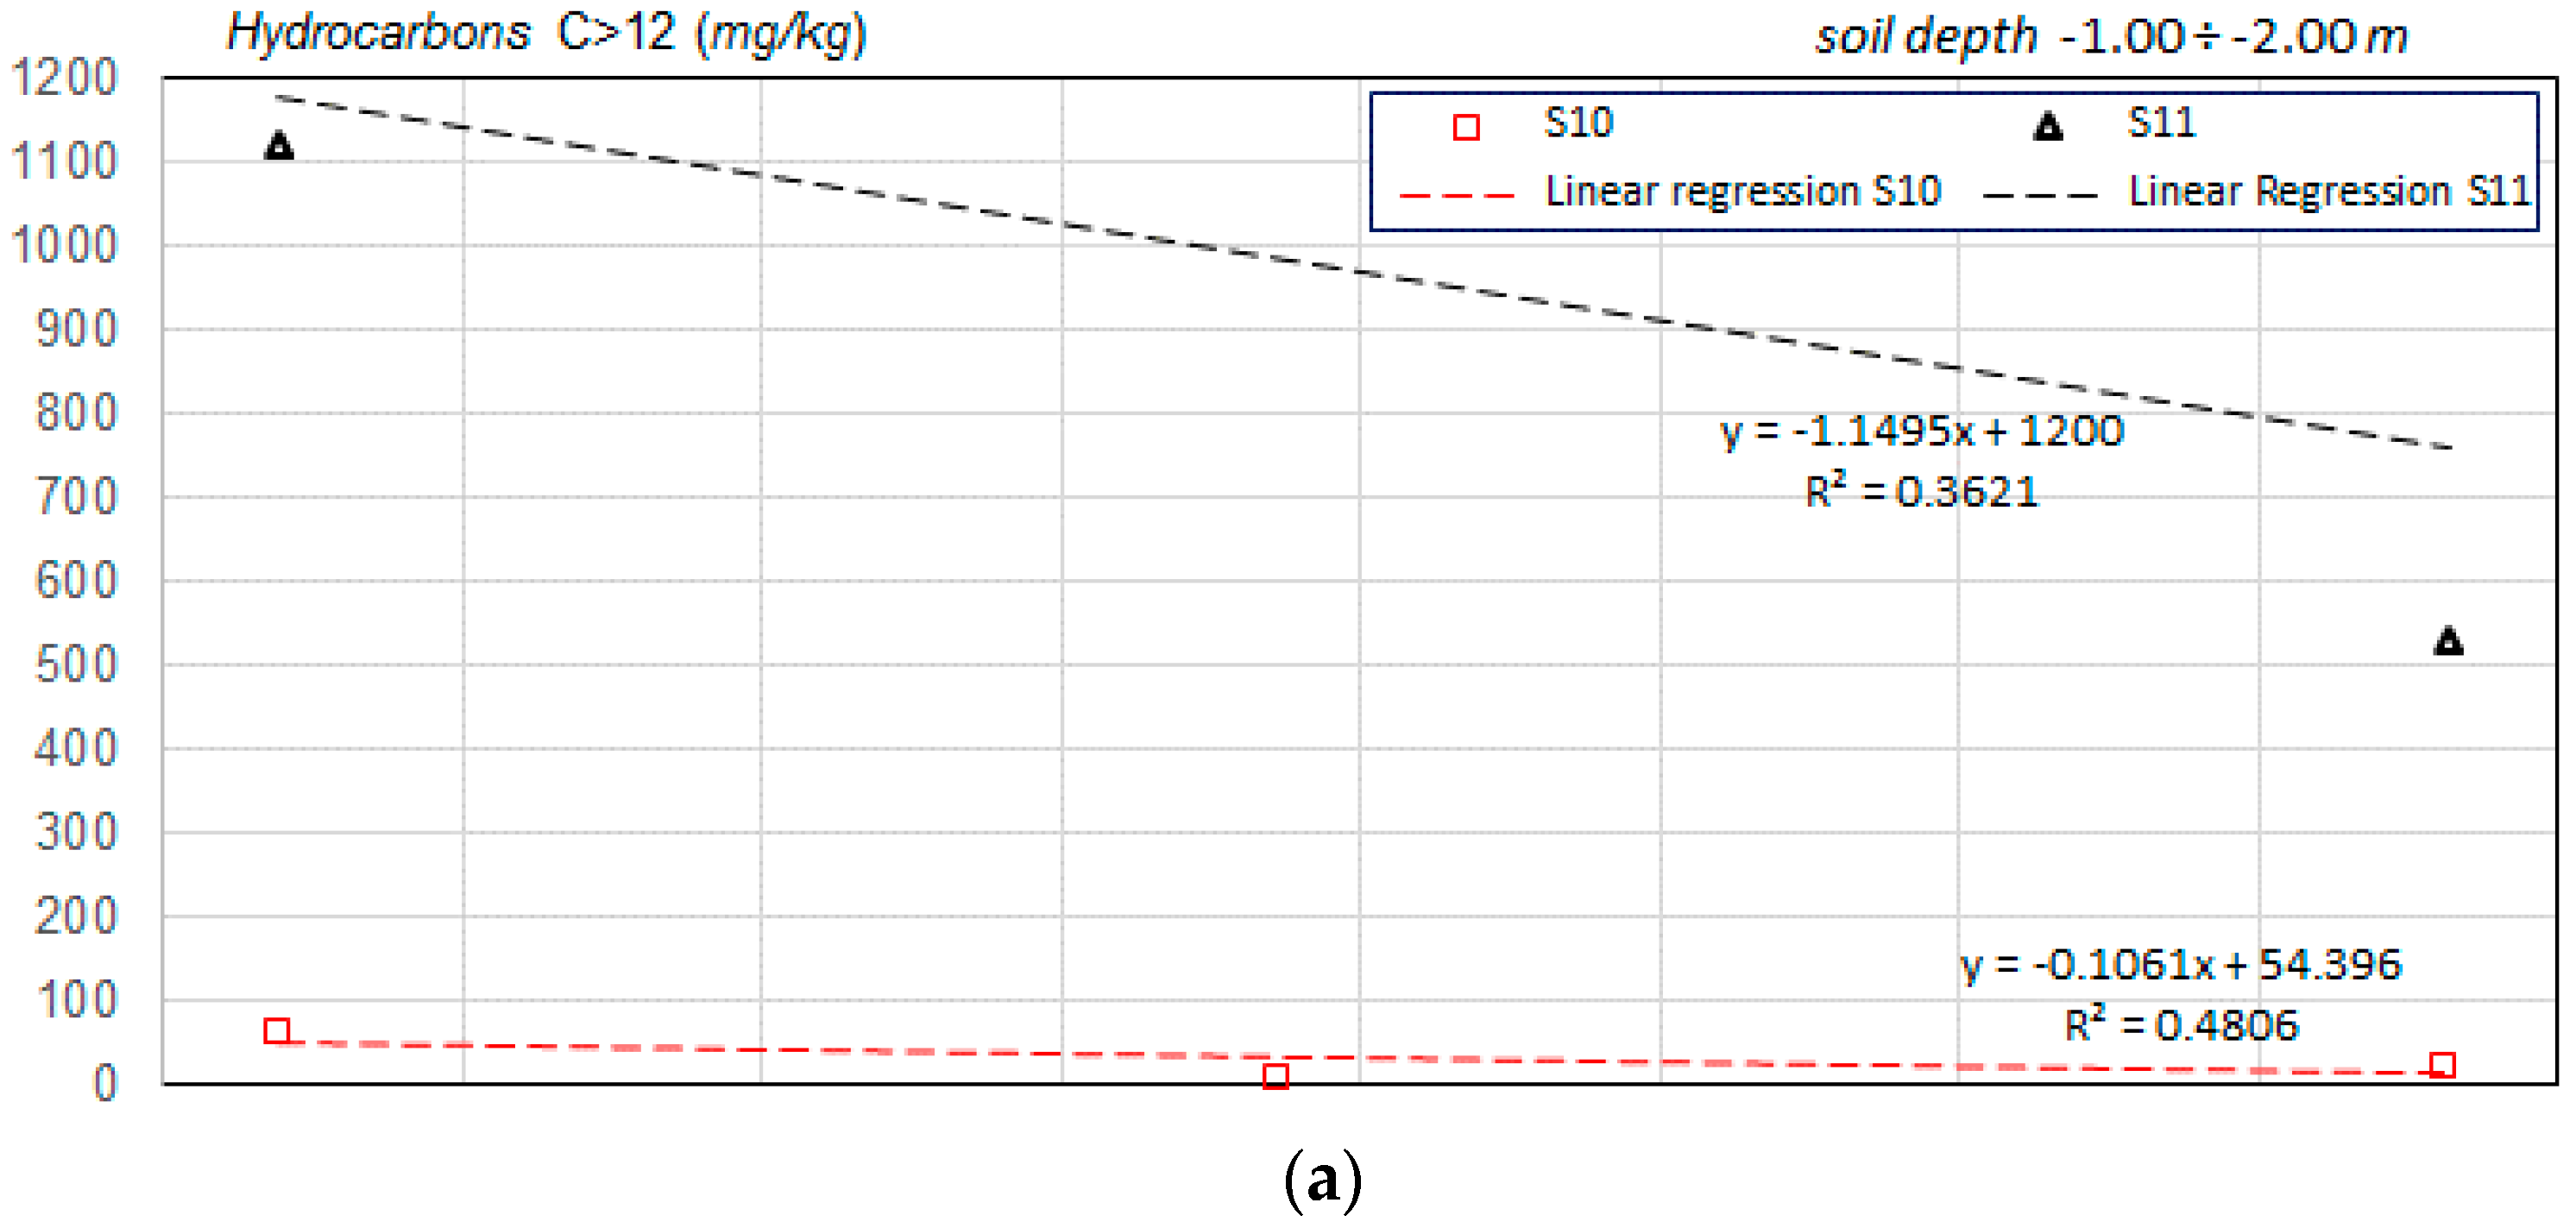
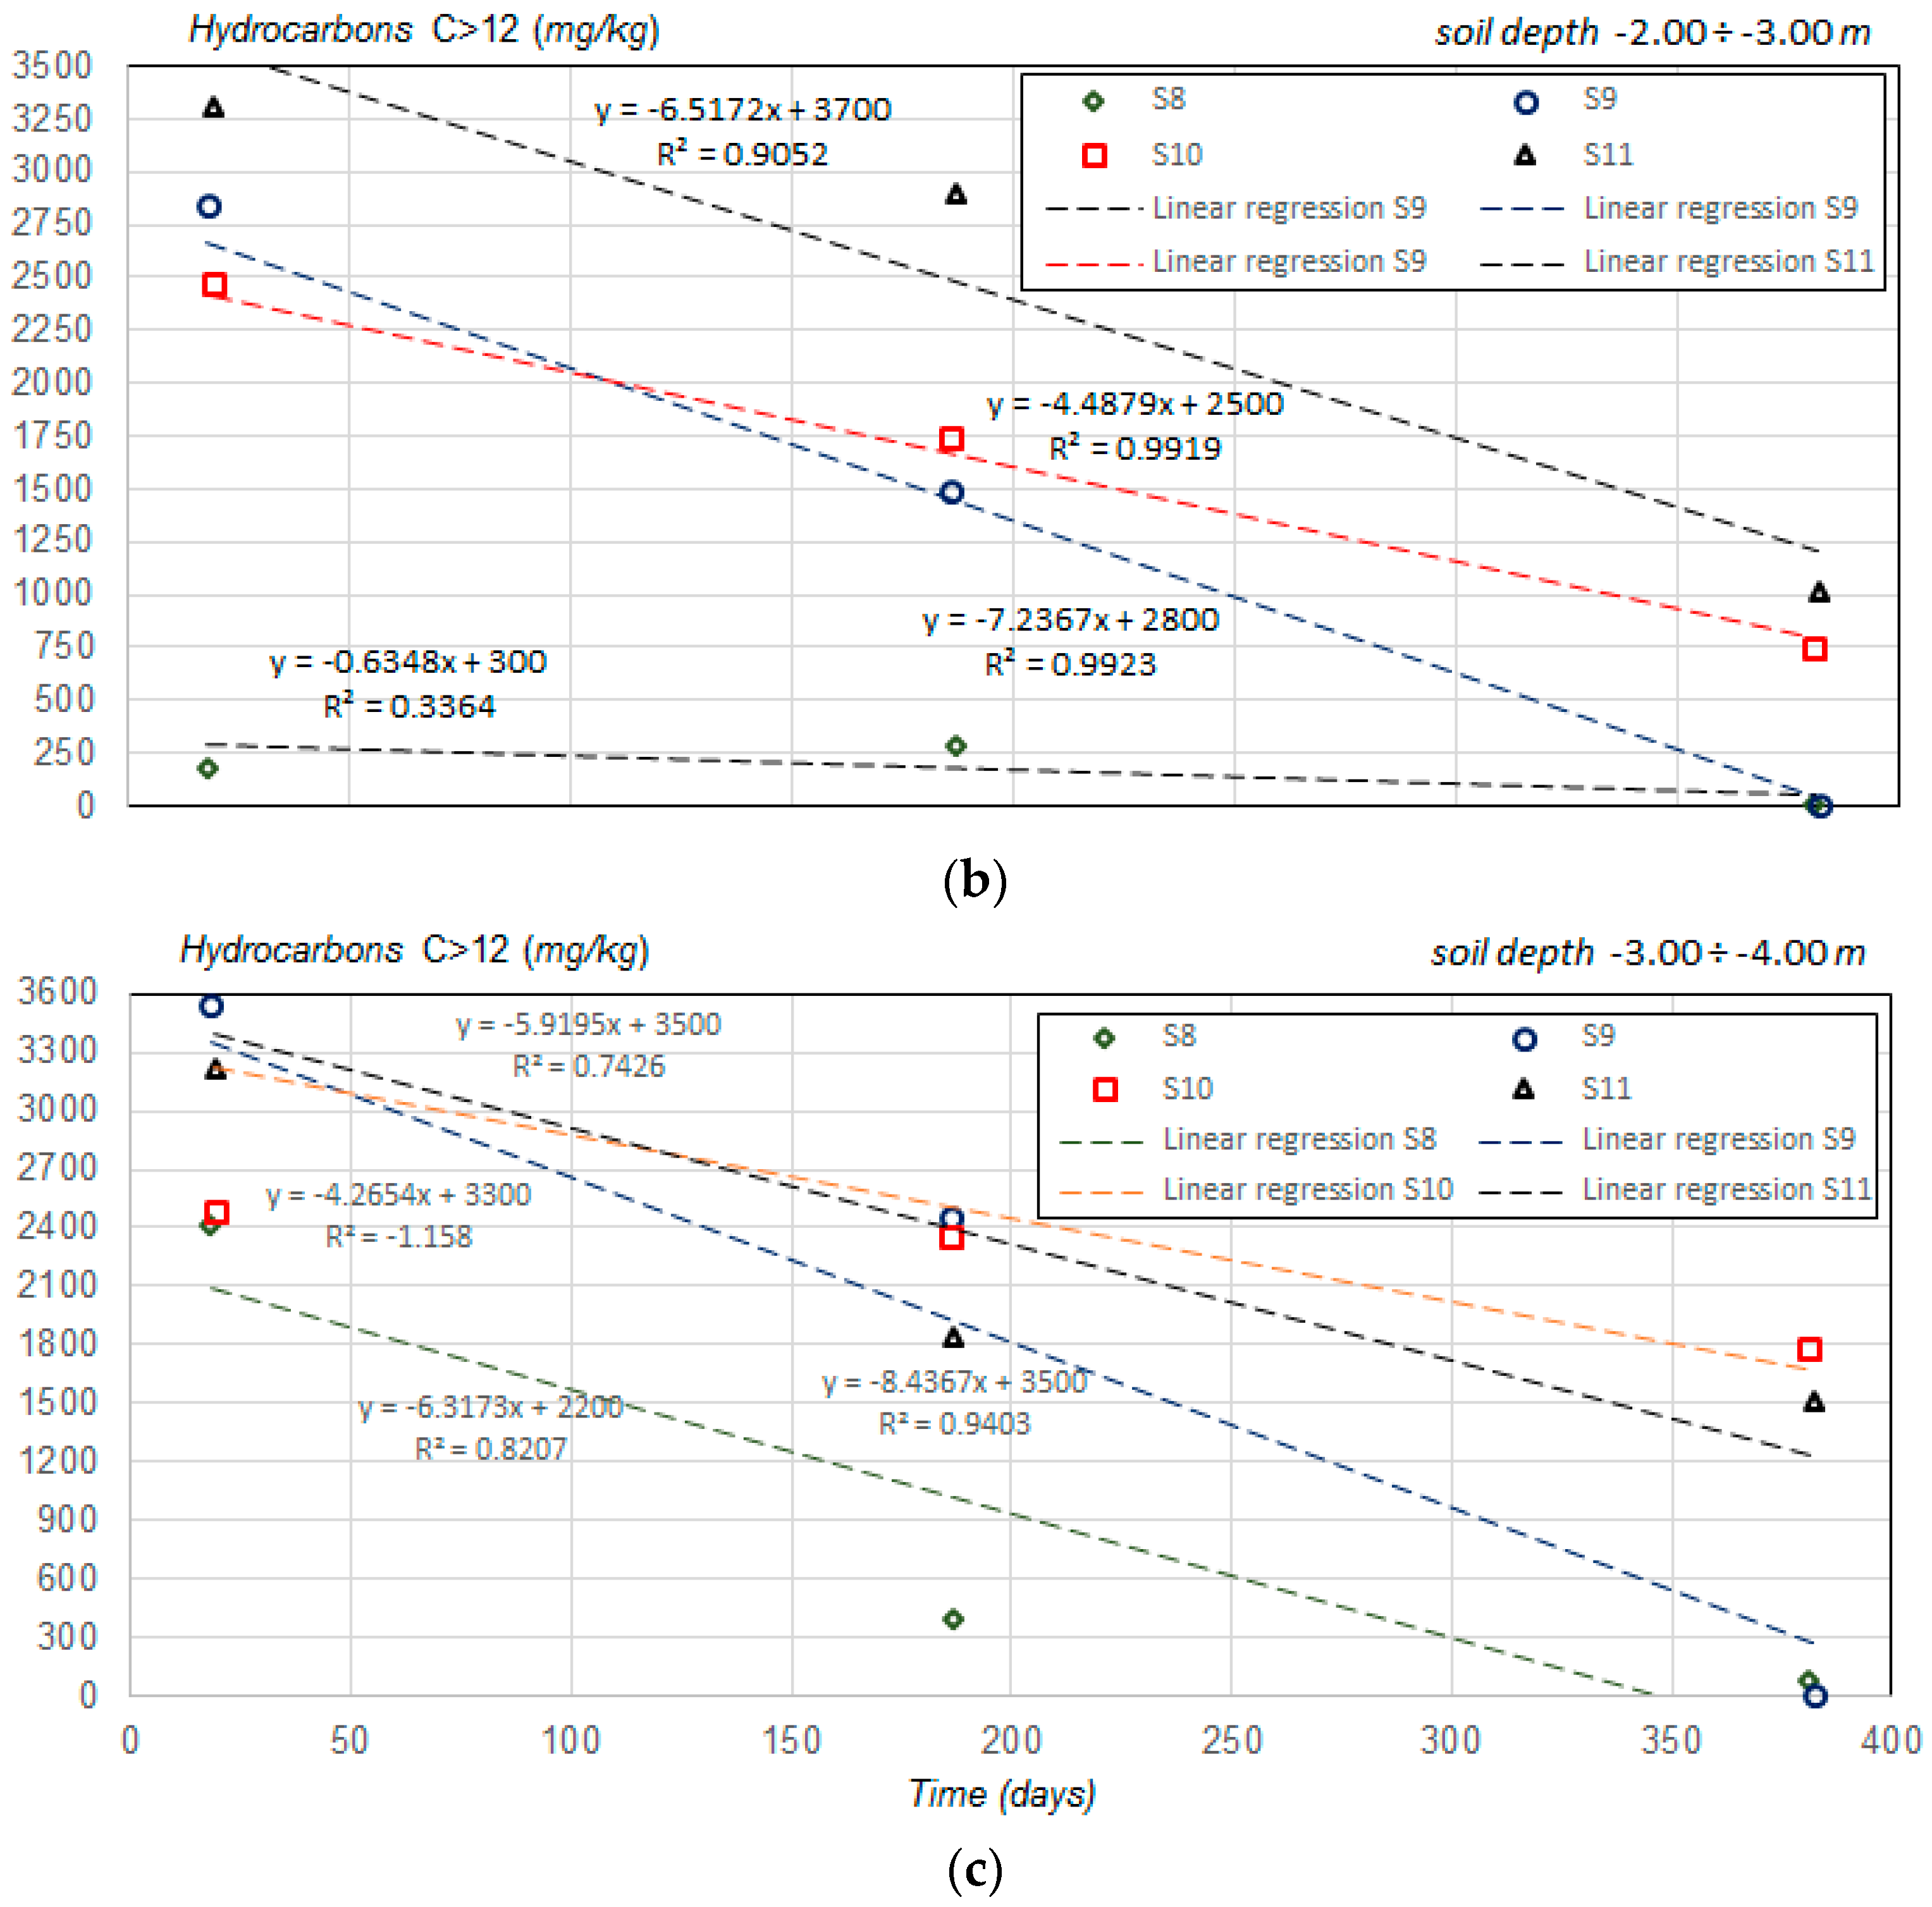
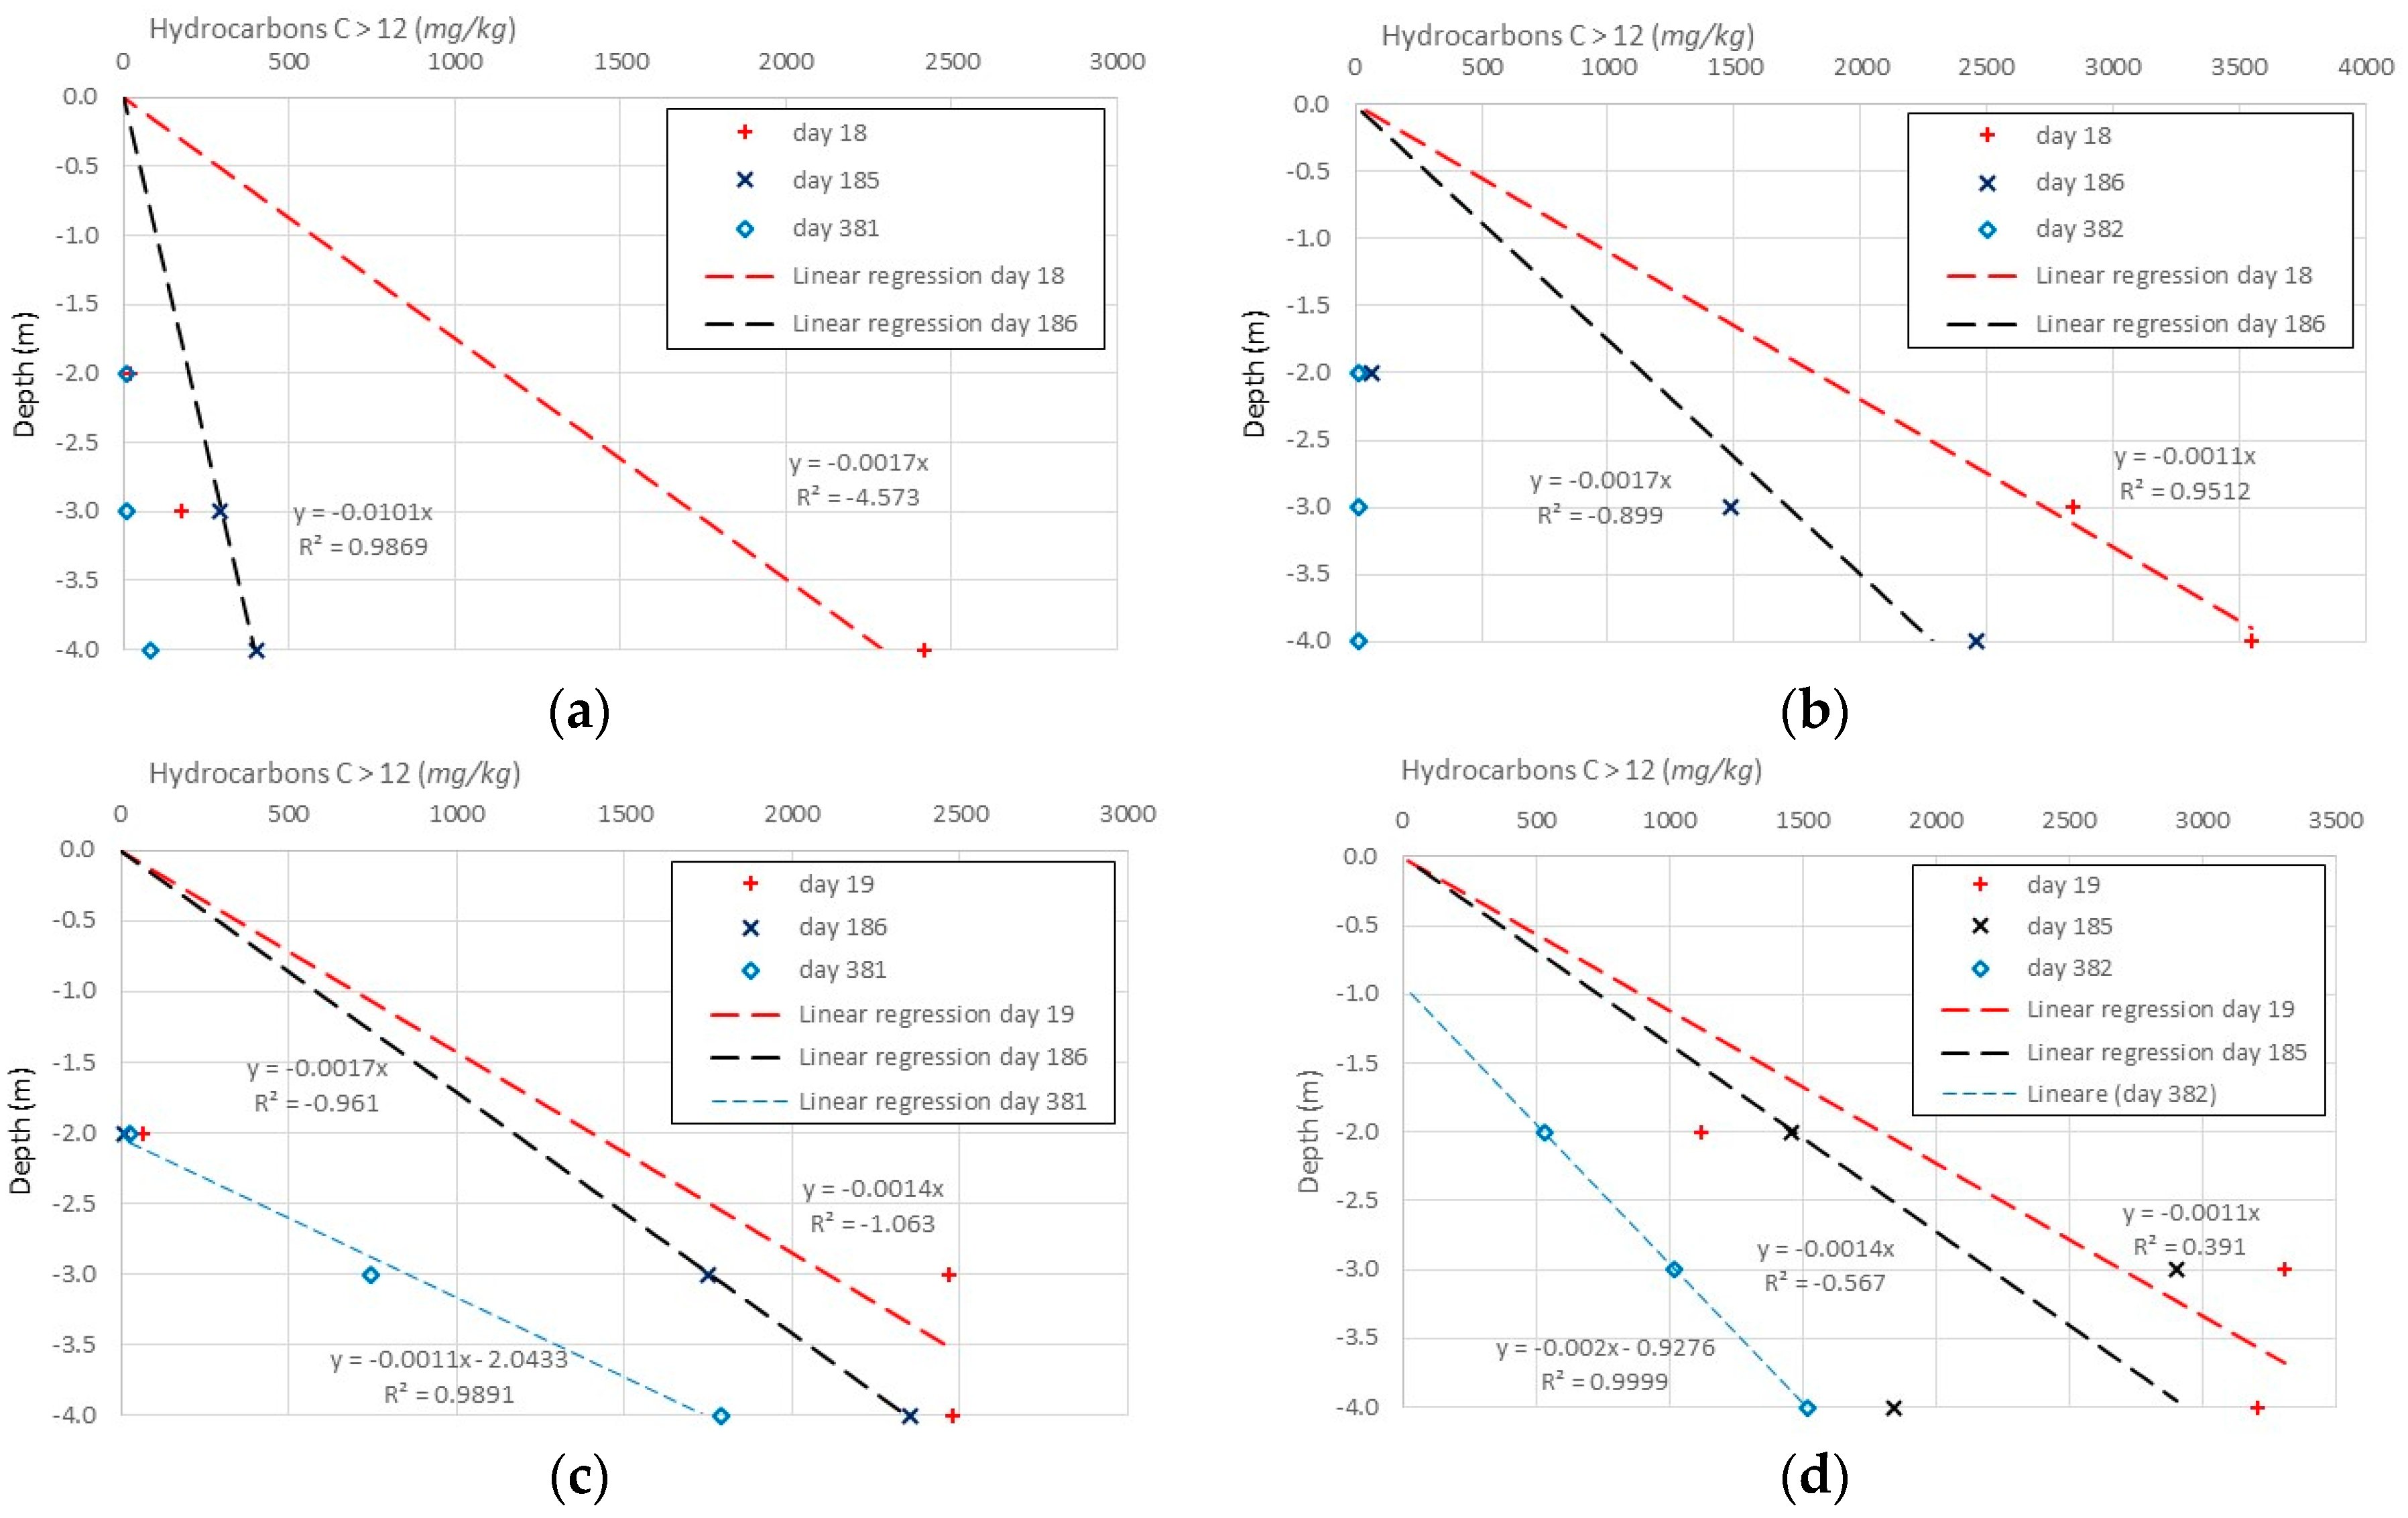
Figure 9 and Figure 10 show the trend in time of the concentrations of light and heavy hydrocarbons during the drilling campaigns.
The results relative to the analysis of the collected soil samples showed the attainment of the remediation goals for light hydrocarbons, with values of about 5 mg/kg. The linear regression applied to the observed points can provide an approximative representation of removal process and the decrease rate in the application time of the treatment. The values of the removal rate for light hydrocarbons, in the more representative regressions, vary in a range of 0.5 ÷ 1.9 mg/kg·day.
Results for the heavy hydrocarbons showed a significative results of the remediation action: we observed an high decrease of concentrations in sites S8 and S9 in the one-year treatment.
In order to achieve the remediation goals fixed by the national law, yet we should observe that in some critical sites next to the centre of the spill, S10 and S11, the process showed a moderate efficient yield so that the overall remediation requires a long time to obtain an optimal quality level.
The linear regression applied to the observed points of heavy hydrocarbons gives values of the removal rate varying in a range of 4.2 ÷ 8.5 mg/kg·day.
LNAPLs pass through the permeable formation of sediments and the main diffusion process of pollutant develops down the insature soil. In the long term, a large part of the pollutants accumulates in the lower layers of the soil, next to the free surface of groundwater. At the same time, a higher decrease of polluting substances can be observed at the longer distance from the centre of the diesel spill.
The injection in soil of mixtures of allochthonous bacteria proved to be very advantageous but the optimal application of the biological process needs controlled conditions and effective monitoring.
Figure 11 and Figure 12 show the trend of concentrations of light and heavy hydrocarbons in soil below groundwater in the sample sites S8, S9, S10 and S11. The linear regression applied to the observed points of heavy hydrocarbons give values of the removal rate varying in a range of 4.2 ÷ 8.5 mg/kg·day. A regression was provided in the graph to represent the trend of pollutants concentration in the vertical axis. The lines show the decrease of pollutant at the time of treatment.
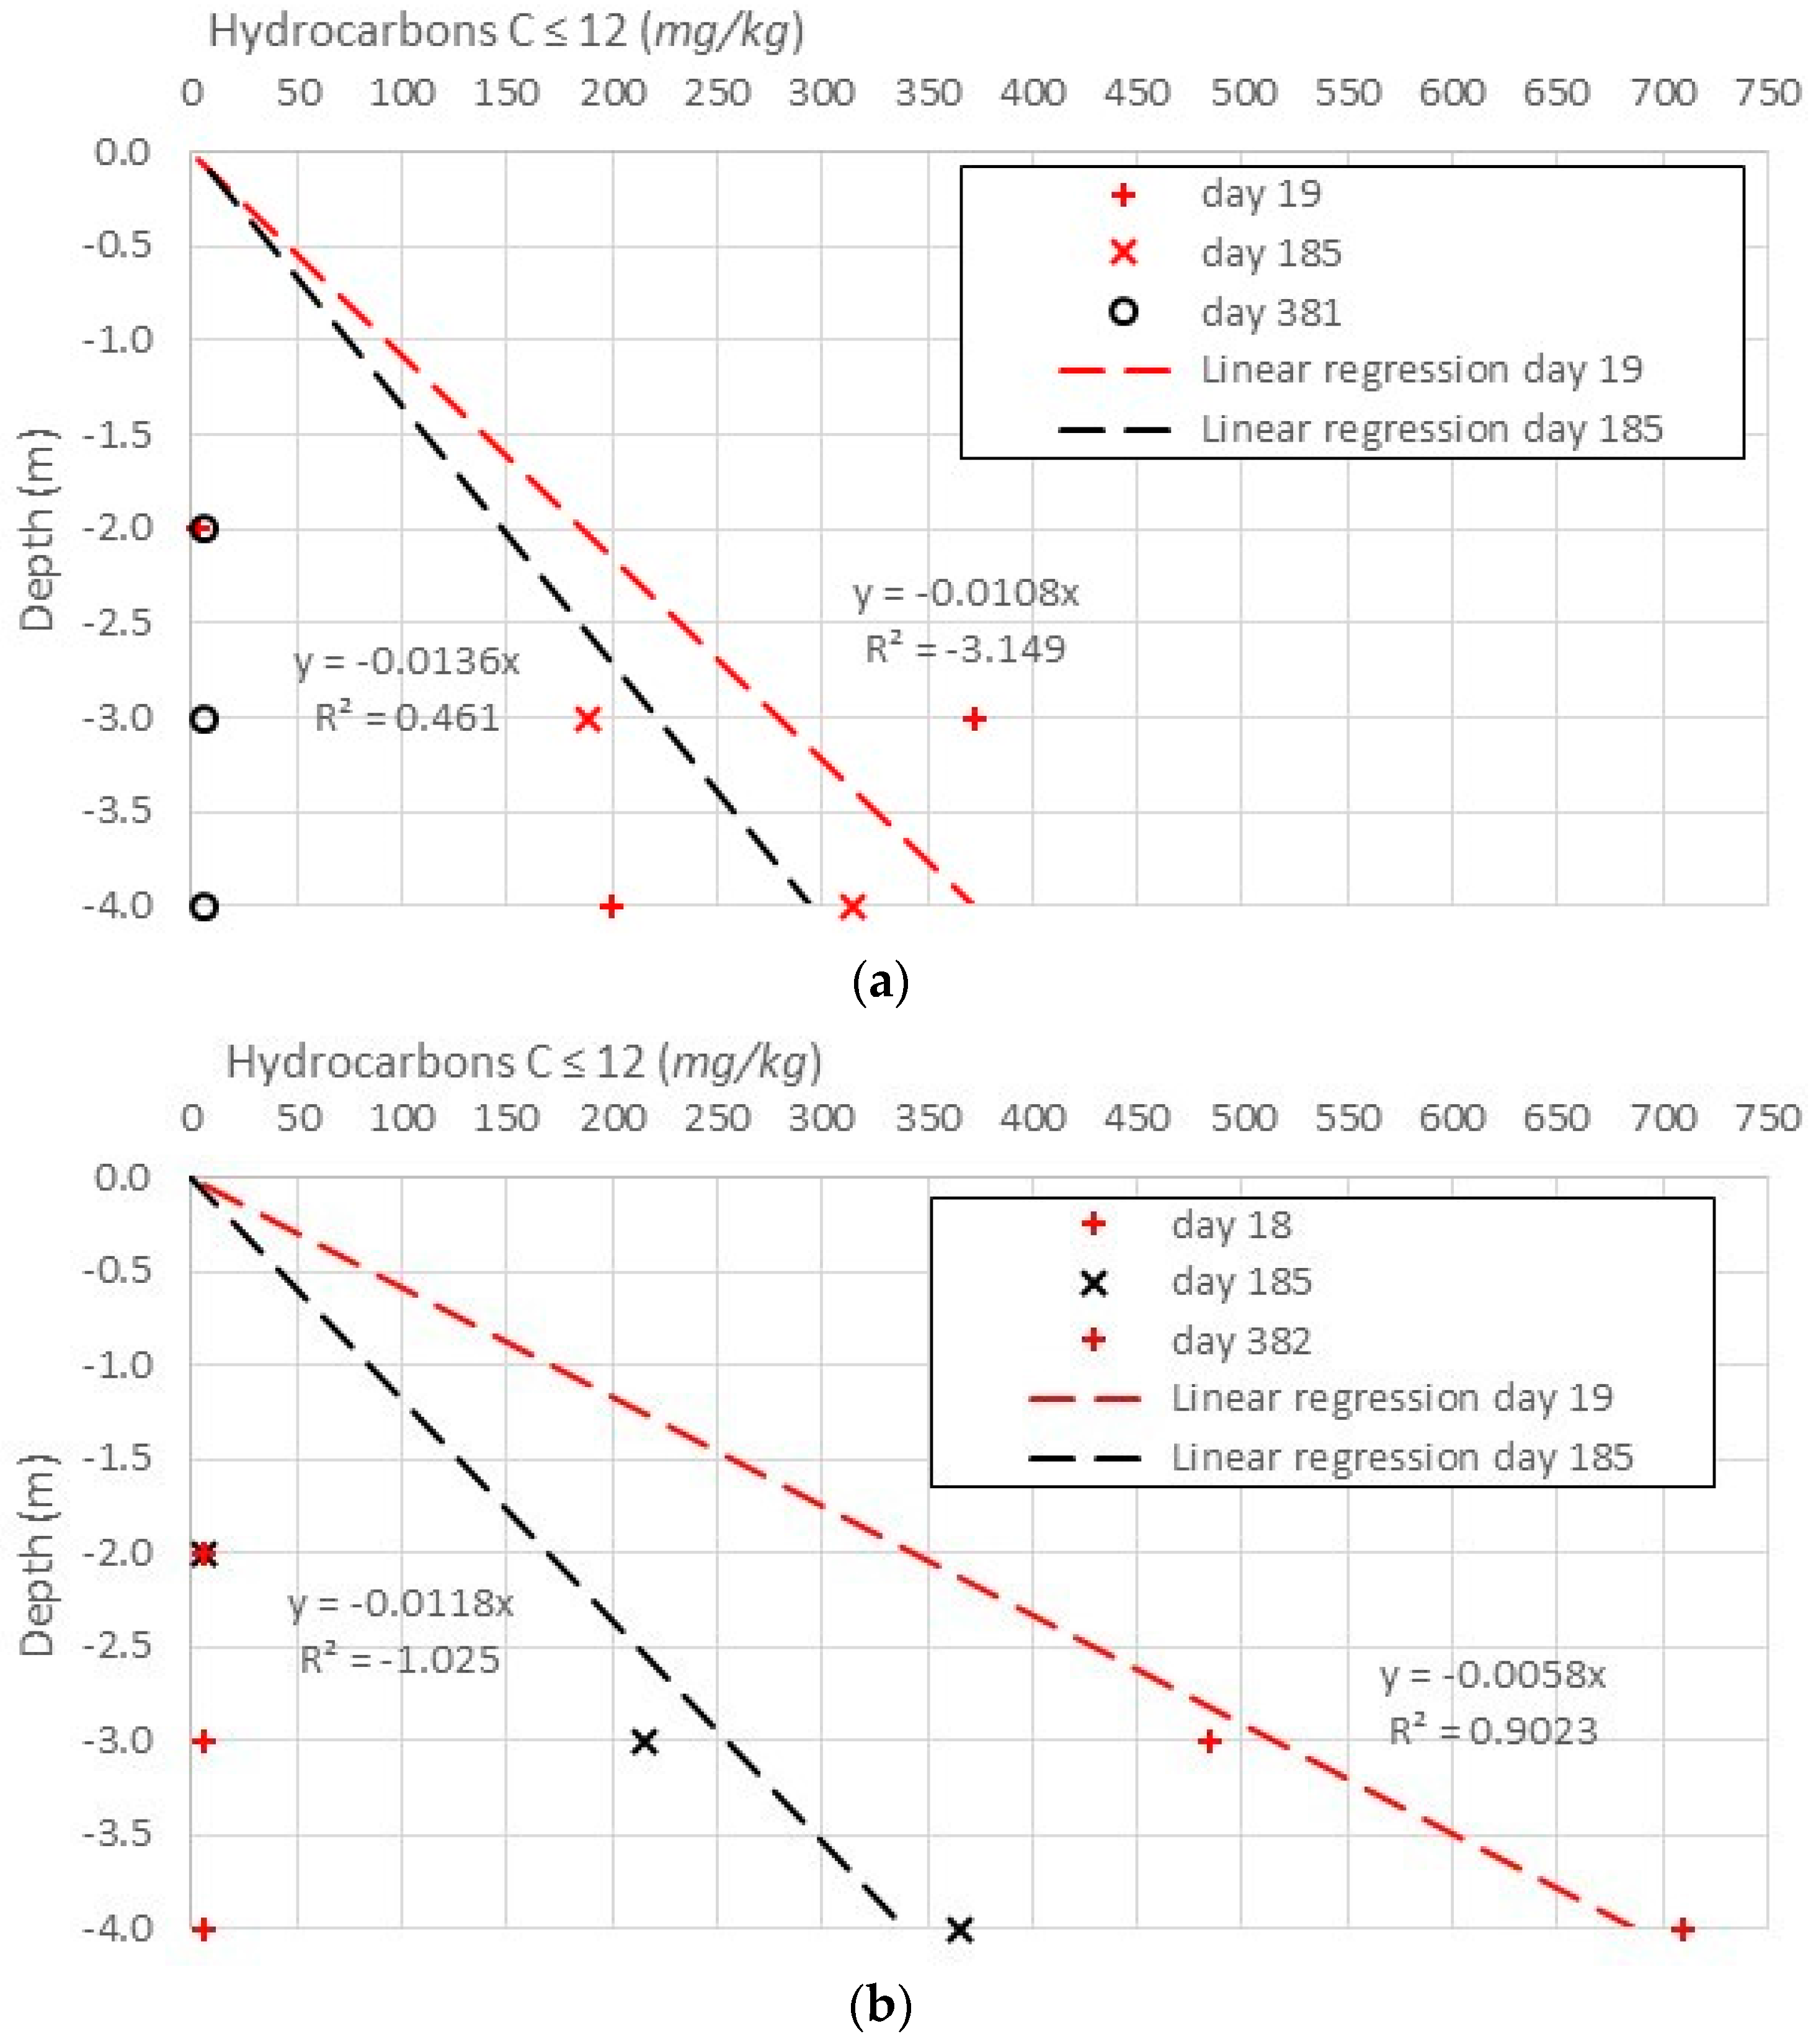
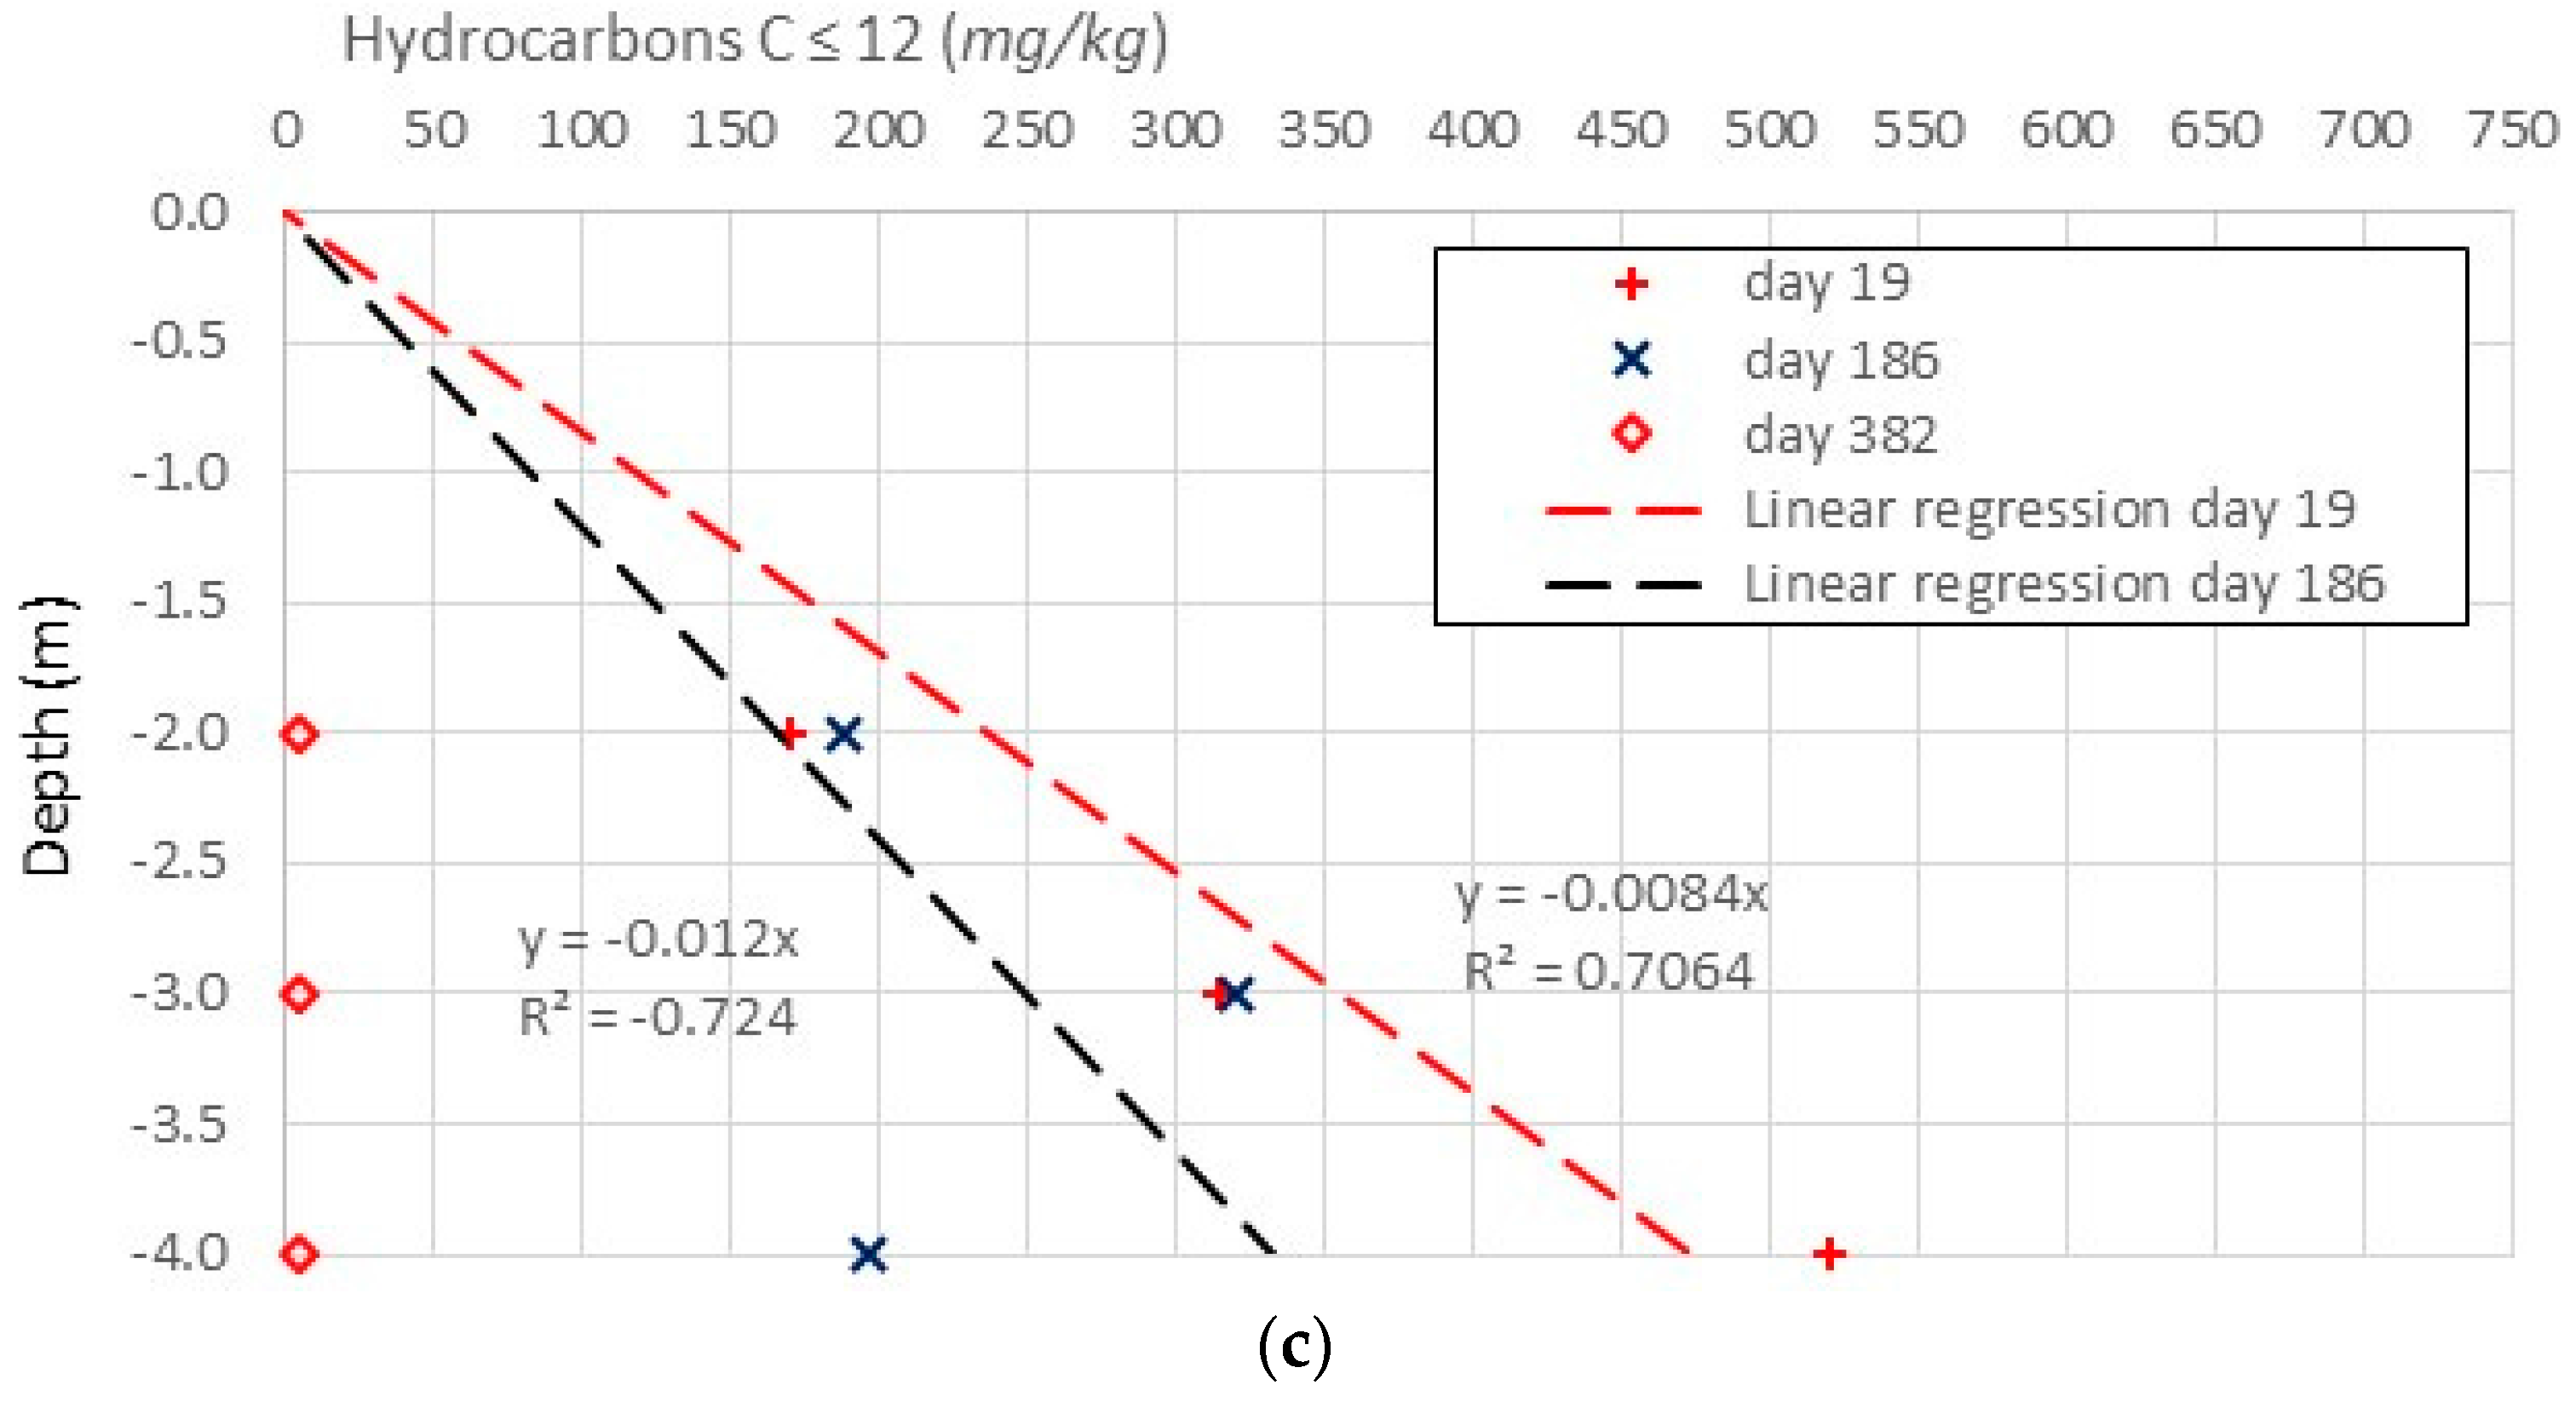
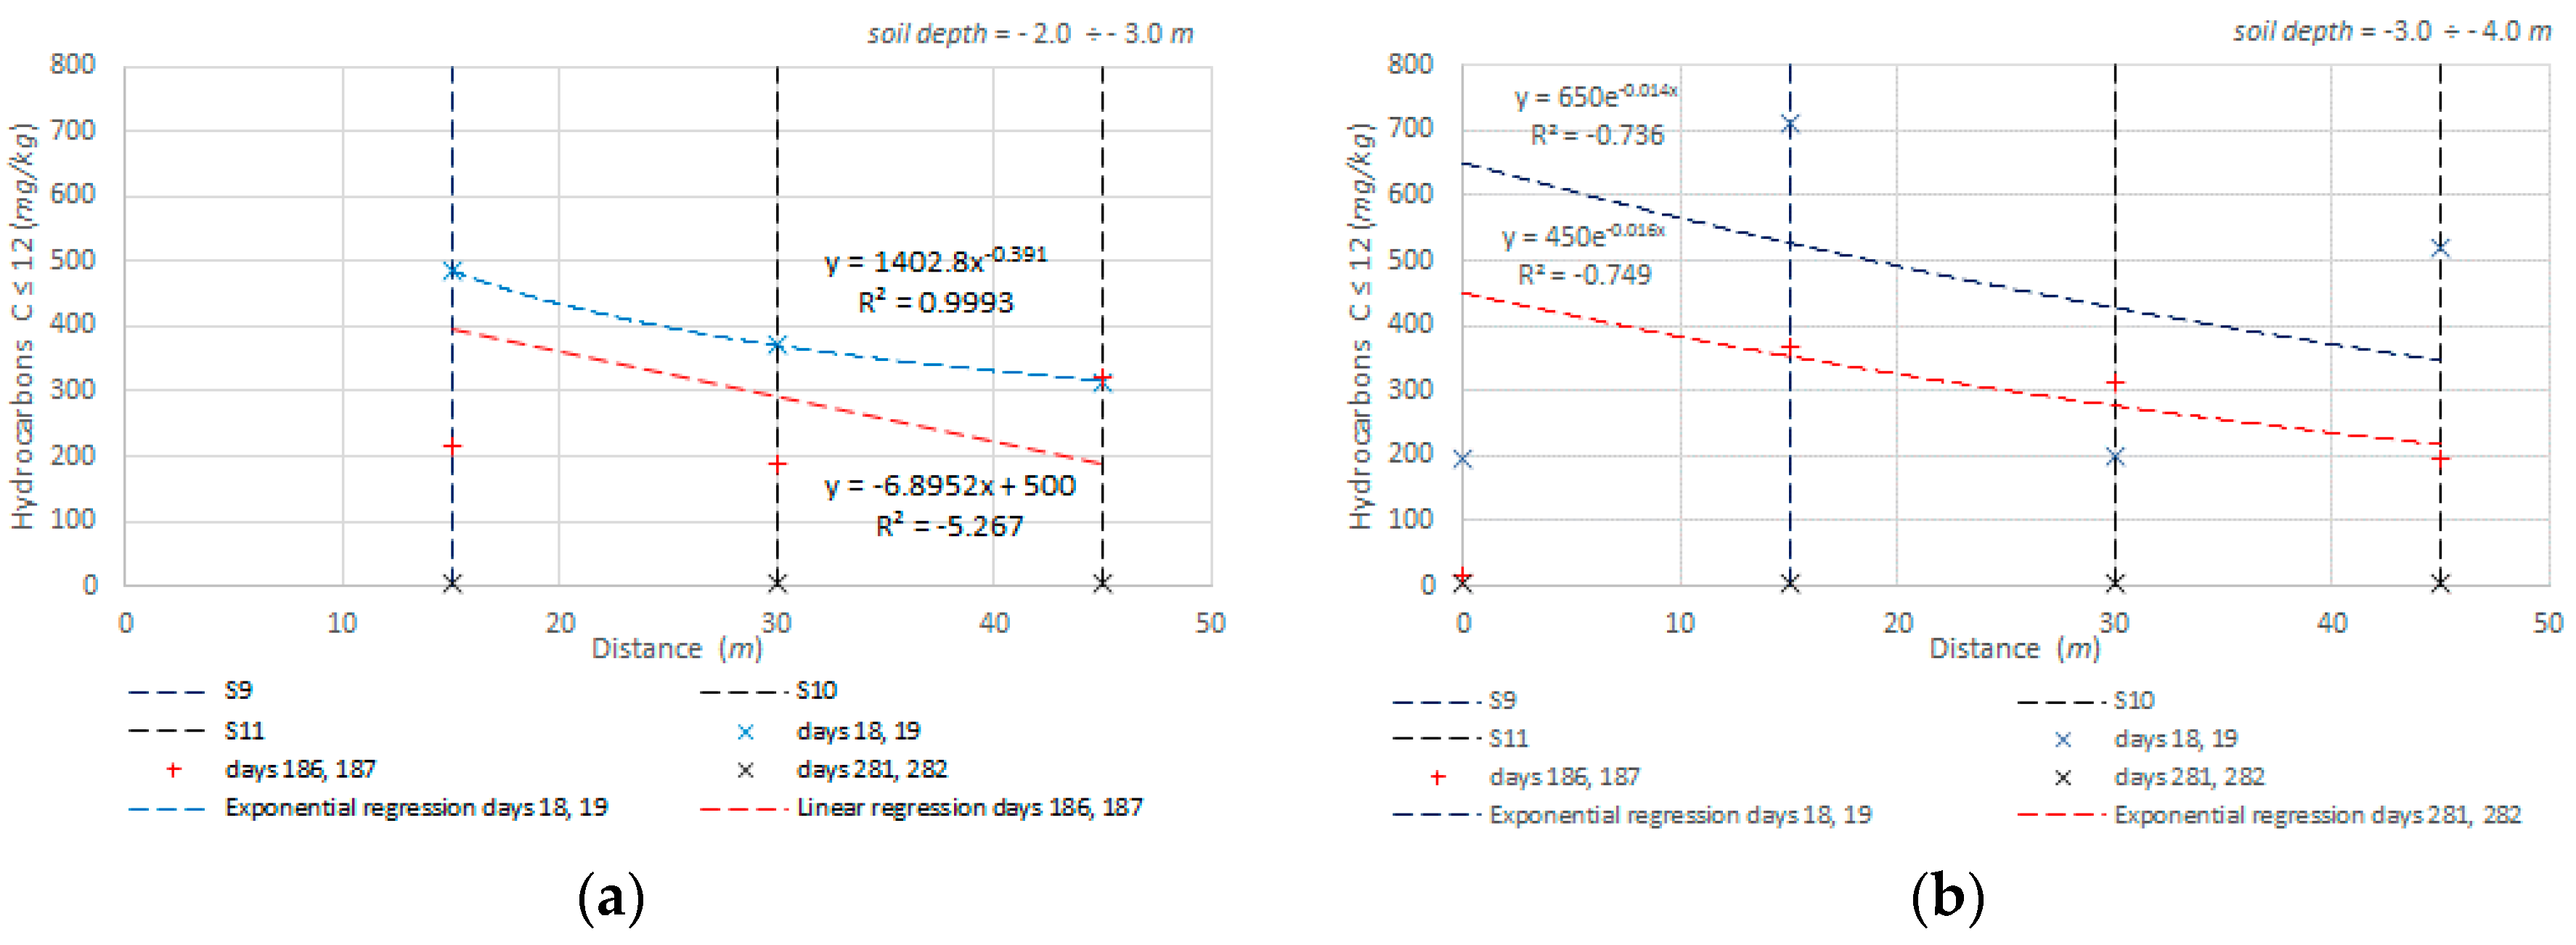
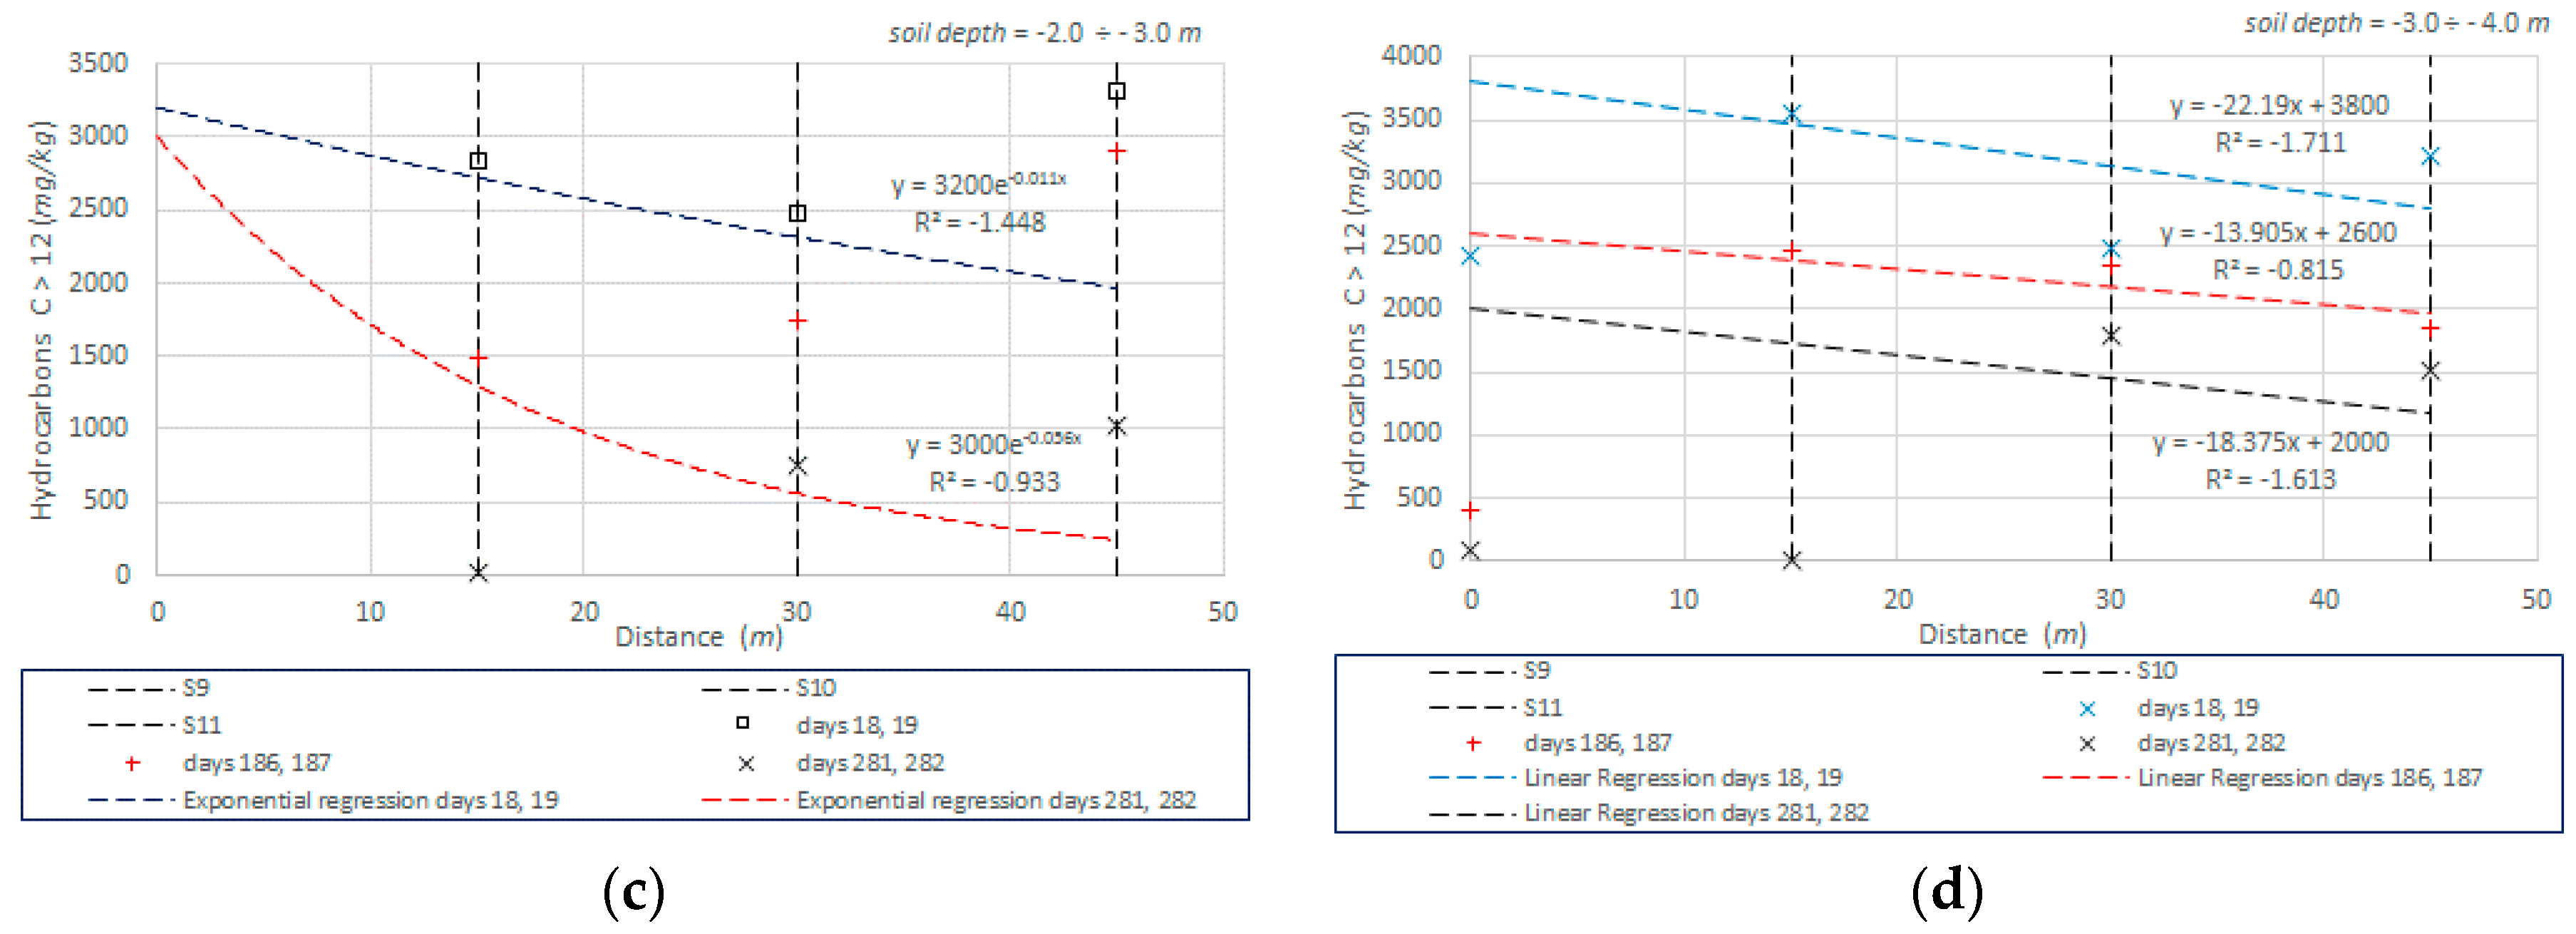
Figure 13 reports the trend of light and heavy hydrocarbons in the vertical axis of soil for different depths, in four sampling sites, S8, S9, S10 and S11, which are placed on a main direction at a relative distance of about 15 m. The exponential regression applied to the observed points can provide an approximative representation of the decrease of pollutant concentration from the centre of the spill to the peripheral zones. The curves show that the pollutant concentration decreases in the time that the treatment takes place.
The residual concentrations of the light hydrocarbons respect the quality level prescribed by national law. The concentrations of the heavy hydrocarbons present higher values. That is first due to the highest initial accumulation of pollutant into the unsaturated zone. The treatment process encounters resistance in the pollutant’s removal, mainly because of substances which remain attached in the so-called “capillary fringe” zone, where water is retained by capillary forces above the water table, which, being in more thick layers, is slow to degrade.

4. Conclusions

The topic of soil remediation is an issue of great concern. The present paper described a case study concerning the contamination of soil and groundwater due to an accidental spill of diesel fuel. The results of the application of a technical and methodological approach aimed to remove hydrocarbons have been reported. In the presented case study, the application of bioremediation techniques coupled with a physical chemical treatment using soil vapour extraction produced an improvement in soil contamination levels in the unsaturated soil that were even below the Italian legal limits.
During a first phase, the “emergency” and “safety” operations on the contaminated site were carried out. The hazard for the surrounding environment was considered to be severe and, first, contaminated soil was excavated in the more polluted surface layers that were most affected by the contamination. The contaminated soil was replaced with a clean soil. At the same time, contaminated groundwater was rapidly captured, extracted and treated by a “pump and treat” system.
Once the state of pollution was determined, in presence of high pollutant concentrations of heavy hydrocarbons, it was decided to carry out the soil remediation in situ. A train of physico-chemical and biological process was applied for the in situ treatment of sub-soil. The applied technologies were selected because of the used equipment and facilities are very similar. Combined, they can be arranged to work in the operative phases.
The physico-chemical process properly combined with the biological process allowed us to obtain satisfactory results. Relative to the light hydrocarbons, the limits prescribed by Italian law were diffusely obtained. Regarding the heavy hydrocarbons, good removal rates was attained in the site characterized with lower concentration, but some critical sites remained to be solved after a one-year treatment where concentrations were the highest.
Concerning the biological process, we should make evident that many efforts have to be made for the improvement in the application of these technologies and to make the yield of the treatment more efficient. The feasibility is influenced by the optimization of a biological environment in sub-soil.

Author Contributions

All authors gave the same contribution to the work and approved the final version of the manuscript.

Conflicts of Interest

The authors declare no conflict of interest.

References

  1. Davis, G.B.; Johnston, C.D.; Thierrin, J.; Power, T.R.; Patterson, B.M. Characterising the distribution of dissolved and residual NAPL petroleum hydrocarbons in unconfined aquifers to effect remediation. AGSO J. Aust. Geol. Geophys. 1993, 14, 243–248. [Google Scholar]
  2. Newell, C.; Acree, S.; Ross, R.; Huling, S. Light Nonaqueous Phase Liquids; U.S. Environmental Protection Agency: Washington, DC, USA, 1995.
  3. Konečný, F.; Boháček, Z.; Müller, P.; Kovářová, M.; Sedláčková, I. Contamination of soils and groundwater by petroleum hydrocarbons and volatile organic compounds––Case study: ELSLAV BRNO. Bull. Geosci. 2003, 78, 225–239. [Google Scholar]
  4. Malk, V.; Tejera, E.B.; Simpanen, S.; Dahl, M.; Mäkelä, R.; Häkkinen, J.; Kiiski, A.; Penttinen, O.-P. NAPL migration and ecotoxicity of conventional and renewable fuels in accidental spill scenarios. Environ. Sci. Pollut. Res. 2014, 21, 9861–9876. [Google Scholar] [CrossRef] [PubMed]
  5. Nadim, F.; Hoag, G.E.; Liu, S.; Carley, R.J.; Zack, P. Detection and remediation of soil and aquifer systems contaminated with petroleum products. J. Petrol. Sci. Eng. 2000, 26, 169–178. [Google Scholar] [CrossRef]
  6. Tomlinson, D.; Thornton, S.; Thomas, A.; Leharne, S.; Wealthall, G. An Illustrated Handbook of LNAPL Transport and Fate in the Subsurface; Environment Agency: Bristol, UK, 2015.
  7. Biswas, S.; Chaudhari, S.K.; Mukherji, S. Microbial uptake of diesel oil sorbed on soil and oil spill clean-up sorbents. J. Chem. Tech. Biotechnol. 2005, 80, 587–593. [Google Scholar] [CrossRef]
  8. Lien, P.; Yang, Z.; Chang, Y.; Tu, Y.; Kao, C. Enhanced bioremediation of TCE-contaminated groundwater with coexistence of fuel oil. Chem. Eng. J. 2016, 289, 525–536. [Google Scholar] [CrossRef]
  9. Nadim, F.; Carley, R.J.; Perkins, C.; Hoag, G.E.; Dahmani, A.M.; Liu, S. Remediation Options for Sites Contaminated with Petroleum Products in the United States: Historical Overview and Best Applicable Technologies; The Environmental Research Institute, University of Connecticut: Storrs, CT, USA, 2002. [Google Scholar]
  10. National Environment Protection Council. National Environment Protection (Assessment of Site Contamination) Measure; National Environment Protection Council: Canberra, Australia, 2013.
  11. Rahbeh, M.E.; Mohtar, R.H. Application of multiphase transport models to field remediation by air sparging and soil vapor extraction. J. Hazard. Mater. 2007, 143, 156–170. [Google Scholar] [CrossRef] [PubMed]
  12. Rasmusson, K.; Rasmusson, M. NAPL Spill Modeling and Simulation of Pumping Remediation. Master’s Thesis, Uppsala University, Uppsala, Sweden, December 2009. [Google Scholar]
  13. Meegoda, J.N.; Ezeldin, A.S.; Fang, H.Y.; Inyang, H.I. Immobilization Technologies. J. Hazard. Toxic Radioact. Waste Manag. 2003, 7, 46–58. [Google Scholar] [CrossRef]
  14. Pasha, Y.A.; Aflaki, E.; Hu, L.; Meegoda, J.N. Effect of soil fabric on transport of a LNAPL through unsaturated fine grained soils: A centrifugal model study. Soil Sediment Contam. 2013, 22, 223–240. [Google Scholar] [CrossRef]
  15. Luciano, A.; Viotti, P.; Torretta, V.; Mancini, G. Numerical approach to modelling pulse-mode soil flushing on a Pb-contaminated soil. J. Soils Sediments 2013, 1, 43–55. [Google Scholar] [CrossRef] [Green Version]
  16. Provincia di Treviso. Hydrogeological Chart. 2015. Available online: http://ows.provinciatreviso.it/geonetwork/srv/it/main.home (accessed on 20 October 2016).
  17. American Water Works Assn. Standard Methods for the Examination of Water and Wastewater, 22nd ed.; Rice, E.W., Baird, R.B., Eaton, A.D., Clesceri, L.S., Eds.; American Water Works Assn: Washington, DC, USA, 2012. [Google Scholar]
  18. Decreto Legislativo 3 Aprile 2006, n. 152: Norme in Materia Ambientale. Available online: http://www.camera.it/parlam/leggi/deleghe/06152dl.htm (accessed on 20 October 2016).
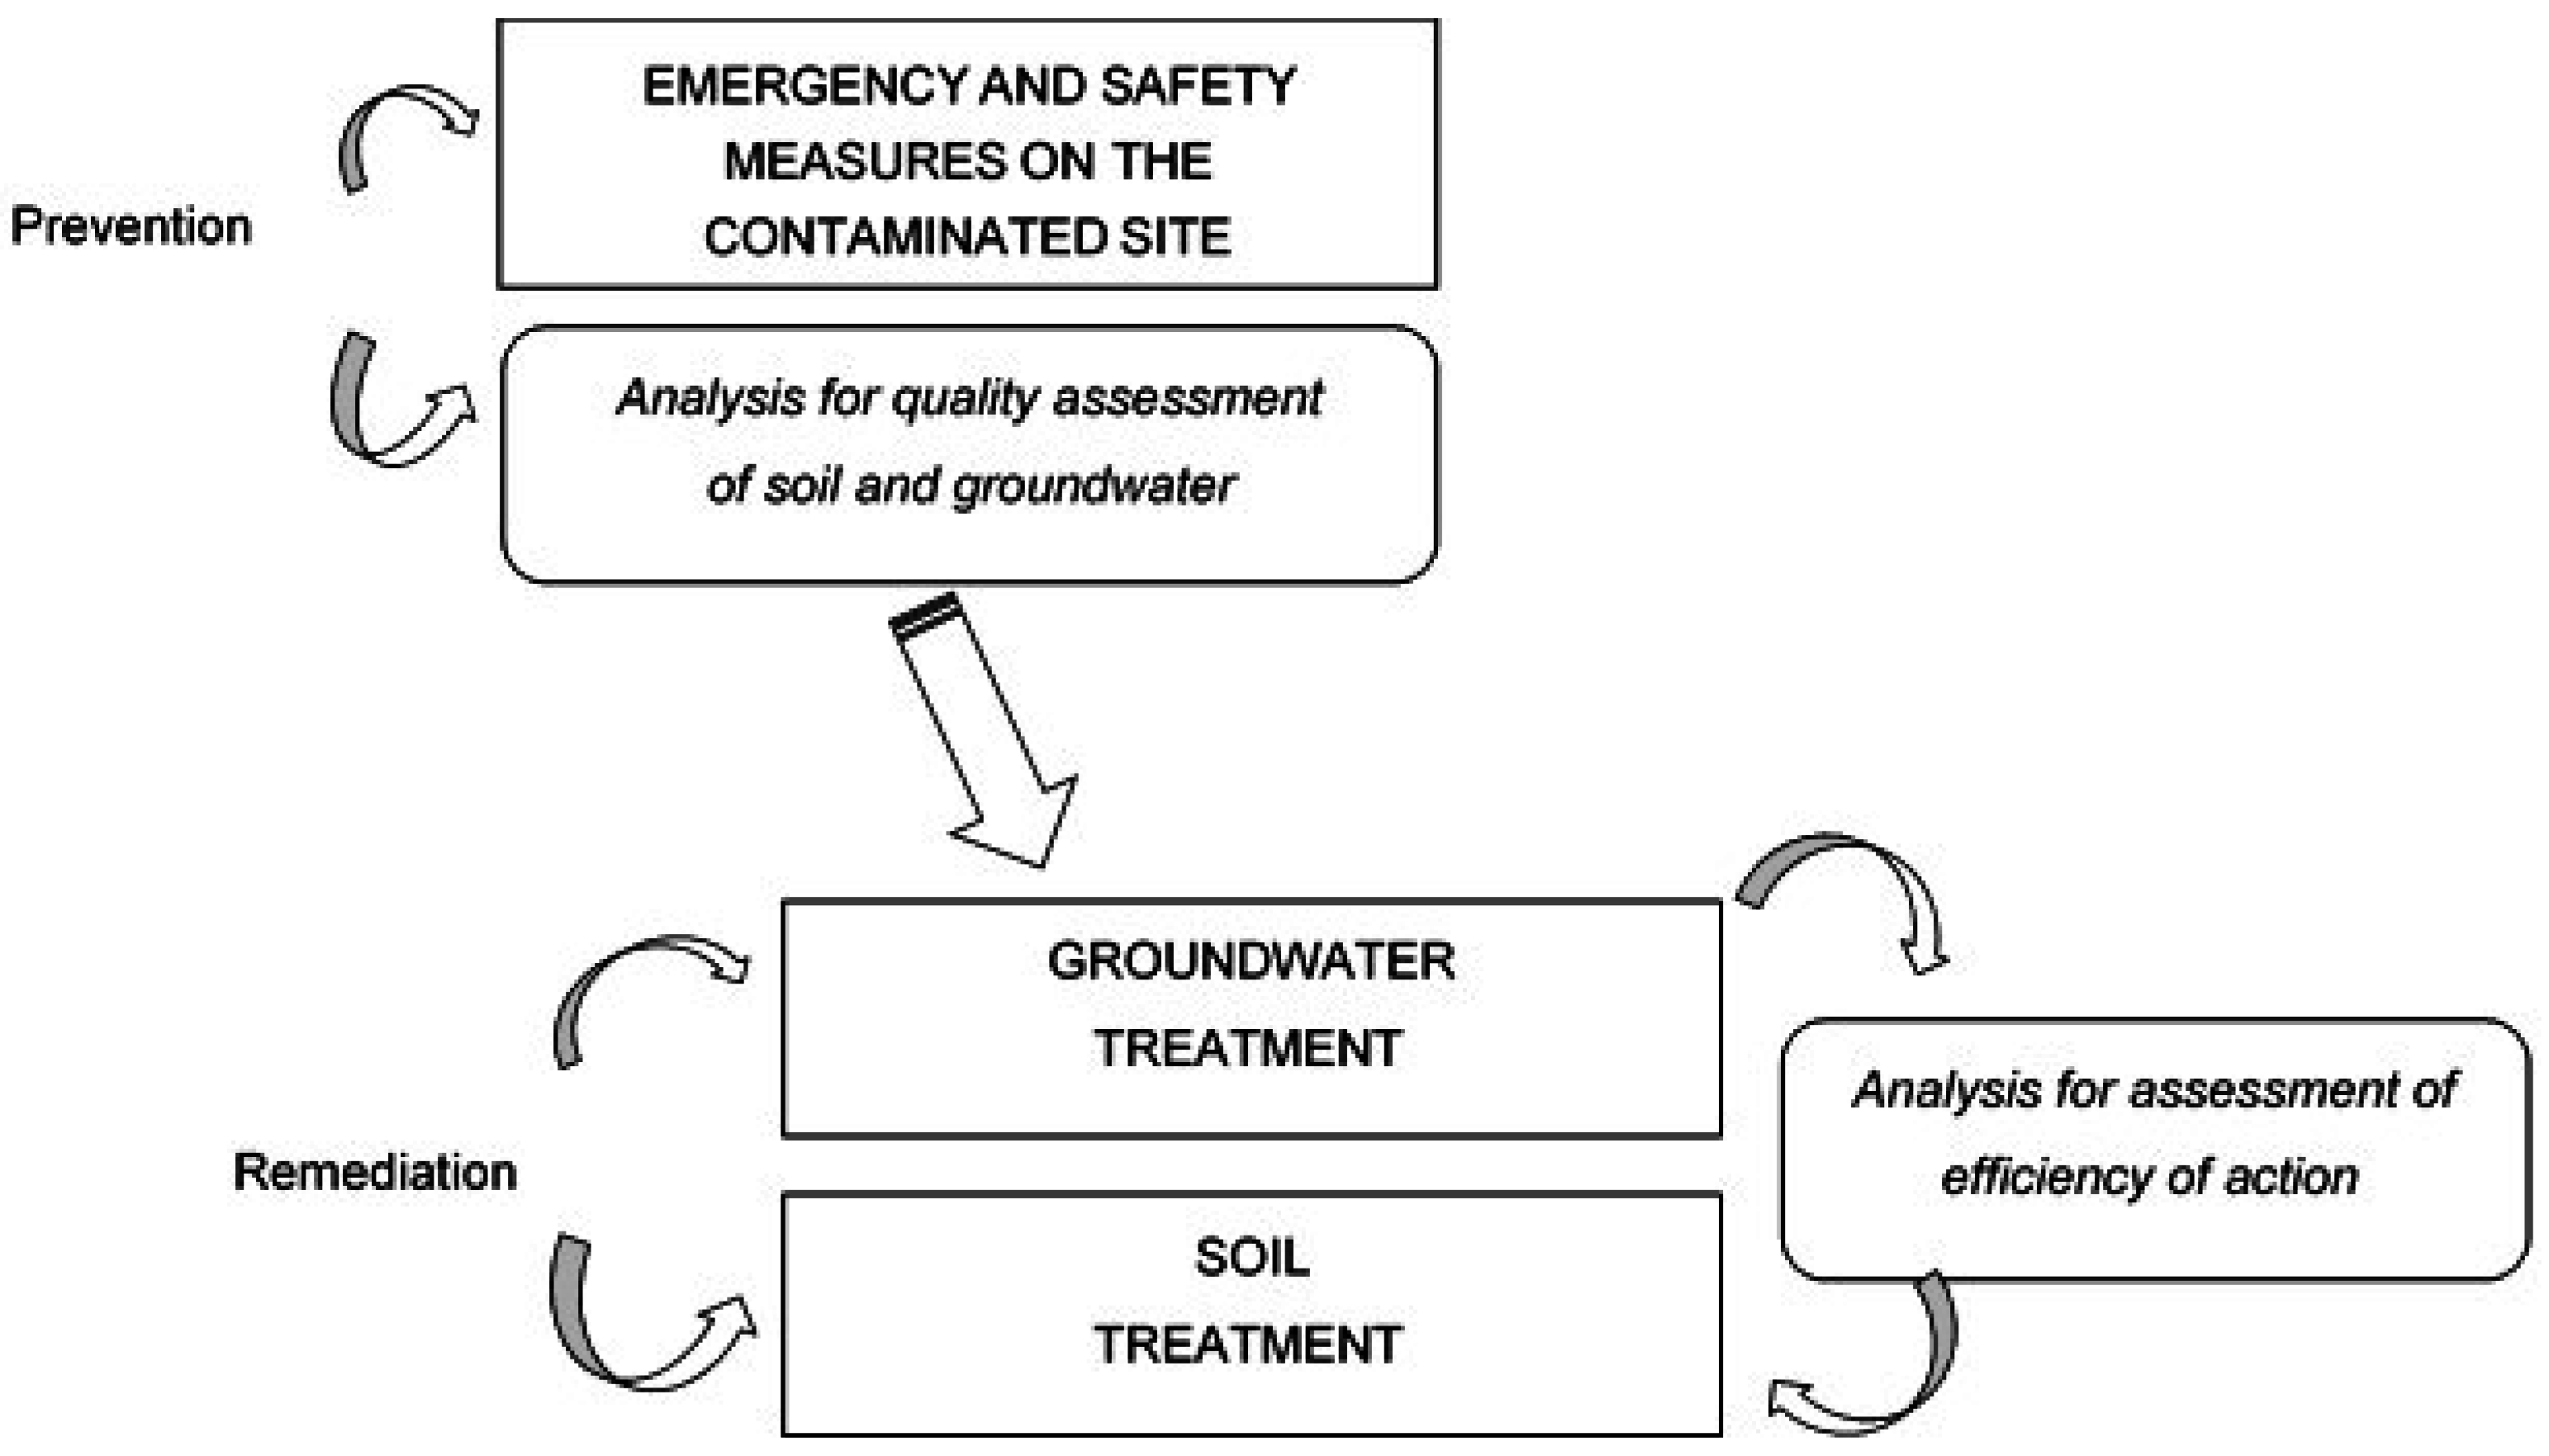
Figure 1. Guidelines for pollution control in contaminated site.
Sustainability 08 01086 g001
Figure 2. The layout of the soil vapour extraction treatment.
Sustainability 08 01086 g002
Figure 3. Hydrogeological characteristics of the analysed area: phreatic map of low-water discharge (a); map of the water table level (b).
Sustainability 08 01086 g003
Figure 4. Hydrogeological map of the contaminated site and sampling points.
Sustainability 08 01086 g004
Figure 5. The trend of total hydrocarbons in groundwater.
Sustainability 08 01086 g005
Figure 6. Hydrocarbons in unsaturated soil observed on the “safety” phase.
Sustainability 08 01086 g006
Figure 7. View of the contaminated site and distribution of the observed hydrocarbons in unsaturated soil: value of concentration in soil sample lower or higher than the limit of current national law have been reported along the continuous vertical “depth reference” lines respectively in green or red.
Sustainability 08 01086 g007
Figure 8. Mass pollutant balance in the contaminated site: before (a) and after (b) the remediation.
Sustainability 08 01086 g008
Figure 9. Trend in time of light hydrocarbons in unsaturated soil at the sampling sites S8, S9, S10 and S11, for different depth below ground surface: −1.00 ÷ −2.00 m (a); −2.00 ÷ −3.00 m (b); −3.00 ÷ −4.00 m (c).
Sustainability 08 01086 g009aSustainability 08 01086 g009b
Figure 10. Trend in time of heavy hydrocarbons in unsaturated soil at the sampling sites S8, S9, S10 and S11, for different depth below ground surface: −1.00 ÷ −2.00 m (a); −2.00 ÷ −3.00 m (b); −3.00 ÷ −4.00 m (c).
Sustainability 08 01086 g010aSustainability 08 01086 g010b
Figure 11. Trend of light hydrocarbons in unsaturated soil in the sample sites: S9 (a); S10 (b); S11 (c).
Sustainability 08 01086 g011aSustainability 08 01086 g011b
Figure 12. Trend of heavy hydrocarbons in unsaturated soil in the sample sites: S8 (a); S9 (b); S10 (c); and S11 (d).
Sustainability 08 01086 g012
Figure 13. Trend of light (a,b) and heavy (c,d) hydrocarbons in unsaturated soil for different depth below ground surface and distance of sampling sites: S8 (origin), S9 (15 m), S10 (30 m), S11 (45 m).
Sustainability 08 01086 g013aSustainability 08 01086 g013b
Table 1. Preliminary evaluation of the presence of the contamination of hydrocarbons in unsaturated soil and micronutrients available for the biomass growth.
DaySampling SiteDepth below
Ground Surface
HydrocarbonsTotal NitrogenTotal PhosphorusPotassium
Light
C ≤ 12
Heavy
C > 12
(m)(mg/kg)(mg/kg)% w/wmg/kgmg/kg
186S8−1.00 ÷ −2.005.566---
−2.00 ÷ −3.002161490---
−3.00 ÷ −4.0036624600.010094.7214
S9−1.00 ÷ −2.00n.r.11,6---
−2.00 ÷ −3.001881750---
−3.00 ÷ −4.0031423500.010080.8203
187S10−1.00 ÷ −2.001881460---
−2.00 ÷ −3.003202900---
−3.00 ÷ −4.0019718400.010086.3213
S11−1.00 ÷ −2.00n.r.n.r.---
−2.00 ÷ −3.0018.5290---
−3.00 ÷ −4.0016.54000.010065.7194