


Abstract
Campus greening is often the first step universities take towards sustainability. However, the diffusion of sustainability reporting methodologies and rankings is still at an early stage, and is biased in mainly measuring energy efficiency indicators while omitting basic features enabling meaningful comparisons among centers or addressing social (users) aspects related to long term sustainability transitions. This paper aims to introduce a critical perspective on sustainability university frameworks through: (i) a review of current Campus Sustainability Assessments (CSAs); (ii) performing and comparing the results obtained from the application of two internationally recognized CSAs (namely, Green Metric and ISCN) to two case studies (the Politecnico di Torino, in Italy, and the Hokkaido University, In Japan) and, finally, (iii) proposing a new CSA approach that encompasses clusters of homogeneous campus typologies for meaningful comparisons and university rankings. The proposed clusters regard universities’ morphological structures (campuses nested within city centers versus outside of a city compact ones), climatic zones and functions. At the micro scale, the paper introduces the need for indicators beyond measuring pure energy efficiency, but which are attentive to local and societal constraints and provide long-term tracking of outcomes. This, better than a sheer record of sustainability priority actions, can help in building homogenous university case studies to find similar and scalable success strategies and practices, and also in self-monitoring progress toward achieving truly sustainable university campuses.
1. Introduction
The key role of higher education institutions in the transition to a more sustainable society has been recognized and highlighted for almost three decades [1]. In respect to the most pressing urban and planetary sustainability challenges [2], universities are identified as key hubs within cities for innovation and environmental education, representing a precious opportunity for enabling the necessary generational behavioural change toward taking on more sustainable attitudes in daily lives [3,4]. To be credible in this guidance role, the university in primis has to behave responsibly and wisely in response to sustainability issues in the management of the energy and human resources of the campuses. A sustainable university has been defined as a higher educational institution that addresses, involves and promotes, on a regional or a global level, the minimisation of negative environmental, economic, societal, and health effects generated in the use of their resources in order to fulfil its functions of teaching, research, outreach and partnership, and stewardship in ways to help society make the transition to sustainable lifestyles [5]. At the same time, Cole highlighted the key role of sustainable campus communities, since “they actively engage the knowledge of the university community to address the ecological and social challenges that we face now and in the future” [6] (p. 30). The younger generations can indeed play a major role in addressing sustainability [7,8] by understanding and implementing “holistic and trans-disciplinary approaches that address the four dimensions of sustainability and their interrelations” [9] (p. 140). However, the management of this social responsibility transition, and the adaptation of campuses’ built environment toward a more sustainable system, is not a trivial matter [10]. For instance, educational functions account for 17% of the overall non-residential building stock in the EU [11]. Knowing that buildings are responsible for about 40% of total final energy requirements in Europe, the educational sector accounts for 6.8% of the total EU energy consumption. To give an idea of magnitude beyond the European case, the educational sector in China accounts for 40% of the total energy consumption in public buildings [12], with 30 million students and 1.87 GJ/m2 of energy consumed in 2007 [13]. In this way, universities are not only hubs for innovation and environmental education, but important actors within the urban setting, which must draw on a complex set of accounting indicators, dealing not only with environmental performances, but critically addressing economic, political, social and ethical issues [14]. In this context, campus sustainability assessments (CSAs) have been emerging, and have been used for more than a decade, as tools for identifying best practices, communicating goals and experiences, and measuring progress towards achieving the concept of a sustainable campus. Even if the literature in the late 1990s proposed detailed environmental reports, mostly by different North American universities voluntary initiatives (one of the first was “The Student Environmental Action Coalition—Campus ecology in 1993), there was not much relying on empirical data or common reference frameworks [15,16]. However, with the growing interest in campus environmental impacts, as a consistent part of the built environment, many projects launched wider initiatives for cross comparison and campus assessment [17]. In the last decade, different CSAs have been proposed at national and regional scales around the globe [18], varying greatly in purpose, scope, function, state of development and closeness to an “ideal tool” [19]. Recent research on CSAs has focused on defining and examining the role of metrics, even questioning the necessity of them [20,21,22]. Shriberg reviewed 11 assessment tools and found that many excel in capturing data on environmental and sustainability performance, as well as process-oriented information, or they also provide the grounds for strategic planning, by stating goals and methods [19]. However, they do not provide mechanisms for comparison (nationally and internationally), because they traditionally stress material utilization, CO2 emissions, and regulatory compliance, which is different from country to country. Furthermore, measuring sustainability requires a major leap beyond the energy efficiency paradigm, addressing social, economic and environmental impacts. For instance, an eco-efficiency indicator would provide the amount of kWh per square meter per year, while a sustainability indicator should look at the trend in consumption reduction over the years, or the percentage of people satisfied with the comfort level in their working environment [23]. Because of this, CSAs could be powerful tools for both triggering and supporting the organizational change process, or dangerously used as a mere façade, contributing to green-washing the business as usual unsustainable campus management [24]. In line with this special issue topic and objectives, the paper reviews some of the current CSAs, underlining their limits implementing effective improvements in the overall sustainability performance assessment method.
The Politecnico di Torino (POLITO), in Turin (Italy), and the Hokkaido University (HOKUDAI), in Sapporo (Japan), are assessed according to “Green Metric” and “ISCN report” CSAs. The research design justifying such international (European–Asian) comparison relies on POLITO scoring relatively low positions in world university rankings (in the Green Metric one, for instance, it occupies the 280th/361 vs. the 209th position of HOKUDAI, in 2014) but not reflecting a quite virtuous energy consumption path and wise resource management practices as revealed by in-depth, focused research. Although Turin and Sapporo Campuses do not have many similar characteristics in terms of urban settings, population, density per square meters and functions, they are still considered in the same international ranking as many other campuses around the globe, with evident comparability limits and sustainability performance mismatching. A new approach is therefore proposed, aiming at capturing current sustainability performances and local constraints both at the macro assessment level (i.e., within the frameworks) and at the micro-level (i.e., within indicators). The objective is to overcome the institutional and intrinsic limits of current CSAs, and help sustainability managers to translate strategic plans into powerful tools for self-tracking, goal setting and the promotion of transferable practices toward truly achieving sustainable university campuses and communities.
2. Method
This paper critique of current CSAs, and their limits, has been developed through an extensive literature review, and by proposing two case studies. The Politecnico di Torino (POLITO), in Turin (Italy), and the Hokkaido University (HOKUDAI) have been measured by the two most used typologies of CSAs: the “Green Metric” ranking (based on quantitative metric) and the “ISCN report” (based on individual and qualitative display of sustainability initiatives). The reason why the Green Metric and the ISCN have been selected is twofold: they are not country-related sustainability report tools. They are also largely diffused, with more than 360 (Green Metric) and 70 (ISCN) participants from 20 countries. Moreover, they stand as examples of the two main functions of CSAs: the auditing of local initiatives (ISCN), and the reporting of sustainability indicators according to a fixed set of criteria (Green Metric). The first type encompasses a list of self-elected criteria adherent to general areas of impacts (mobility, energy, third mission). The second one allows comparing universities’ performances (communicated via self-compiled questionnaires and retrieving public data display) at the same ranking. Indicators to compile the two CSAs for the Turin case (Appendix B) have been calculated drawing data from surveys, focus groups, interviews, the POLITO living lab (so from smart metering systems and bills) and literature (official documents, maps, Archibus facility management systems) available at POLITO. For the Hokkaido case, different fieldwork was undertaken at the HOKUDAI campuses, recollecting the necessary data from the Hokkaido University Sustainability Office and from stakeholders’ meetings and surveys (interviewees were selected mainly based on their level of involvement with sustainability initiatives and their organizational position in the university). To identify potential candidates, an extensive list was initially developed for both studies, and adjusted based on referrals provided by the first interviewees (Appendix C). Each of the 23 interviews lasted on average 60 min, and was conducted in Italian or English. Four main themes were covered during the interviews: sustainable campus initiatives (according to the area of expertise and knowledge of the interviewed), in fieri activities, governance of the decision-making process and management control systems (and more particularly about data collection and use). The interview protocol was adapted to each event (focus group, meetings, and surveys) and to the stakeholder profile. The various degrees of engagement in sustainability initiatives of the interviewees, and the numerous uncoordinated sustainability initiatives that have been carried out by students and professors, opened up the opportunity to develop a dedicated team in order to manage the different stakeholders that emerged. This level of management would be useful both regarding the effectiveness of the actions indicated in this report and the relationships that the University must inevitably establish with a series of third parties. The research on this topic may also enrich the outcomes of the evaluation procedures aimed at informing and communicating data in different ways through different indicators.
The other relevant source of information to complement the information obtained from the interviews came from a review of all the internal and external documents. The chronology of university sustainability initiatives (both public and private documents consisting with annual reports, websites, activity reports, campus assessments, internal mail, PowerPoint presentations and the POLITO Archibus data-base) was obtained online or provided by the interviewees. The catalyser for all these crosscutting sustainability initiatives resources was the POLITO living lab and the Hokkaido Sustainability Office. The monitoring system in POLITO is based on the acquisition of data from different plants and flows equipped with meters, smart meters and a heterogeneous data logger (Most of these information are accessible to everyone retrieving the website http://smart-greenbuilding.polito.it/) The Sustainability Office in HOKUDAI acts as a collector of bills, purchases and facility management and works closely with departments, institutes and other related organizations in taking steps to achieve campus sustainability.
3. CSA Frameworks: Why They are Not Mirroring Actual Sustainability Practices?
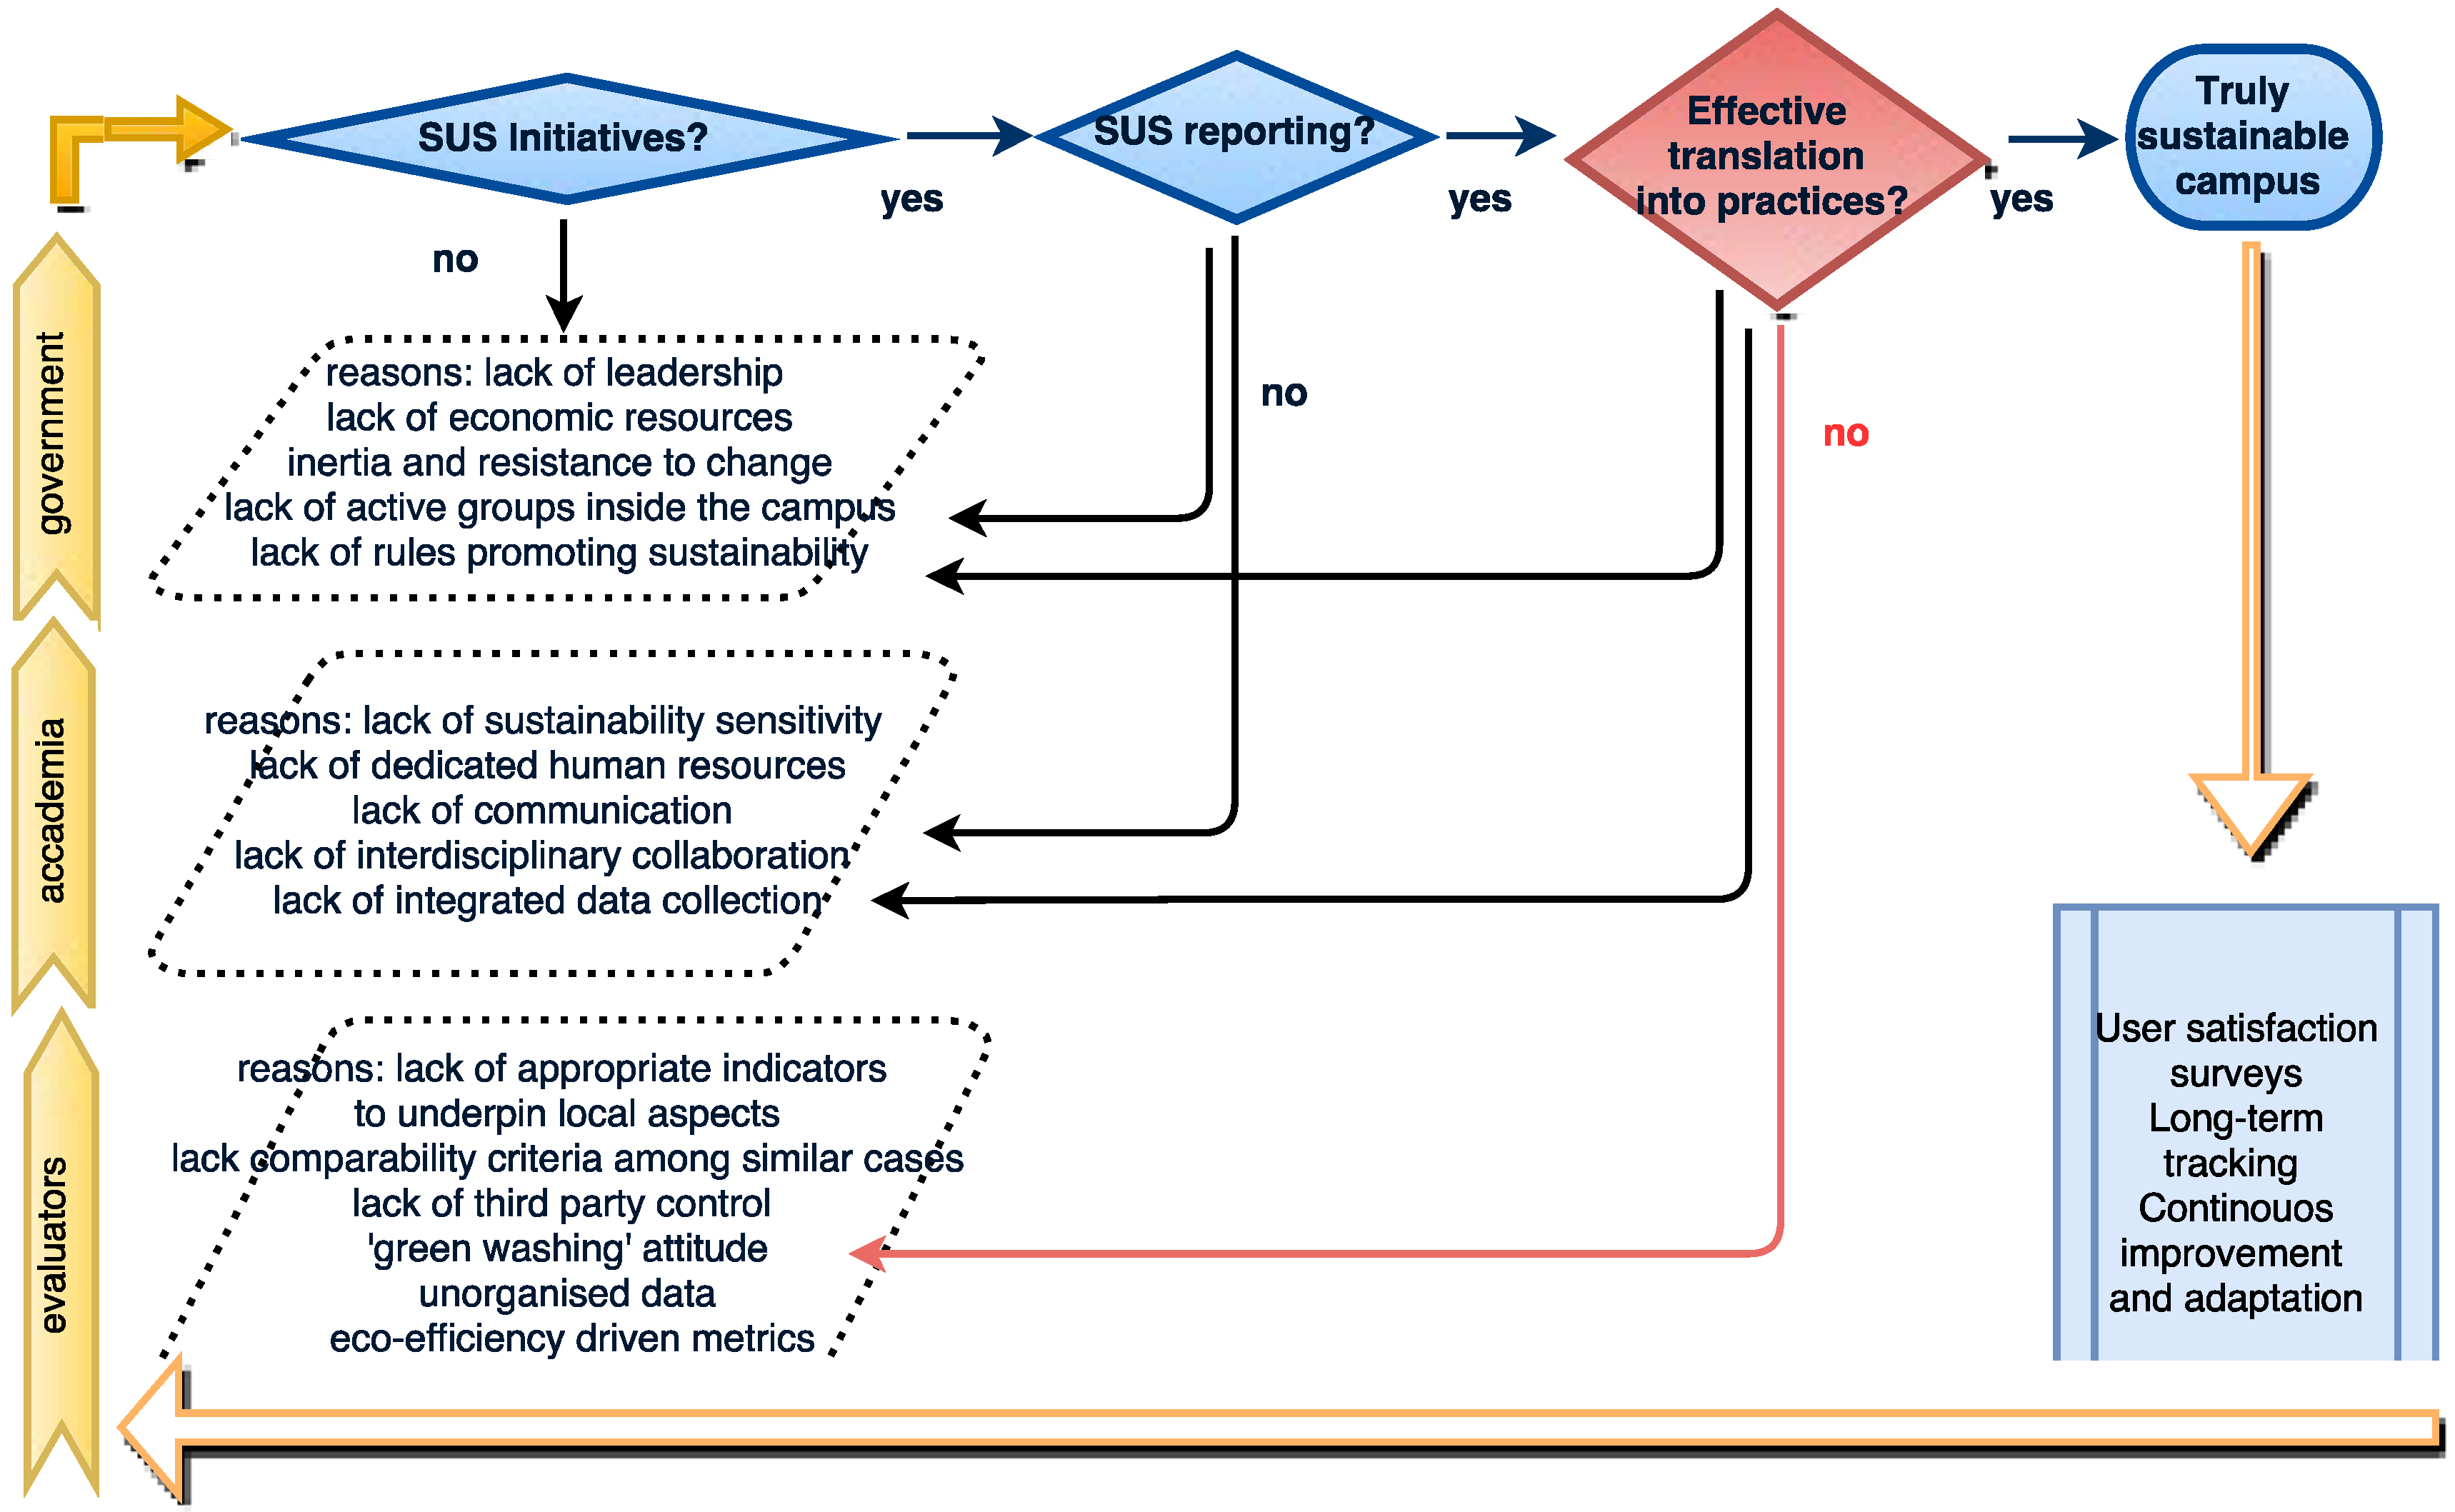
As remarked in the introduction, although some virtuous universities disclose activities correlated to their green image, and have for 20 years, the diffusion of systematic sustainability reports (SR) is still in early stages overall in Europe. Many literature reviews focused on different reasons for this gap, trying to seek out a new taxonomy for examining the multiple roles of campus sustainability assessments in organizational change, barriers in the organizational framework [25], lack of integrated strategy among the core areas of university stakeholders [26], different purposes and drivers for their adoption [27], sheer green-washing goals, or lack of metrics for comparability [14]. The different classes of problems related to the current sustainability framework development and adoption are shown in Figure 1, to highlight the focus of this study and the reasons for it. In particular, In Figure 1, the left yellow boxes indicate the responsibility for the implementation of solutions related to the absence of sustainability (SUS) initiatives (first block), of SUS reporting (second block) and the inefficacy in reporting such initiatives in terms of practical outcomes (third block). In the light blue rectangle on the right, the process needed to maintain the achieved “truly sustainable campus” (blue ellipse) is detailed. The effective translation of the CSA framework into practice (red rhombus step) is the evaluative gap this study wants to bridge. The red arrows coming from it points to the area of weaknesses more directly related to current CSAs, which can be broken down into two main levels: at the macro-level, the inability to compare different campuses; at the micro-level, the inefficacy of some indicators in representing actual sustainability performance.
Figure 1.
Defferent classes of problems related to current sustainability framework development and adoption. Source: elaborated from authors.
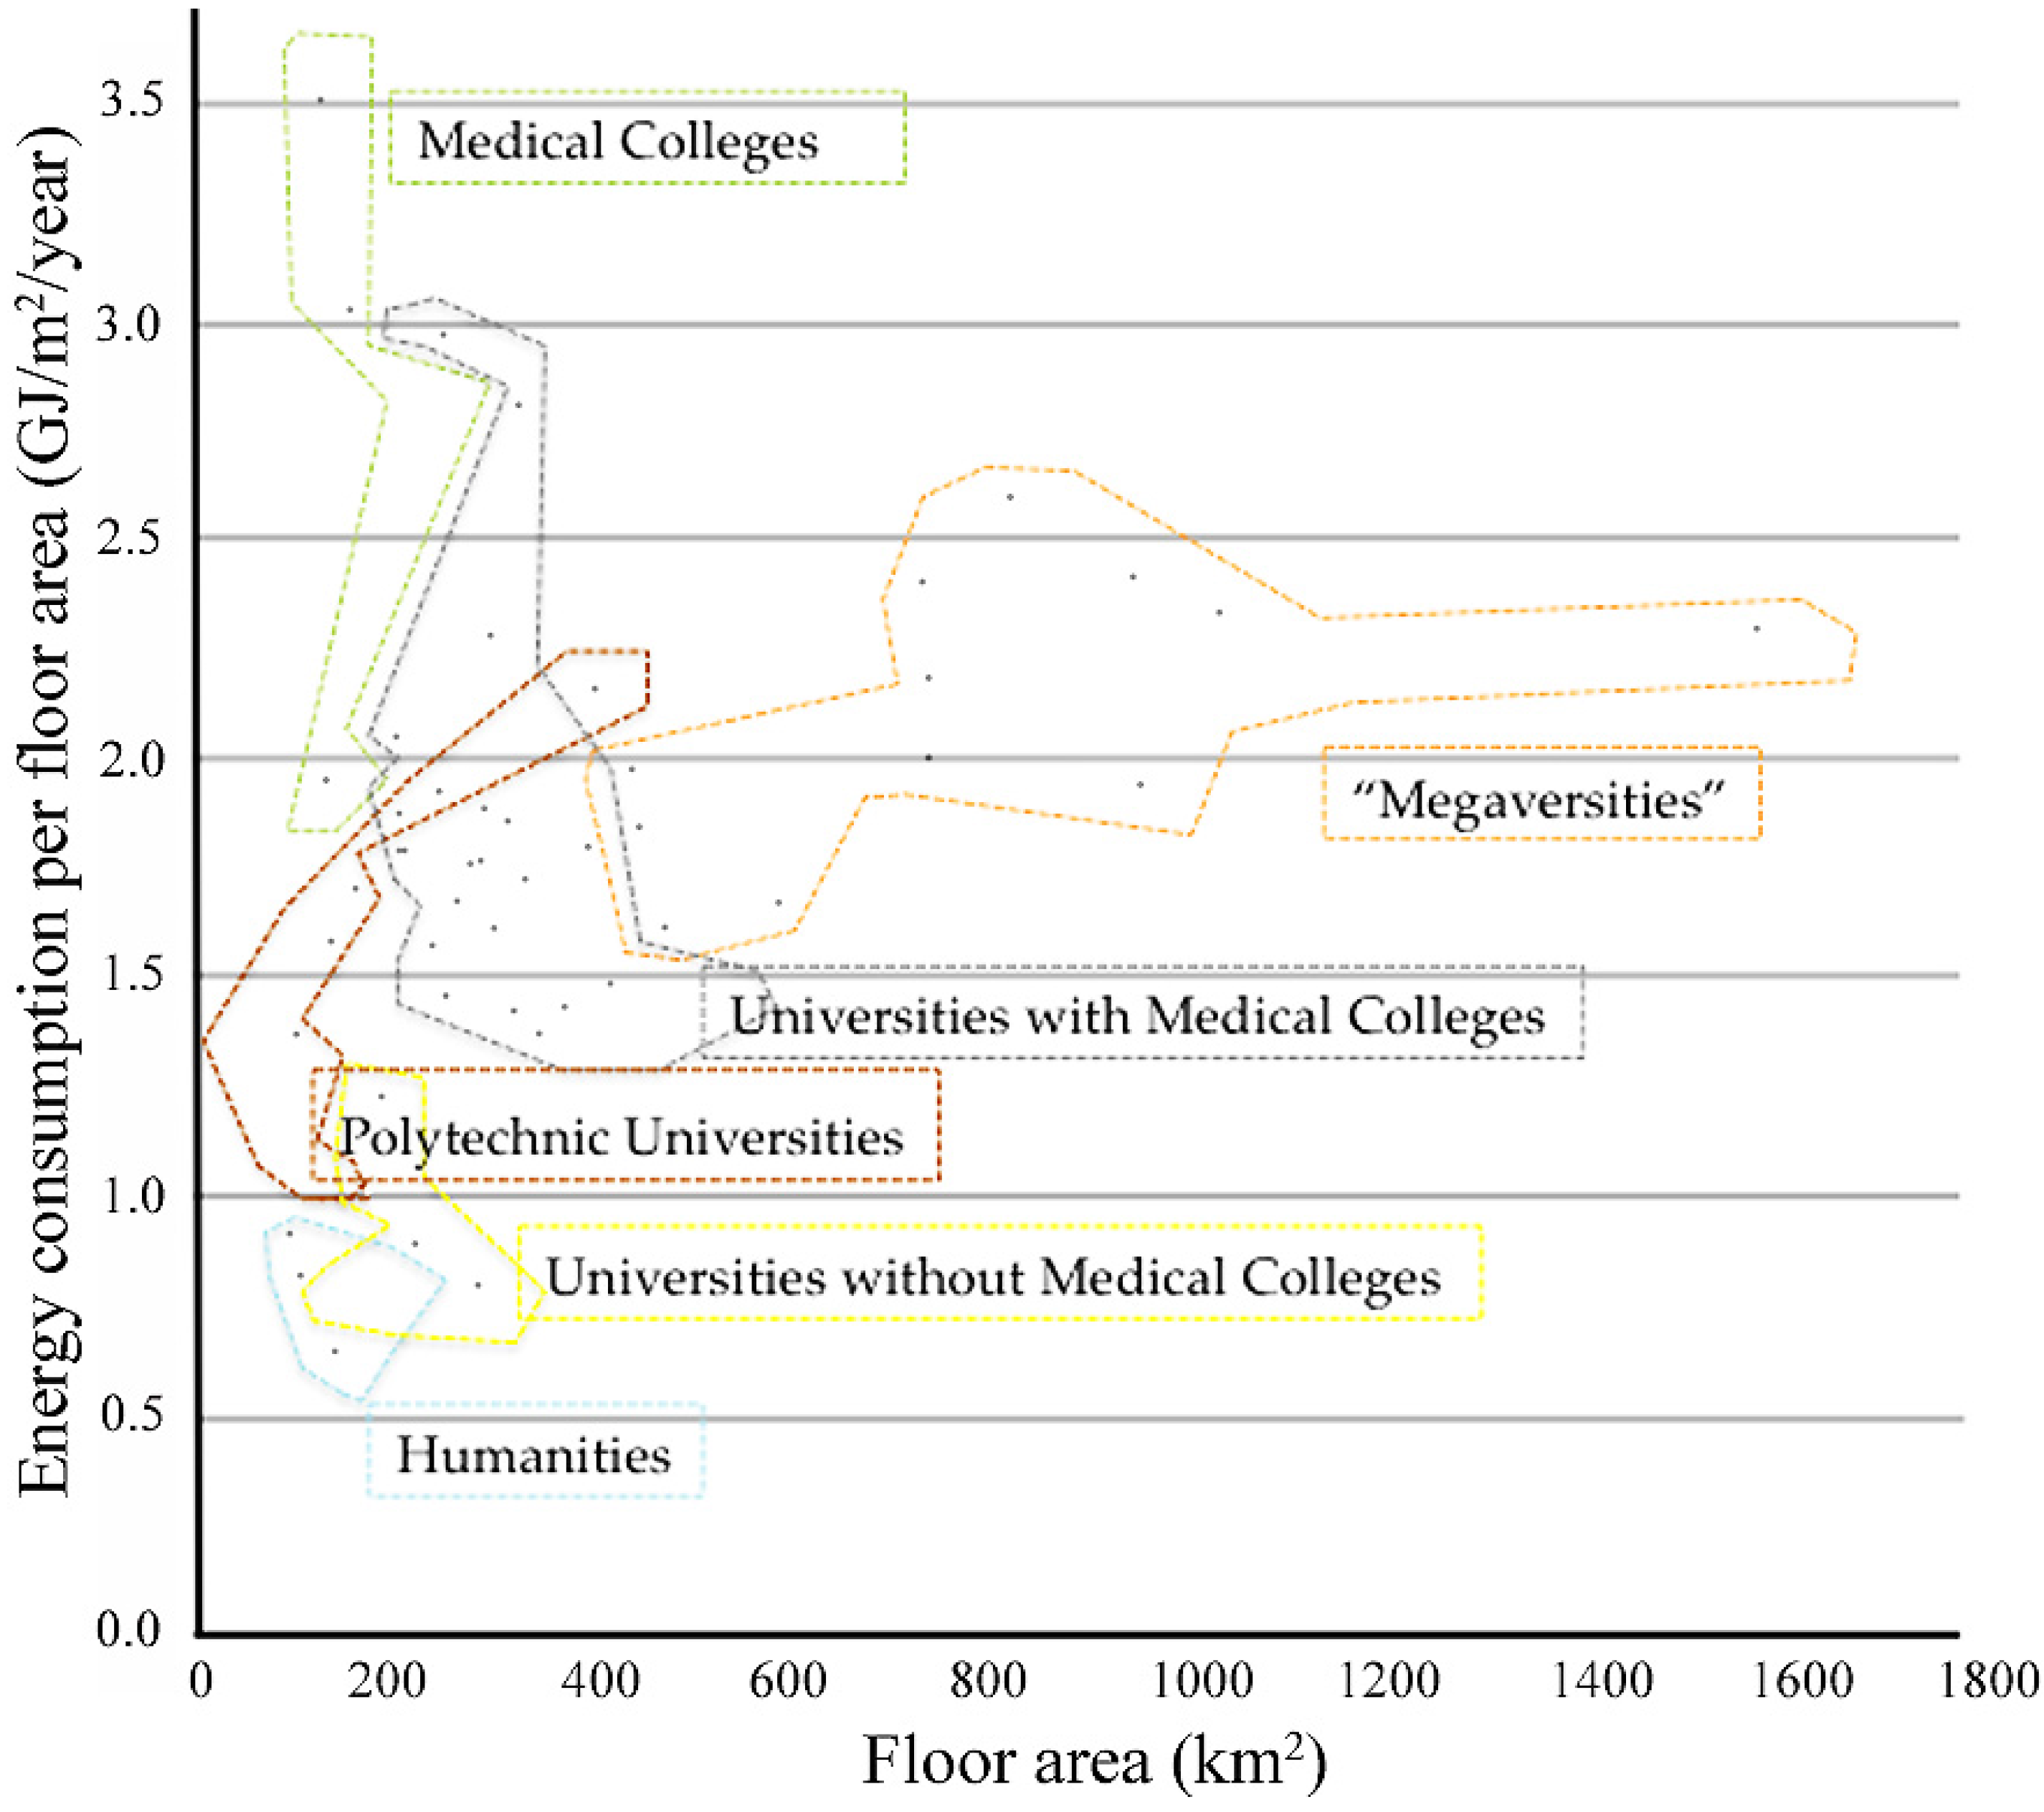
Of course, there is no black/white correspondence among the boxes and the categories of problems outlined in the diagram. For instance, there could be no correlation at all among sustainability assessment and reporting activities, while some authors consider the two as synonymous. Derrick even raised the questions whether these indicators actually measure what sustainability is and why, and also whether the data used for ranking systems is just another signal of “institutional performativity” [21]. Few studies have yet assessed and thoroughly explored the change agents’ roles and implications for CSAs in truly contributing to higher education institutions’ sustainability transitions [28,29]. Lang even warns that “there are very limited correlations between institutional environmental performance and adoption of campus sustainability initiatives, be they targeted operational or coordination and planning best practices, or curricular, co-curricular or research activities. Conversely, there are strong correlations between environmental performance and campus characteristics, namely, institution type and climate zone” [30] (p. 474). This is a macro-gap recorded also by the Ministry of Education in Japan [31], in a chart (Figure 2) where different energy consumptions of Japanese universities are set against their related area in km2. Three different types of universities are therefore identified as displaying a second homogeneous trend of consumption, namely medical colleges, “megaversities” (i.e., the American-style huge and mixed campus, after Clark Kerr’s famous neologism), and colleges of education. This, plus other evidence from the cited gaps in the literature on CSAs, led this research to focus on how to merge similar campuses into clusters. This article proposes clusters including similar institution types, climate areas and urban contexts are suggested in order to bridge the gap found at the macro-level regarding the lack of comparability criteria of different campuses using the same CSA.
Figure 2.
A benchmarking method for facility management in Japanese universities. Re-drawn from [31].
Regarding the micro-level gap in current CSAs, the indicators’ inability to communicate effectively the sustainability initiatives and performance was a pitfall already outlined by Shriberg in 2002. At the base of this issue lies the lack of measurability (and therefore indicators and their potential translation into practices) of certain social and environmental inputs and outputs. Furthermore, the old “what gets measured, gets done” management paradigm explains why going beyond the eco-efficiency approach remains hard. In Shriberg (2002), 11 sustainability assessment tools developed specifically for universities were compared. This paper added to these another four protocols (Green Metric, UNI-Metrics, ISCN, STARS), to include recent—and more related to the EU/Italian background—CSAs. Their major weaknesses and strengths have been summed up in Table 1.
Table 1.
Summary of the major strengths and weaknesses of some of the current sustainability assessmens. Source: authors, adapting the table in [19].
Global rankings like the Green Metric have a number of positive features, like openness and accessibility, and the contribution to academic discourse on sustainability in education and the greening of campuses. On the other hand, sometimes, the generality of these criteria cannot simply underpin the local dimensions and local constraints, which sometimes penalise the university for weaknesses outside its realm of responsibility. Voluntary reporting initiatives like the ISCN report are a good start for collecting data inside the athenaeum, but then there is no common ground to compare one university sustainability performance with others, since there are no common frameworks (neither qualitative nor quantitative). Still, despite historical, social, urban and political differences and similarities, leaders of Signatories University have accepted the principle that the future belongs to education and science, and can benefit if the ISCN mutual learning platform to improve their own performance.
As emerging from the table, none of the tools underpin any motivation or commitment behind the actions, which is indeed a dangerous gap. While the role of change agents and campus communities and the reasons why sustainability actions are defined are crucial to igniting sustainability processes, current CSAs seem to be an instrument for “tick-the-box” possible indicators fostering the green campus image within the sustainability reports.
4. The POLITO-HOKUDAI Comparison
In this section, the POLITO and HOKUDAI case studies are presented. Data collected via surveys, direct measurements, living-lab downloads, interviews and official document consultations are shown in Section 4.1 and Section 4.2 (and were used to fill out the Green Metric and ISCN CSAs reports available in Appendix B). Results of evaluations are presented in Section 4.3. The “fit to purpose” feature of some indicators regarding energy efficiency strategies and appliances is criticised, proposing alternative ways to underpin the “wise use of energy” criteria. The comparison aims to demonstrate how focusing the indicators on a local and long-term oriented approach, and grouping universities according to their “cluster” of similar structure, climatic zone and functions, can overcome many of the current problems in the dissemination of mutual learning practices and sustainability management in university campuses.
4.1. The POLITO Campus
The POLITO setting includes five campuses dispersed throughout the city, in buildings dated from the 17th century (the Castello del Valentino, with an area of 23,000 m2) to the late the 1950s (the main extended complex in Corso Duca degli Abruzzi, 122,000 m2), and to 2000 (Cittadella Politecnica, 170,000 m2 of student residences, research activities, technological transfers and services buildings). Far from the centre, two former industrial sites were also refurbished and used for teaching activities (Mirafiori and Lingotto, former FIAT manufacturing sites). In total, in 2012, the whole campus accounted for a surface area of 870,700 m2, 33,600 users (students and staff), and a yearly primary energy (PE) consumption of 225,475 kWh/m2. In 2015, POLITO, in collaboration with the Higher Institute on Territorial Systems for Innovation (SiTI), carried out a project titled “Sustainable Path”, aiming to track down all the sustainability initiatives of the Politecnico. The first outcome is a report compiled for the International Sustainable Campus Network (ISCN) that serves as a basis for further strategic plans. In the light of what emerged in the scouting of the different hidden, but virtuous, sustainability actions in the energy, waste, mobility, communication and urban management fields, the ISCN report was shown to be useful in rounding up all the university stakeholders dealing with sustainability issues and eventually to set a long-term group work, a “green team”, which will be in charge of the overall sustainability strategy of the Athenaeum. Current internal managers of the aforementioned fields could make up the core, and be supported by the existing Living Lab. The status quo reported in the ISCN shows the Politecnico to be in a very good position to move along this path. For instance, 100% of the electric energy consumed at the campus comes from renewables, and a consistent proportion of the thermal energy comes from district heating. A new photovoltaics (PV) plant of 400 kWp has recently been approved, new double-framed windows has substituted all the old ones, and thermal insulation has been provided for the most dissipative walls of the main building. Car-ride, car-pooling, electric vehicle charge stations, subsidised public transport seasonal tickets and closed bike parking are some of the mobility manager’s recent achievements. Zero-kilometer food, green product procurement, paperless communications, campus differentiated waste collection points, and water dispensers are other tangible and visible efforts towards building sustainability education, as well as the introduction of open night lectures, sustainability-dedicated courses and several international projects on campus sustainability management.
However, POLITO is one of the many (typical European) cases of a “town-embedded campus”. Nested within the city structure, it receives most of its strengths and assets, but also most of the constraints that penalise POLITO in international university green rankings (i.e., lack of green spaces, poor waste management, and no dedicated mobility system, to cite just a few of them) from this structure.
4.2. The HOKUDAI Campus
Hokkaido University was founded in 1876 and is located in the centre of the city of Sapporo (1.9 million population, 2011 census) on the northern Japanese island of Hokkaido. It encompasses 31 schools (12 undergraduate and 19 graduate) and at the time of the survey (2012), had over 18,000 students. The campus is situated in downtown Sapporo and covers an area of 1,776,249 m2 including the entire park in which buildings are located. Hokkaido University follows a series of sustainability initiatives in order to reduce its environmental impact. These initiatives could be categorised in four key groups: sustainable campus core schemes, sustainability programs, human resource development and education, leading sustainability networks and campus sustainability assessment schemes. The university runs periodical stakeholder meetings in order to bring expertise from outside the university regarding implemented programs and feedback on areas requiring improvement. A series of voluntary student activities to enhance campus sustainability (e.g., “Hokudai Genki project”, “Sustainable Campus Contest”, “Candle Night”, “Sustainable Campus tour”, “Hokkaido University Campus Visit Project”, etc.) are held by different university departments and groups. Efforts are being made as well to cultivate human resources by fostering a series of sustainability programs among the student body.
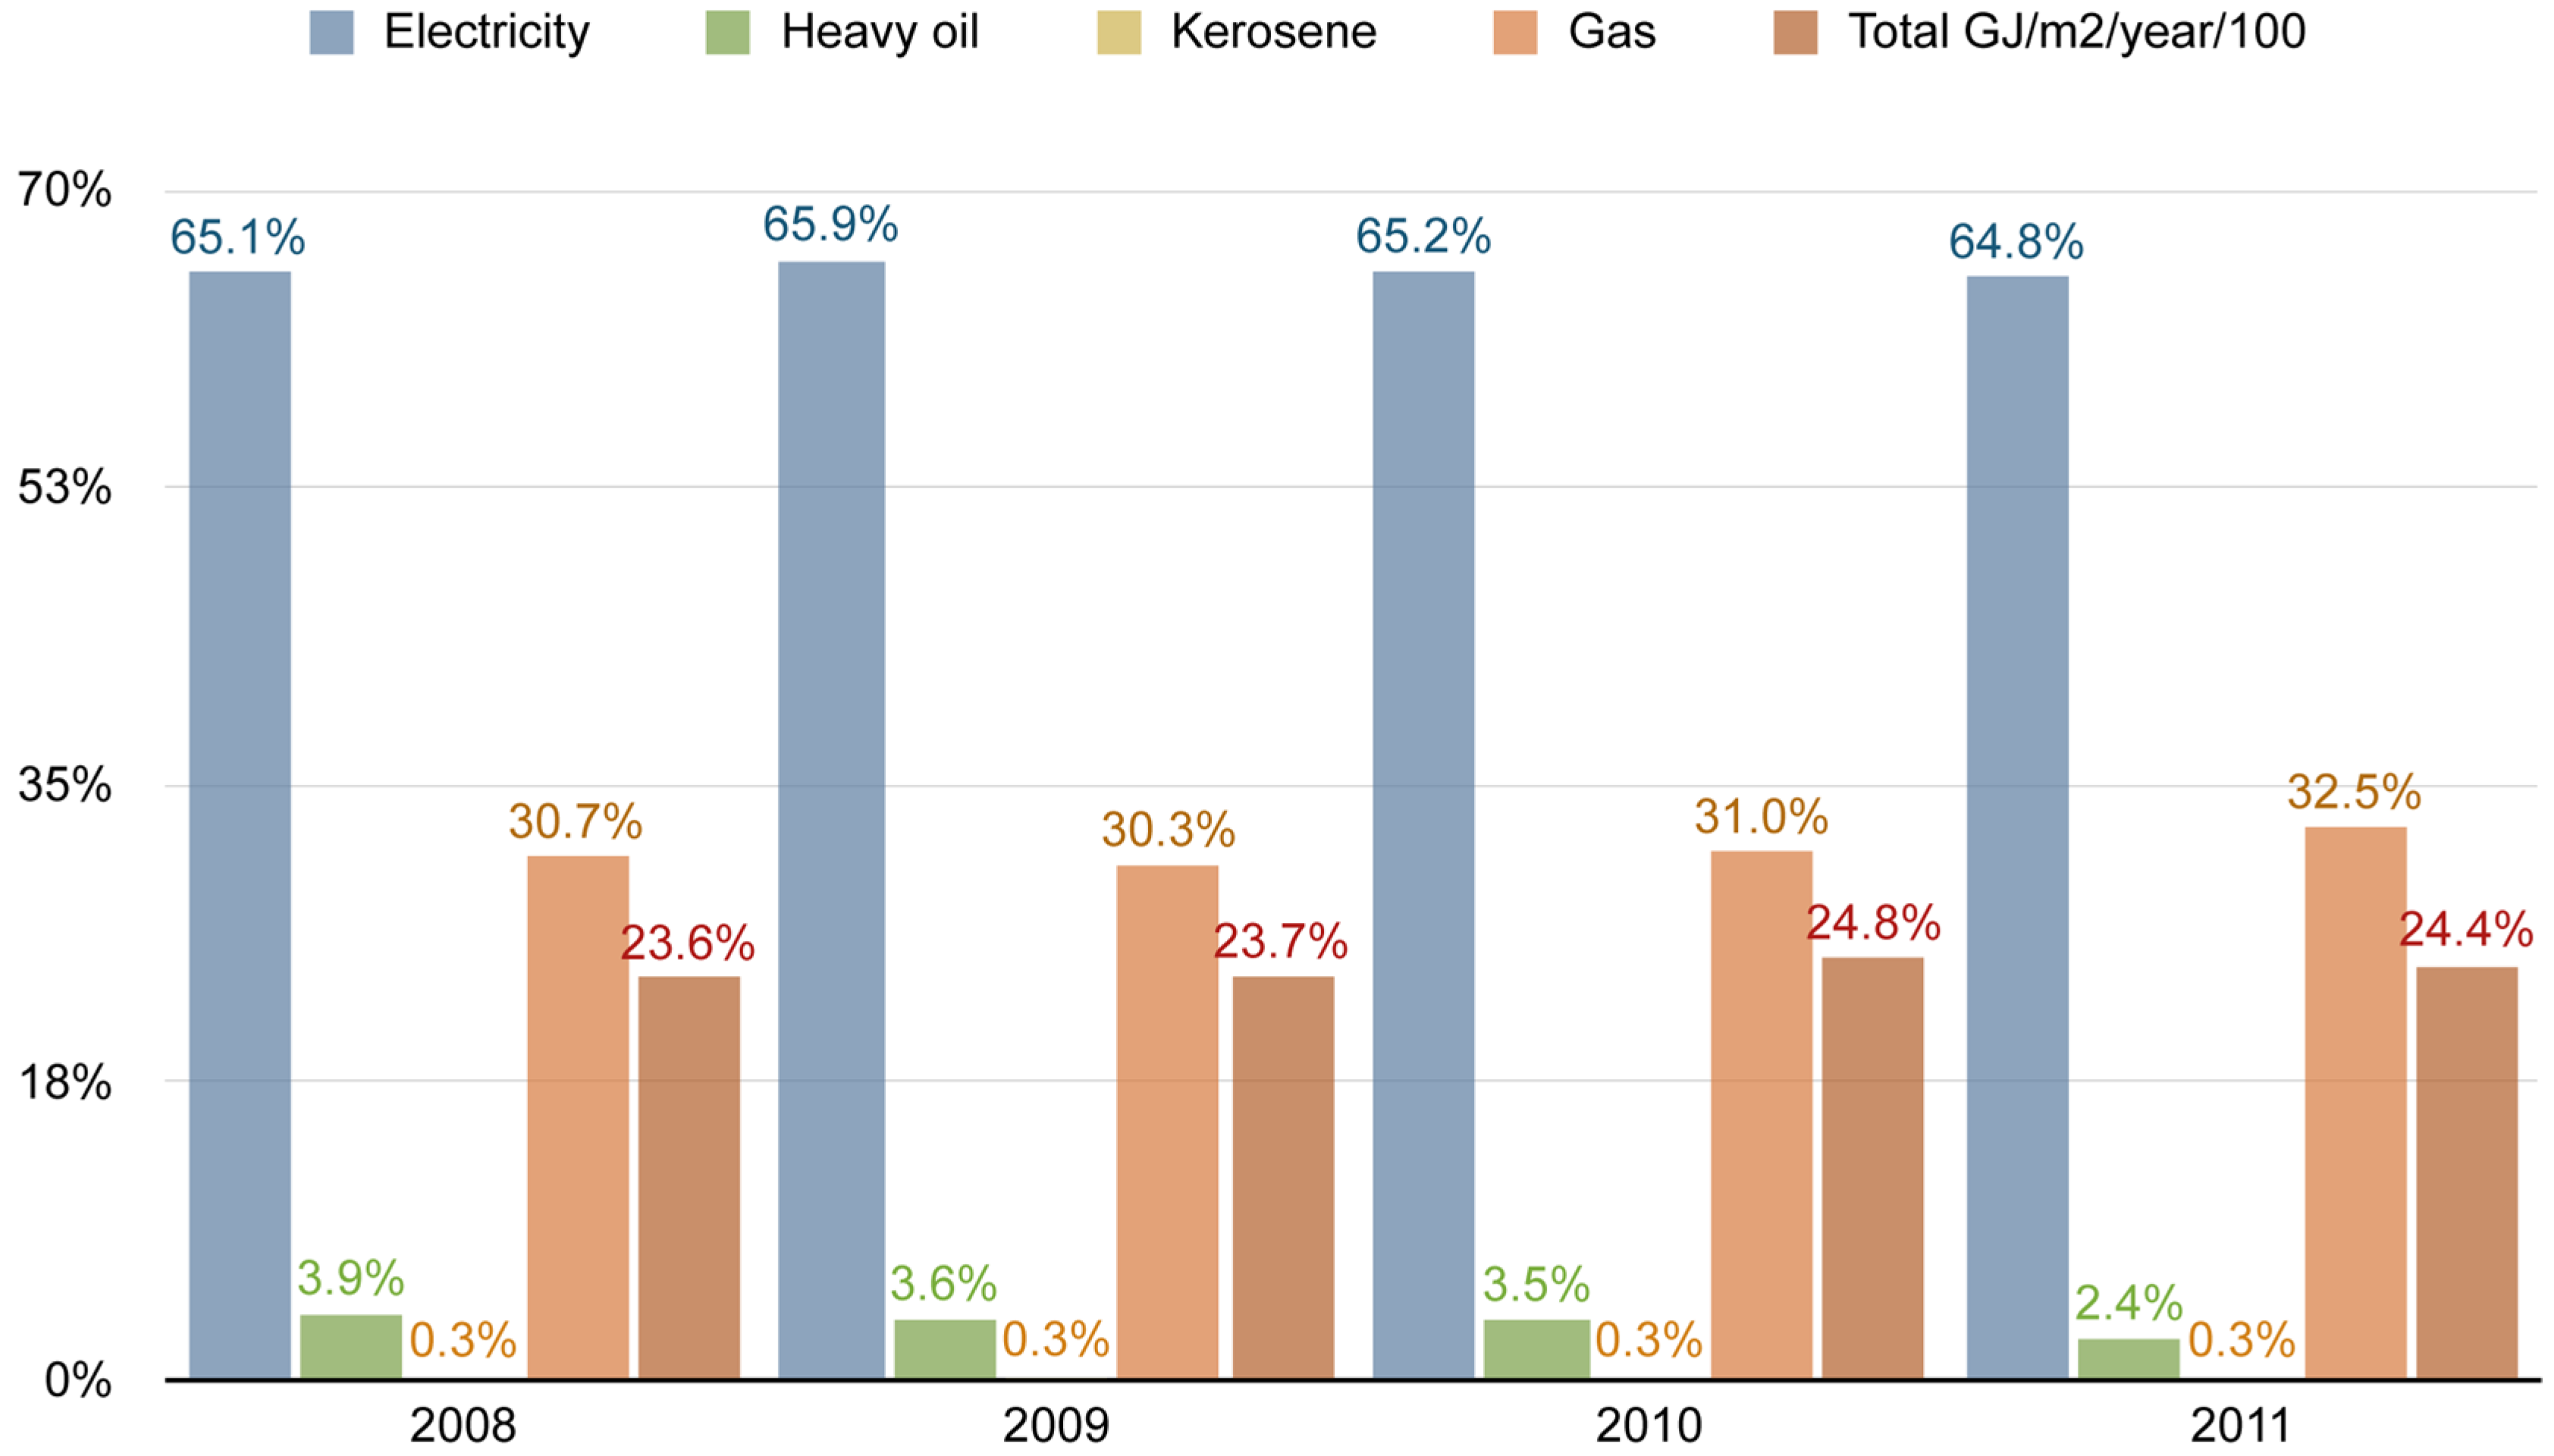
However, as shown in Figure 3, energy consumption per source has been basically steady or even slightly increasing (for gas and total PE) since 2008.
Figure 3.
Energy consumption trends from 2008 to 2011 weighted for energy source at the Hokkaido University Campus. Source: author elaboration of data by the Hokkaido University Sustainability Office.
4.3. ISCN and Green Metric Results: Campus Comparison
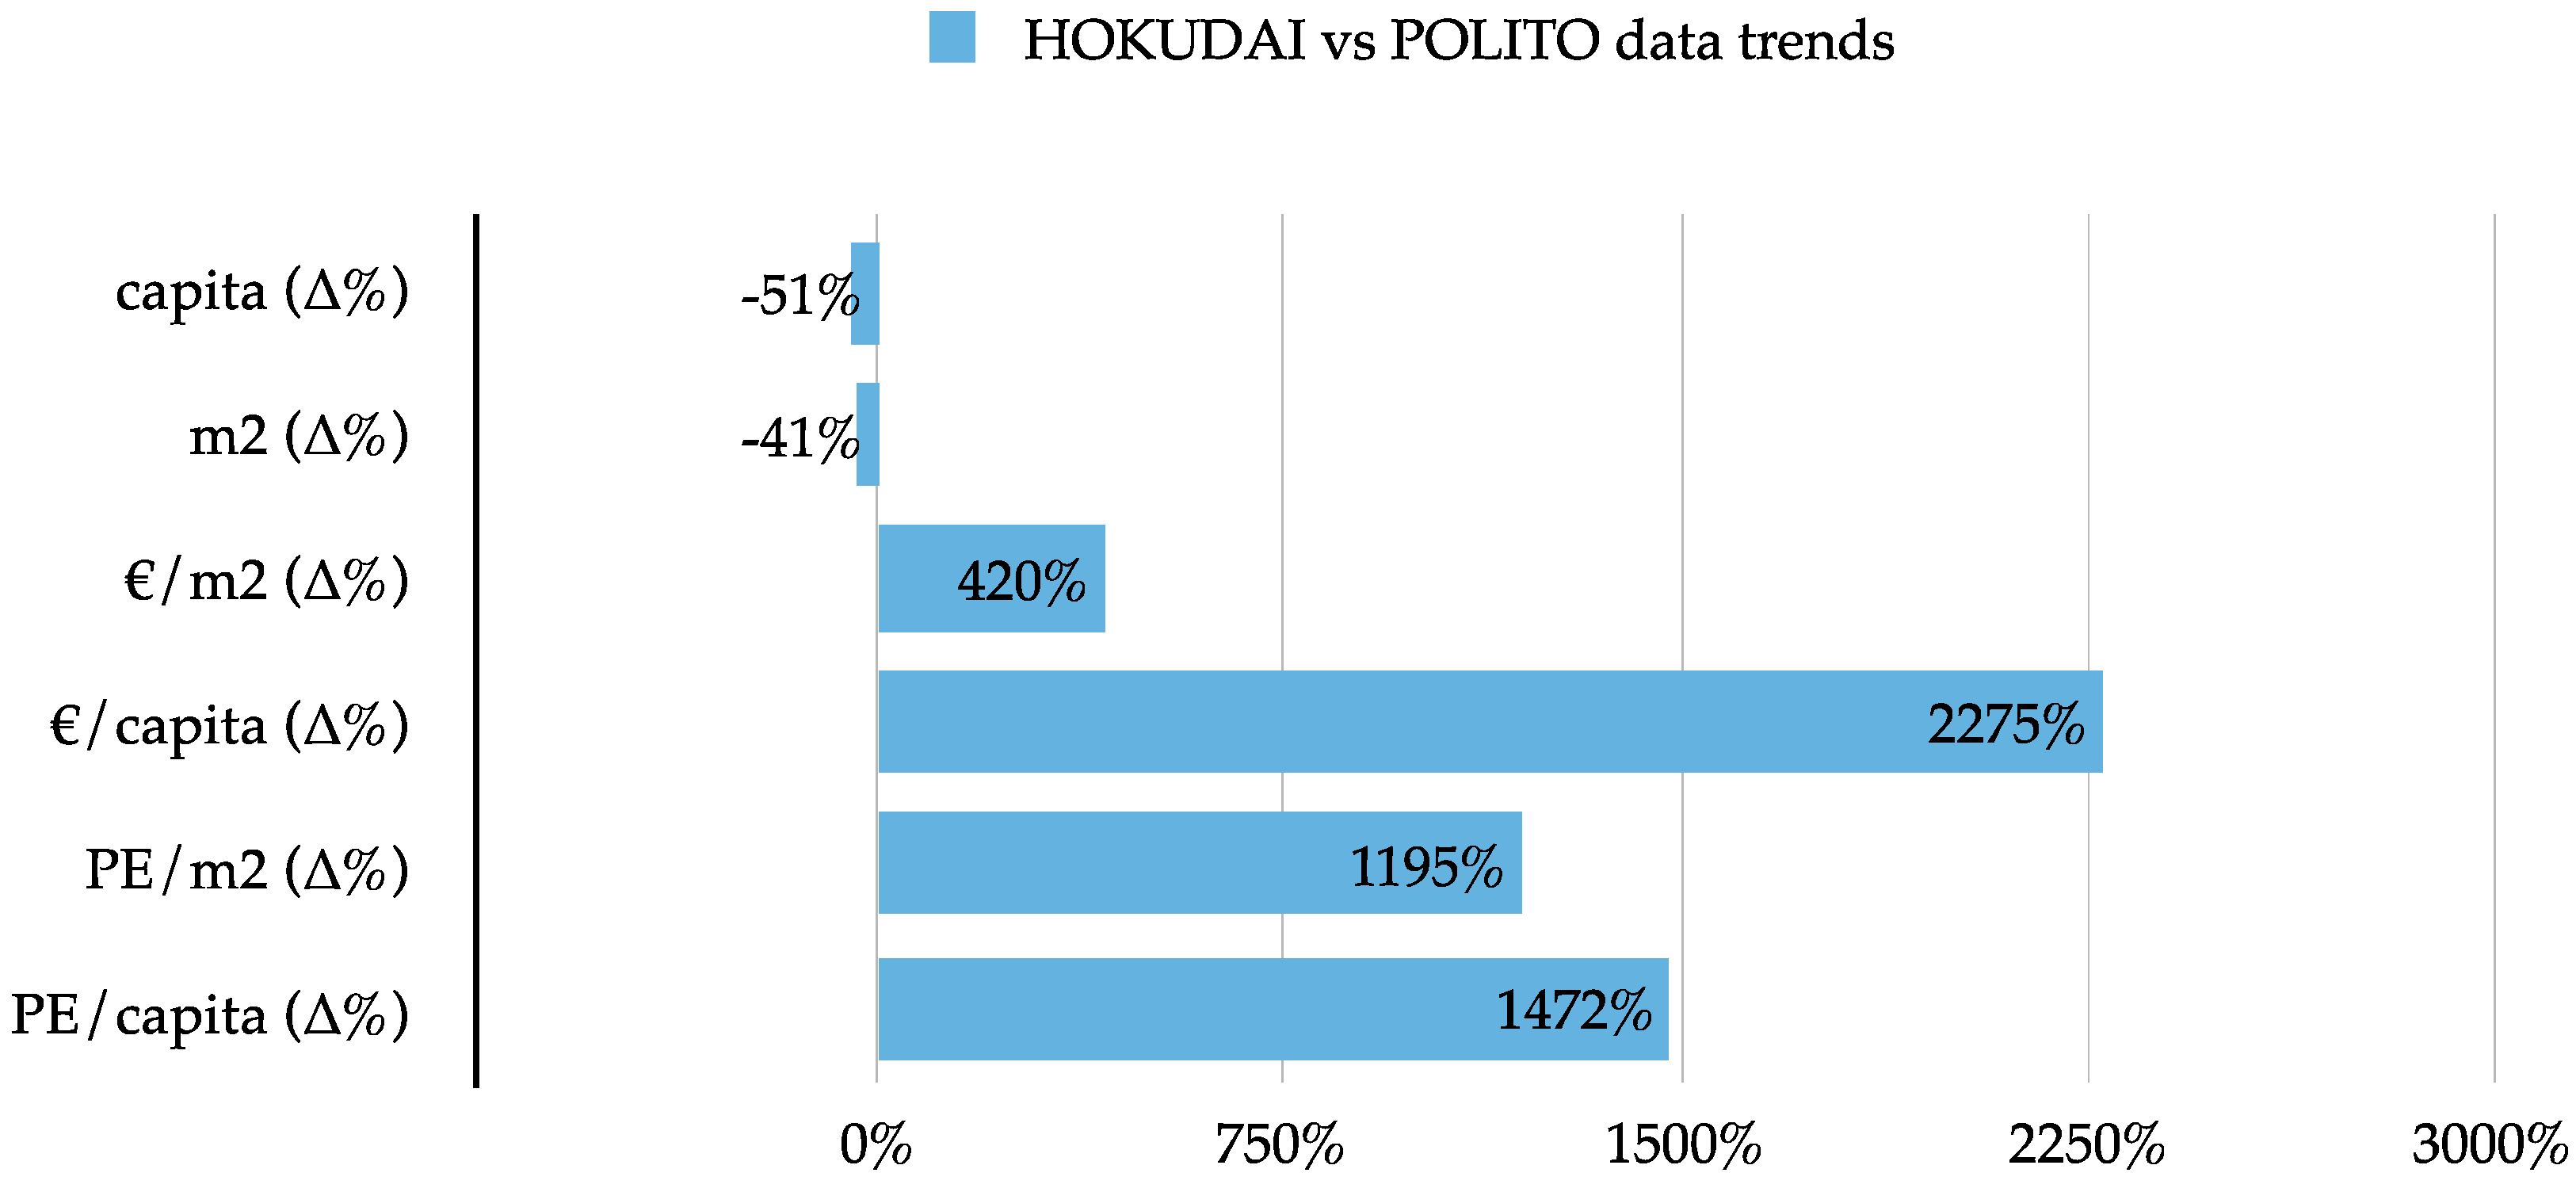
In this section, critical insights on metrics and report results are used in order to compare two very different campuses. Indeed, HOKUDAI’s 516,509 m2 of university campus area is 40% smaller than that of Turin. Its 16,418 users consume 1,731,798 GJ of PE. To put this into perspective, while PE consumption per capita in Turin is 6.71 GJ, in Sapporo it is 105 GJ (1471% more). The cost of this (calculate for the year 2014) is 117 € per capita in Turin, versus 2779 € in Sapporo (a difference of 2275%). These data are displayed in Figure 4.
Figure 4.
Comparison of HOKUDAI vs. POLITO for total university users, surface, yearly costs of primary energy consumption (PE), and PE per capita and square meters. Source: author’s elaboration from data collection at Hokkaido University Sustainability Office and Politecnico di Torino’s Living Lab.
Back to CSAs, the ISCN annual report only outlines the gold standard practices and celebrates the diversity of responses to challenges of campus sustainability according to each campus’s peculiarities. The aim is to pool global knowledge on how universities can best support sustainable development through their research and education, and putting principles into practice in their own operations, showcasing their achievements. However, this can result in a too auto-referential and limited vision of the actual situation of the campuses. Neither POLITO nor HOKUDAI displayed any negative data or ways to overcome real problems for sustainability implementation.
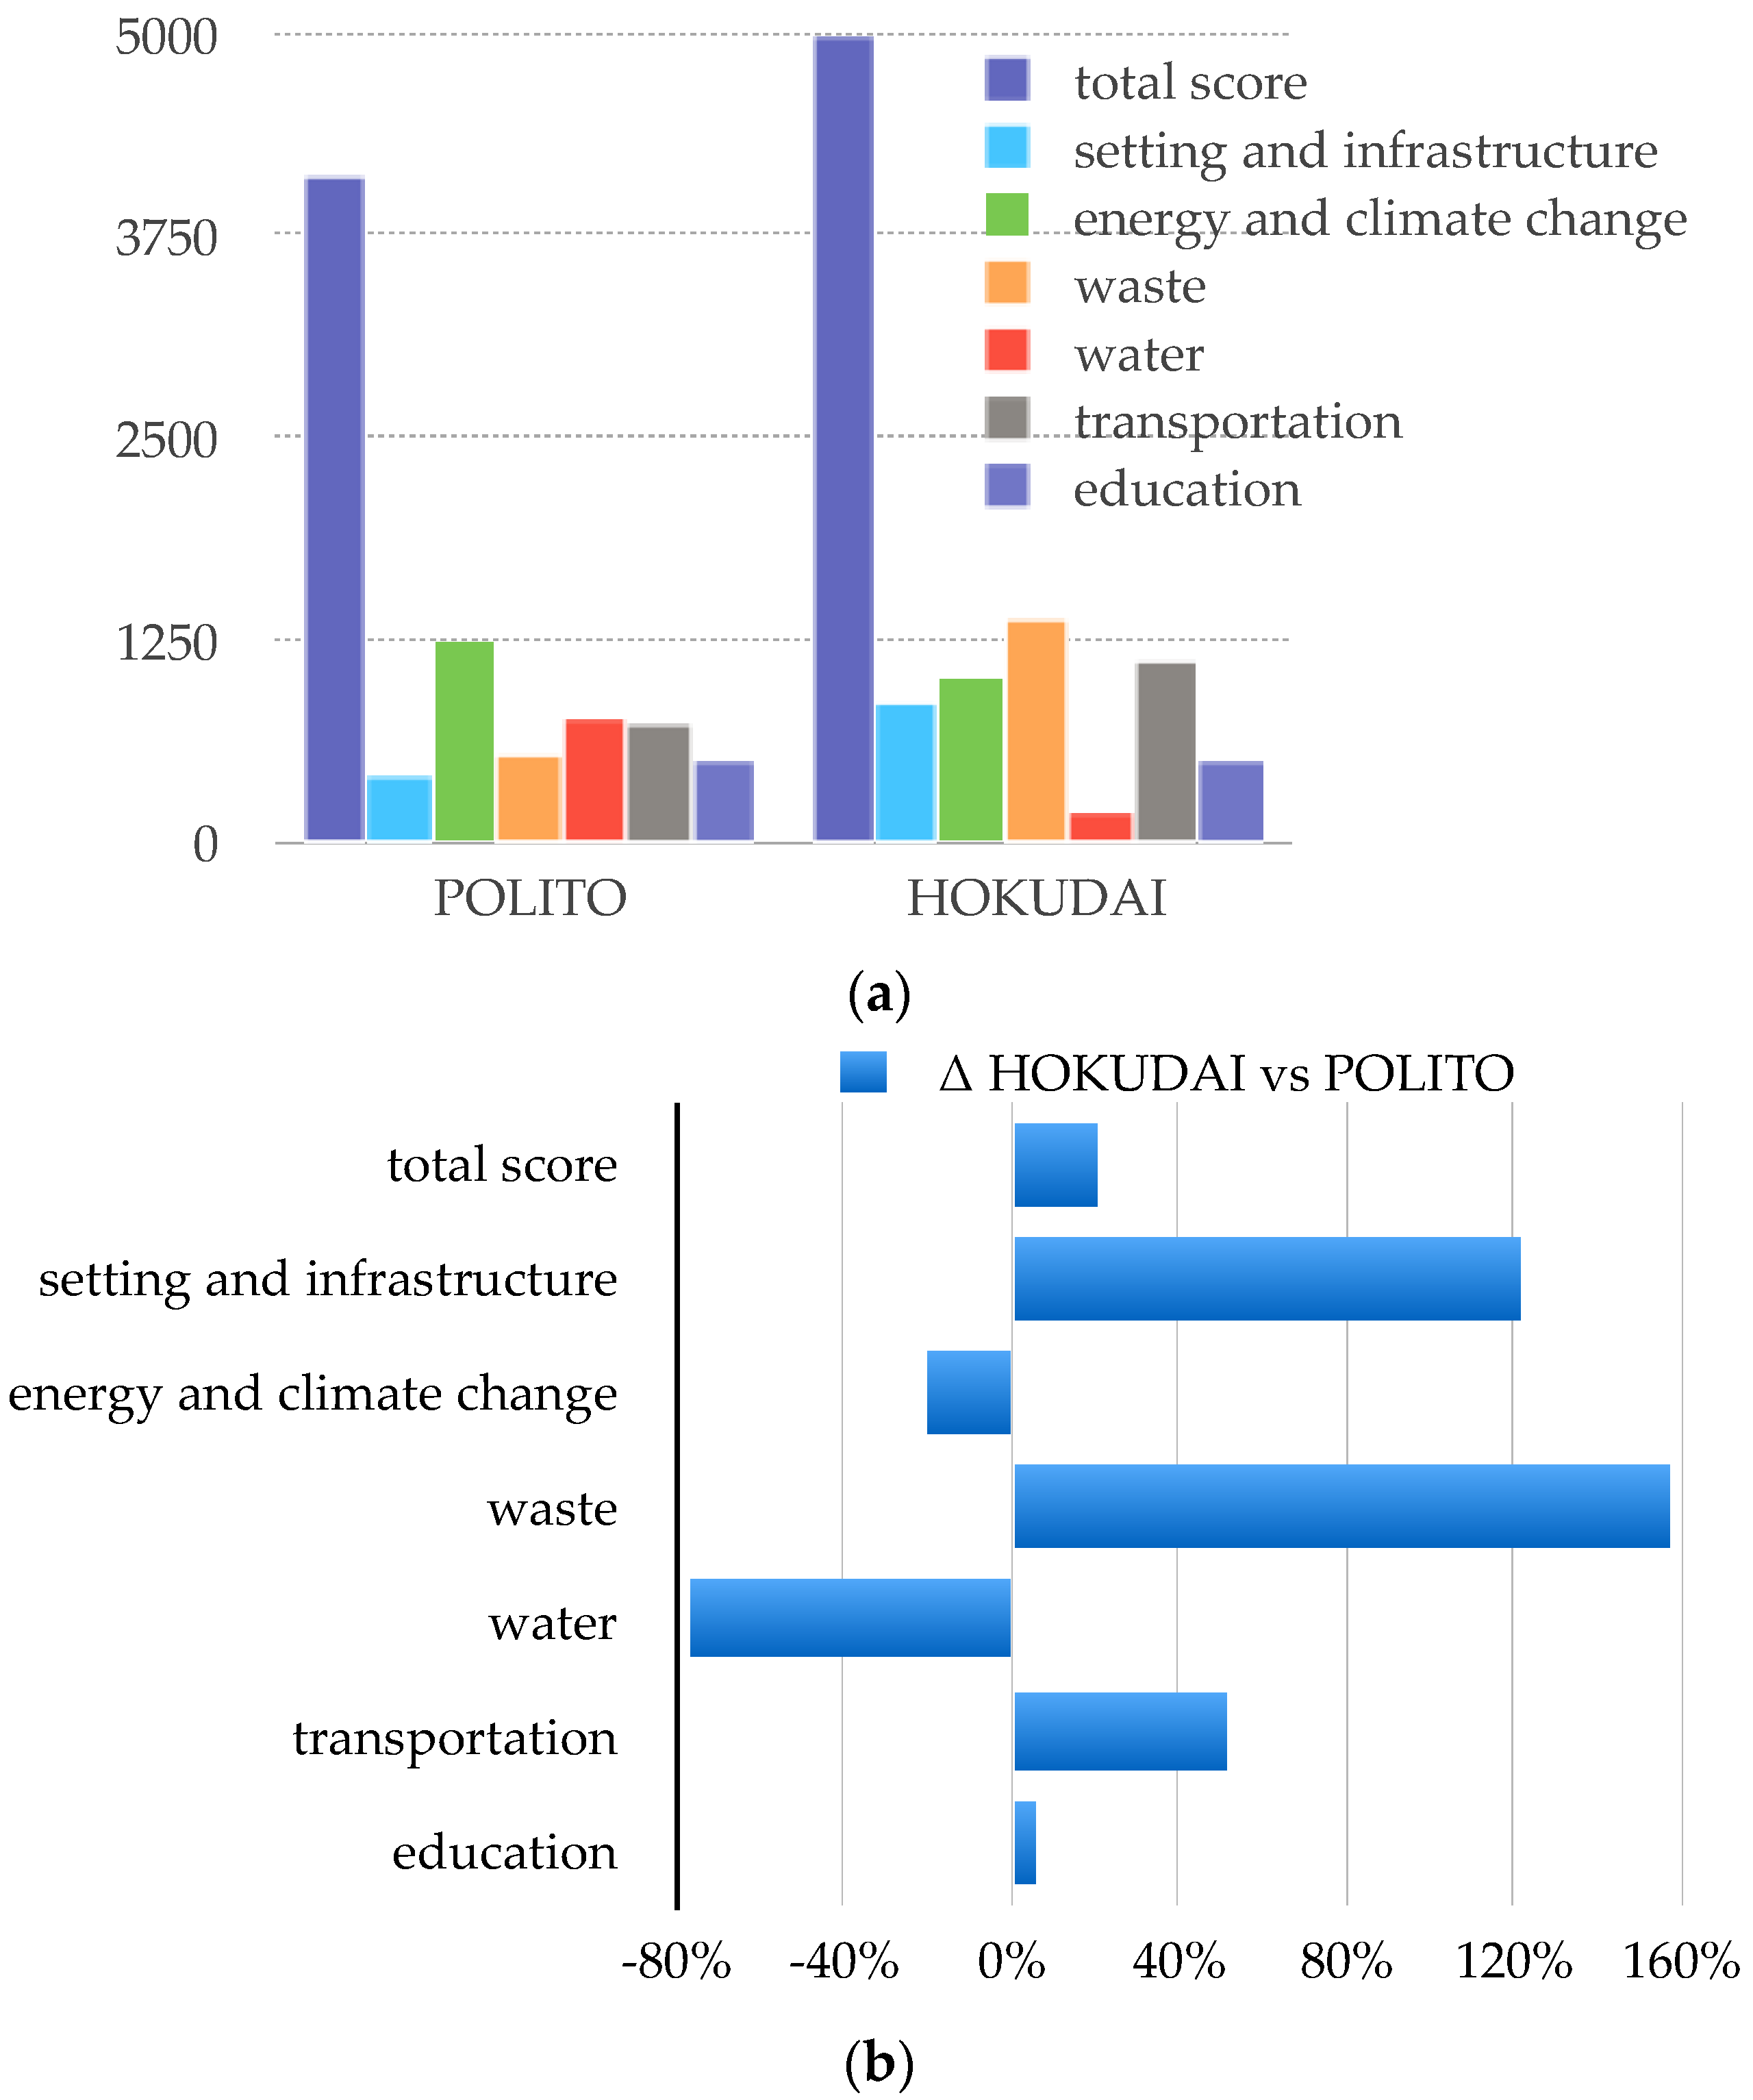
Figure 5 stresses the Green Metric scores for POLITO and HOKUDAI in 2014, with the differences (in percentage) on the total points acquired for each category of criteria. According to these metrics, the position of HOKUDAI is higher than POLITO’s by 71 positions. However, if energy consumption per capita and per square meter (Figure 4) is taken into account, metrics would have suggested totally different rankings and results. Of course, energy consumption is not, as it should not be, the only and main criteria, but it is still the main output of a good sustainability performance (in terms of emissions reduction and minimum wastage of resources). While having more than 10 times less energy consumption, POLITO is penalised for being located within a city that does not allow, due to physical and legal framework constraints, more green spaces (owned by the university), a special waste treatment system, or a dedicated transportation system.
Figure 5.
Green Metric scores for POLITO and HOKUDAI in 2014 (a), with the differences (in percentage) on the total points acquired for each category of criteria (b). Source: author elaboration of data from the Green Metric website.
5. Discussion: toward a “Cluster Approach”, beyond EE Indicators
From the above illustrated comparison it can be observed that both types of frameworks (Green Metric and ISCN) present limits related to: (i) action-based approaches, which are quantitative, precise, but not very flexible, in the case of Green Metric; and (ii) ISCN is definitely open, and within its objective-based approach suggests actions and indicators, but these are not mandatory, not forcing institutions to apply certain “minimum” standards. In order to overcome those gaps, this research paper proposes a twofold approach: (i) from one side it introduces the need to cluster university campuses according to homogeneous features (allowing meaningful comparisons) and (ii) it frames a set of indicators enabling the underpinning of broad, integrated and long term sustainability transitions beyond improving energy efficiency only. Three clusters are therefore proposed in the following Subsection 5.1, Subsection 5.2 and Subsection 5.3 (respectively related to urban morphology, climatic zone and hosted functions) while a set of indicators are suggested in Subsection 5.4.
5.1. Cluster 1: Urban Morphology (Delimited Units or Town-Scattered)
As mentioned in the results section, notwithstanding POLITO is more than 10 times less energy consuming than HOKUDAI, it is penalised in green metrics for its low performances in terms of green spaces, special waste treatments or dedicated transportation systems. Because it is dispersed within a city, those indicators are simply nonsense, due to the physical and legal frameworks constraints (POLITO indeed is using city centre green spaces and cannot own them, or build more because of the prohibitive costs of building new green spaces within a dense historical Italian city centre, and the same justifications can be used for waste treatment or mobility). Indeed, indicators in the “Setting and Infrastructure” criteria, asking for instance the “1.9—Area on campus covered in vegetation in the form of forest”, or “1.10—Percentage of area on campus covered in planted vegetation (include lawns, gardens, green roofs, internal planting)” or “1.11—Non-retentive surfaces on campus as percentage of total area for water absorption” (Green Metrics reports, Appendix B) account for 15% of the total score, penalising POLITO for issues not relating to its own failing, but to constraints embedded in all the campuses nested within city centres. Therefore, in order to make sense of university comparisons within green rankings, two (at least) macro categories are proposed: (i) universities that could be considered as “urban units” themselves, outside the city centre, defined as the college typology by Le Corbusier (“College? Americans constantly say: ‘At college...’ It reflects the presence in their hearts of a great and fine period—the fine period in their lives.... Colleges and universities, then, have a very particular character. Everything in the interest of comfort, everything for the sake of calm and serenity, everything to make solid bodies. Each college or university is an urban unit in itself, a small or large city. But it is a green city. Lawns, parks, stadiums, cloisters, dining halls, a whole complex of comfortable quarters. Often the style is Gothic-that’s the way it is! -rich, luxurious, well made....The American university is a world in itself, a temporary paradise, a gracious stage of life.” [32] (p. 135)) (HOKUDAI campus best fits this category) and (ii) a scattered group of buildings and infrastructure nested within the town (like POLITO). Most notably, the two typologies allow consistent comparison when dealing with indicators of setting and infrastructure, transportation and waste management criteria. A comparison with a third campus like the Polytechnic of Milan, could be the test for such clusters, since it fits with the POLITO morphology type and bypasses all the problems related to the lack of a defined border of university properties. Indeed, the indicators “5.2a—Number of cars entering the university daily”, “5.2b—Number of motorcycles entering the university daily” or “5.6—Campus bus service” as found in the Transportation category (see Green Metric Reports in Appendix B), presume the existence of a urban unit and its border to allow suitable measurements, while the embedded campus would ask for dedicated types of indicators to underpin users’ adoption of sustainable transport systems.
5.2. Cluster 2: Climate Zone
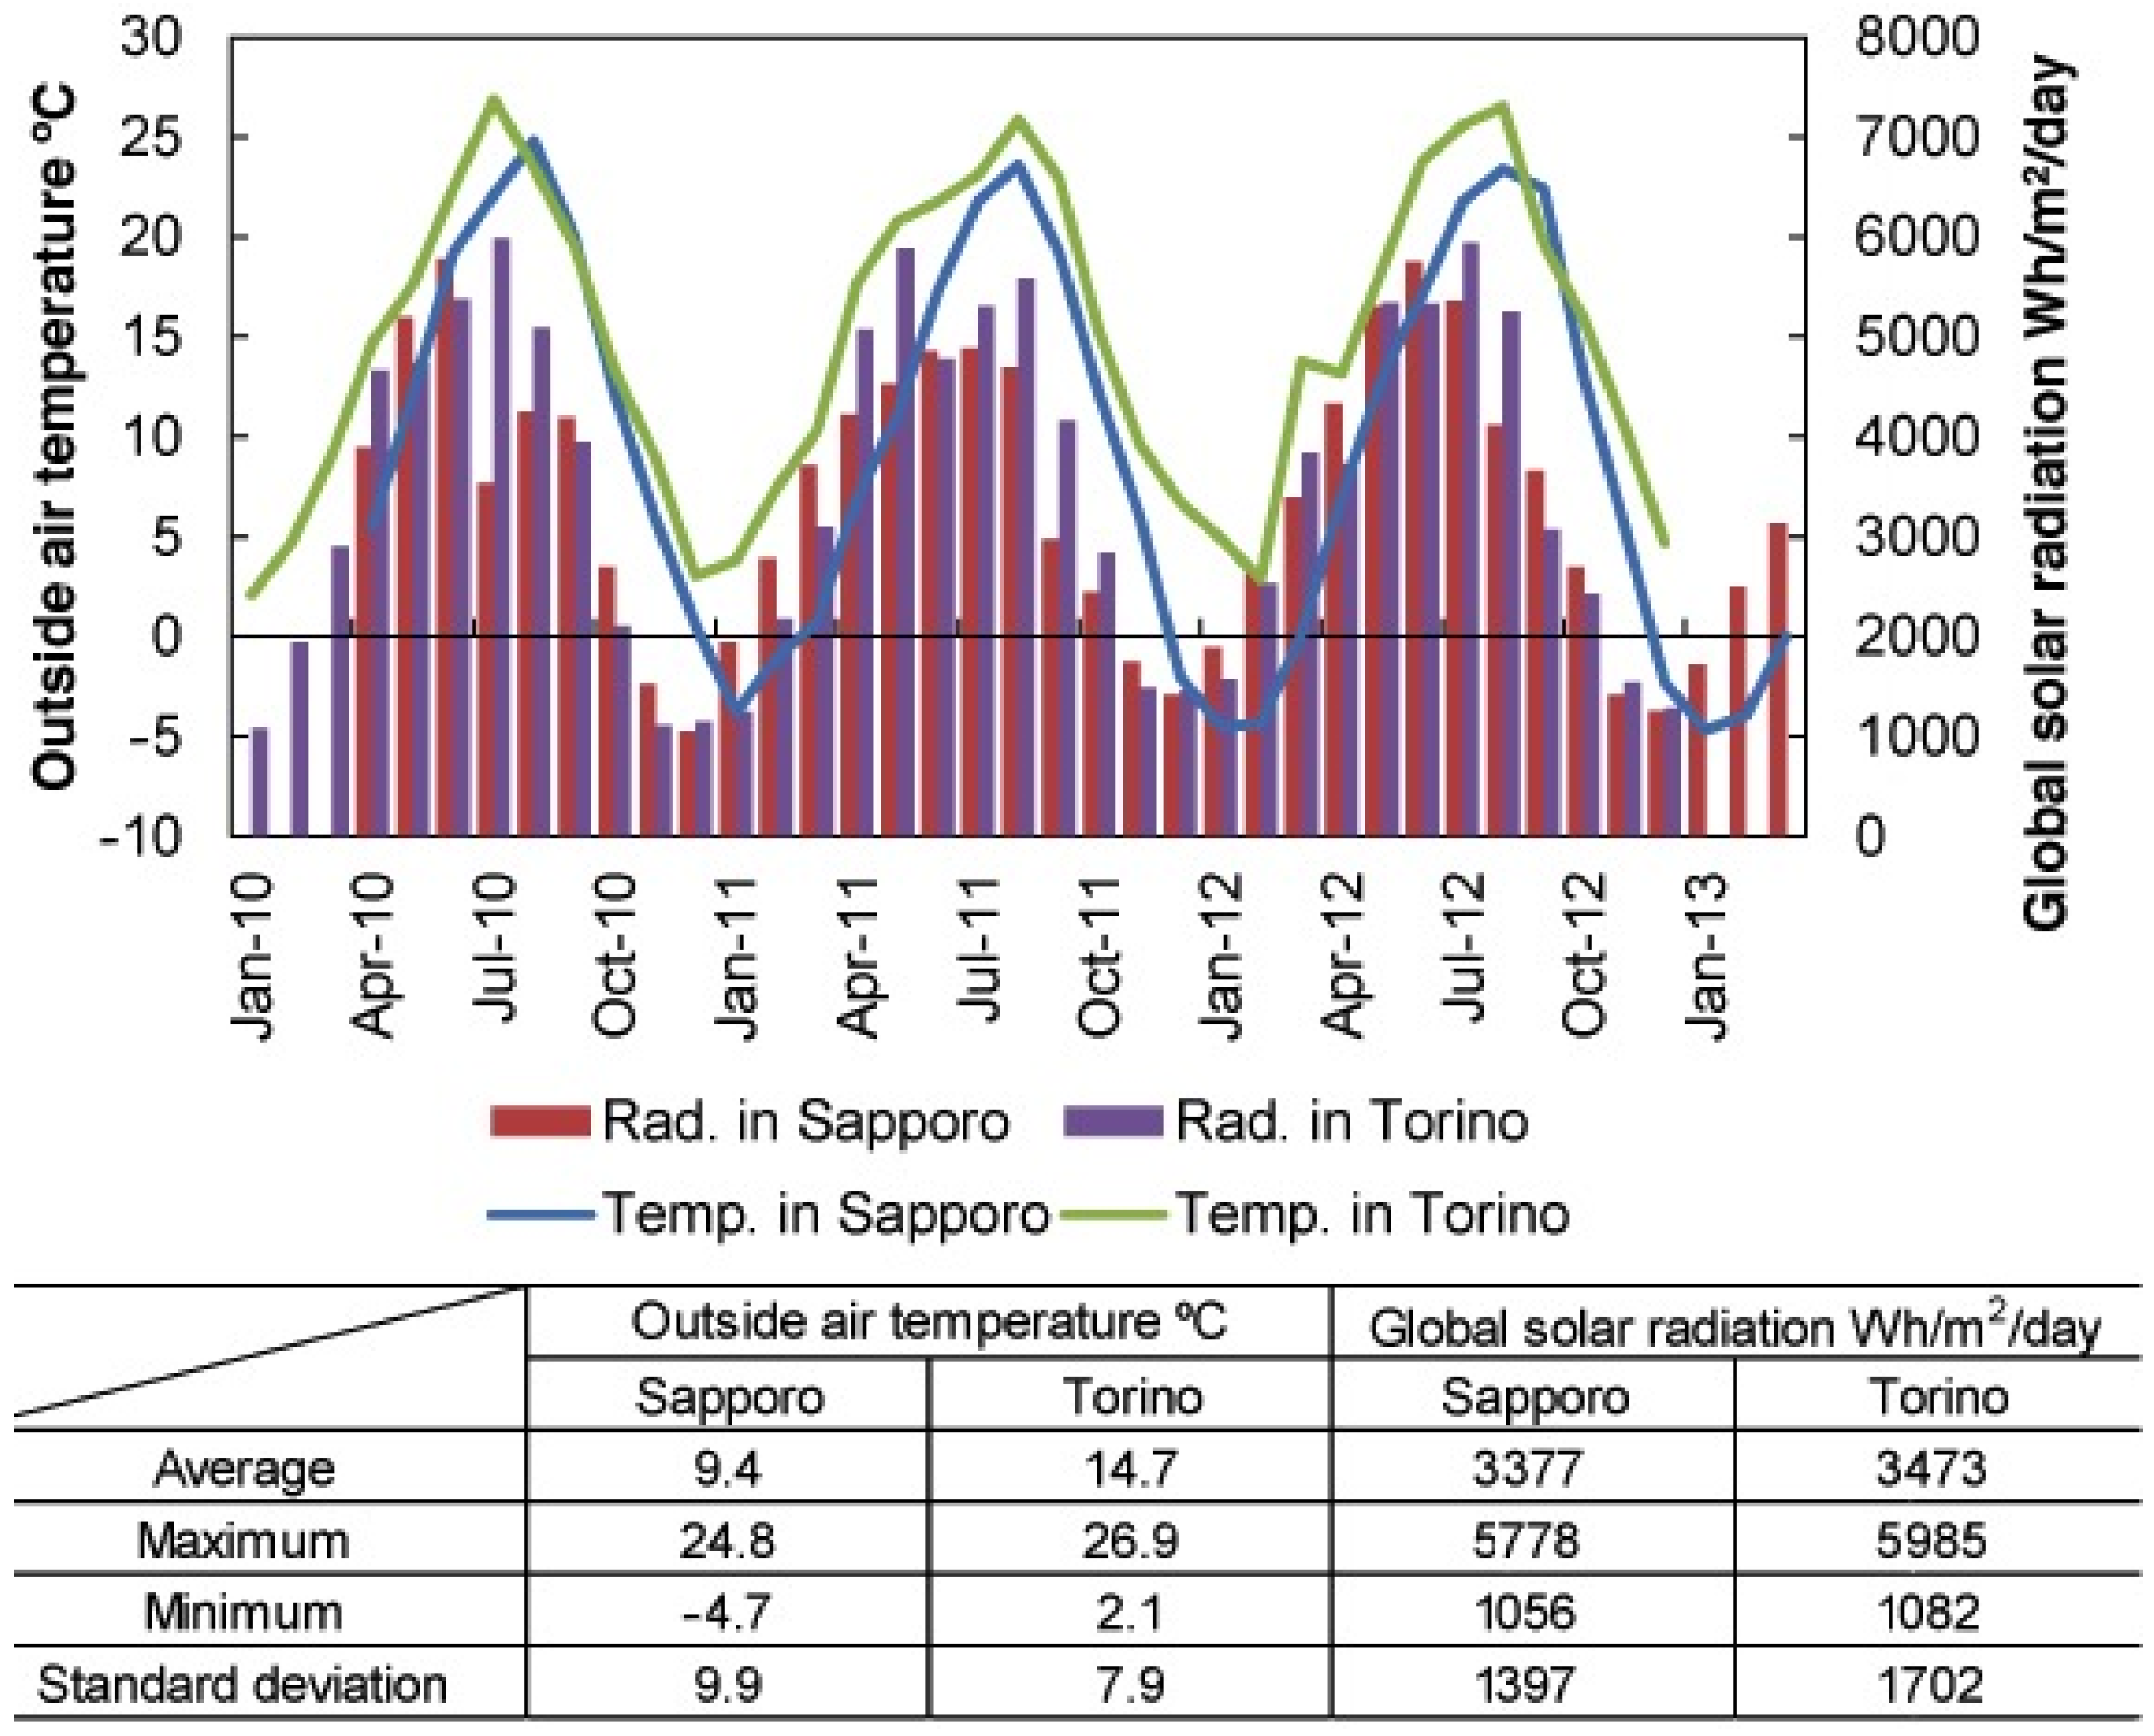
As shown in Figure 6, comparing the two cities hosting the universities in question, over the previous three years, the average outside air temperatures were 9.4 °C for Sapporo and 14.7 °C for Turin. The annual range for Sapporo was wider than for Turin. The average global solar radiation was 3377 Wh/m2/day and 1234 kWh/m2/year for Sapporo and 3473 Wh/m2/day and 1271 kWh/m2/year for Turin. Looking only at July and August, the solar radiation for Turin tended to be much higher than in Sapporo, while the pattern over the months seems to follow the same curve. A cluster related to different climate zones appears essential as far as building energy performances evaluation is always related to relative regional weather patterns [33,34] or even, more recently, to the relative urban climate [35].
Figure 6.
Comparison between Torino and Sapporo weather data from for 2010, 2011, 2012. Source: Ecotect archives.
5.3. Cluster 3: University Functions
The need for this third cluster comes directly from the observation of outliers in the consumption profiles of different buildings within the HOKUDAI campus. It represented a perfect case to study this cluster, since, differently from POLITO, each department occupies a single building, allowing to accurately measure consumption thresholds and patterns. Indeed, from the chart in Figure 7, it appears clear the differences in the electricity consumption of a humanities department (bar No.1), engineering department (No.9), hospital (No.30) or library (No.38).
Figure 7.
Annual electricity consumption breakdown for different departments (The comprehensive list of department and their associated number is shown in Appendix D) in HOKUDAI during 2012. Source: [36].
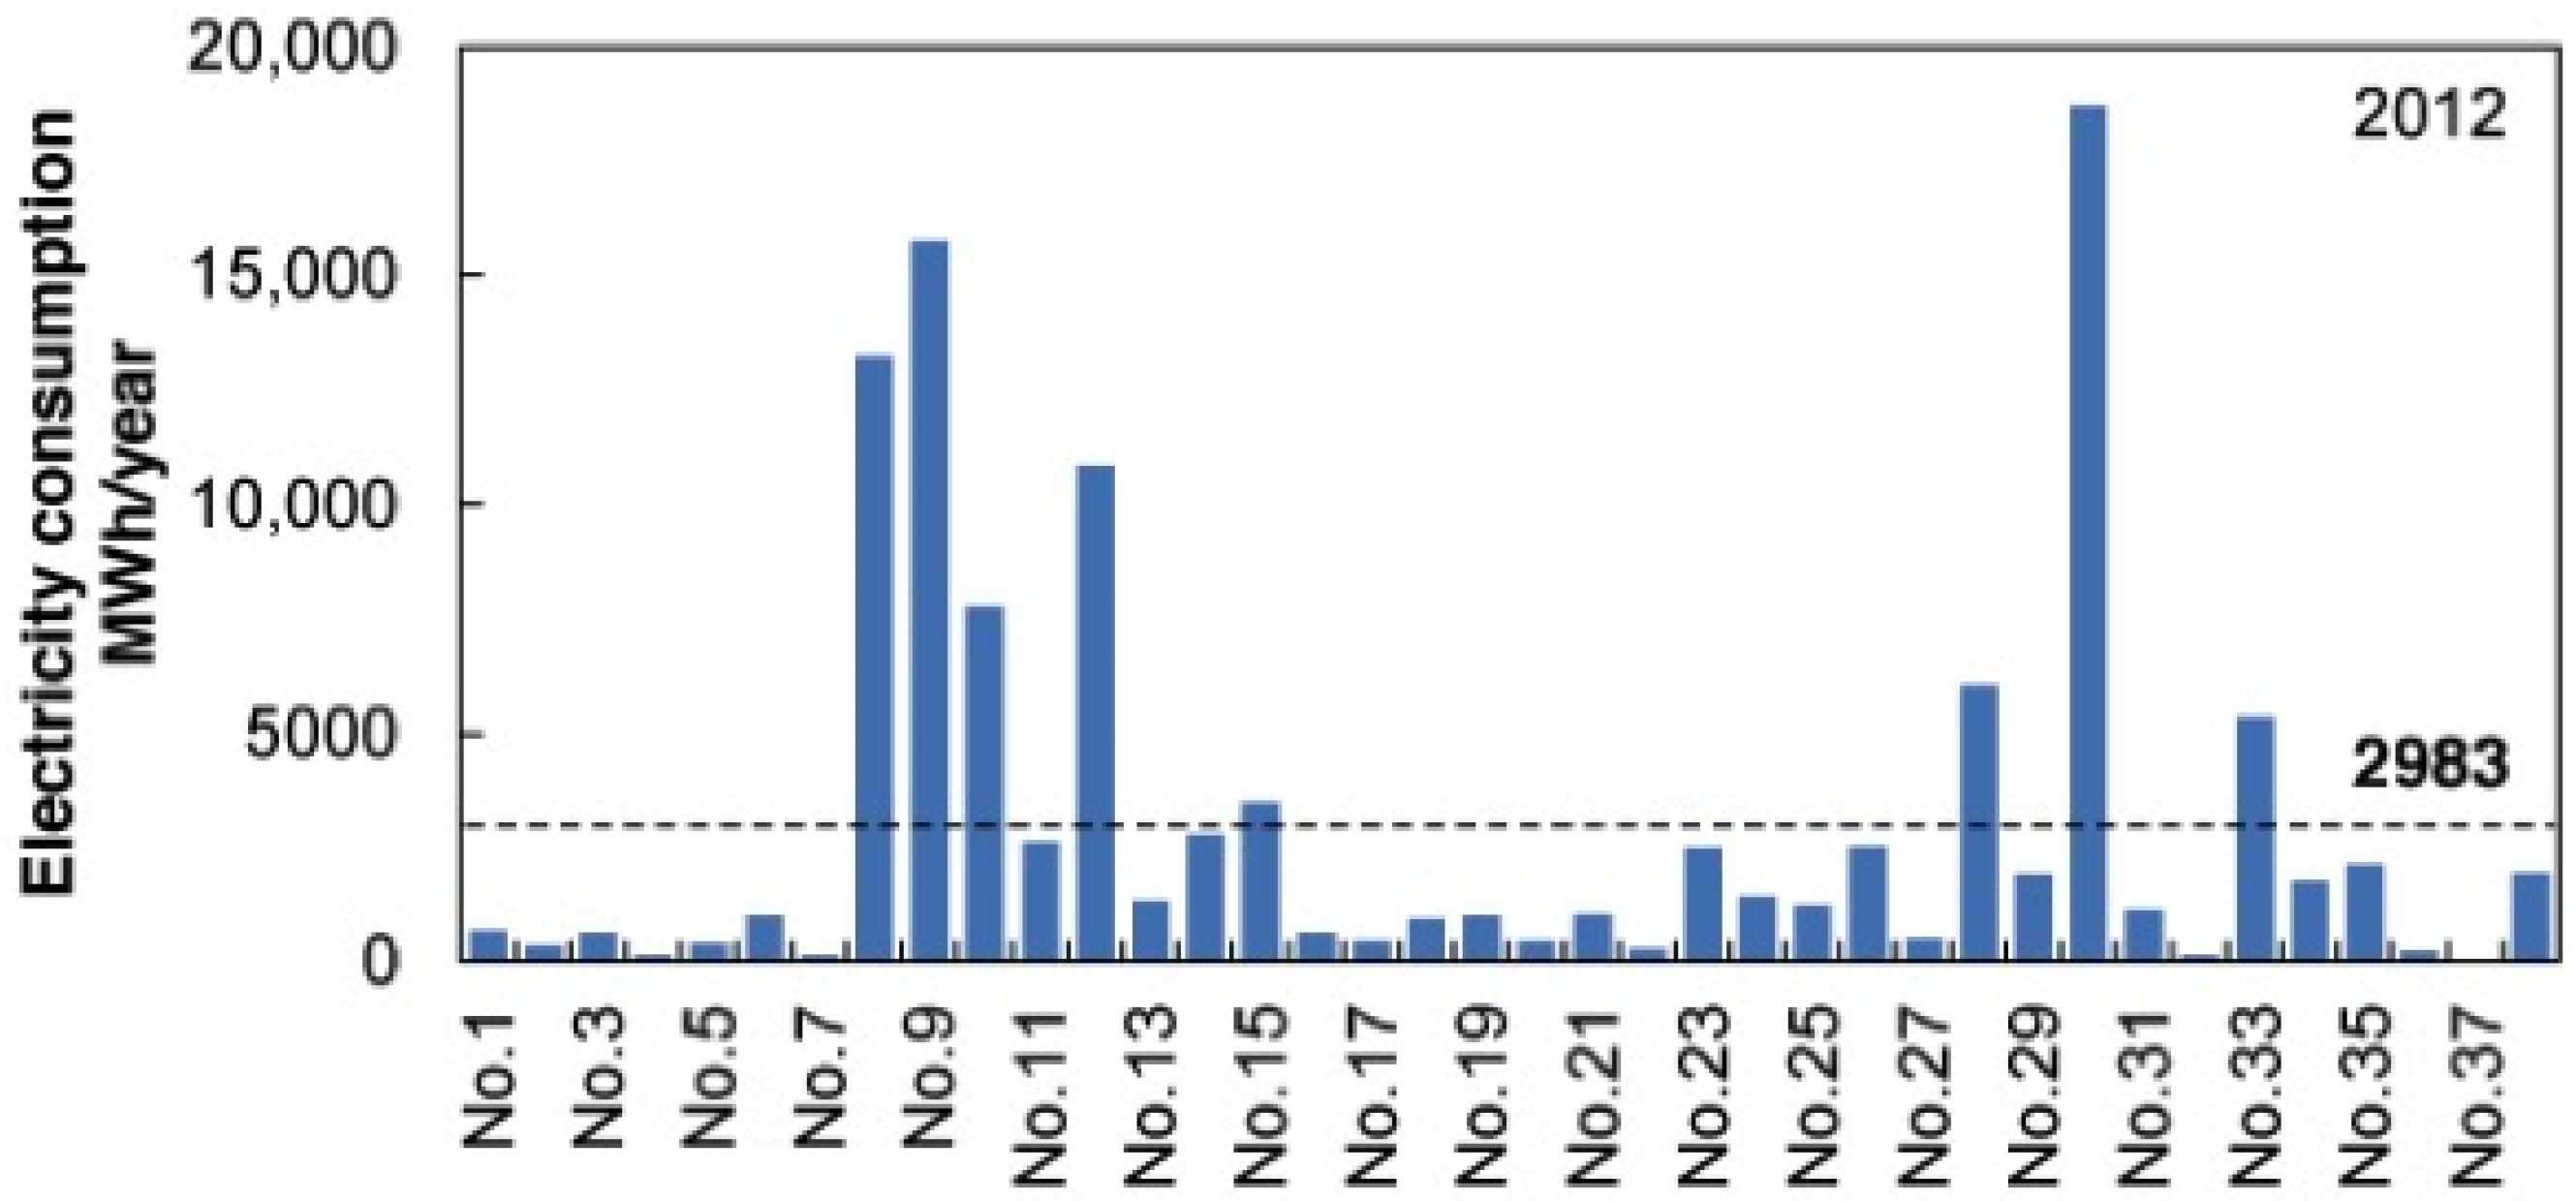
Further research on the typologies of functions that display homogeneous ranges of energy consumption has to be carried out. In HOKUDAI, in 2012, electricity consumption for all the 38 departments was 2983 MWh/year on average; the top five “energivorous” buildings were the University Hospital, and the Engineering, Science, Medicine, and Agriculture departments. From 2008 to 2012, these departments accounted for 60% of the total campus electricity energy consumption.
Clusters accounting for these differences may allow a fair comparison among campuses having similar functions, and may help in setting average thresholds of energy consumption for each department. In the case of peaks due to experiments on behalf of third parties (i.e., when universities are commissioned by industry to do some test requiring intensive energy consumption, like resistances trials on new materials), it can be suggested that each department pay for extra energy consumption. “Nominal” energy bills could also allow a fairer distribution of economic resources among departments and less energy wastage.
5.4. Beyond Current Energy Efficiency Indicators
The distance between quantitative (Green Metric ranking) and qualitative (ISCN reports) campus assessments is unavoidable. As already mentioned from the beginning of the paper, if from one side, ISCN reports do not guarantee commitments in setting targets, from the other side the final list, and ranking, of specific indicators from the Green Metric could result in a black box of actual problems, being not necessarily linked to a virtuous sustainability strategy and, therefore, allowing for some kind of market (green branding) oriented green washing practice. This section presents some perspectives on how the willingness to set targets and indicators and overcoming the limits of voluntary qualitative sustainability reports could be framed, but with a broad view of sustainability, beyond eco-efficiency. Eco-efficiency has become perhaps the most popular concept and tool in corporate environmental and sustainability management, and also the most criticized [37]. Just ticking off the presence/absence of energy efficient appliances (indicator “2.1a”), or an Energy Conservation Program (indicator “2.4”) or a Smart Building program (indicator “2.1b”), does not guard us against prebound/rebound effects [38], and incorrect maintenance of appliances [39], or account for occupant behavioural patterns in the actual use of energy [40]. However, taking into consideration the importance of energy-related issues in the totality of the analysed CSAs (in Table 2, the frequency of adopted macro-criteria across the five most used CSAs), it seems crucial to find more appropriate indicators that bring us closer to the reality of energy use.
Table 2.
The frequency of indicators related to physical elements in five CSAs frameworks. Squared in red, the indicators retrieved in all of the five CSAs. Source: author elaboration from [41].
From looking at the most pressing elements to fixing prebound/rebound effects, such as incorrect maintenance of appliances, or occupant behavioural patterns, it seems more effort needs to be directed towards checking and testing the occupant satisfaction of universities and behavioural patterns in relation to sustainability. The tailoring of user behaviours can be in turn evaluated by ex-ante and ex-post evaluations of proposed actions, crossing-checking data with that from similar institutions and public buildings of similar cultures. Setting “personal” and room-based thresholds for thermo-hygrometric comfort according to the actual building occupants would serve also to point out other factors influencing occupants having a higher level of tolerance to discomfort; for instance, those related to having a higher degree of personal control over indoor temperature, being located in a historical building, or to be socially awarded among colleagues for virtuous energy use. For instance, a higher acceptance of discomfort means that users are more willing to collaborate with the University on energy reduction initiatives and to wear extra layers when the temperature drops below 20 °C.
Further research on the social aspects of energy use may also involve cross-checking these cultural and attitudinal profiles with smart sensor and smart meter data charts, in order to tune the institutional strategies according to the changing (daily and yearly) population of this complex portion of the city.
6. Conclusions
The paper reviews the most common and international Campus Sustainability Assessments (CSAs), outlining their limits in (i) not providing mechanisms for comparison (nationally and internationally); (ii) emphasising mainly Eco-Efficiency (EE) borne indicators, over a range of long-term social and built-environment sustainability measures; and, finally, (iii) because some of them are too narrow and qualitative without normative targets.
The case of Politecnico di Torino POLITO, Italy, has been used to analyse its sustainability performance according to the “Green Metric” and “ISCN report” (two of the most adopted and diffused CSAs), and are then compared with the performance of Hokkaido University HOKUDAI, Japan. Results emphasize the gaps among virtuous sustainability actions (in the case of POLITO) and the Green Metric rankings. Therefore, on the bases of the analyses and results of both cases, and accounting for their structural and functional differences (POLITO is campus sprawled through the city centre, while HOKUDAI is a campus outside the city), a new CSA approach is suggested, proposing “clusters of different university typologies”. In order to build a meaningful comparison among different cases, the cluster approach introduces the need to consider and classify cases according to the following macro-features: (i) spatial structure (scattered throughout the city or compact campuses outside the city); (ii) climatic zone and (iii) hosted functions for each case. At the micro-scale, the need for revising and substituting current eco-efficiency-driven indicators with more life cycle and user-centric related metrics is also proposed, with some examples regarding the energy issue. The adoption of annual user satisfaction surveys can offer great opportunities to track the post-occupancy effect of strategies for energy reduction, to profile the levers and the cultural attitudes of the university community, and to tailor internal temperature thresholds according to single margins of acceptance. Such a new approach—attentive to local constraints and long-term tracking of outcomes rather than an absolute record of taken actions—can help build homogenous university case studies, framed accordingly within clusters, to find similar and scalable successful practices, and also in self-monitoring progress toward achieving a truly sustainable university campus.
Acknowledgments
This research was supported by a Marie Curie International Research Staff Exchange Scheme Fellowship within the 7th European Community Framework Program, Marie Curie IRSES Grant Agreement Number: PIRSES-GA-2010-269161, named “UNI-Metrics/Value Metrics and Policies for Sustainable University Campus”. More info on the website: http://www.uni-metrics.polito.it/.
Author Contributions
The superintendence of Lombardi let the data collection run smoothly along the two institutions. The bold revision process that gave the article the present structure, introduction and conclusion was put in place by Chelleri. Sonetti was in charge of the chapters’ contents.
Conflicts of Interest
The authors declare no conflict of interest.
Abbreviations
The following abbreviations are used in this manuscript:
| POLITO | Politecnico di Torino |
| HOKUDAI | Hokkaido University |
| CSA | Campus Sustainability Assessment |
| EE | Eco Efficiency |
| ISCN | International Sustainable Campus Network |
| PE | Primary Energy |
Appendix A
The ISCN criteria and three principles held by POLITO.
The Politecnico di Torino has opted to divide the activities it carried out in the field of sustainability into five dimensions which highlight the most specific points of interest and which represent it in the most appropriate light possible.
- Energy and Buildings: towards energy efficiency
This dimension highlights POLITO’s focus on the reuse of sections of the city and pre-existing buildings, in continuing restoration and modernization for sustainability, and economic and energy efficiency.
- Urban Outreach: towards integration in the city
This dimension was conceived to represent the sustainability of POLITO, in view of the urban/ metropolitan range of action (urban outreach), subtending a mature awareness of the need to offer a widespread and multi-polar system of services, which are highly interconnected, and permeable with the local resources (public and private companies and institutions at various levels).
- Mobility and Metropolitan Area: towards a widespread and multi-polar campus
This dimension instead represents the relationship and the connection that the university builds with the outside; but above all, it represents the viewpoint of mobility and the transfers that the staff and users (of whom there are many) undertake every day, making the POLITO a centre of activity for the city of Turin.
- People and Food: towards better quality of life
This dimension represents the POLITO focus on the wellness of those who live there daily (administrative technicians, teaching staff, students) supporting all activities undertaken in terms of security and quality of life, paying particular attention to food, education and research.
- Purchasing and Waste: towards complete closure of products’ lifecycles
Finally, the last dimension aims to highlight all the sustainable activities connected to the products’ lifecycle theme, from purchase to disposal, trying to spread the recycle-reuse-decrease culture, which should be the fundamental approach.
These five dimensions are then crossed to three ISCN principles as described in Table A1.
Namely, the three basic principles of the ISCN network are:
- (1)
- Principle 1: Buildings and their sustainability impact. To show respect for nature and society, sustainability considerations should be an integral part in the planning, construction, renovation, and operation of buildings on campus.
- (2)
- Principle 2: Campus wide planning and target setting. To ensure long-term sustainable campus development, campus-wide master planning and target setting should include environmental and social goals.
- (3)
- Principle 3: The integration of research, teaching, facilities and outreach. To align the organization’s core mission with sustainable development, facilities, research, and education should be linked to create a “living laboratory” for sustainability.
Table A1.
The five dimensions (in bold) crossed to three ISCN principles (in italic) as described in the POLITO ISCN report.
Appendix B
Table A2.
The Green Metric 2014 report for HOKUDAI and POLITO.
Appendix C
List of interviewed stakeholders:
- Key stakeholders in the sustainability management at POLITO:
- (1)
- Prof. R. Borchiellini (Vice Rector, Facility Manager)
- (2)
- Prof. B. Dalla Chiara (Mobility Manager)
- (3)
- Prof. D. Fino (Waste Manager)
- (4)
- Prof. G.V. Fracastoro (Energy Manager)
- (5)
- Prof. P. Lombardi
- (6)
- Prof. P. Tamborrini
- (7)
- Prof. S. Corgnati
- (8)
- Prof. M. Bottero
- Interviewed in the POLITO sub-groups managers:
- (1)
- Living LAB—Gianni Carioni, manager
- (2)
- EDILOG Office—Construction and Logistics Area, Valeria Giovanardi, Manager
- (3)
- IT Office—Information Technology Area, Piero Bozza, Manager
- (4)
- AQUI Office—Goods and Services Provision Area
- (5)
- GESD Office—Teaching Direction Area
- (6)
- CORE Office—Communication, Events and Public Relations Services
- (7)
- SiTI—Higher Institute on Territorial Systems for Innovation, Valentina Ferretti, Marco Valle, Stefano Fraire, Luisa Ingaramo, Stefania Sabatino, Francesca Bodano, researchers
- Key stakeholders in the sustainability management at HOKUDAI:
- (1)
- Prof. Masahiko Fuji, Associate professor at the Graduate School of Environmental Science, Member of the Sustainable Low-Carbon Society Project 2010
- (2)
- Prof. Takao Ozasa, Associate Professor, Laboratory of Urban Design, Division of Architectural Design, Faculty of Engineering, Director of the Office for Sustainable Campus
- (3)
- Dr. Maki Komatsu, Coordinator, Office for a Sustainable Campus
- (4)
- Mr. Tomohiro Morimoto, Unit chief, Facilities Department, Sustainable Campus Promotion Division, Office for Sustainable Campus
- (5)
- Mr. Takashi Yokoyama, Project Manager, Office for a Sustainable Campus
- (6)
- Prof. Takeo Ozawa, Faculty of Engineering, Architectural and Structural Design, Human Settlement Design
Students of attending the Candle Night 2013 event, members of Art Challenge “Takikawa” and the Environmental Promotion Section, master students at the Public Policy School, and international students at the Graduate School of Environmental Science.
Appendix D
Table A3.
The HOKUDAI buildings analysed for their electricity consumption.
References
- Wright, T. University presidents’ conceptualizations of sustainability in higher education. Int. J. Sustain. High. Educ. 2010, 11, 61–73. [Google Scholar] [CrossRef]
- Seitzinger, S.P.; Svedin, U.; Crumley, C.L.; Steffen, W.; Abdullah, S.A.; Alfsen, C.; Broadgate, W.J.; Biermann, F.; Bondre, N.R.; Dearing, J.A. Planetary stewardship in an urbanizing world: Beyond city limits. Ambio 2012, 41, 787–794. [Google Scholar] [CrossRef] [PubMed]
- Tukker, A.; Emmert, S.; Charter, M.; Vezzoli, C.; Sto, E.; Andersen, M.M.; Geerken, T.; Tischner, U.; Lahlou, S. Fostering change to sustainable consumption and production: An evidence based view. J. Clean. Prod. 2008, 16, 1218–1225. [Google Scholar] [CrossRef]
- Jackson, T. Prosperity without Growth: Economics for a Finite Planet, 2nd ed.; Routledge: New York, NY, USA, 2011. [Google Scholar]
- Hordijk, I. Position paper on sustainable universities. J. Clean. Prod. 2014, 14, 810–819. [Google Scholar]
- Cole, L. Assessing Sustainability on Canadian University Campuses: Development of a Campus Sustainability Assessment Framework. Master’s Thesis, Royal Roads University, Sooke, Victoria, BC, California, 2003. [Google Scholar]
- Green, T.L. Teaching (un)sustainability? University sustainability commitments and student experiences of introductory economics. Ecol. Econ. 2013, 94, 135–142. [Google Scholar] [CrossRef]
- Zsóka, Á.; Szerényi, Z.M.; Széchy, A.; Kocsis, T. Greening due to environmental education? Environmental knowledge, attitudes, consumer behavior and everyday pro-environmental activities of Hungarian high school and university students. J. Clean. Prod. 2013, 48, 126–138. [Google Scholar] [CrossRef]
- Lozano, R. Diffusion of sustainable development in universities’ curricula: An empirical example from Cardiff University. J. Clean. Prod. 2010, 18, 637–644. [Google Scholar] [CrossRef]
- Alshuwaikhat, H.M.; Abubakar, I. An integrated approach to achieving campus sustainability: Assessment of the current campus environmental management practices. J. Clean. Prod. 2008, 16, 1777–1785. [Google Scholar] [CrossRef]
- The Buildings Performance Institute Europe (BPIE). Breakdown of the Building Stock by Building Type. 2011. Available online: http://www.buildingsdata.eu/data-search/results (accessed on 22 November 2015).
- Ministry of Education, Culture, Sports, Science and Technology (MEXT). A Bench-Marking Method for Facility Management. Available online: Http://www.mext.go.jp/component/b_menu/shingi/toushin/__icsFiles/afieldfile/2010/08/23/1296613_1.pdf (accessed on 11 January 2016). (In Japanese)
- Li, X.; Tan, H.; Rackes, A. Carbon footprint analysis of student behavior for a sustainable university campus in China. J. Clean. Prod. 2015, 106, 97–108. [Google Scholar] [CrossRef]
- Trencher, G.P.; Yarime, M.; Kharrazi, A. Co-creating sustainability: Cross-sector university collaborations for driving sustainable urban transformations. J. Clean. Prod. 2013, 50, 40–55. [Google Scholar] [CrossRef]
- Eagan, D.J.; Orr, D.W. Campus and Environmental Responsibility; Jossey-Bass: Hoboken, New Jersey, NJ, USA, 1992. [Google Scholar]
- Leal Filho, W. Sustainability and university life. Int. J. Sustain. High. Educ. 2000. [Google Scholar] [CrossRef]
- McIntosh, M.; Cacciola, K.; Clermont, S.; Keniry, J. State of the campus environment: A National Report Card on Environmental Performance and Sustainability in Higher Education. Available online: https://www.nwf.org/Campus-Ecology/Resources/Reports/State-of-the-Campus-Environment-Report/Read-the-State-of-the-Campus-Environment-Report.aspx. (accessed on 4 January 2016).
- Del Alonso-Almeida, M.M.; Marimon, F.; Casani, F.; Rodriguez-Pomeda, J. Diffusion of sustainability reporting in universities: Current situation and future perspectives. J. Clean. Prod. 2015, 106, 144–154. [Google Scholar] [CrossRef]
- Shriberg, M. Institutional assessment tools for sustainability in higher education: Strengths, weaknesses, and implications for practice and theory. Int. J. Sustain. High. Educ. 2002, 3, 254–270. [Google Scholar] [CrossRef]
- Rauch, J.N.; Newman, J. Defining sustainability metric targets in an institutional setting. Int. J. Sustain. High. Educ. 2009, 10, 107–117. [Google Scholar] [CrossRef]
- Derrick, S. Time and Sustainability Metrics in Higher Education. In Sustainability Assessment Tools in Higher Education Institutions; Springer: Cham, Switzerland, 2013; pp. 47–63. [Google Scholar]
- Caeiro, S.; Leal Filho, W.; Jabbour, C.; Azeiteiro, U.M. Sustainability Assessment Tools in Higher Education Institutions. Springer: Cham, Switzerland, 2013. [Google Scholar]
- Figge, F.; Hahn, T. Sustainable value added—Measuring corporate contributions to sustainability beyond eco-efficiency. Ecol. Econ. 2004, 48, 173–187. [Google Scholar] [CrossRef]
- Adams, C.A.; Larrinaga-González, C.; Adams, C.A.; McNicholas, P. Making a difference: Sustainability reporting, accountability and organisational change. Account. Audit. Account. J. 2007, 20, 382–402. [Google Scholar] [CrossRef]
- Verhulst, E.; Lambrechts, W. Fostering the incorporation of sustainable development in higher education. Lessons learned from a change management perspective. J. Clean. Prod. 2014, 106, 189–204. [Google Scholar] [CrossRef]
- Calder, W.; Clugston, R.M. Progress toward sustainability in higher education. Environ. Law Rep. News Anal. 2003, 33, 10003–10022. [Google Scholar]
- Arroyo, P. A new taxonomy for examining the multi-role of campus sustainability assessments in organizational change. J. Clean. Prod. 2015, in press. [Google Scholar] [CrossRef]
- Spira, F.; Tappeser, V.; Meyer, A. Perspectives on Sustainability Governance from Universities in the USA, UK, and Germany: How do Change Agents Employ Different Tools to Alter Organizational Cultures and Structures? In Sustainability Assessment Tools in Higher Education Institutions; Springer: Cham, Switzerland, 2013; pp. 175–187. [Google Scholar]
- Ceulemans, K.; Molderez, I.; van Liedekerke, L. Sustainability reporting in higher education: A comprehensive review of the recent literature and paths for further research. J. Clean. Prod. 2015, 106, 127–143. [Google Scholar] [CrossRef]
- Lang, T. Campus sustainability initiatives and performance: Do they correlate? Int. J. Sustain. High. Educ. 2015, 16, 474–490. [Google Scholar] [CrossRef]
- National Bureau of Statistics of China (NBSC). China Statistical Yearbook; China Statistics Press: Beijing, China, 2012. [Google Scholar]
- Corbusier, L. When the Cathedrals were White; McGraw-Hill: New York, NY, USA, 1964. [Google Scholar]
- Kottek, M.; Grieser, J.; Beck, C.; Rudolf, B.; Rubel, F. World map of the Köppen-Geiger climate classification updated. Meteorol. Z. 2006, 15, 259–263. [Google Scholar] [CrossRef]
- Briggs, R.S.; Lucas, R.G.; Taylor, Z.T. Climate classification for building energy codes and standards: Part 1-development process. Trans. Soc. Heat. Refrig. Air Cond. Eng. 2003, 109, 109–121. [Google Scholar]
- Stewart, I.D.; Oke, T.R. Local Climate Zones for Urban Temperature Studies. Bull. Am. Meteorol. Soc. 2012, 93, 1879–1900. [Google Scholar] [CrossRef]
- Sonetti, G.; Kikuta, K. Report on Priorities of Criteria and Cross-Comparison POLITO-HOKUDAI Energy Performance. Available online: http://www.uni-metrics.polito.it/documenti/universitycampusenergymanagement.pdf (accessed on 4 January 2016).
- Korhonen, J.; Seager, T.P. Beyond eco-efficiency: A resilience perspective. Bus. Strategy Environ. 2008, 17, 411–419. [Google Scholar] [CrossRef]
- Sunikka-blank, M.; Galvin, R. Introducing the prebound effect: The gap between performance and actual energy consumption. Build. Res. Inf. 2012, 40, 260–273. [Google Scholar] [CrossRef]
- De Wilde, P. The gap between predicted and measured energy performance of buildings: A framework for investigation. Autom. Constr. 2014, 41, 40–49. [Google Scholar] [CrossRef]
- Chappells, H.; Shove, E. Debating the future of comfort: Environmental sustainability, energy consumption and the indoor environment. Build. Res. Inf. 2005, 33, 32–40. [Google Scholar] [CrossRef]
- Re3build. How to Create Sustainable Campus Assessment System. Available online: https://re3buildicu.files.wordpress.com/2015/01/re3build-icu-t-ozasa-assessment-system-sustainable-campus-28jan2015.pdf (accessed on 22 November 2015).
© 2016 by the authors; licensee MDPI, Basel, Switzerland. This article is an open access article distributed under the terms and conditions of the Creative Commons by Attribution (CC-BY) license (http://creativecommons.org/licenses/by/4.0/).