1. Introduction
Academic institutions plays a crucial and important role in helping the world adapt to a changing planet and to challenging issues, such as climate change, which continues unabated [
1]. Tufts Greenhouse Gas Inventory speaks on the issue by stating, “rising global temperatures are expected to raise sea level, and change precipitation and other local climate conditions. Changing regional climate is projected to alter forests, crop yields, and water supplies and affect human health, animals, and many types of ecosystems” [
2]. Scientists agree with statements put forth by the United Nations Intergovernmental Panel on Climate Change (IPCC): “Human activities—primarily burning of fossil fuels—are modifying the concentrations of greenhouse gases” (Working Group I) [
3]. In other words, since it is people putting these greenhouse gases into the atmosphere, which causes global temperatures to rise, we can be fairly certain that humans are the main cause of global warming [
4]. Thus, the act of planning ahead has never been more necessary. However, it is the lack of long-term thinking that has inhibited large-scale, global changes.
Finally, in 1997, when the Kyoto Protocol was instituted, long-term plans were initiated. The Kyoto Protocol is an international agreement signed by large, diverse or developing countries to commit to an average of a five percent reduction in emissions [
5]. The Kyoto Protocol uses 1990 emissions levels, current emissions levels and forecasting, so that emission reduction targets can be established [
6]. There is no legal requirement for our universities and other organizations to meet or exceed the reductions associated with the Kyoto Protocol, but the fact that greenhouse gas reductions lend themselves so well to evaluation is another asset of embracing the climate change challenge.
Before analyzing the role academic institutions play in combatting climate change, one needs to understand the activities associated with an institution’s contribution to climate change by creating a GHG emissions inventory [
2]. By measuring our past and current emissions, we can plan ahead for future generations in an effective and economical manner, which is the very essence of sustainability. In 1987, the United Nations convened at the Brundtland Commission to address growing concerns of global sustainable development. The commission prioritized encouraging youth to be responsible for launching a global environmental consciousness. The United Nations observes that they are calling the young to action and that “the world’s teachers will have a crucial role to play in bringing this report to them” [
7].
Institutions of higher education are largely self-contained. Many have their own power plants, dining areas, transportation circuits, water systems and healthcare services, making an academic institution operation similar to that of a city. This understanding brings to light the importance of this study: the academic institution is the perfect test system for up and coming sustainable methodologies that could be implemented on a city level [
8,
9,
10]. Some university activities, such as electricity generation, impose dramatic degrading externalities on the environment [
11]. Yet, few institutions know how to transform their concern into action. Academic institutions and published research are well placed to take a leadership role in combating climate change [
6].
In this study, we compiled a comprehensive inventory of campus greenhouse gas (GHG) emissions and researched GHG emissions across multiple institutions of higher education. This paper is guided by two major research questions: how is St. Edward’s University reducing its emissions sources from 2009 to 2013, and how are other Texas institutions measuring up to each other in terms of their energy use and their techniques to mitigate GHG emissions?
2. Background
The United Nations has shown its allegiance with academic sustainability goals in its First Two Years Report. This is a call to governments to implement a decade-long sustainable development plan, which includes integrating sustainability into all forms of liberal education [
12]. Sustainability, on a fundamental level, is interdisciplinary; because it requires the cooperation of many facets of society: geopolicy, economy, anthropology, biology and ecology [
13]. The UN’s focus on sustainability in higher education is not random, as we stated before: a college campus is often its very own village, and the carbon footprint it leaves can be significant, yet easily managed [
14]. By encouraging the infusion of sustainability principles into every aspect of higher education, we hope to promote a movement toward a sustainable world that will become regular practice in the sectors of business, government and education.
The state of Texas has more than 100 institutions of higher learning [
15]. These institutions vary tremendously, ranging from multiple buildings to just one [
16]. Some have gigantic populations; for example, University of Texas nears the top of the list of largest universities in the U.S. [
17]. Some are considered teaching institutions, whereas others are considered research institutions; in fact, the authors will explore how this affects the accounts of GHG emissions. The diverse nature of the institutions makes comparisons difficult [
18]). In order to create a meaningful study despite the differences, the authors compare small
versus large universities, research
versus teaching institutions and the climatic differences. There are many examples of campuses going green in order to reduce their carbon emissions [
15,
19]. Rice University has submitted an Integrated Climate and Energy Master Plan, or RICEMaP, for review as a formal plan to mitigate GHG emissions. Another example is St. Edward’s University, who expanded their library by 929 m
2, yet decreased the electricity consumption of the library by 20 percent with energy-efficient measures. Ultimately, by introducing sustainable programs and practices, universities are decreasing costs and carbon. Some colleges and universities are doing this better than others, and it is our purpose to determine which are working and which have areas for improvement [
20,
21]. Ultimately, the authors assert that universities not only do this to boost their environmental programs, but also because it makes financial sense. For example, some universities implement carpool or ride share programs because they do not have land that can be devoted to surface parking lots or they cannot afford to build a costly parking garage, which is “generally in the range of $15,000 to $30,000 per net new parking space” [
14,
22]. Further, a government report estimates that colleges and universities spend six billion dollars annually on energy [
23].
3. Hypothesis and Objectives
We explore several hypotheses that examine connections between effects on emissions rates and the establishment of sustainability office positions, environmental groups and other organizations on campus.
Our first hypothesis (H1) is that St. Edward’s emissions will be lower than the previous study due to the implementation of a sustainability office.
Our second hypothesis (H2) to be tested is that schools with long-standing sustainability offices will have lower emissions per capita.
Overall, we explore the effects long-standing sustainability offices have on GHG emissions. In this paper, we will itemize the sources of GHG emissions for participating universities to assist the participants in planning GHG emission reduction strategies.
3.1. Objective One
The first objective of our study was to conduct a temporal case study of St. Edward’s University. By conducting an in-depth GHG inventory for fiscal year 2012 to 2013, the authors aim to provide the St. Edward’s sustainability programs with more clout to mandate greater sustainability practices throughout the institution.
The Students for Sustainability group and the Office of Sustainability are new aspects to campus life at St. Edward’s. In 2009, the aforementioned group gathered GHG emission data at St. Edward’s and formulated conclusions based on these data [
24]. These historical data are used as a means for comparing improvements made to GHG emissions throughout the campus. For example, St. Edward’s has experienced significant growth in the past five years, but the energy budget has decreased by 27 percent. We compare the difference between our past and present study with changes in building size, population size and the establishment of various sustainability entities on campus.
The authors had observed that the original inventory is limited and, thus, developed and adapted the survey to add variables suggested by the American College and University President’s Climate Commitment. The American College and University President’s Climate Commitment (ACUPCC) website lists 682 schools that have signed the pledge, have completed over 2151 GHG inventories and 533 sustainability action plans completed [
24]. A GHG emissions inventory is a type of life cycle assessment that represents the environmental impact of GHG producing activities—from resource extraction to waste management—that are typically seen as targets for sustainability initiatives [
25]. An inventory is important for several reasons, but primarily, it is an essential reference point. If you think you need to lose some weight and you plan to take action to lose a few pounds, you start by weighing yourself. Conducting an inventory is like stepping on the scale and recording the result.
3.2. Objective Two
The second objective of our study was to compile and compare GHG emissions of various universities in Texas. After deciding to examine emissions from St. Edward’s University, the authors decided it would be beneficial to connect with other Texas universities to learn what they are doing in this field. However, because the literature on university comparative studies is limited (though reports produced by University of Illinois and the Oregon University System proved helpful), the authors are performing a type of benchmarking that seems underrepresented in the oeuvre of GHG inventories [
26]. Partnering with executives in sustainability offices and/or facilities management, we distributed a questionnaire (see
Appendix) to obtain qualitative and quantitative information from each university on basic institutional data and GHG emissions. To compare the GHG emissions of different universities, the authors began by entering the questionnaire data into the Clean Air Cool Planet Carbon Calculator (CA-CP) to compile and analyze the emissions data [
27]. The authors chose this tool because it is used by the ACUPCC. Questionnaires were sent out to 34 universities in Texas to compile emissions data for any university willing to participate.
The authors limited their study to exclude any university outside of Texas. Due to the similarity in climate and ecosystem, the authors argue that these data will suffer from less variation due to climate region differences than a comparative study done countrywide. Working on a state-wide scale allows one to collect data with the spatial and temporal components needed to derive comparable results. There are several qualifiers to the comparative study. For example, not all institutions are providing comparable services; some may provide student housing, and some may not; or some may be research-intensive, and some may not be; so, the authors took care to normalize the emissions per full-time equivalent (FTE) student and staff/faculty members and also normalized by building area. While normalized metrics can make comparing institutions easier, the absolute emissions still need to be reduced to impact climate change [
6].
4. Methods
4.1. School Profiles
The profiles of the participating universities below will mainly consist of the school administrators’ survey responses for that particular school. The authors will also show how these schools differ from St. Edward’s University in some cases. The below profiles summarize the sustainability initiatives on campus that stood out to the authors. When appropriate, it also incorporates statistics provided by the schools about their sustainability efforts. Quotes, when they appear, were derived directly from the school’s survey responses and/or from online information sources. The list of participating universities can be found in
Table 1.
Table 1.
Listof participating universities.
Table 1.
Listof participating universities.
| University/College | Population (Students) | Building Area (m2) |
|---|
| Austin College | 1346 | 74,645 |
| St. Edward’s University | 4308 | 125,710 |
| Rice University | 6224 | 550,964 |
| University of Texas Southwestern Medical Center | 4600 | 1,021,933 |
| University of North Texas | 28,280 | 638,244 |
| Texas Tech University | 31,500 | 780,385 |
| University of Houston | 41,000 | 1,059,094 |
| Texas A & M | 53,672 | 2,108,222 |
4.1.1. Austin College
Austin College is one of the two institutions participating in our study that serves primarily as a teaching institution; St. Edward’s is the other. Austin College is also similar to St. Edward’s because it is a private entity; however, St. Edward’s has almost four-times the student population size. The Office of Sustainability, or Center for Environmental Studies, as it is called, at Austin College has two employees, including a director and a coordinator. Austin College took advantage of the wind energy available in Texas and purchased 7058 Green-E certified wind Renewable Energy Certificates (RECs) for FY 2013. In addition, Austin College has a contractual agreement with its electricity provider that 15 percent of its annual electricity purchase is generated by renewable energy. Thus, this combination mitigated 66 percent of total electricity consumption. Notably, the fiscal year 2012 inventory was completed by a member of the class of 2011, who now serves as Coordinator of the College’s Center for Environmental Studies.
4.1.2. Rice University
The Office of Sustainability at Rice University at Rice is one of the oldest among the schools surveyed and is 8 years older than the Office of Sustainability at St. Edward’s. It was created in 2004 and is held by one person who serves sustainability academically, as well as administratively. He is the Director for the Administrative Center for Sustainability and Energy Management and Professor in the Practice of Environmental Studies in Sociology. Rice University also has the most student organizations devoted to environmental initiatives. Most notably, the Rice University Environmental Club has been in existence for 25 years. The Rice University Board of Trustees approved a sustainability policy in March 2004 stating that each new building to go up on campus with an anticipated design life of more than 30 years has to be LEED Silver certified at the minimum. Rice University also signed the ACUPCC. In our opinion, Rice University has one of the most committed and comprehensive administrations on sustainability of the schools surveyed.
4.1.3. Texas A & M
Considering that Texas A & M is one of the largest universities that we surveyed, we expected it to have one of the highest emissions of GHGs. Ironically, they are one of the lowest emitters, per capita of GHGs. Texas A & M has about 61,000 FTE students, which is just shy of the University of Texas FTE population, making it the second largest university that we surveyed. The authors believe the low level in GHG emissions is largely due to the new cogeneration system on campus, which began operating in 2011. This $10 million system was funded by the U.S. Department of Energy. The combined heat and power (CHP) system exceeds 75 percent efficiency, saves close to 1 trillion British thermal units (Btu) annually and reduces carbon dioxide emissions by 143,400 tons per year.
4.1.4. Texas Tech
The office of sustainability at Texas Tech was created in 2009 in response to the failing Sierra Magazine “Cool School” rating it received earlier that year. Four years later, in 2012, Texas Tech was named a “Cool School” with a score of 171. On 14 August 2013, Sierra Magazine announced the 2013 “Cools Schools”, and Texas Tech made the list for a second year. In addition, Tech posted an impressive 153 percent score improvement over the 2012 rating. The Sustainability Coordinator is the sole full-time staff member dedicated to sustainability initiatives for almost 35,000 students on campus. Texas Tech also has four active student groups focused on sustainability.
4.1.5. University of Houston
University of Houston, another large research institution surveyed, created a full-time staff position related to sustainability in 2012. The Assistant Director of Central Operations and Sustainability Lead at the University of Houston provided the data. University of Houston is one of the top engineering schools in the state and, thus, has the most degree programs/majors associated with the environment (mainly environmental engineering). At the time of this inventory, University of Houston had 80 Big Belly Solar dual recycling receptacles and solar-powered trash compactors. “These new units will reduce University of Houston’s carbon footprint”, the Sustainability Lead said. “By not sending our trucks to collect trash from each unit every day, we save on gas and create fewer emissions. And by having more recycling receptacles, the campus community can do its part in helping the environment”. At the time of reporting, the university had 37 water bottle filling stations in classroom buildings.
4.1.6. University of North Texas
The office of sustainability of University of North Texas, or UNT, has a rather pervasive presence on campus. With its well-marketed “We Mean GREEN” slogan, the sustainability office appropriated the motto of the North Texas Mean Green football team to establish a place for sustainability within all aspects of college life. In fact, Apogee Stadium at UNT is now powered in part by wind turbines, which stand adjacent to the stadium. Funded by a grant from the State Energy Conservation Office, the three wind turbines are projected to produce 450,000 kWh of clean, renewable energy annually and to offset an estimated 323 metric tons of carbon dioxide. The sustainability office employs 9 people full time, including several students. The director is also a professor on campus and teaches courses related to sustainable development.
4.1.7. UT Southwestern Medical Center
At University of Texas Southwestern, the sustainability initiatives are somewhat different, because their greatest source of emissions comes from refrigerant use because of the need to store medicine and other hospital equipment at cooler temperatures. In the last 10 years, though, the Medical Center has reduced its energy usage per ft2 by nearly 38 percent. One of the ways they did this was by creating a solar panel parking lot. A $2 million federal grant to install this saved an estimated 406,281 kWh, the equivalent of the carbon output of 56 vehicles. The sustainability office is comprised of two full-time employees.
4.1.8. University of Texas in Austin
University of Texas is the largest school that we surveyed; it is also the largest in terms of student size. In 2005, the university joined as a charter member institution of AASHE, the Association for the Advancement of Sustainability in Higher Education. Most notably, the university produces all of its own electrical power at the Hal C. Weaver power plant using natural gas. In 2009, the first comprehensive GHG inventory was created by the Director of Sustainability. This position was added in the Campus Planning and Facilities Management division within University Operations in 2009. A large part of the director’s time is dedicated to facilitating communication between the many decentralized sustainability activities at UT Austin. The University also has a President’s Sustainability Steering Committee, which creates recommendations for the university based on research and discussion.
4.2. Carbon Calculator
The CA-CP calculator is a tool developed to aggregate all emission sources and to convert them into comparable units. It is the most common tool used by ACUPCC members to complete GHG emission inventories in higher education. It is found in the form of a Microsoft Excel spreadsheet with many input, conversion and emission factor tabs. The spreadsheet can be downloaded online from the University of New Hampshire Sustainabilty Institute website [
28]. After collecting the data from various campus stakeholders, the user must convert the data points into the correct units used by the calculator and enter them into the inputs section. The calculator uses emissions factors garnered from the Environmental Protection Agencyto convert all data into MTCO
2e [
29]. The calculator will then return aggregate emissions based on geographic location, as well as distinguishable by the different scopes within the calculator. The calculator can also be used to make projections on future emissions using historical data and trends.
Throughout the project, the authors extrapolated schools direct (Scope 1) emissions resulting from fuels burned for heating and cooling and for gasoline or fuel purchased. Indirect emissions (Scope 2) are releases from sources not owned by the university; these emissions result from the combustion of fuels by the third party (steam and electricity generated off site). Scope 3 sectors are other major indirect emissions resulting from university activities that occur from sources controlled by another company or entity and are optional for reporting. Because they are very site specific, obtaining such data would prove extremely difficult. In our comparative study, we opted to leave out Scope 3, because these Scope 3 emissions sources have a high degree of inaccessible data and methodological uncertainty.
Scope 1, 2 and 3 sources all emit the various gases, such as carbon dioxide, methane and nitrous oxide, that contribute to climate change. The carbon calculator is a way of converting the global warming potential of these various gases into CO
2 units, which allow them to be compared effectively. The carbon calculator, as well as the concept of scopes, is based on the GHG Protocol, which, according to their website, is the “foundation of nearly every GHG standard or program in the world” [
30]. Historically, the GHG Protocol categorizes GHG emissions into two types: direct and indirect [
30]. Simply put, those emissions associated with activities on site and those that are off site. The GHG Protocol further defines these direct and indirect emissions in three broad scopes.
To make our data comparable, the authors chose to limit the inter-university comparison of emission sources to Scopes 1 and 2 of the carbon calculator. The calculator has algorithms that convert the different sources of emissions from their initial measurements into CO
2 emitted. For example, electricity is typically measured in kilowatt hours (kWh) used and would be converted to metric tons equivalent of CO
2 emitted. According to the EPA, 7.0555 × 10
−4 metric tons CO
2 are emitted per kWh of electricity used [
31]. This number is a general conversion factor for the entire U.S. However, this factor will vary from state to state depending on which electrical grid services the area. Texas is serviced by the Electric Reliabilty Council (ERCOT) grid, which, at the time of the study, had an energy source composition of approximately thirty-seven percent coal, forty-one percent natural gas, twelve percent nuclear and ten percent renewable energy. This gives the ERCOT service area a 5.4 × 10
−4 MTCO
2e per kWH conversion factor. The CA-CP calculator uses these standards for all energy types to evaluate data inventory into comparable carbon emissions. We will be taking emissions data for the time span of 1 July 2012 to 30 June 2013. It is important to set a standard timeline so that all comparisons follow the same seasonal time line [
32]. This is especially important in educational settings, because they share common periods where the facilities are, for the most part, not used (summer months, winter break,
etc.).
5. Experimental Section: Calculations, Survey Design and Administration
5.1. Calculations and Conversions
5.1.1. Institutional Data
Operating/Energy Budget
This data point was reported by the Vice President of Financial Affairs and the Associate Vice President (AVP) of Facilities, respectively. The carbon calculator converts this dataset into equivalent dollars in 2005, so they can be compared equally, accounting for inflation.
Total Building Space
This data point is in square feet and was reported by the AVP, Facilities.
Population
This dataset was reported by the Institutional Research Department. Any part time student or faculty member is counted as one half of a FTE student or faculty member.
5.1.2. Scope 1
Heating
Central facilities or physical plants on college campuses are essential to providing on-campus heating. The systems of distributing heat, steam, hot or chilled water throughout a campus are highly variable and require extensive maintenance on the part of the staff of the university. Combined heat and power (CHP), also known as cogeneration, combines electrical and mechanical equipment into an operating system designed to convert fuel energy into both electric power and useful thermal energy [
33]. Several universities throughout the country use CHP systems, which range in size from 150 kilowatt to 500 megawatt [
34]. Carbon emissions are typically reduced by 30 percent when CHP replaces central-station electricity generation [
35].
This data point was reported by the AVP, Facilities. It was reported in CCF (centum cubic feet or 100 cubic feet). The calculator requires the data to be in MBtu (million British thermal units). To convert from CCF to MMBTu, we used the conversion factors of [
36]:
Direct Transportation Sources/University Fleet of Vehicles
The opportunity for universities to utilize alternative energy is well suited for campus fleet vehicles. Colleges and universities offer a niche market for alternative fuel vehicles (AFVs) because campus fleets are often centrally fueled, and their travel range is mainly limited to campus grounds. Several schools, such as UT Austin, purchase vehicles through a state contract. This policy does not eliminate AFV options, but may be a limiting factor. Improving fuel efficiency can help reduce campus emissions, but the reductions will not be dramatic.
This data point was reported by the AVP, Facilities. The number was reported in gallons of gasoline, diesel, kerosene and propane used. Some of the diesel and propane use reported was used for heating or generators, but this amount is minimal and grouped with vehicle consumption. These assorted fuels were reported in gallons. To convert from gallons to MTCO2e, we used the conversion factors found on the EPA website (Emissions).
Refrigerants
There are many types of refrigerants that serve as major GHGs and can be ozone-depleting. The Clean Air Act regulates some university systems refrigerant use because of the chlorofluorocarbons (CFCs) and hydrofluorocarbons (HFCs) often found in chemical refrigerants [
6]. Many of these harmful chemicals are being phased out with the institution of the Montreal Protocol [
37]. The degree to which these substances deplete the ozone layer and contribute to global warming is variable and site specific. However, no matter if an institution chooses to use HFCs instead of CFCs to cool its structure, the real environmental impact is in the quantity of those refrigerants and not necessarily in the quality. The more refrigerants one is using, the more climate pollutants one is emitting. Although HFCs might be slightly better for the environment, their benefits are not influential if one is seeking to increase refrigerant use.
The amount of refrigerants used at Texas Tech last year was higher than many of the other schools. One could speculate that this might have to do with the desert-like climate in which Texas Tech is situated, but one cannot be certain. More complete data and further studies are necessary to distinguish the role of climate and summer and winter temperatures on GHG emissions. This data point was reported by the AVP, Facilities. The number was reported in gallons added and gallons recycled over the fiscal year. St. Edward’s uses difluromonochloromethane, or what is more commonmy known as R-22. They also use R-410a, another refrigerant made with a mixture of difluoromethaneand finally, ISCEON MO99 as its refrigerant mediums. R-22 is commonly known as HCFC-22, as found in the CA-CP calculator. The factors for converting each refrigerant into MTCO
2e are found in sources for the IPCC reports and on manufacturer websites [
38].
Fertilizers
Managing large-scale fertilization for lawns, athletic and agrarian fields may be able to reduce the amount of nitrous oxide, a powerful GHG, submerged under the ground. Documenting the impacts of fertilizers on emissions is problematic because seasonality and fertilizer types are factors in the amount of nitrogen oxide produced.
This data point was reported by the AVP, Facilities. The number was reported in pounds of fertilizer by percentage of nitrogen content for St. Edward’s synthetic fertilizer. Synthetic fertilizers are typically reported with nutrient content in a 3 number series, with the first number being the percent content of nitrogen (
i.e., 16-2-3). The organic fertilizer was reported in cubic yards. The calculator requires fertilizer in weight units, so we used conversion factors of:
We received these data from communication with subject matter experts in the Austin area. We also understand that this number is somewhat arbitrary given that fertilizer will weigh different amounts depending on its density or water content. This is the assumption the authors will use regarding reported fertilizer data for the remainder of this report.
5.1.3. Scope 2
Purchased Electricity
Although colleges and universities are not directly responsible for purchased electricity emissions, it is strongly implied that it is a consumptive emission of the university. In fact, a factor that can significantly influence GHG emissions is the source of energy used to generate electricity [
25]. The Carbon Calculator User’s Guide stipulates that “these emissions come from converting energy sources that release GHG emissions when used (fossil fuels) to energy sources that do not (electricity, steam, or chilled water)“ [
29,
39]. Thus, it is not the university or college itself that burns coal to make electricity, but it is a third party, and though the third party emits the gases, they do not use any of the energy produced (2006). This is one area where universities can perhaps choose a better source of fuel, because as research shows, coal generation produces higher emissions per kWh than other energy sources [
40].
The two main components of electricity at a university are how it is created and how it is transmitted. As with many higher education institutions, St. Edward’s electricity is produced off site. St. Edward’s purchases the generation of electricity from Austin Energy, but bringing this electricity to the university is the responsibility of a local utility company. The cost of purchased electricity fluctuates and is based on the current market value. This data point was reported by the AVP, Facilities. The number was reported in kilowatt hours.
5.1.4. Scope 3
Transportation
Defined by the National Clearinghouse for Commuter Programs as students who do not live in institution-owned housing on campus [
41], commuter students are a considerable majority of today’s college student population. In fact, 84 percent of college students today commute to campus [
41]. Transportation accounts for 32 percent of U.S. carbon dioxide emissions, with motor vehicles accounting for the bulk of this, about 25 percent [
42,
43]. As a result, pollutants from cars and trucks, such as carbon dioxide, nitrogen dioxide and sulfur dioxide, fill the atmosphere, contributing further to the climate change problem.
At the same time that the car and truck have had a major impact on the local and global environment, they also have had a major negative impact on the environment and the surroundings of a college campus [
44]. The implementation of alternative transportation in many universities has been due more to cost factors than environmental concerns: “it’s cheaper for them to invest in transportation alternatives than it is to build more parking” [
40,
43,
45]. To calculate commuting-related emissions, the authors employed ArcGIS spatial software, commuter vehicle distributions and commuter population and travel data to simulate commuter vehicle miles travelled and resulting GHG emissions.
This dataset reflects the day-to-day emissions produced by university users (students, faculty and staff) driving to and from campus. To estimate our commuting emissions as a university, we needed to collect data in terms of the number of FTE users, the number of one-way trips taken per week, the number of applicable weeks per year, the percentage of users that drive, walk, bike, bus and carpool to campus individually and the average distance travelled for each transportation method.
The number of FTE users was reported by the Institutional Research Department. The number of one-way trips taken per week was estimated at 10, given five days of class per week and one trip to and from campus. The number of applicable weeks was estimated at 32 given two semesters with an average of 16 weeks per semester for students and faculty. This number differs for staff. Staff typically work 50 weeks per year, while faculty work 32 weeks per year.
The percent of trip distribution was determined by collecting data on the number of parking permits purchased for university users. These data were reported by the Auxiliary Services department. We also needed the number of students who live on campus, which was reported by Residence Life. The percent of drivers was calculated by dividing the amount of parking permits purchased by the amount of FTE users. The number of walking users was determined by dividing the amount of on-campus residents by the number of FTE users. The remaining transportation methods’ proportion was estimated by dividing the remaining percentage equally between biking, busing and carpooling.
The average distance commuted was estimated at 0.8 km for walking users, 3.2 km for biking users and 8 km for bus users. These numbers are approximations taken from personal commentaries. The average distance commuted was estimated by collecting data on all university users living within 64 km of campus and averaging the distances they live from the center of their respective zip codes to St. Edward’s University. The zip code data were reported by the Institutional Research Department. The distances were calculated using Google maps. The 64-km radius is an arbitrary number; we assumed that anyone reporting an address outside this radius most likely does not make this commute every day or lives somewhere closer than their given permanent address.
Given the number of generalizations and arbitrary data we are using to calculate our commuter study, we are making the assumption that this emissions data point is not as accurate as we would like. It is a best estimate, given our available resources.
Study Abroad/Air Travel
Faculty, staff and students frequently travel for university business and studying abroad, which indirectly contributes to the concentration of GHGs emitted by a university. However, there are many challenges with gathering this type of information, which again is a central challenge of conducting an inventory; many universities have not centralized their travel-purchasing systems, so in-flight mile records are sparse (most data are kept for billing purposes and may include only dollars and not quantities). Air travel emissions form a substantial portion of UT Austin’s transportation-related emissions, because planes and jets burn a significant amount of fuel. For example, according to the
New York Times, a round trip from New York City to London in a Boeing 747 at 78 percent occupancy results in 2776 pounds (or 440 tons) of CO
2 per person [
46].
Study abroad emissions were calculated by summing the number of miles travelled by each student from St. Edward’s to their destination. The destination data were reported by the Office of International Education. The distance travelled was estimated using Google maps.
Solid Waste
Solid waste prevention and recycling can help moderate emissions, by decreasing the amount of methane in landfills, and help abate emissions from incinerators. If a product is not recycled, it goes to one of three places: landfill, compost pile or it is burned in combustion. These data were reported by the AVP, Facilities. The data were reported in cubic yards. The calculator requires the data to be input in terms of short tons. The conversion factor we used is:
This number was given to us through communications with a subject matter expert, who is a Director of Special Projects at Texas Disposal Systems (TDS). TDS is the organization that collects our solid waste. To determine if our solid waste collection uses any sort of methane emissions recovery, we asked our subject matter expert. He informed us that methane flaring was used to reduce emissions. The volume of solid waste reported is most likely an overestimation of our actual emissions. The data we use are based on the volume of full dumpsters collected. We are making the assumption that every dumpster collected is equally full given that this is not always the case. We must make this assumption due to lack of data on a precise ratio of waste and empty space in the dumpster.
Waste Water
Water tends to be a hotly contested issue in the state of Texas, mostly because Texas is in the midst of a serious drought. Waste water treatment is also resource intensive and expensive, requiring large treatment plants and complex technology. For example, Texas A & M uses water catchment systems to capture rainwater to be used for irrigation, rather than purchasing water from the city and producing additional wastewater and runoff. The waste water at St. Edward’s is funneled through a city central treatment plant and then deposited into Hornsby Bend, where the wastewater solids go through an anaerobic digestion process, which is used to capture methane as a fuel source and create a fertilizer called Dillo Dirt. St. Edward’s has put forth an effort to conserve water by replacing a number of conventional toilets with low flow models and implementing sink aerators on faucets, which reduce water use. These data were reported by the AVP, Facilities. The data are reported in gallons as required by the calculator. St. Edward’s sends its wastewater through a central treatment plant through the City of Austin into Hornsby Bend, where the wastewater solids undergo anaerobic digestion.
Paper Purchased
A university is in its very essence a business, and like all businesses, their purchasing decisions can call attention to their priorities. St. Edward’s, like most universities, consumes a great amount of paper, and it may be possible to quantify the impacts in this part of the supply chain. For example, if the university made it a point to purchase paper and supplies from a local vendor, then the amount of miles that the paper would have to travel to get to St. Edward’s would decrease and, in turn, diminish its contribution to global warming. Purchasing paper has many environmental consequences that result from their actual use to the packaging, to the shipment, to the disposal. In terms of whole life cycle emissions, it may be worth running more detailed calculations for the university’s paper consumption, perhaps accounting for how far paper and other supplies may have travelled from vendor to final destination.
These data were reported by the purchasing department and the St. Edward’s copy center. St. Edward’s does not have a centralized paper purchasing operation, so the data must be collected from several sources. The majority of paper is purchased through the purchasing department. We were able to collect data on how much paper is purchased by the School of Behavioral and Social Sciences through the St. Edward’s Copy Center. We used these data and multiplied them by five to estimate paper purchases for the four other schools within St. Edward’s. We realize this does not account for a completely accurate view of paper purchased by the University, and we are making an educated estimate; but, it should be improved on in future studies. These data were reported to us in cases. The calculator requires the data to be input in pounds. We used the conversion factor of 20 pounds per case when a weight was not specifically given.
Scope 2 Transportation & Distribution (T&D) Losses
These data are automatically calculated based on the amount of reported purchased electricity. This number is roughly 9 percent of the purchased electricity emissions that result from inefficiencies in transporting electricity through power lines, transformers and other elements of the electrical grid. The T&D data which was provided by the universities are listed in
Table 2.
Table 2.
Data collection. HFC, hydrofluorocarbon; CCF, centum cubic feet; FTE, full-time equivalent; AVP, Associate Vice President.
Table 2.
Data collection. HFC, hydrofluorocarbon; CCF, centum cubic feet; FTE, full-time equivalent; AVP, Associate Vice President.
| Data Point | Units Collected | Units Needed | Responsible Party |
|---|
| Operating Budget | U.S. Dollars | U.S. Dollars | AVP Facilities |
| Energy Budget | U.S. Dollars | U.S. Dollars | AVP Facilities |
| Full Time Students | Full- and Part-Time Students | FTE Students | Institutional Research Department |
| Faculty | Full- and Part-Time Faculty | FTE Faculty | Institutional Research Department |
| Staff | Full- and Part-Time Staff | FTE Staff | Institutional Research Department |
| Total Building Space | Square Feet | Square Feet | AVP Facilities |
| Natural Gas | CCF | MMBtu | AVP Facilities |
| Gasoline Fleet | Gallons | Gallons | AVP Facilities |
| Diesel Fleet | Gallons | Gallons | AVP Facilities |
| Other Fleet Fuel | Gallons | MMBtu | AVP Facilities |
| Refrigerant, R-11 | Gallons | Pounds | AVP Facilities |
| Refrigerant, HFC-134a | Gallons | Pounds | AVP Facilities |
| Refrigerant, HCFC-22 | Gallons | Pounds | AVP Facilities |
| Refrigerant, R410a | Gallons | Pounds | AVP Facilities |
| Refrigerant, Isceon MO99 | Gallons | Pounds | AVP Facilities |
| Fertilizer, Synthetic | Pounds | Pounds | AVP Facilities |
| Fertilizer, Organic | Cubic Yards | Pounds | AVP Facilities |
| Purchased Electricity | Kilowatt Hours | Kilowatt Hours | AVP Facilities |
| Abroad Air Travel | Passenger Miles | Passenger Miles | Office of International Education |
| Solid Waste | Cubic Yards | Short Tons | AVP Facilities |
| Wastewater | Gallons | Gallons | AVP Facilities |
| Purchased Paper | Cases | Pounds | Purchasing Department |
| Forest Preservation Offset | MTCO2e | MTCO2e | School of Behavioral and Social Sciences |
| Retail Offsets | Kilowatt Hours | MTCO2e | AVP Facilities |
| Student Commuters | FTE Students | FTE Students | Institutional Research Department |
| Trip Distance, Student | Zip Codes | Vehicle Miles | Institutional Research Department |
| Staff/Faculty Commuters | FTE Staff/Faculty | FTE Staff/Faculty | Institutional Research Department |
| Trip Distance, Staff/Faculty | Zip Codes | Vehicle Miles | Institutional Research Department |
Offsets
Tools of the trade for encouraging climate change action through financial transactions are emerging; one example is carbon offsets. The voluntary “carbon offset” markets in the United States provide a metric to estimate the eventual cost of future regulations. Because climate change affects us globally, not just nationwide, offsets can be important investments in the world’s future. Carbon offsets can take many forms, including on-campus composting efforts, purchasing renewable energy from third-party vendors or carbon sequestration by keeping natural habitats undeveloped. It is also important to note that the offsets may be supplemental; for example, Lady Bird Johnson Wildflower Center was purchased by The University of Texas as an offset. Rice University claims offsets by sequestration and carbon storage, which is calculated by the amount of forest land owned by Rice University’s endowment. To date, Rice has always been able to use the carbon offset value of the forest to mitigate its carbon footprint. Another way to represent offsets is electricity purchased through renewable energy certificates (RECs). RECs are tradable renewable energy certificates that represent the technology and environmental attributes of 1 megawatt-hour of electricity generated from renewable sources.
These data were extrapolated from the 2009 GHG inventory conducted at St. Edward’s. The University purchases 480,000 kWh per year.
The University also protects 23 acres of forested land in the Blunn Creek Nature Preserve. The amount of carbon sequestered is given using the conversion factor of:
This was calculated by a subject matter expert at St. Edward’s, botanist Dr. Bill Quinn.
5.2. Assumptions Made with Participating Universities
5.2.1. Missing Data
We attempted to aggregate a similar profile between our participating universities; however, some data points were left out. Fleet data were absent from UT Southwestern and the University of Houston. Refrigerant data were absent from Rice University and Texas Tech University. Animal Husbandry data were absent from Texas Tech.
5.2.2. Differences in Calculator Data
On-Campus Heat Source
Three of our participating universities use cogeneration or CHP facilities to create electricity while producing heat to condition their buildings. The calculator requires electrical output and steam output data. These were collected at a basic level. Texas A & M University uses a CHP facility with a natural gas turbine and steam turbine to collect electricity. The heat they produce is distributed to different sectors, and calculating the proportion of this distribution is beyond the scope of our research. Having precise efficiency data gives an accurate representation of the specific source of emissions from steam or electricity; however, our study is concerned with the overall emissions released. The overall emissions released do not reflect the steam or electrical output of their facilities, only the amount of fuel initially used to operate the CHP plant. These assumptions carry on for the other universities using cogeneration or CHP facilities.
Refrigerants
Each university uses a different set of refrigerants to condition their buildings. These refrigerants include HCFC-22, R410a, HFC 134a, HFC 404a, and others. These emissions account for less than 1 percent in every reporting school besides UT Southwestern Medical School. UT Southwestern includes hospital facilities where refrigerants are used more often. This implies that universities with hospitals or laboratories face a greater challenge in reducing their GHG emissions [
25]. Three of our universities either do not track these data or use broad assumptions on the amount they use. Due to the minimal effect refrigerants have on emissions in other schools, we do not believe this will affect our study in a substantial way. This is an area that should be improved in the future.
Scope 3 was not included in our university comparison study with one exception. Scope 2 (purchased electricity) transmission and distribution losses are for Scope 3 that are readily calculated given Scope 2 data. This was included due to its ease of inclusion.
5.2.3. Survey Approach and Administration
The questionnaire was administered through email as an attached document to be returned. There are several advantages to a questionnaire approach to collect emissions activity information. First, an online exchange of information is inexpensive to the surveyors and the participants, may be easier for respondents to answer in word document format and is environmentally friendly. Second, it has a quick turnaround time (in terms of receiving responses) and also saves considerable effort in processing, since the data are obtained directly in electronic form (in most cases). In the next few sections, the authors discuss the survey content, the survey administration procedures and some sample details.
5.2.4. Survey Content
The survey comprised several sections. The first section corresponded to general questions about the sustainability office, students and environmental initiatives on campus, which were easily answered by a staff member of a sustainability office. The second section obtained information on energy-related characteristics, which were derived to populate the CA-CP carbon calculator. We asked respondents to answer questions for the fiscal year of 1 July 2012 to 30 June 2013.
5.2.5. Data Preparation
The data from the completed inventories were entered into the CA-CP calculator in spreadsheet form, where the variables are color coded. We chose the CA-CP calculator because it is the common inventory vehicle used by the ACUPCC. In compiling these data, we used survey and inventory information provided by each institution; some was conveniently posted on the university or ACUPCC website. However, in most cases, we supplemented with a telephone call or email to a knowledgeable person on campus. In cases where there were missing data, such as type and amount of refrigerants, our inquiry of this information served as a catalyst to initiate other inventories in universities that did not have the opportunity or the means to conduct one.
6. Results and Discussion
6.1. St. Edward’s University Temporal Study
In terms of institutional data, St. Edward’s has increased in operating budget and total building space, while decreasing its FTE of students, faculty and staff and energy budget (
Table 3). The decrease in energy budget is largely due to efficiency upgrades in purchased electricity.
Table 3.
St. Edward’s University institutional data FY 2008 and 2013.
Table 3.
St. Edward’s University institutional data FY 2008 and 2013.
| Fiscal Year (FY) | Operating Budget ($USD) | Energy Budget ($USD) | Students (FTE) | Faculty (FTE) | Staff (FTE) | Total Building Space (m2) |
|---|
| 2008 | $ 77,147,041.30 | $ 2,857,603.26 | 4482 | 469 | 495 | 106,681.68 |
| 2013 | $ 126,054,536.09 | $ 2,082,471.27 | 4308 | 201 | 482 | 125,710.08 |
6.1.1. Scope 1
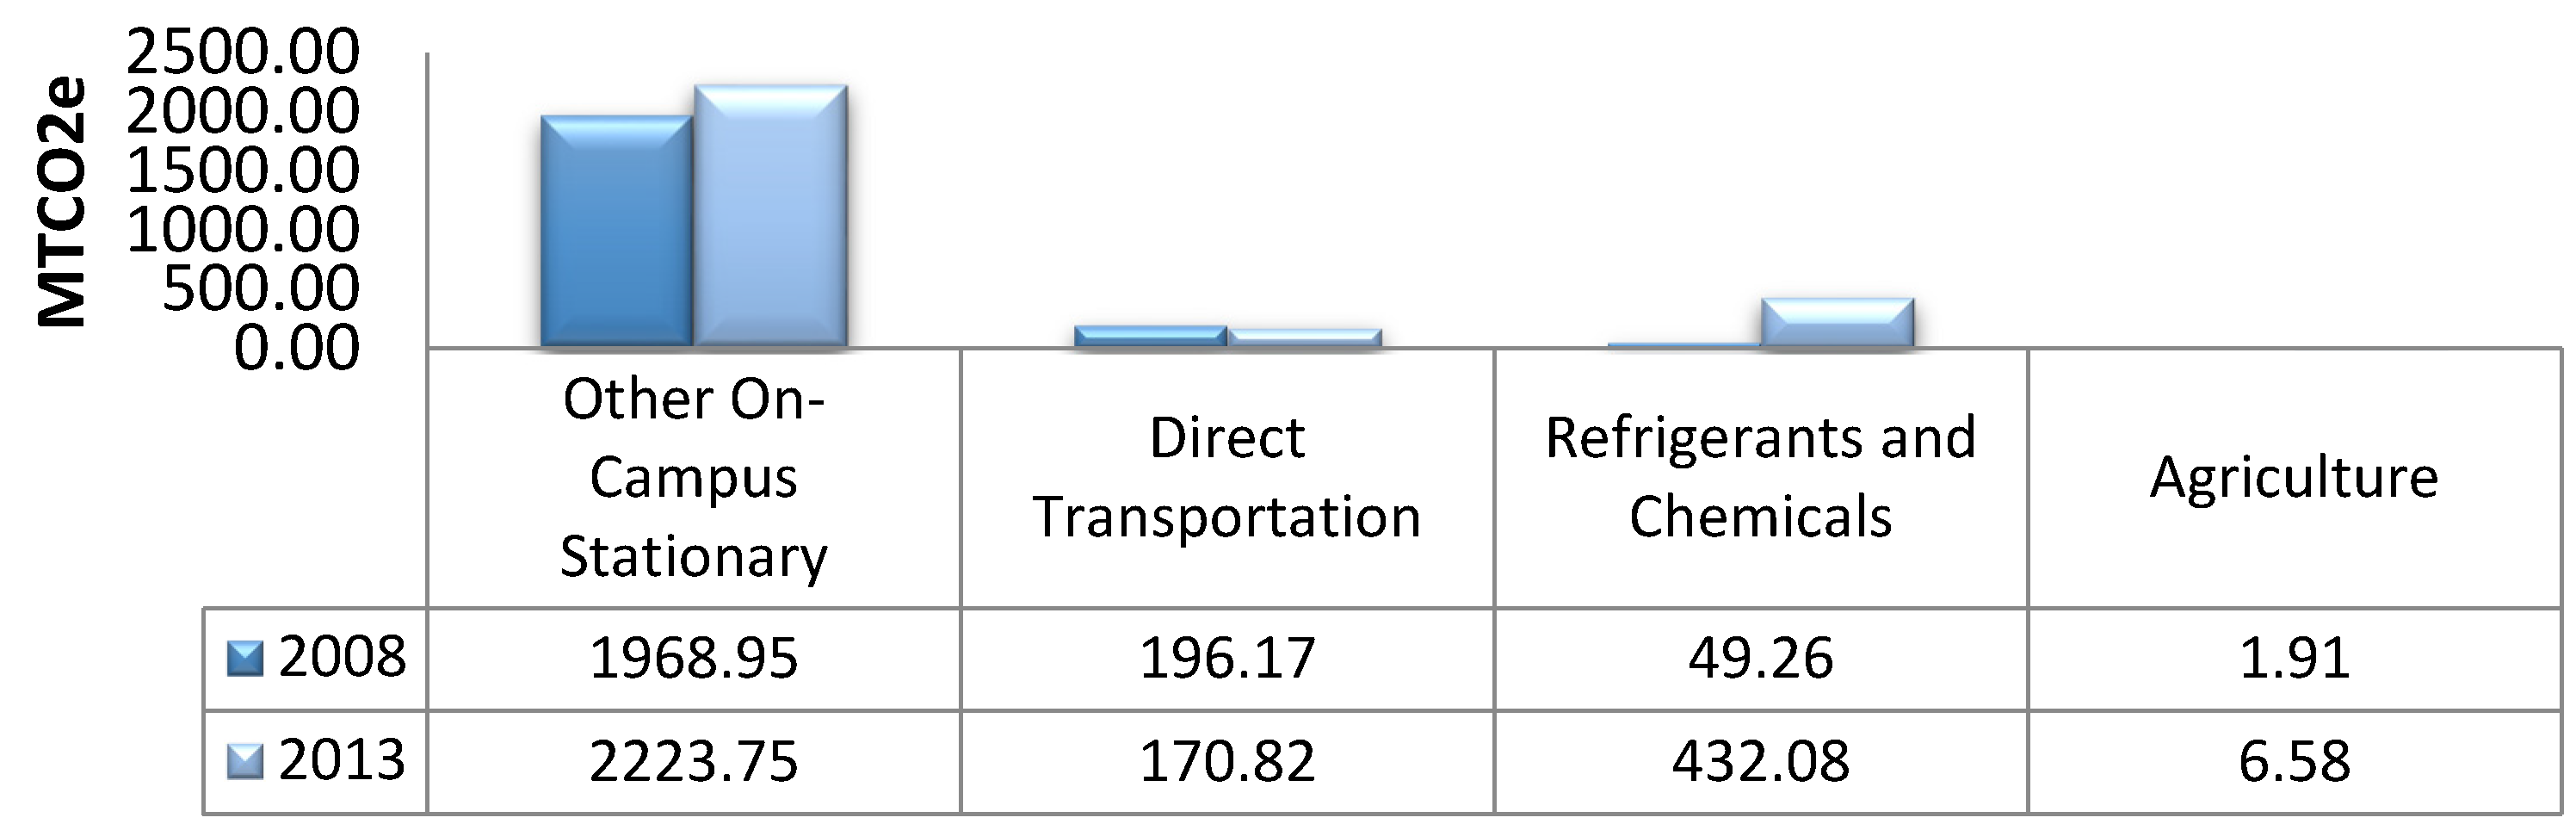
On-Campus Stationary
The on-campus stationary emissions are a result of burning natural gas largely to heat the buildings on campus. St. Edward’s reported 41,813 MMBtu in the FY 2013 compared to 37,022 in the FY 2008. This results in the emission of 2223.8 MTCO
2e (
Figure 1).
Figure 1.
Summary of Scope 1 emissions.
Figure 1.
Summary of Scope 1 emissions.
University Fleet
The emissions profile resulting from the St. Edward’s fleet of vehicles altered substantially from 2008. This is due to a large increase in diesel purchased in FY 2013, while much less propane was purchased in the recent study.
Refrigerants
In 2008, St. Edward’s only replaced a small amount of HCFC-22 refrigerant. St. Edward’s had purchased large amounts of R-11 during 2007 and 2009, resulting in small emissions reported for FY 2008. St. Edward’s purchased HCFC-22, R410a and ISCEON MO99 during FY 2013. This resulted in a larger amount of emissions from the refrigerants sector since 2008.
Fertilizer
The 2013 study reported a much larger amount of fertilizer used since 2008. We believe this is a result of better data collection in the recent study. One-thousand seven-hundred twenty-three-point-six-five kilograms of 16 percent nitrogen-content synthetic fertilizer were used compared to 1587.57 kg of 13 percent nitrogen-content synthetic fertilizer. Eleven-thousand twenty-two-point-three kilograms of four percent nitrogen-content organic fertilizer were also reported in 2013.
6.1.2. Scope 2
St. Edward’s only has Scope 2 emissions from purchased electricity. However, this is also the single largest contributor to GHG emissions in the inventory. Since 2008, St. Edward’s has undertaken great strides in improving efficiency, resulting in a substantial decrease in Scope 2 emissions (
Figure 2).
Figure 2.
Summary of Scope 2 emissions.
Figure 2.
Summary of Scope 2 emissions.
6.1.3. Scope 3
The temporal study revealed some large differences in Scope 3 emissions. The data collected were often incomplete in the past study. This was particularly evident in commuting, study abroad and paper. Directly-financed air travel was not included in either study.
Commuting
As mentioned before, the GHG inventory from 2008 at St. Edward’s had an incomplete dataset for commuting emissions. However, we were able to calculate approximate values for commuting in FY 2013. At St. Edward’s, the average distance commuted is 11.7 miles for students (
Table 4). St. Edward’s University estimates that the average FTE student travels to and from campus five times a week (10 total trips) (
Table 5), and we found that 60 percent drive alone in personal vehicles (
Table 6).
Table 4.
Average distance travelled by transportation method in kilometers.
Table 4.
Average distance travelled by transportation method in kilometers.
| User | Bike | Walk | Drive Alone | Carpool | Bus |
|---|
| Students | 3.2 | 0.8 | 18.83 | 18.83 | 8.05 |
| Faculty/Staff | 3.2 | 1.6 | 16.98 | 16.98 | 8.05 |
Table 5.
Institutional commuting data.
Table 5.
Institutional commuting data.
| User | Commuters | One-Way Trips/Week | Total Trips/Week | Weeks/Year |
|---|
| Students | 2703 | 10 | 27030 | 32 |
| Faculty | 436 | 10 | 4360 | 45 |
Table 6.
Proportion of transportation methods.
Table 6.
Proportion of transportation methods.
| User | Bike | Walk | Drive Alone | Carpool | Bus |
|---|
| Students | 2.5% | 32.5% | 60.0% | 2.5% | 2.5% |
| Faculty/Staff | 3% | 28% | 64% | 2% | 3% |
The main differences we found in collecting these data were that students drive proportionately less than faculty/staff to campus, which is explained by a large number of students living on campus. We also found that faculty/staff are driving a shorter distance on average than students. These two groups combined result in 2887.9 MTCO2e of GHG emissions.
Study Abroad Travel
Two-hundred sixty-four (264) students studied abroad during the FY 2013, resulting in approximately 4,751,246 kilometers travelled to reach their destinations. Study abroad students represented St. Edward’s on six continents in 28 different countries. This resulted in 1555 MTCO2e of GHG emissions.
Solid Waste
St. Edward’s is producing a larger amount of solid waste in 2013 than in 2008, though it is unclear if this could be due to different data collection methods. We would expect our emissions in this sector to increase; however, the third-party organization that collected St. Edward’s waste in 2008 did not use any sort of methane capturing, while this practice was in place for the FY 2013, which mitigates a large amount of GHG emissions. St. Edward’s solid waste production results in 995.5 MTCO2e compared to 3313.9 MTCO2e in 2008 of GHG emissions.
Wastewater
St. Edward’s sends their wastewater through the City of Austin wastewater treatment facilities into Hornsby Bend, where the wastewater solids are used in an anaerobic digestion process, which creates by-products of captured methane as a fuel source and fertilizers. Slightly less wastewater was produced, resulting in 14.5 emissions for FY 2013 compared to 15.7 in FY 2008.
Paper Purchased
The data regarding purchased paper in 2008 were incomplete, so these were omitted from our comparison. We collected data from several departments on campus and found that the university purchased approximately 9808 kg of paper in FY 2013. This resulted in 29.5 MTCO
2e in GHG emissions (
Figure 3).
Figure 3.
Summary of Scope 3 emissions. 2008 data for commuting, study abroad and paper were unavailable or incomplete.
Figure 3.
Summary of Scope 3 emissions. 2008 data for commuting, study abroad and paper were unavailable or incomplete.
Offsets
St. Edward’s purchases/maintains offsets in the forms of Austin Energy Green Choice wind power and maintaining the Blunn Creek Preserve on St. Edward’s campus. St. Edward’s purchases 480,000 kWh of wind energy credits, which offset 344.64 MTCO2e of GHG emissions. Maintaining the Blunn Creek Preserve keeps 93,077 m2 of riparian habitat undeveloped, offsetting 3358 MTCO2e in GHG emissions.
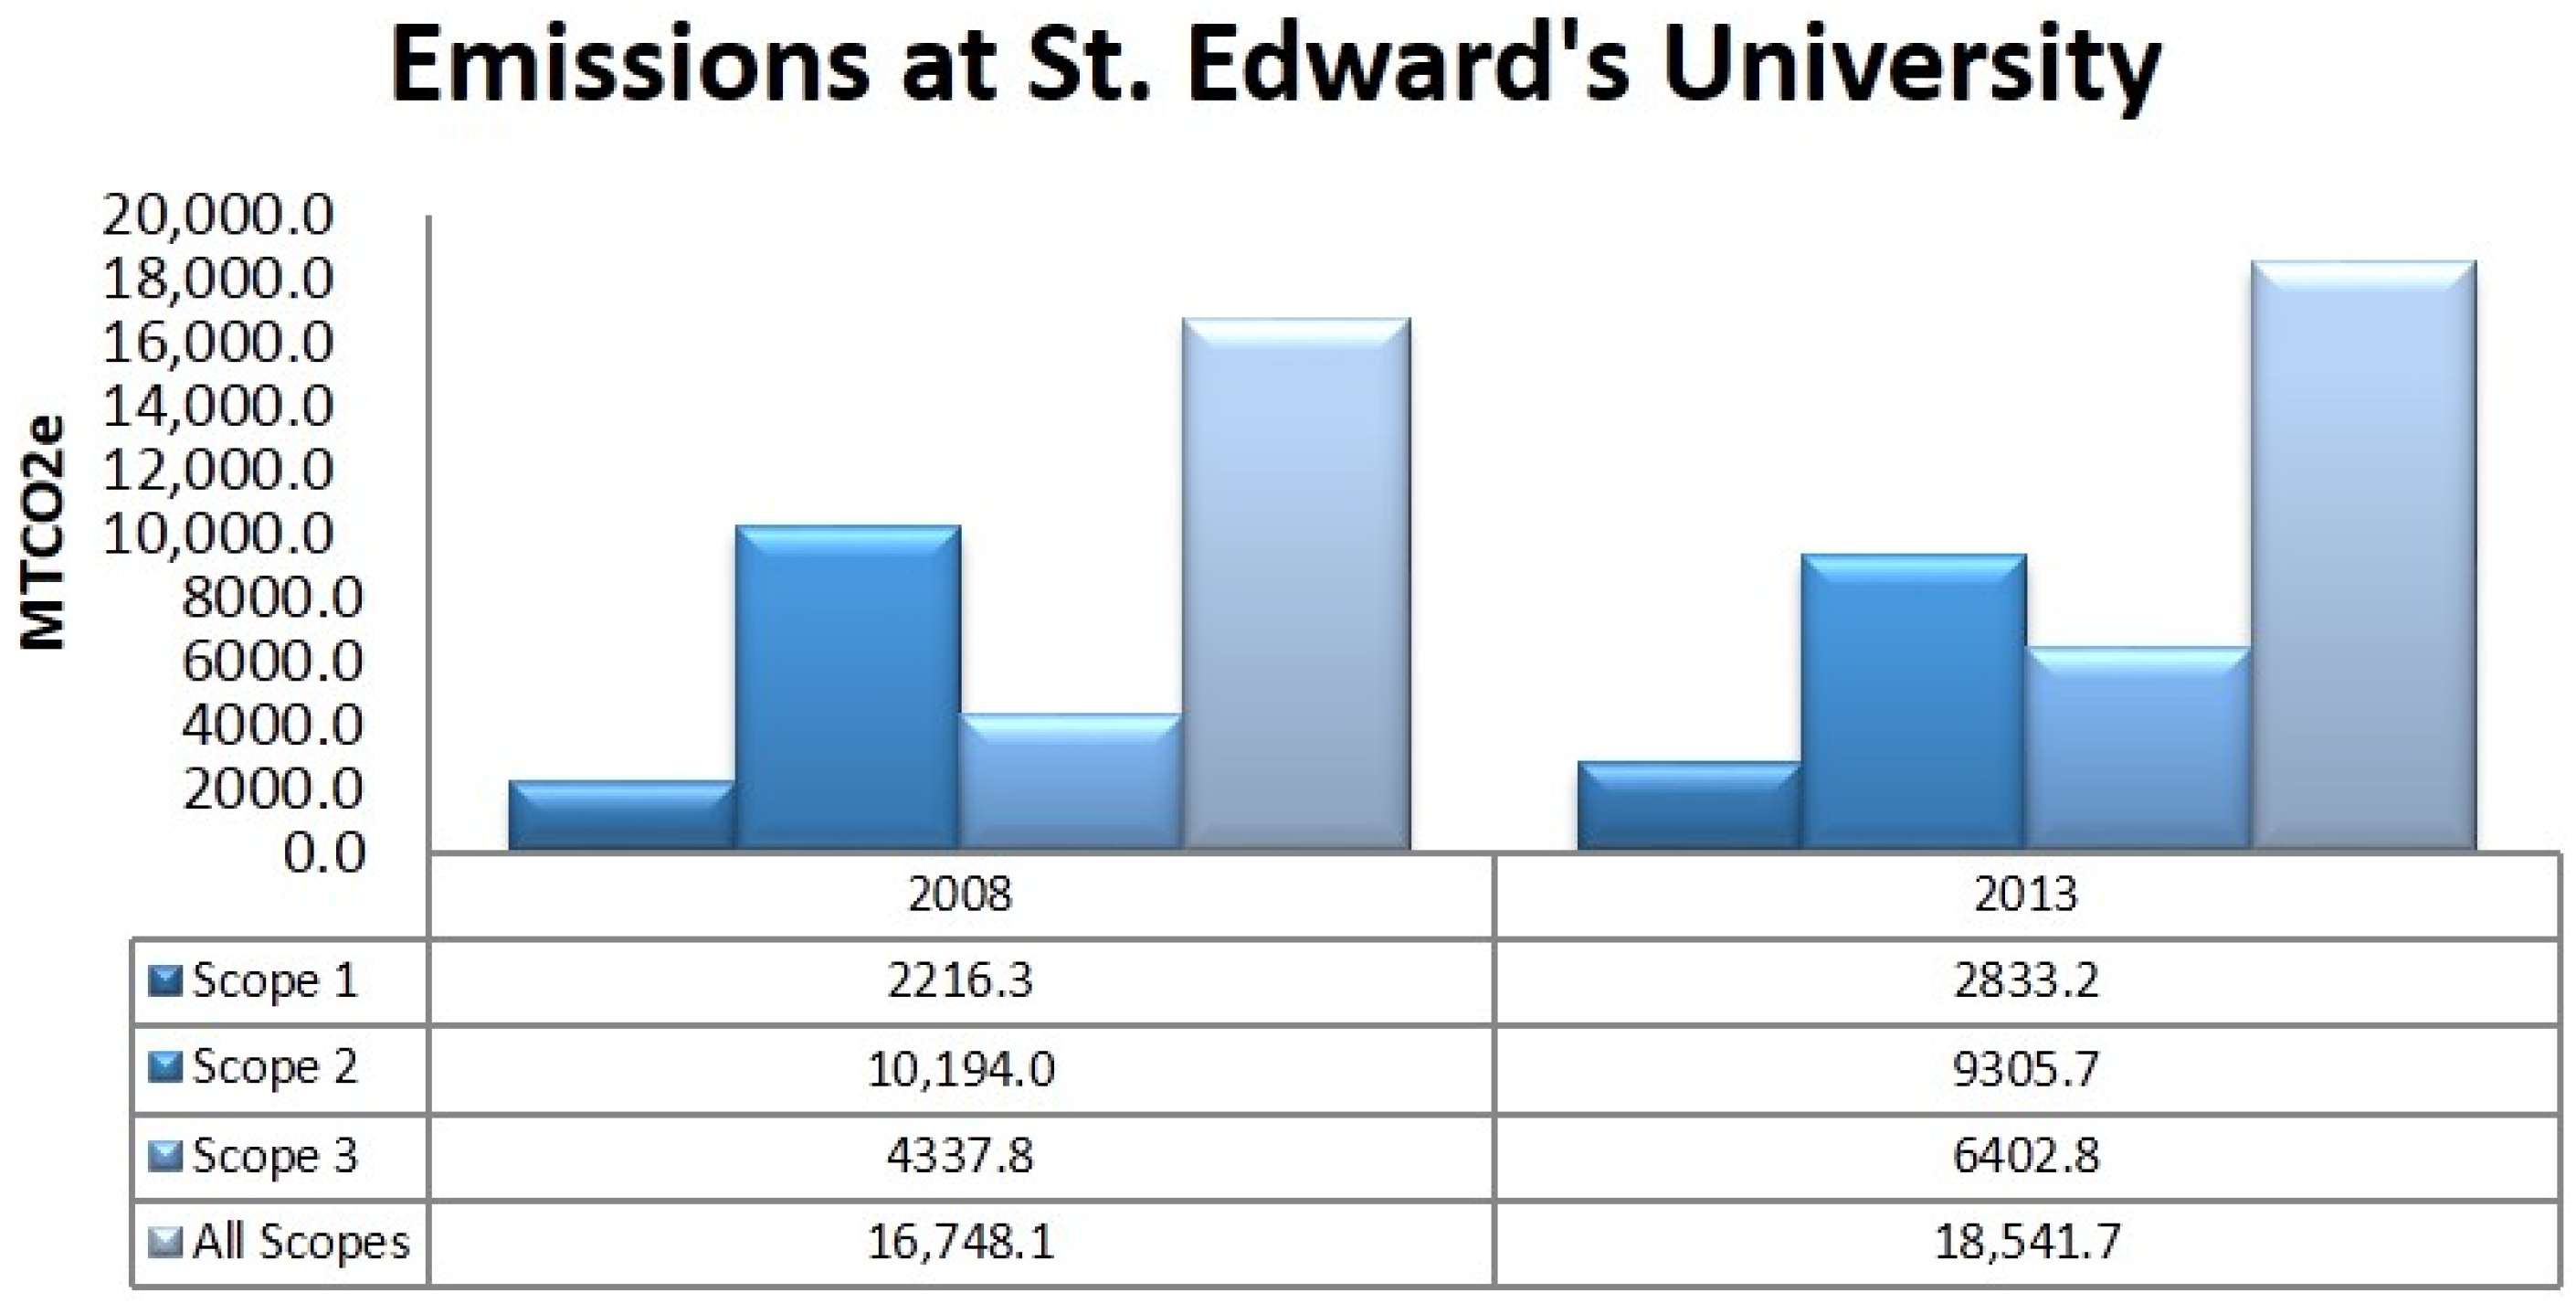
Our data show an increase in Scopes 1 and 3 and a decrease in Scope 2, totaling a gross increase in emissions from 2008 to 2013 (
Figure 4).
Figure 4.
Temporal comparison of all scopes at St. Edward’s.
Figure 4.
Temporal comparison of all scopes at St. Edward’s.
6.2. University Comparison
The universities that participated in our study had vastly different profiles in terms of building space, population size, sustainability action plans, geography and status of institution.
The sizes of the participating universities ranged from less than 2000 FTE university users to over 65,000 FTE users, as well as less than one million square feet of building space to nearly 23 million square feet (
Table 7). Eight of the participating universities introduced their first FTE position focused on sustainability efforts within the four years prior to our study. The authors only received participation from two teaching-focused universities as opposed to seven research-based institutions.
Table 7.
Institutional data comparison.
Table 7.
Institutional data comparison.
| University | Total FTE (Students + Staff/Faculty) | Total Building Area (m2) | Year First Sustainability Position Established | Research? |
|---|
| Austin College | 1650 | 74,645 | 2011 | No |
| St. Edward’s University | 4991 | 125,710 | 2010 | No |
| Rice University | 9116 | 550,964 | 2004 | Yes |
| University of North Texas | 33,157 | 638,243 | 2009 | Yes |
| Texas Tech University | 39,500 | 780,385 | 2009 | Yes |
| UT Southwestern Medical Center | 16,700 | 1,021,933 | 2012 | Yes |
| University of Houston | 46,000 | 1,059,094 | 2012 | Yes |
| Texas A & M | 61,972 | 2,108,222 | 2008 | Yes |
| University of Texas—Austin | 65,801 | 2,128,862 | 2009 | Yes |
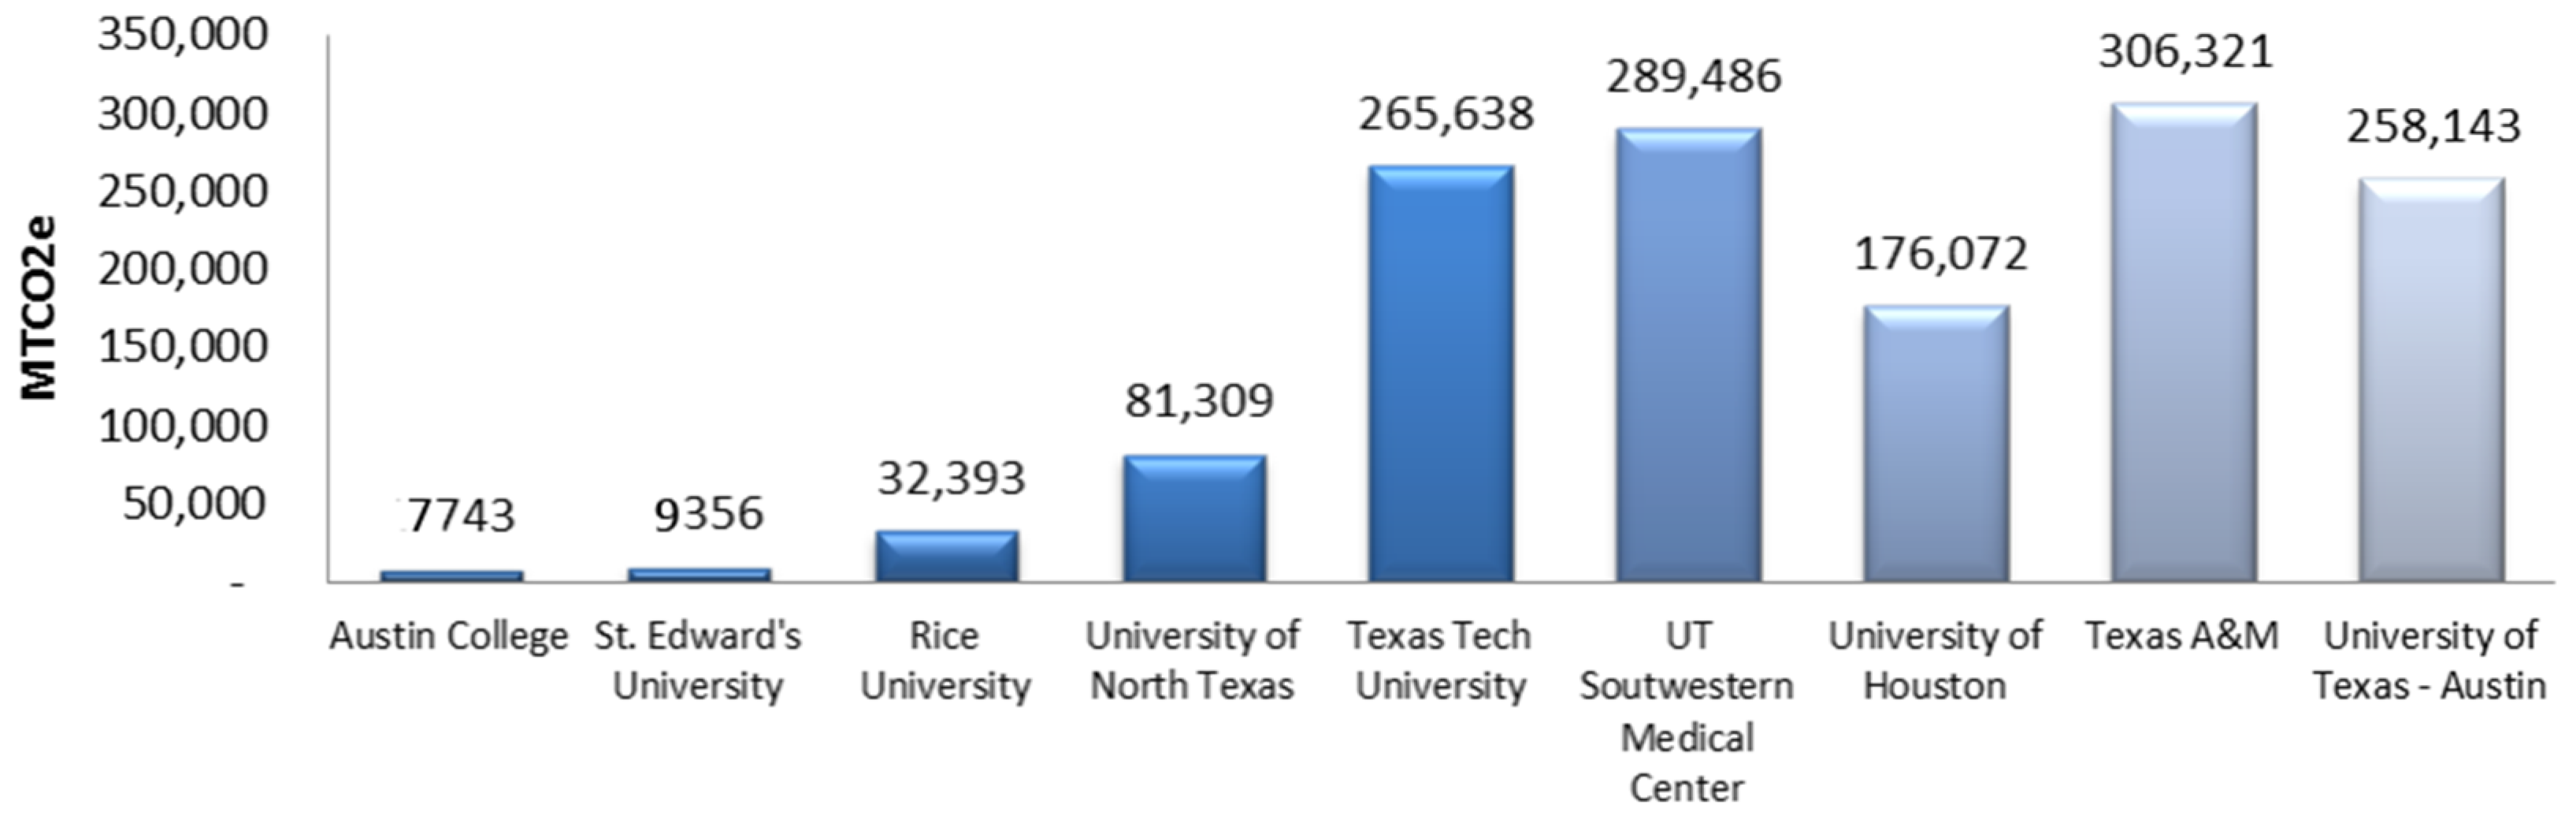
6.2.1. Net Emissions
Figure 5 shows the net emissions of each university by subtracting any mitigated MTCO
2e through offsets from the total calculated emissions.
Figure 5.
Comparison of net emissions.
Figure 5.
Comparison of net emissions.
6.2.2. Net Emissions Normalized by FTE
Figure 6 shows the net emissions of each participating university normalized by FTE users (students, faculty and staff). It is interesting to note that the larger universities are performing better than some of the smaller universities when normalized by population size. We have decided to remove UT Southwestern Medical Center from this scenario due to the large number of patients and external users that use the hospital facilities that are not accounted for in our study.
Figure 6.
Comparison of net emissions normalized by FTE.
Figure 6.
Comparison of net emissions normalized by FTE.
6.2.3. Net Emissions Normalized by Gross Building Space
This chart shows university net emissions normalized by building area (per m
2). In this scenario, the smaller universities tend to fare better than the larger universities (
Figure 7).
Figure 7.
Comparison of net emissions normalized by building area.
Figure 7.
Comparison of net emissions normalized by building area.
6.2.4. Net Emissions vs. Year of First Sustainability-Focused Position
Figure 8 displays emissions normalized by building area
vs. the year a sustainability-focused position began at each university. There is not a statistically-significant trend formed from these data. However, the authors do believe that this is an interesting pattern to note that merits further research.
Figure 8.
Net emissions vs. year of first sustainability-focused position.
Figure 8.
Net emissions vs. year of first sustainability-focused position.
6.2.5. Analysis by Type of Institution
The average net emissions of teaching emissions normalized for FTE users are much closer than when looking at the average net emissions normalized for building area (
Table 8).
Table 8.
Comparison of emissions between research and teaching institutions.
Table 8.
Comparison of emissions between research and teaching institutions.
| Type | Average of Net Emissions/FTE | Average Net Emissions/Area |
|---|
| Teaching | 3.28 | 0.09 |
| Research | 4.24 | 0.18 |
7. Discussion
The authors intend for the St. Edward’s inventory to serve as a user-friendly database or reference point for the university to expand and build upon in the future. By initiating this in-depth inventory, not only are we encouraging its maintenance, but we are showing that it is possible to track and monitor GHG emissions at the student level (since the authors are student’s themselves). A necessary first step toward action is the evaluation of current circumstances, and we hope that St. Edward’s continues to step on the scale for assessment.
This paper makes the call for more institutional research to improve or change the sustainability initiatives on campuses in Texas and to encourage an element of healthy competition between these Texas universities. We use this study as a tool to motivate other schools and institutions to respond to climate change in a responsible way. The data we collected showed an overall increase in GHG emissions between FY 2008 and FY 2013, though it is the authors’ belief that this increase is due to increased data collection methods and accuracy rather than actual increased emissions.
The total calculated emissions at St. Edward’s for FY 2008 and FY 2013 are 16,748 and 18,541. Data points that were collected in both years, such as purchased electricity, have typically decreased. The increase in overall emissions can be explained by the inclusion of study abroad air travel and commuting emissions that were not collected in the past study. Despite the initial appearance of an increase in emissions, this is an encouraging result of our study. The inclusion of new data points shows that the university is becoming more aware of all emission sources. This promotes the idea that increased awareness and transparency can lead to better management of emission sources. The decrease in data collected since 2008 shows that the university has the will and ability to make decisions and policy recommendations that will reduce emissions once initial inventories and baselines are collected.
The results of a GHG inventory of any school will bring an environmental consciousness to the student population, which could then spill over to the larger population. For example, smarter transportation policies will result in a reduction of the egregious amount of carbon emissions that result from single-occupancy driving. Students will form alternative transportation habits now, which could bring these good practices with them to the workforce, which, in turn, would help reduce our contribution to climate change [
47]. The authors’ research also churned out many implications for future studies, which will strengthen the readers’ ability to understand how individual student populations can address global climate change.
On the whole, travel is one of the largest emitters of GHGs. For our inventory, we were not able to obtain air travel data from university business in time for this report. This potential project could research the impact of air travel at universities. Transportation was the most difficult measure to obtain and also one of the most impactful. In order to increase the quality of transportation data, the authors suggest that St. Edward’s requires its students, faculty and staff to take a short survey in order to receive a parking permit. This way, one could better estimate how many cars are driven to campus and the average miles traveled to the university; therefore, one could have a more accurate measure of carbon emissions. Supply chain is also another topic that is difficult to tackle, but can have a significant impact on the carbon footprint of the university. Accounting for the transportation of how far supplies and resources travel to the university, for example, has a strong potential for a large amount of data analysis, but again poses difficulties in data obtainment. The application of a material flow analysis or substance flow analysis could also help assess economic and social development and environmental change at universities [
16]. A review on using material/substance analysis shows that the method has the capability to become an essential tool in sustainability assessment and also facilitates the formation of sound sustainable policies for a higher education institution. However, why just start this in higher education institutions? These systematic methods of measuring sustainability need to start being implemented earlier, such as in primary school, if one really wants to educate the youth on sustainable development. Food and university restaurants represent the one major area of embodied emissions that our report did not address.
Another point of discussion is the importance of establishing a structured sustainability office or person responsible for monitoring, tracking and advocating for sustainability initiatives on campus. The environmental fervor sweeping college campuses has reached beyond the push to recycle plastics and is overflowing into curriculum, classrooms, academic majors and new buildings [
28]. However, the university trustees and stakeholders cannot rely on the sole ebb and fluctuating flow of student and administration interest to enforce a regular and standardized practice of sustainability in higher education. The Secretary General of the United Nations, Kofi Annan, has posited that “our biggest challenge in this new century is to take an idea that sounds abstract—sustainable development—and turn it into reality for all the world’s people” [
47]. Thus, the university officials cannot just rely on the greening trend to take hold and enact real change. For emissions targets to be reached, there needs to be a collaborative and interdisciplinary approach to structure these efforts in order to sanction sustainable practices on campus.
8. Conclusions
The university can act as a model for a city; therefore, it is an ideal opportunity for hands-on experimentation of sustainable planning. For example, the City of Houston could gain an understanding of successful solid waste reduction programs, like the Big Belly Solar compactor program at the University of Houston, and create a similar program on a city-wide scale. Colleges and universities can reduce their emissions of greenhouse gases while educating and inspiring members of their surrounding communities, experimenting with new technologies and, in many cases, reducing long-term energy costs [
6].
We cannot concretely say that the existence or creation of a sustainability department will lead to a reduction in GHG emissions. However, the trend towards that hypothesis is building, and we believe that with further research and larger sample sizes, our initial hypothesis will be confirmed.
Lastly, praise participation; do not criticize. Of the 34 universities that we contacted to participate in our study, only 29 percent chose to be a part of our study. Because the majority of the universities that participated in our study were research institutions, we would like to point out the importance of the research institution in conducting a GHG inventory. The authors do not wish to diminish the value of a GHG inventory at teaching institutions; however, the emissions at research institutions are greater than those at teaching institutions and, therefore stand, to benefit more.
This is a call for future research to be done on GHG inventories in higher education.
Supplementary Files
Supplementary File 1Acknowledgments
The authors gratefully acknowledge funding provided by the St. Edward’s University School of Behavioral and Social Sciences, the cooperation from Austin College, Rice University, University of North Texas, UT Southwestern Medical Center, Texas Tech University, Texas A & M, UT Austin, University of Houston and St. Edward’s University, as well as the assistance of students, staff and faculty associated with the Master of Science in Environmental Management program at St. Edward’s University.
Author Contributions
Michael Wasserman contributed analysis and logistics and collaborated on the design of the experiment. Thomas LaPoint wrote the paper, designed and performed the calculations and analyzed the data. Gwendolyn Bailey collected data and wrote the paper.
Conflicts of Interest
The founding sponsors had no role in the design of the study; in the collection, analyses, or interpretation of data; in the writing of the manuscript; nor in the decision to publish the results.
Appendix
Questions for Sustainabilty Officers:
- (1)
Name, title, brief description of your role.
- (2)
How long has your position been around?
- (3)
Besides yourself, does the school employ any other, dedicated full-time (or full-time equivalent) sustainability staff member?
- (4)
What are the student orgs on campus related to environment initiatives? How long they’ve existed?
- (5)
Does the school have a formal committee with participation from students that is devoted to advancing sustainability on campus?
- (6)
Are school buildings that were constructed or underwent major renovations in the past three years LEED certified?
- (7)
Does the school have an environmental studies major, minor or concentration?
- (8)
Do the school’s students graduate from programs that include sustainability as a required learning outcome or include multiple sustainability learning outcomes?
- (9)
Does the school have a formal plan to mitigate its greenhouse gas emissions?
- (10)
Scope 1: Energy population: staff, faculty, and students?
- (11)
Direct emission sources: Does your school direct energy through cogeneration?
- (12)
What percentage of the school’s energy consumption is derived from renewable resources?
- (13)
If you don’t have any of the above information, can we have the name and information of the person who has it?
- (14)
What is the amount of fuel the university uses for institutional purposes? (facilty use/campus vehicles)
- (15)
Please list the refrigerants and chemicals consumed for institutional use.
- (16)
Methane and nitrous oxide from agriculture: What type and how much fertilizer is being used for institutional purposes? And how many animals or livestock reside on-campus?
- (17)
Scope 2: Indirect Emissions. Where does the university purchase its electricity from?
- (18)
Where does the university purchase its steam and chilled water?
- (19)
Do you have any carbon offsets or renewable energy certificates (REC)?
- (20)
If you are unable to answer any of these questions, please do not leave blank. Instead, write the name and contact info of the person who has this information so we can send them an informed consent form.
References
- Soubbotina, T.P. Beyond Economic Growth: An Introduction to Sustainable Development; World Bank: Washington, DC, USA, 2004. [Google Scholar]
- Tufts Climate Initiative, Tufts Institute of the Environment. Methods for Conducting a Greenhouse Gas Emissions Inventory for Colleges and Universities. 2002. Available online: http://sustainability.tufts.edu/wp-content/uploads/InventoryMethods.pdf (accessed on 21 December 2015).
- Working Group I. Twelfth Session: IPCC Fifth Assessment Report Climate Change 2013: The Physical Science Basis. 2013. Available online: http://www.climatechange2013.org/images/uploads/WGIAR5_WGI-12Doc2b_FinalDraft_All.pdf (accessed on 21 December 2015).
- Brown, L.R. Rescuing a Planet under Stress. Humanist 2003, 63, 25–29. [Google Scholar]
- United Nations Framework Covention on Climate Change. Kyoto Protocol. 2014. Available online: https://unfccc.int/kyoto_protocol/items/2830.php (accessed on 20 April 2014).
- Rappaport, A.; Creighton, S.H. Degrees that Matter: Climate Change and the University; The MIT Press: Cambridge, MA, USA, 2007. [Google Scholar]
- The Brundtland Commission. Report of the World Commission on Environment and Development: Our Common Future. 1987. Available online: http://www.un-documents.net/wced-ocf.htm (accessed on 22 December 2015).
- Alshuwaikhat, H.M.; Abubakar, I. An integrated approach to achieving campus sustainability: Assessment of the current campus environmental management practices. J. Clean. Prod. 2008, 16, 1777–1785. [Google Scholar] [CrossRef]
- Lozano, R. A tool for a Graphical Assessment of Sustainability in Universities (GASU). J. Clean. Prod. 2006, 14, 963–972. [Google Scholar] [CrossRef]
- García, F.J.L.; Kevany, K.; Huisingh, D. Sustainability in Higher Education: What is Happening? J. Clean. Prod. 2006, 14, 757–760. [Google Scholar] [CrossRef]
- Leal Filho, W. (Ed.) Sustainability at Universities—Opportunities, Challenges and Trends; Peter Lang: Bern, Switzerland, 2009; Volume 31.
- Koester, R.J.; Eflin, J.; Vann, J. Greening of the campus: A whole-systems approach. J. Clean. Prod. 2006, 14, 769–779. [Google Scholar] [CrossRef]
- Haberl, H.; Fischer-Kowalski, M.; Krausmann, F.; Weisz, H.; Winiwarter, V. Progress towards sustainabilty? What the conceptual framework of material and energy flow accounting (MEFA) can offer. Land Use Policy 2004, 21, 199–213. [Google Scholar]
- United Nations Educational, Scientific and Cultural Organization. The UN Decade of Education for Sustainable Development (DESD 2005–2014). 2007. Available online: http://unesdoc.unesco.org/images/0015/001540/154093e.pdf (accessed on 31 December 2015).
- Huang, C.L.; Vause, J.; Ma, H.W.; Yu, C.P. Using material/substance flow analysis to support sustainable development assessment: A literature review and outlook. Resour. Conserv. Recycl. 2012, 68, 104–116. [Google Scholar] [CrossRef]
- Custom listing of 4 year degree-granting colleges in Texas. Available online: http://carnegieclassifications.iu.edu/index.php (accessed on 17 November 2013).
- U.S. Department of Education. Enrollment of the 120 Largest Degree-Granting College and University Campuses, By Selected Characteristics and Institution: Fall 2006. 2007. Available online: http://nces.ed.gov/programs/digest/d08/tables/dt08_236.asp (accessed on 24 November 2013). [Google Scholar]
- Beck, P. St. Edward’s Greenhouse Gas Inventory; St. Edward’s University: Austin, TX, USA, 2009. [Google Scholar]
- O’Toole, K. The Princeton Review’s Guide to 322 Green Colleges. 2013. Available online: https://www.princetonreview.com/uploadedFiles/Sitemap/Home_Page/Campaign/2013/GreenGuide/_MEDIA/2013_green-guide.pdf (accessed on 22 December 2015).
- Hairston, N.; Leibovich, S. Task Force on Sustainability in the Age of Development; Cornell University: Ithaca, NY, USA, 2006. [Google Scholar]
- Johnston, L.F. (Ed.) Higher Education for Sustainabilty: Cases, Challenges, and Opportunities from Across the Curriculum; Routledge: New York, NY, USA, 2013.
- Shoup, D.C. The high cost of free parking. J. Plan. Educ. Res. 1997, 17, 3–20. [Google Scholar] [CrossRef]
- The U.S. Environmental Protection Agency. Sector Strategies Performance Report. 2004. Available online: http://archive.epa.gov/sectors/web/pdf/performancebw.pdf (accessed on 9 November 2015). [Google Scholar]
- Association for the Advancement of Sustainability in Higher Education (AASHE). American College and University Presidents Climate Commitment. 2009. Available online: http://www.presidentsclimatecommitment.org/ (accessed on 31 December 2015).
- Klein-Banai, C.; Theis, T.L. Quantitative analysis of factors affecting greenhouse gas emissions at institutions of higher education. J. Clean. Prod. 2013. [Google Scholar] [CrossRef]
- Sustainable Business Toolkit. 2012. Available online: http://www.sustainablebusinesstoolkit.com/wp-content/uploads/2012/01/emission-scopes.png (accessed on 21 December 2015).
- Clean Air Cool Planet. Campus Carbon Calculator. 2013. Available online: http://www.sustainableunh.unh.edu/sites/sustainableunh.unh.edu/files/images/v6.5_Users_Guide.pdf (accessed on 22 December 2015).
- Jacoby, B. The Student as Commuter: Developing a Comprehensive Institutional Response: ASHE-ERIC Higher Education Report; George Washington University: Washington, DC, USA, 1989. [Google Scholar]
- U.S. Environmental Protection Agency. Emission Factors for Greenhouse Gas Inventories. 2014. Available online: http://www.epa.gov/climateleadership/documents/emission-factors.pdf (accessed on 21 December 2015). [Google Scholar]
- Greenhouse Gas Protocol. About the GHG Protocol. 2012. Available online: http://www.ghgprotocol.org/about-ghgp (accessed on 11 September 2015).
- U.S. Environmental Protection Agency. US EPA Calculations and Reference. 2013. Available online: http://www.epa.gov/cleanenergy/energy-resources/refs.html (accessed on 24 November 2013). [Google Scholar]
- Oland, C.B. Guide to Combined Heat and Power Systems for Boiler Owners and Operators; Oak Ridge National Laboratory: Oak Ridge, TN, USA, 2004. [Google Scholar]
- EPA Combined Heat and Power Partnership. Catalog of CHP Technologies. 2008. Available online: http://www.stsm.ir/resources/10301-09101387135242Catalog%20of%20CHP%20Technologies.pdf (accessed on 22 December 2015).
- Federal Energy Management Program. FEMP CHP Program Overview. 2004. Available online: http://web.ornl.gov/sci/femp/pdfs/FEMP-CHP-prog-ovr-final0205.pdf (accessed on 21 December 2015). [Google Scholar]
- U.S. Environmental Protection Agency. Methods for Calculating Efficiency. Available online: http://www.epa.gov/chp/basic/methods.html (accessed on 4 May 2014).
- Unit Juggler, Version 35. 2012. Available online: http://www.unitjuggler.com/convert-energy-from-kWh-to-MMBtu.html (accessed on 21 December 2015).
- National Aeronautics and Space Adminstration. Montreal Protocol on Substances that Deplete the Ozone Layer; CQ Press Electronic Library: San Diego, CA, USA, 1992. [Google Scholar]
- American Gas Association. How to Measure Natural Gas. Available online: http://www.aga.org/KC/ABOUTNATURALGAS/ADDITIONAL/Pages/HowtoMeasureNaturalGas.aspx (accessed on 4 May 2014).
- Clean Air Cool Planet. Campus Carbon Calculator User’s Guide: Conducting a campus greenhouse gas emissions inventory on your campus. 2006. Available online: http://www.dartmouth.edu/~opdc/energy/CACPUserGuide.pdf (accessed on 6 January 2016).
- Fetcher, N. Effects of climate and institution size on greenhouse gas emissions from colleges and universities in the United States. Sustainability 2009, 2, 362–367. [Google Scholar] [CrossRef]
- Snyder, T.D.; Hoffman, C.M. Digest of Education Statistics 2000. 2001. Available online: http://nces.ed.gov/pubs2001/2001034.pdf (accessed on 22 December 2015). [Google Scholar]
- Toor, W.; Havlick, S. Transportation and Sustainable Campus Communities; Island Press: Washington, DC, USA, 2004. [Google Scholar]
- Bandy, G., II. Sustainability Booklet; The University of Texas-Houston Health Sciences Center: Houston, TX, USA, 1998. [Google Scholar]
- Balsas, C.J.L. Sustainable transportation planning on college campuses. Transp. Policy 2003, 10, 35–49. [Google Scholar] [CrossRef]
- Hignite, K. Bending the Carbon Curve. Bus. Off. 2012, 45, 16–26. [Google Scholar]
- Harry, R. Offsetting Environmental Damage by Planes. New York Times, 18 Feburary 2003. [Google Scholar]
- Annan, K. Secretary General Calls for Break in Political Stalemate Over Environmental Issues; United Nations Press Release; United Nations: New York, NY, USA, 2002. [Google Scholar]
© 2016 by the authors; licensee MDPI, Basel, Switzerland. This article is an open access article distributed under the terms and conditions of the Creative Commons by Attribution (CC-BY) license (http://creativecommons.org/licenses/by/4.0/).


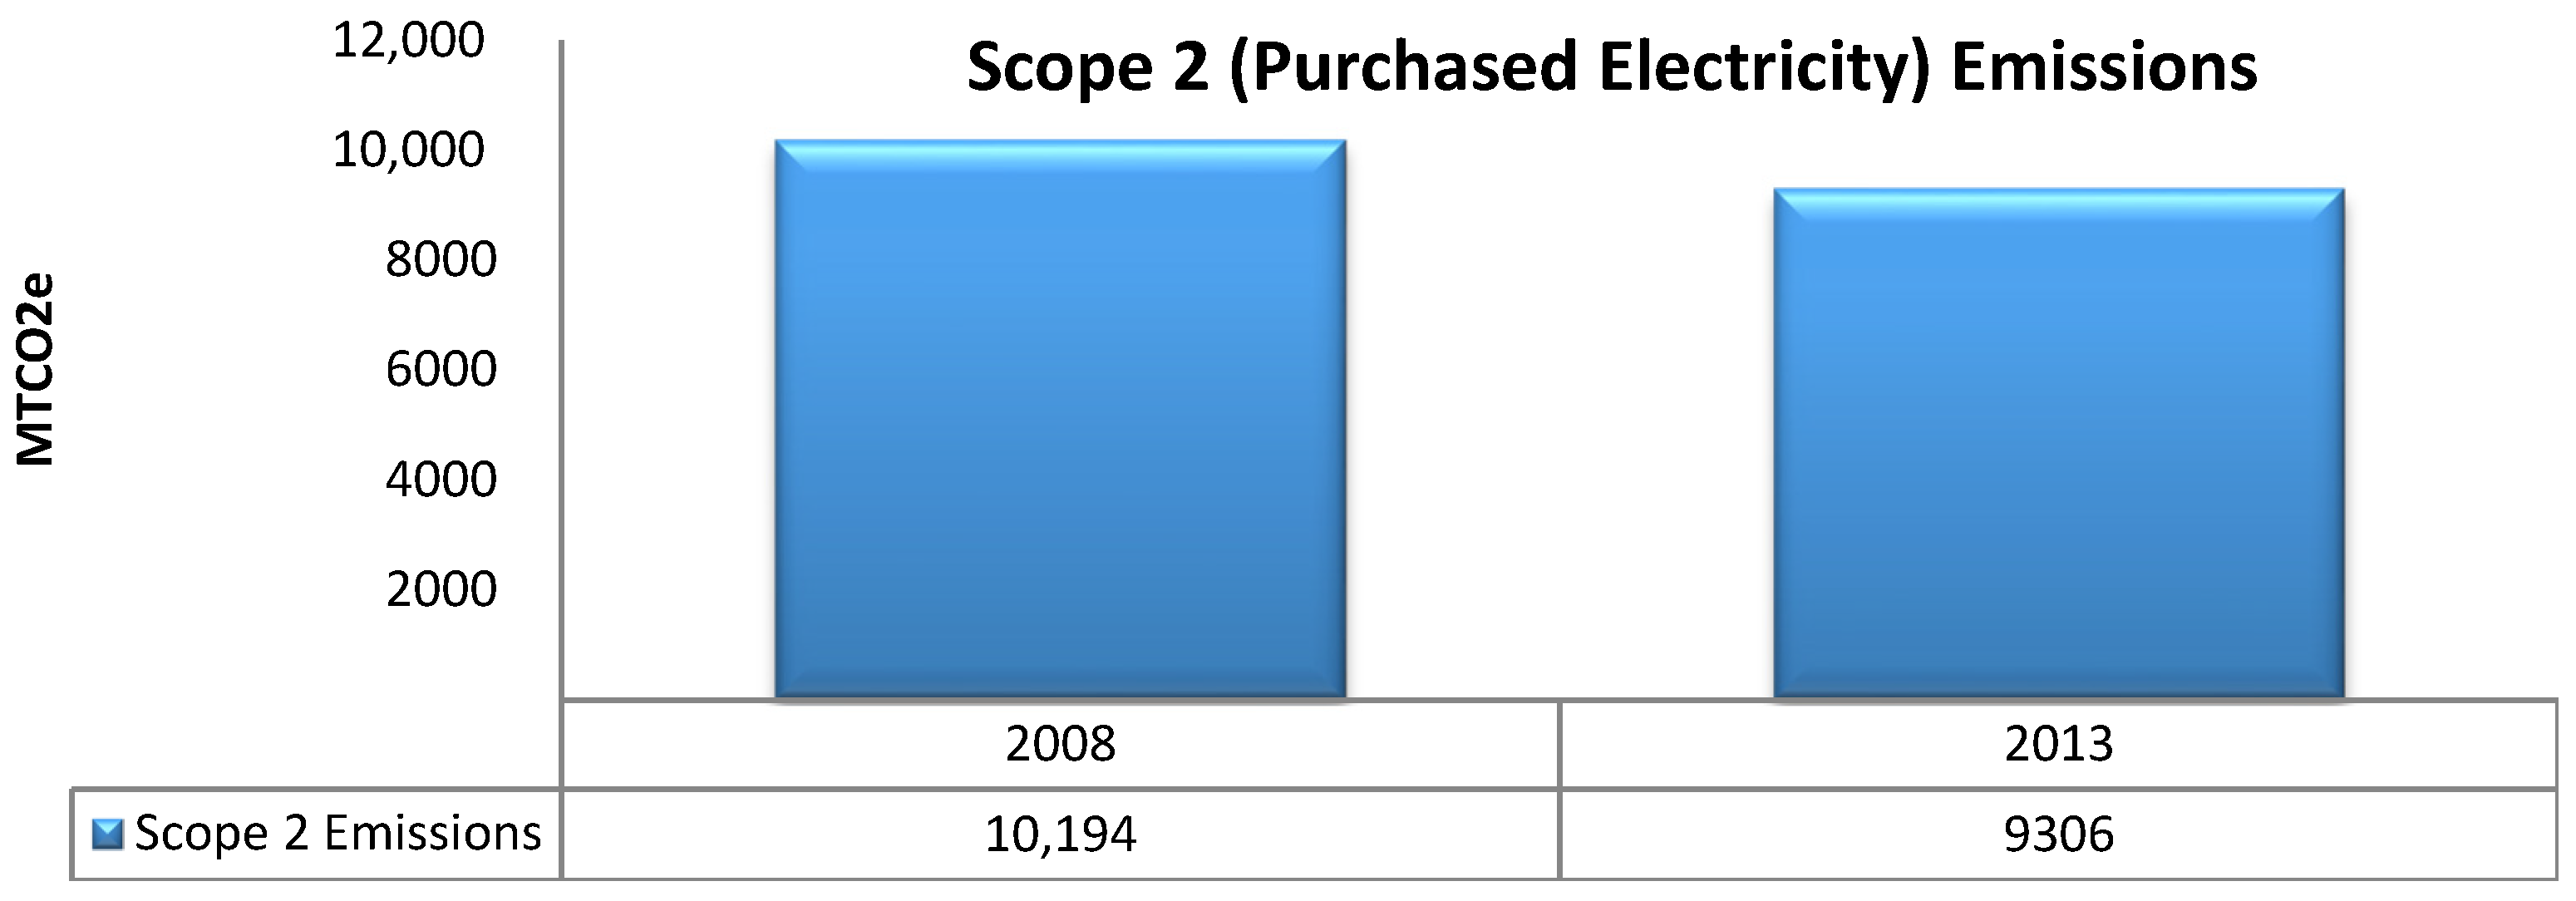
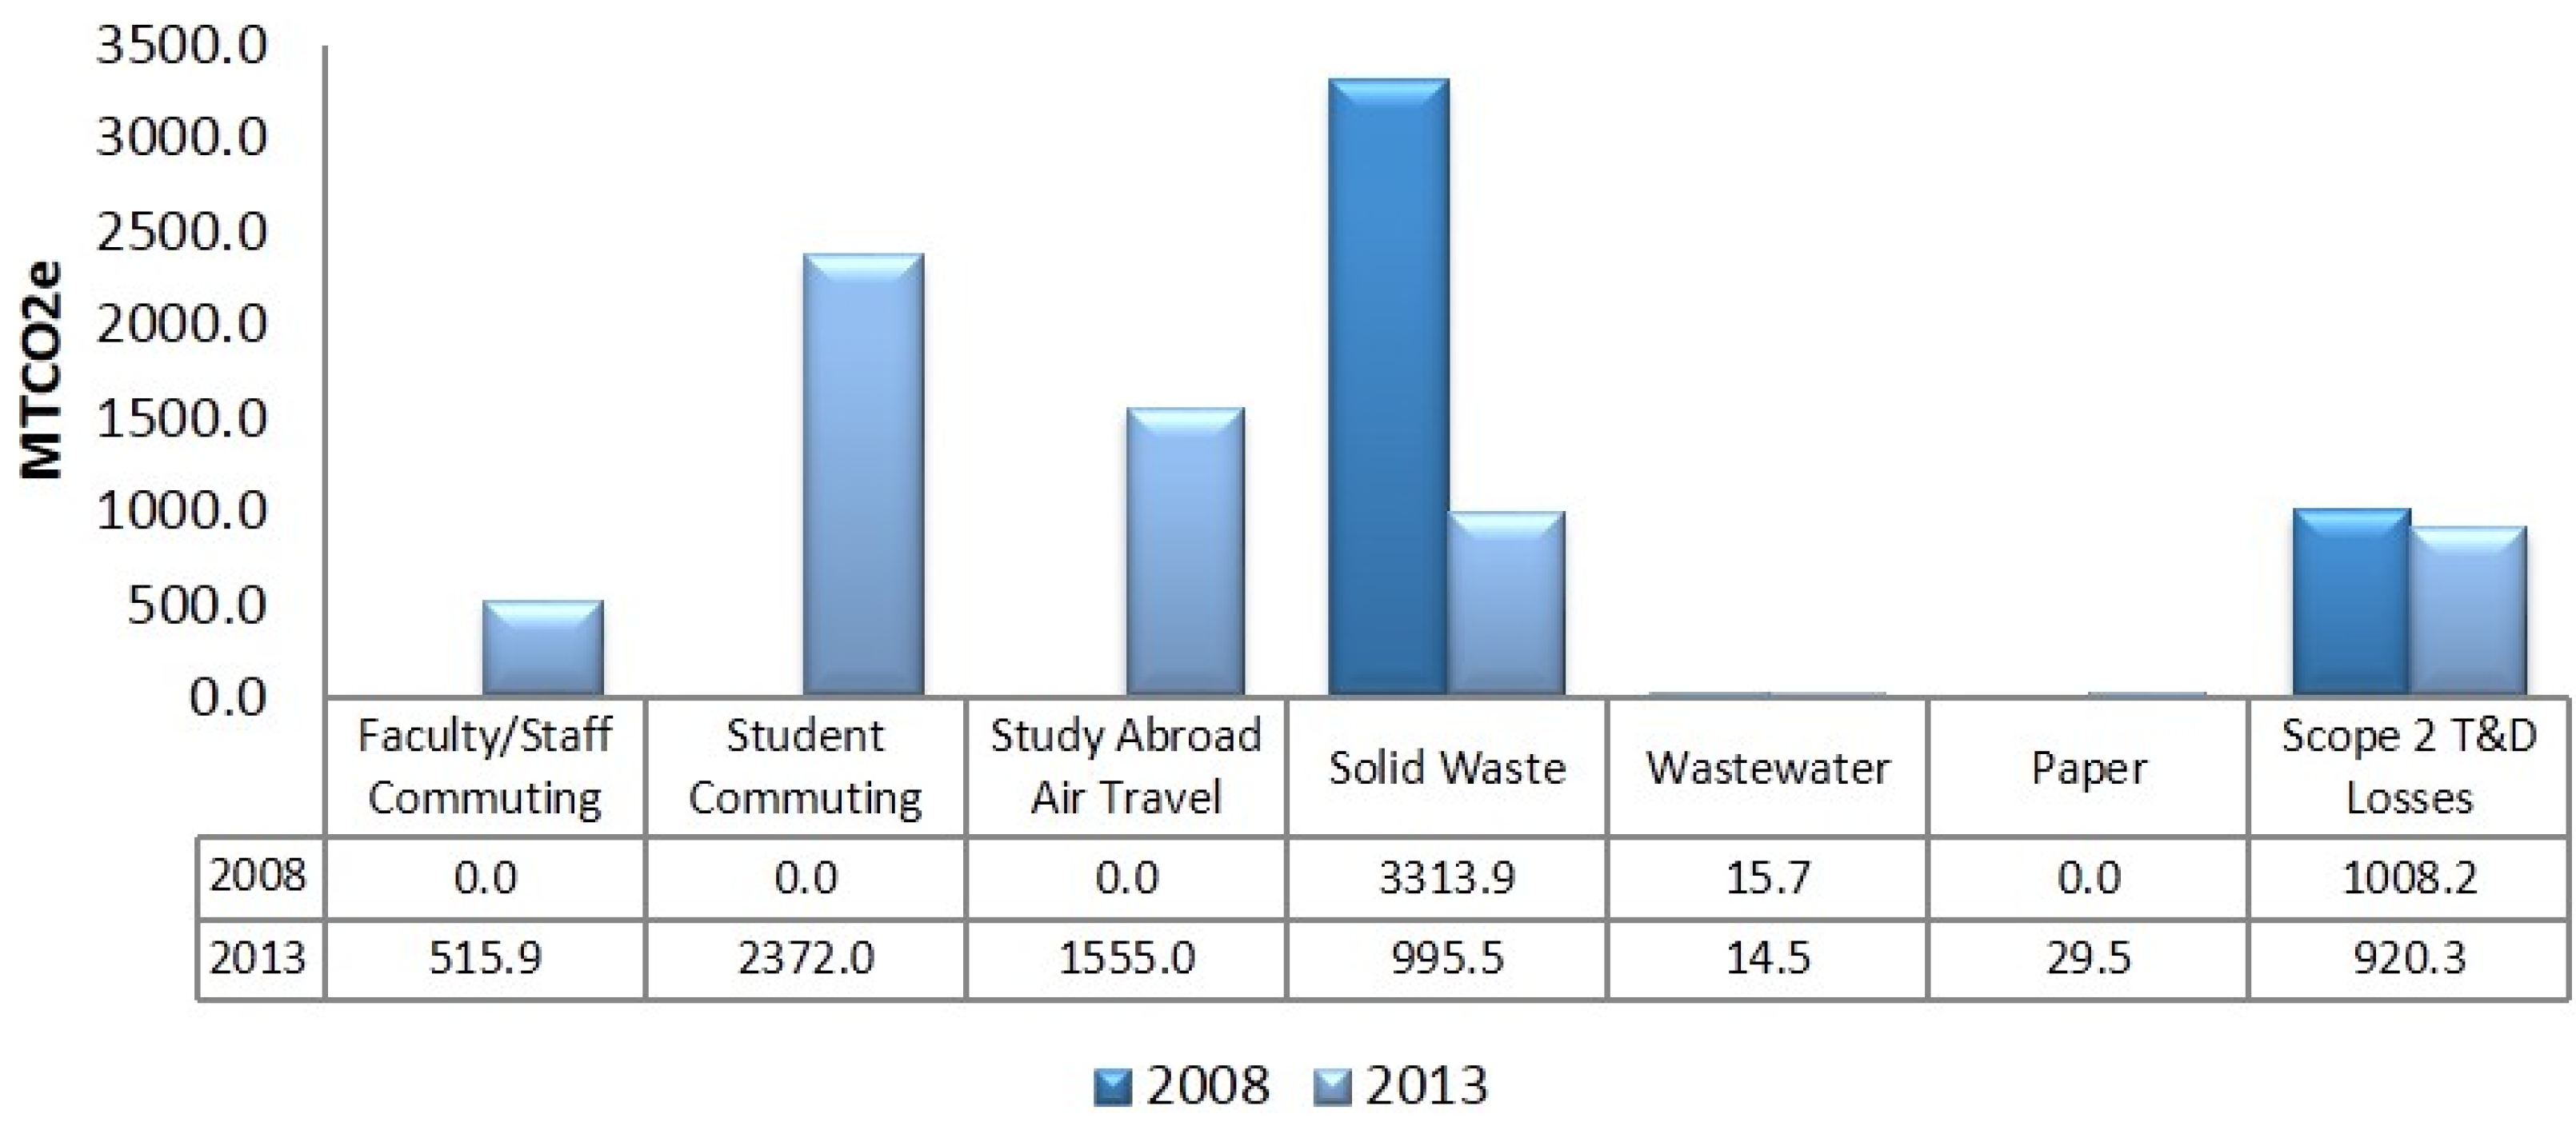
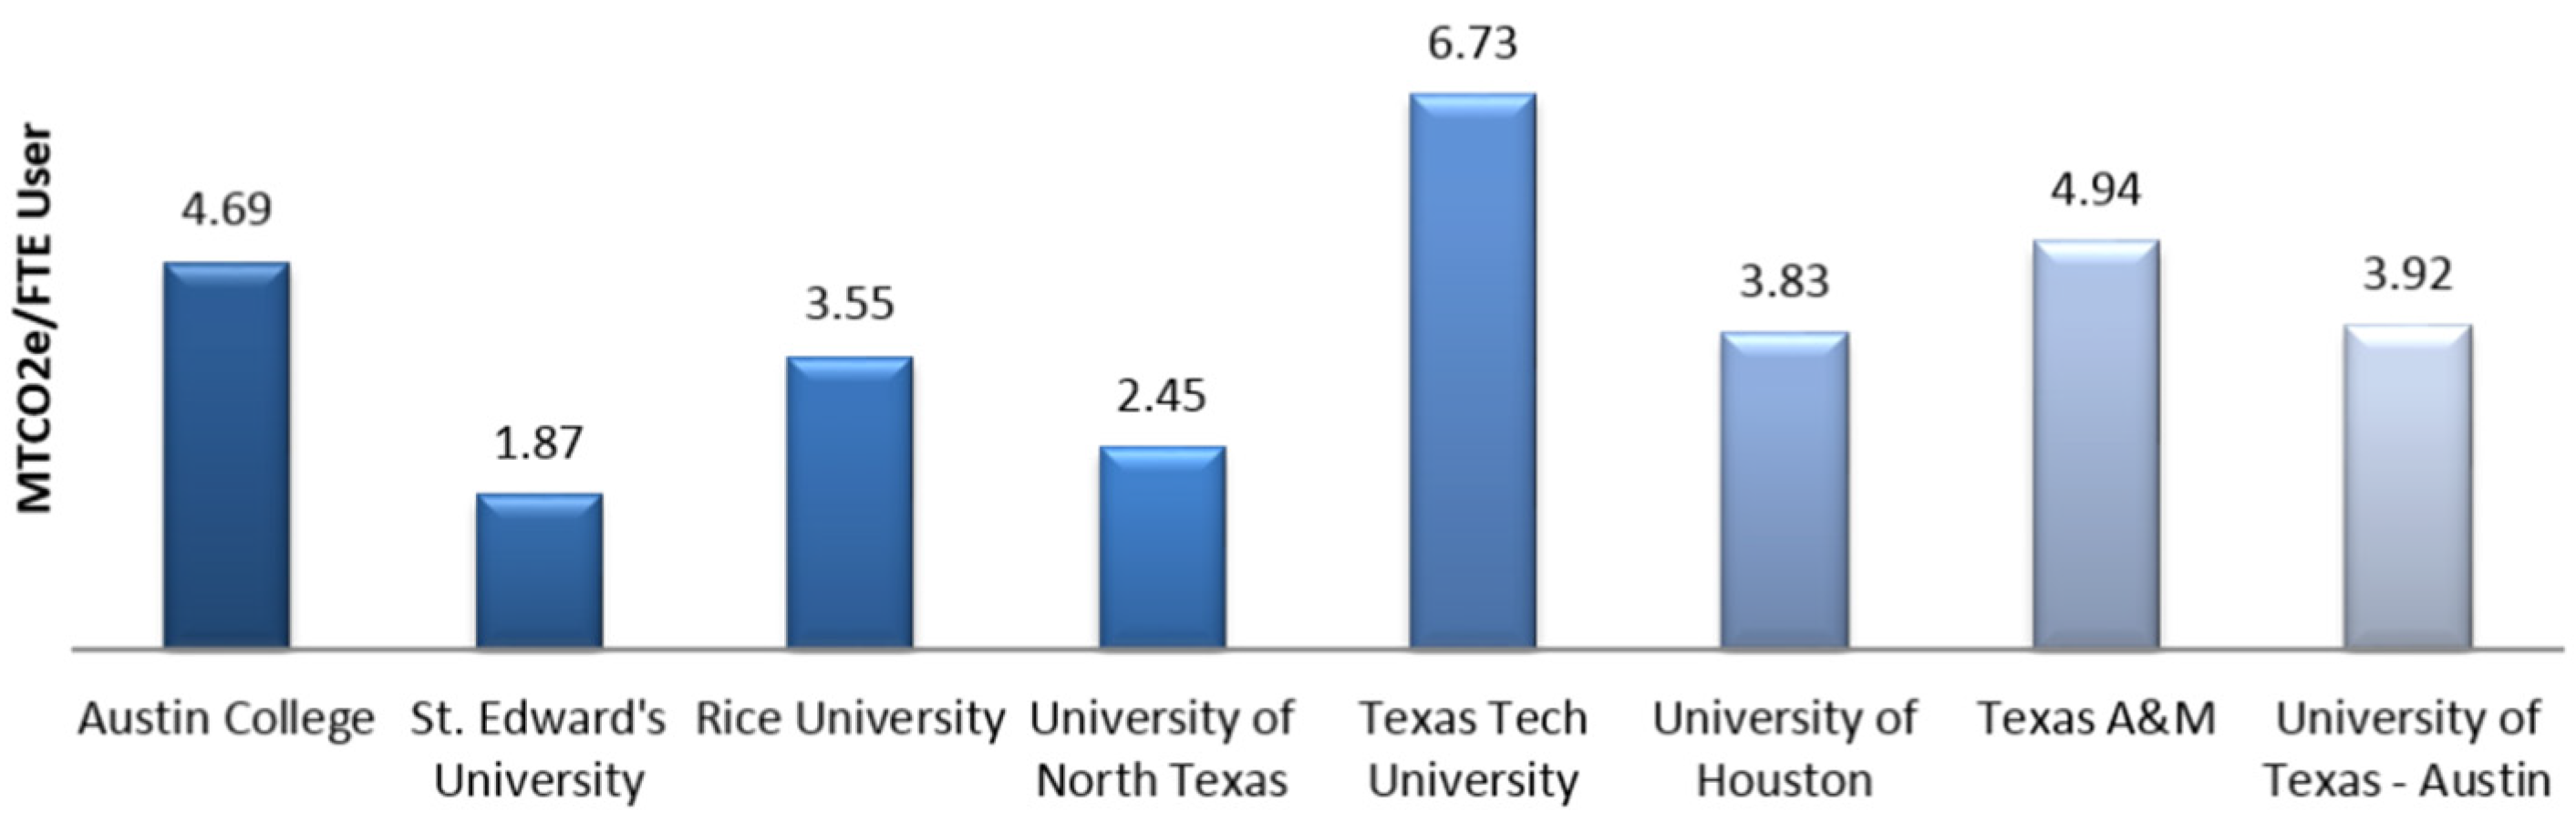
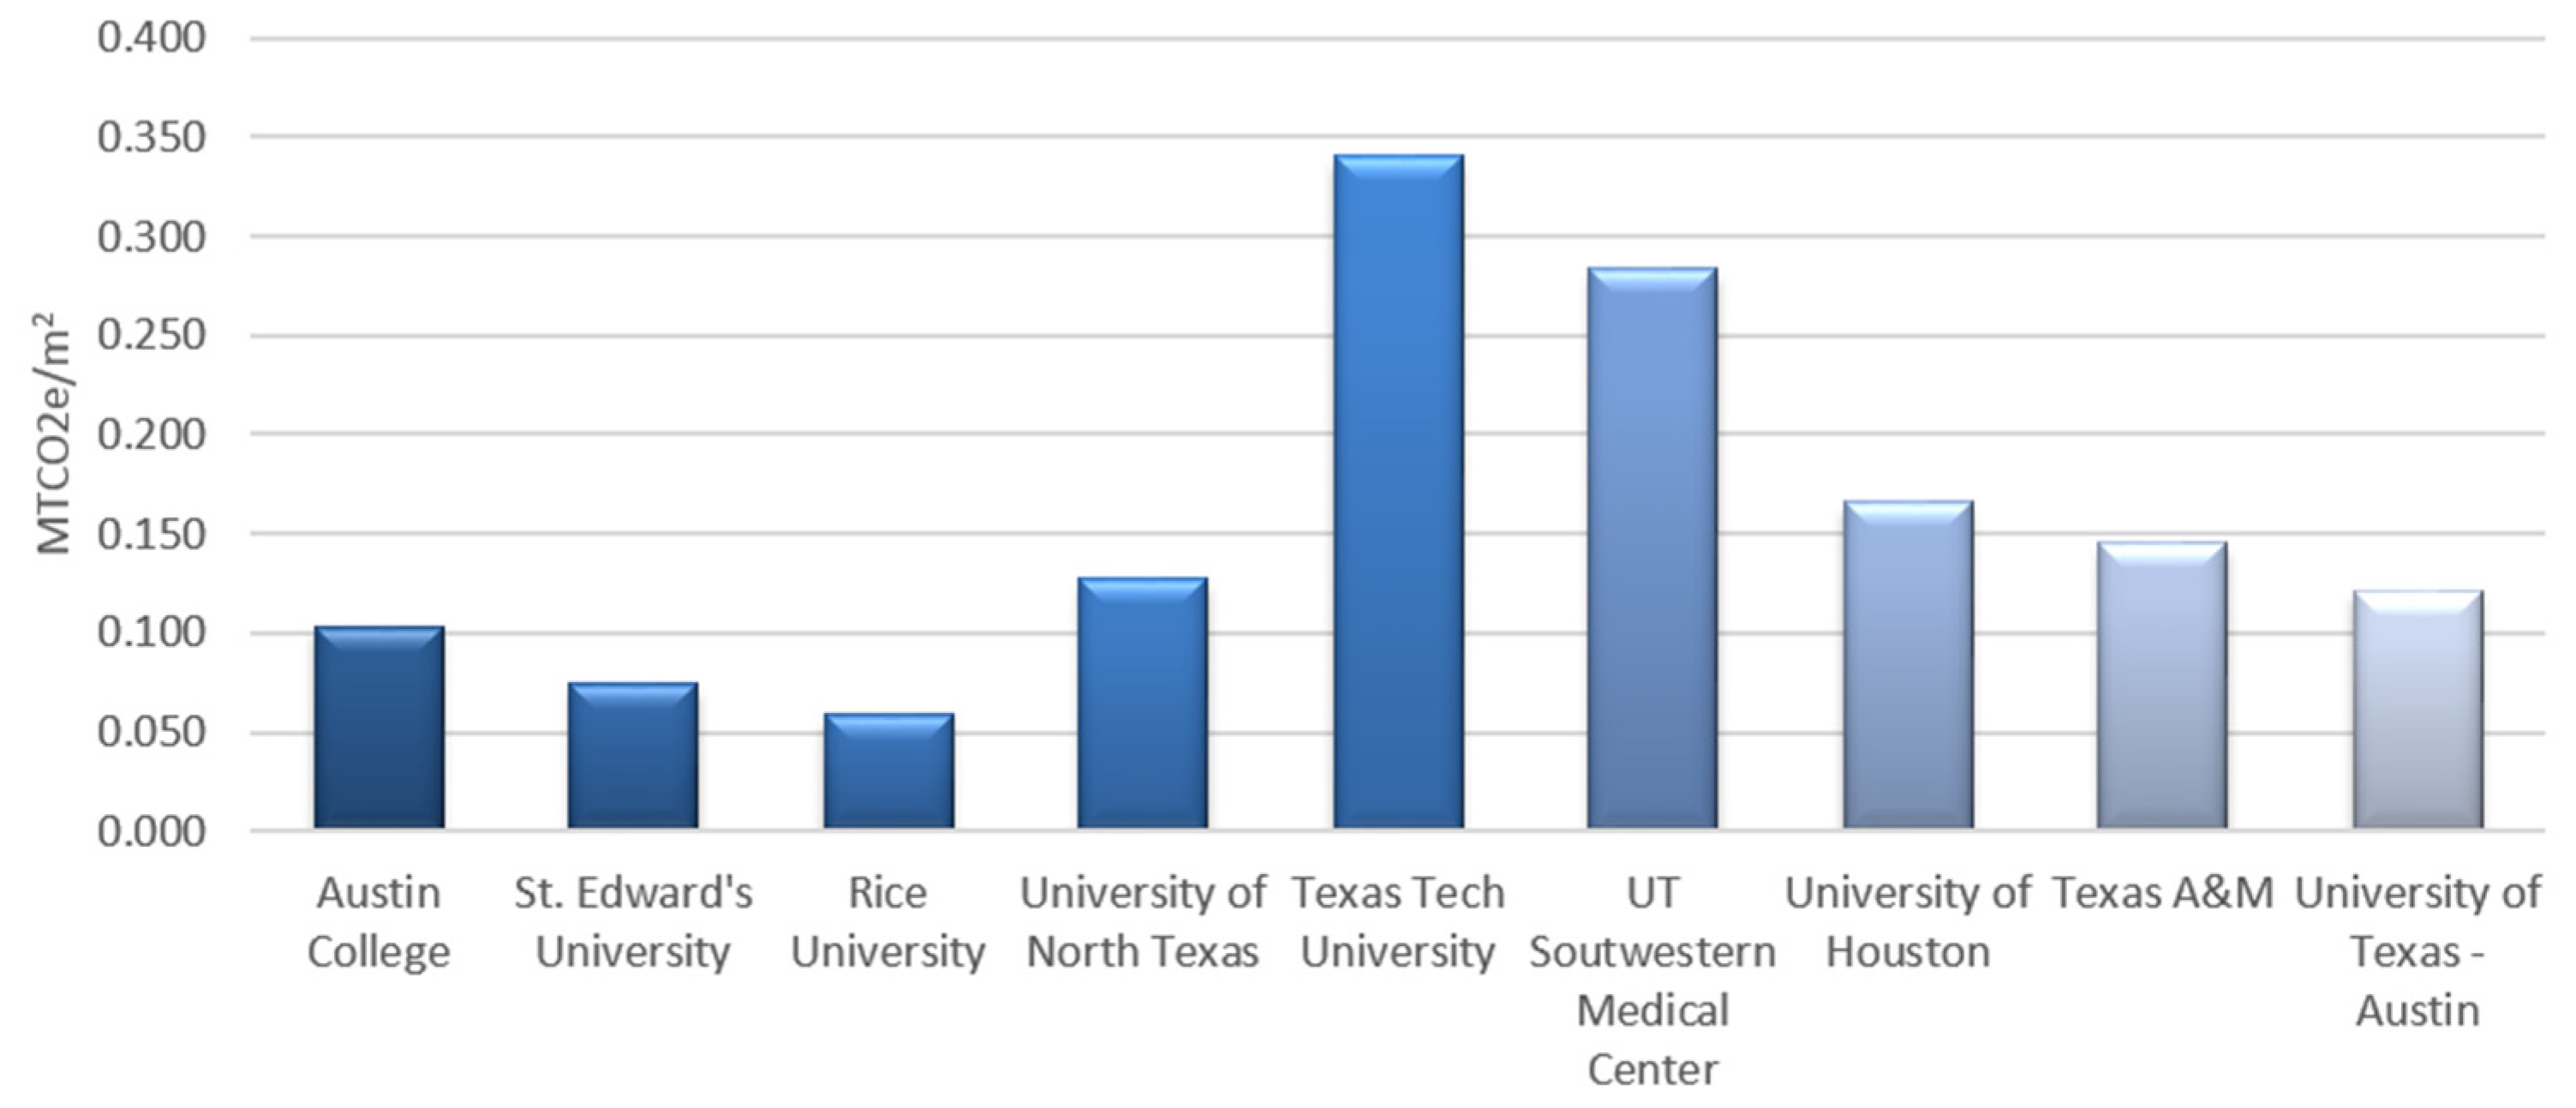
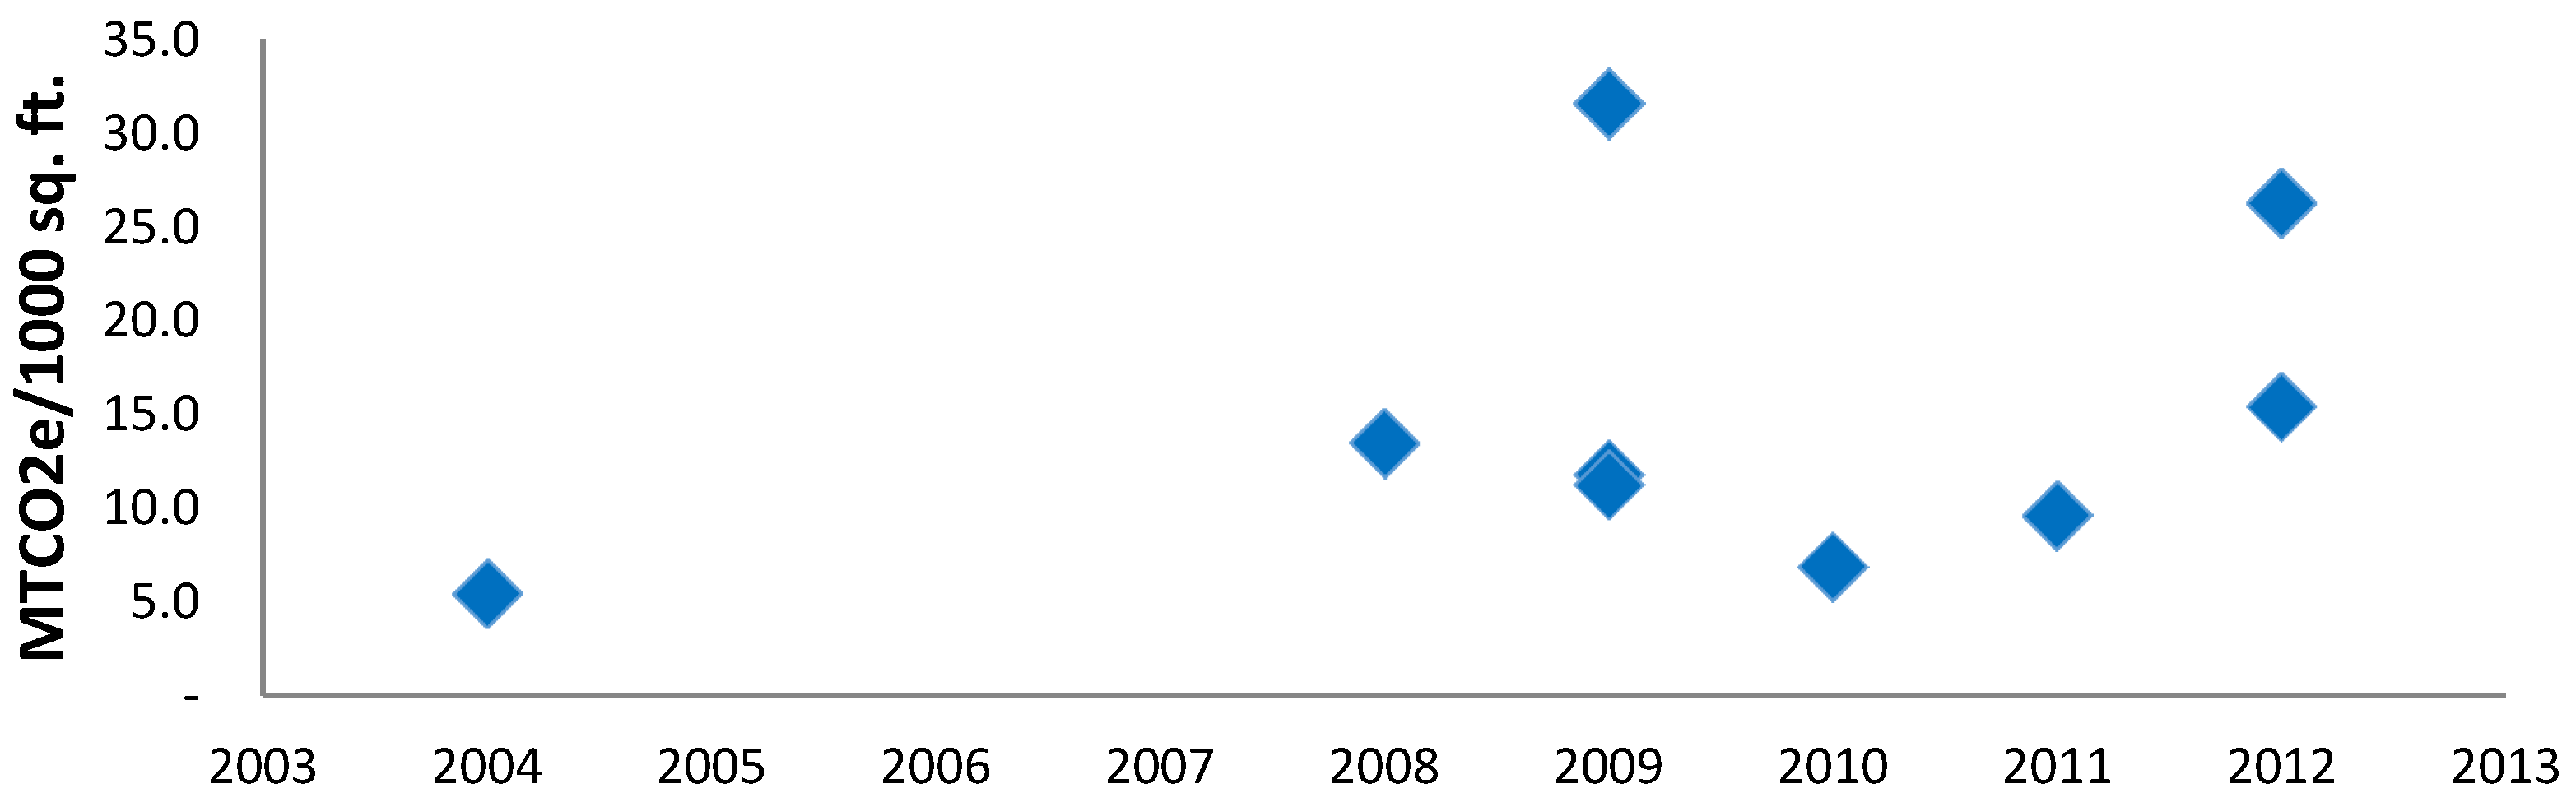