1. Introduction
Various policy suggestions for gender equality have been implemented in most countries. While the policies have been effective in some countries, other countries have not yet “harvested the fruits” of their gender equality policies [
1,
2,
3,
4]. Most of the researchers that have conducted related empirical analysis have placed South Korea in the latter category. Furthermore, the female employment rate has also been shown to be the lowest in OECD countries, which acts as a factor hindering the improvement in the overall employment rate. This study will evaluate the stratified structure of the labor market for the causes, analyze gender employment distribution and mobility in a time series, and then suggest policy directions suited to these ends.
The flexibility/rigidity of the labor market in South Korea is rated intermediate in terms of legal standards, such as the OECD standard. However, it is judged to belong to a very rigid country group considering the rigidities actually caused by the collective agreements and labor relations of workplace units (The labor market flexibility in South Korea was measured by the Employment Protection Legislation (EPL) and was found to be below the OECD average level. Specifically, the EPL regarding dismissal of regular employees in Korea was found to be 1.63, which is slightly higher than the OECD average of 1.45, whereas the EPL regarding collective dismissal was found to be 0.54, lower than the OECD average of 0.83. In addition, the regulation index of temporary workers was 0.38, which is low compared with the OECD average of 0.91, while the regulation index of dispatched workers was 2.17, significantly higher than the OECD average of 1.26 [
5]). Many scholars point out that the core of the labor market rigidity of South Korea is present in the stratified (dual) labor market structure and look especially to the large and standard employment-centric primary labor market for the cause of the rigidities (In the initial verification of the dual structure by Dickens and Lang [
6], labor markets were classified into primary and secondary labor markets depending on the wage level. This was accomplished using the switching regression method, which is the method used to evaluate whether or not the explanatory power is higher when the labor market is separated into two than when viewed as a single market. Since then, an empirical study was conducted using this methodology to review whether or not a dual structure labor market exists in South Korea. From the empirical analysis, it was found that the South Korean labor market has a sort of dual structure [
7,
8]). Waiting unemployment is prevalent in the primary core labor market, with young people waiting for employment while labor shortage exists in the secondary labor market or the peripheral labor market, classified as the small–medium and non-standard employment market, with the idleness of labor in the labor market [
9,
10].
The degree of female participation in labor markets is also very low.
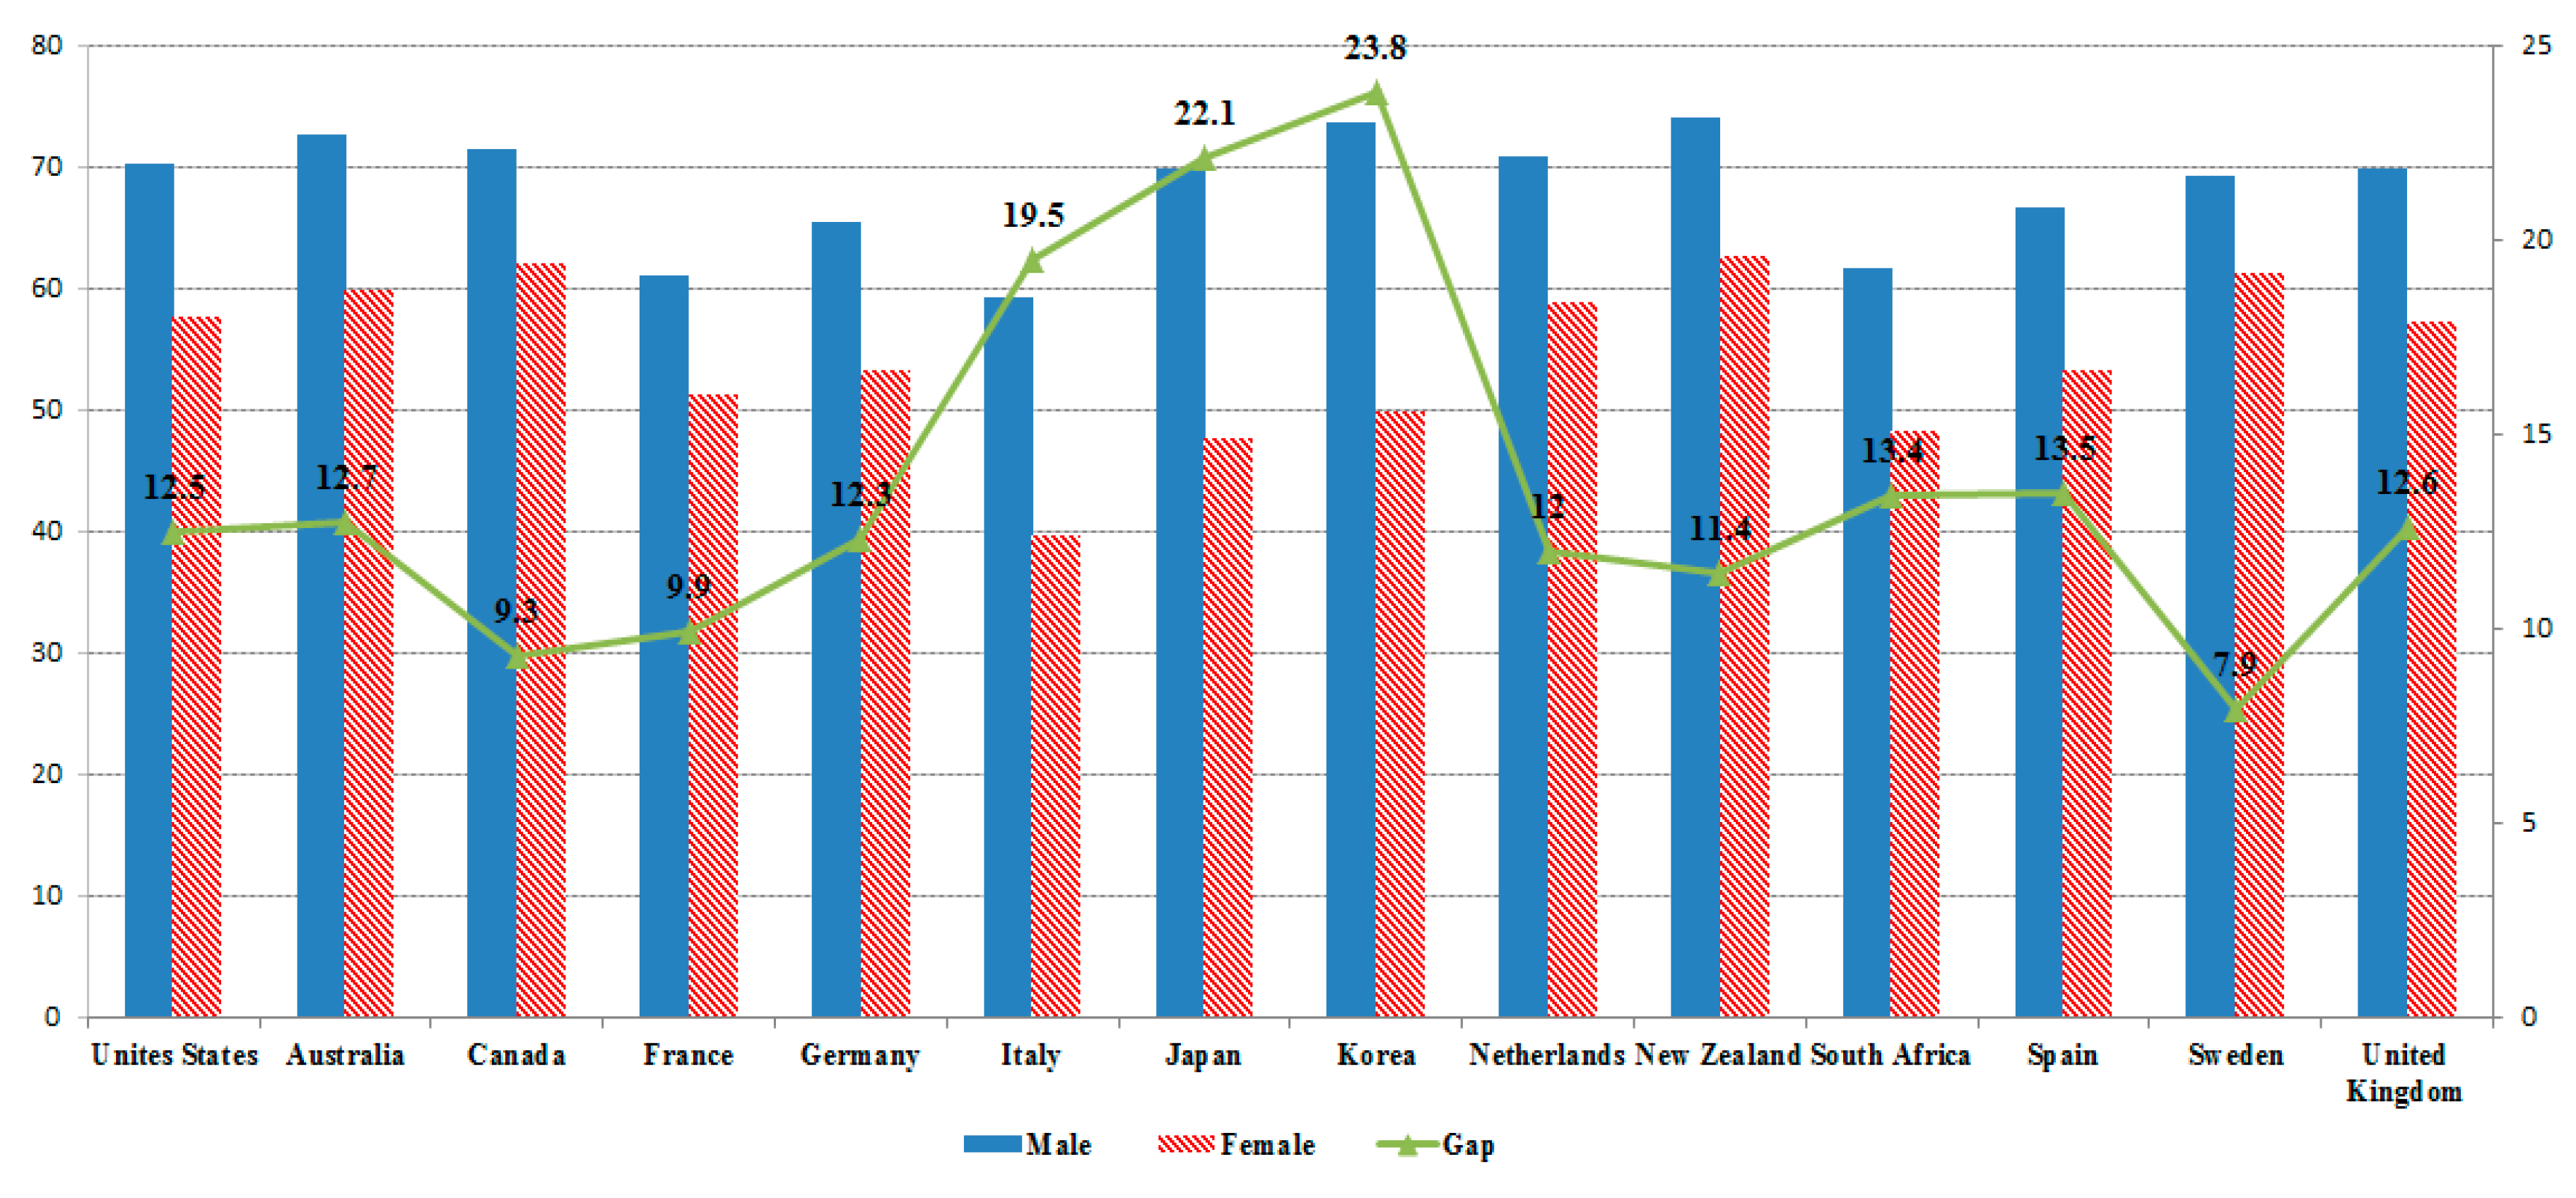
Figure 1 presents the economic activity participation rate and gap by gender in major OECD countries. The male economic activity participation rate in South Korea was 49.9% in 2012, which is rather low compared with other OECD countries, such as the US with 57.7%, the UK with 57.2%, and Canada with 62.1%. On the other hand, the gender gap in economic activity participation rate in South Korea was 23.8% p (point) in 2012, which is rather high compared with other OECD countries, such as the US with 12.5%p, the UK with 12.6%p, and Japan with 22.1%p. As such, South Korea has a rather low female economic activity participation rate and a rather high gender gap in the economic activity participation rate compared with other countries.
Figure 1.
Labor force participation rates by gender, 2012 (unit: %); Source: Bureau of Labor Statistics (BLS), International Comparisons of Annual Labor Force Statistics, 1970–2012 [
11]; Note: This graph was reconstructed by the authors for the purpose of this research using statistics from the BLS in the U.S.
If the gender distribution is the same in each labor market under a stratified labor market, then the stratified labor market may affect the gap in the working conditions between workers, but does not aggravate the gender gap. In this situation, gender equality policies do not have to focus on the stratified structure of the labor market. However, if the gender distribution is not the same in each labor market and gaps exist in the working conditions, then the stratified labor market should be the major consideration in gender equality policies.
This study attempts to analyze how the mobility between labor markets varies between genders through analysis of the entire South Korean labor market including the unemployed and non-economically active populations. The study also investigates the gender gaps in employment and working conditions under the stratified labor market (Several attempts have been made to model labor mobility using transition matrices constructed from probabilities of actual movements by the same individuals across distinct labor market states [
12,
13,
14,
15,
16]). Prior studies have focused on the analysis of gender gaps in working conditions and employment or gaps in the working conditions of workers, rather than gender gaps under the stratified structure of the labor market. This study will comprehensively conduct an analysis by considering the gender gaps and the stratified structure of the labor market. More specifically, the study will classify the entire South Korean labor market into segments according to gender, firm size, and employment type by utilizing data (August 2005–August 2014) from the supplementary Survey on Economically Active Population of the Korea National Statistical Office and the Korean Labor & Income Panel Study (KLIPS) data (2003–2012) from the Korea Labor Institute. In other words, this study will classify the entire Korean labor market into the employed, the unemployed, and the non-economically active population. More specifically, the employed will be segmented into paid and non-paid workers and divided into four cohorts in terms of firm size (large/SMEs) and employment type (standard/non-standard) as follows: Large and Standard workers, Large and Non-standard workers, Small–medium and Standard workers, and Small–medium and Non-standard workers. The changes in gender distribution within the core and peripheral labor markets and the gaps in working conditions, such as wage, social insurance coverage, and fringe benefits, are also evaluated using a long-term time series. In addition, it is important to study how the economic activity state of individuals or labor mobility is changing over time to resolve the problems in the dual labor market structure. Therefore, this study will examine how the labor mobility of individuals is changing over time and the factors that determine the labor mobility are constructed using long-term panel data.
Empirical analysis of the study will be performed in three directions. First, the study will check the skewness of the gender employment distribution for each cohort in the stratified structure of the labor market. Second, the study will examine through the related tracking time series data how workers belonging to each cohort settle into the corresponding cohort and move to other cohorts. This analysis will be performed focusing on gender mobility between cohorts. Third, there will be an examination of what changes in the trends these situations display on the long-term time series. The results of this analysis are expected to be able to serve as an important basis to improving the accessibility and effectiveness of labor market policies in order to resolve the labor market segmentation in South Korea.
The remainder of the study is organized as follows.
Section 2 describes the South Korean labor market structure and evaluates the gender gap in working conditions. The methodology and results of transition analysis are presented in
Section 3.1, and the methodology of multi-nominal logit models and the estimation results are explained and discussed in
Section 3.2. Finally,
Section 4 provides conclusions and policy implications.
2. The Korean Labor Market Structure and Gender Difference of Working Conditions
When labor markets are segmented into a primary labor market comprised of jobs and workplaces characterized by high wages, good working conditions, stable employment, good opportunities for human capital accumulation, promotion and promotion opportunities, reasonable compensations for the strength of the commitment to work,
etc.,
versus a secondary labor market comprised of jobs and workplaces characterized by low wages, poor working conditions, the risk of dismissal and unemployment, lack of on-site training opportunities, lack of promotion opportunities, arbitrary compensation schemes,
etc., a disconnect can occur in the mobility between the two markets. Without a disconnect in the mobility between the two markets, workers in the secondary labor market can enter the primary labor market and compete with existing employees in the primary labor market, which will create equilibrium in total compensation between the two markets. However, when the labor market can be segmented into two distinct markets, it is called a dual labor market [
17].
The rapid export-led economic development of Korea from the 1960s to the 1990s created an economic structure focused on large companies [
18]. This economic structure provided relatively high wages, welfare benefits, and job security for members of the internal group as well as a strong internal labor market for large companies. In the aftermath of the Asian IMF financial crisis in 1997, many South Korean firms pursued structural downsizing and changed their corporate strategy to reduce short term costs with the goal of minimizing labor costs, reducing redundant labor forces, and squeezing out profits [
19,
20,
21]. The crisis reinforced the shift away from regular employment. Thus, overall labor market flexibility was achieved through an increasing degree of stratification in the labor market. The regular workers with high employment protection were supplemented by a large group of temporary and daily workers, whose numbers could be easily adjusted in line with changing economic conditions.
During the 2000s, after the 1997 economic crisis, the dual labor market structure was fixed, and there has been little change since the South Korean economy recovered [
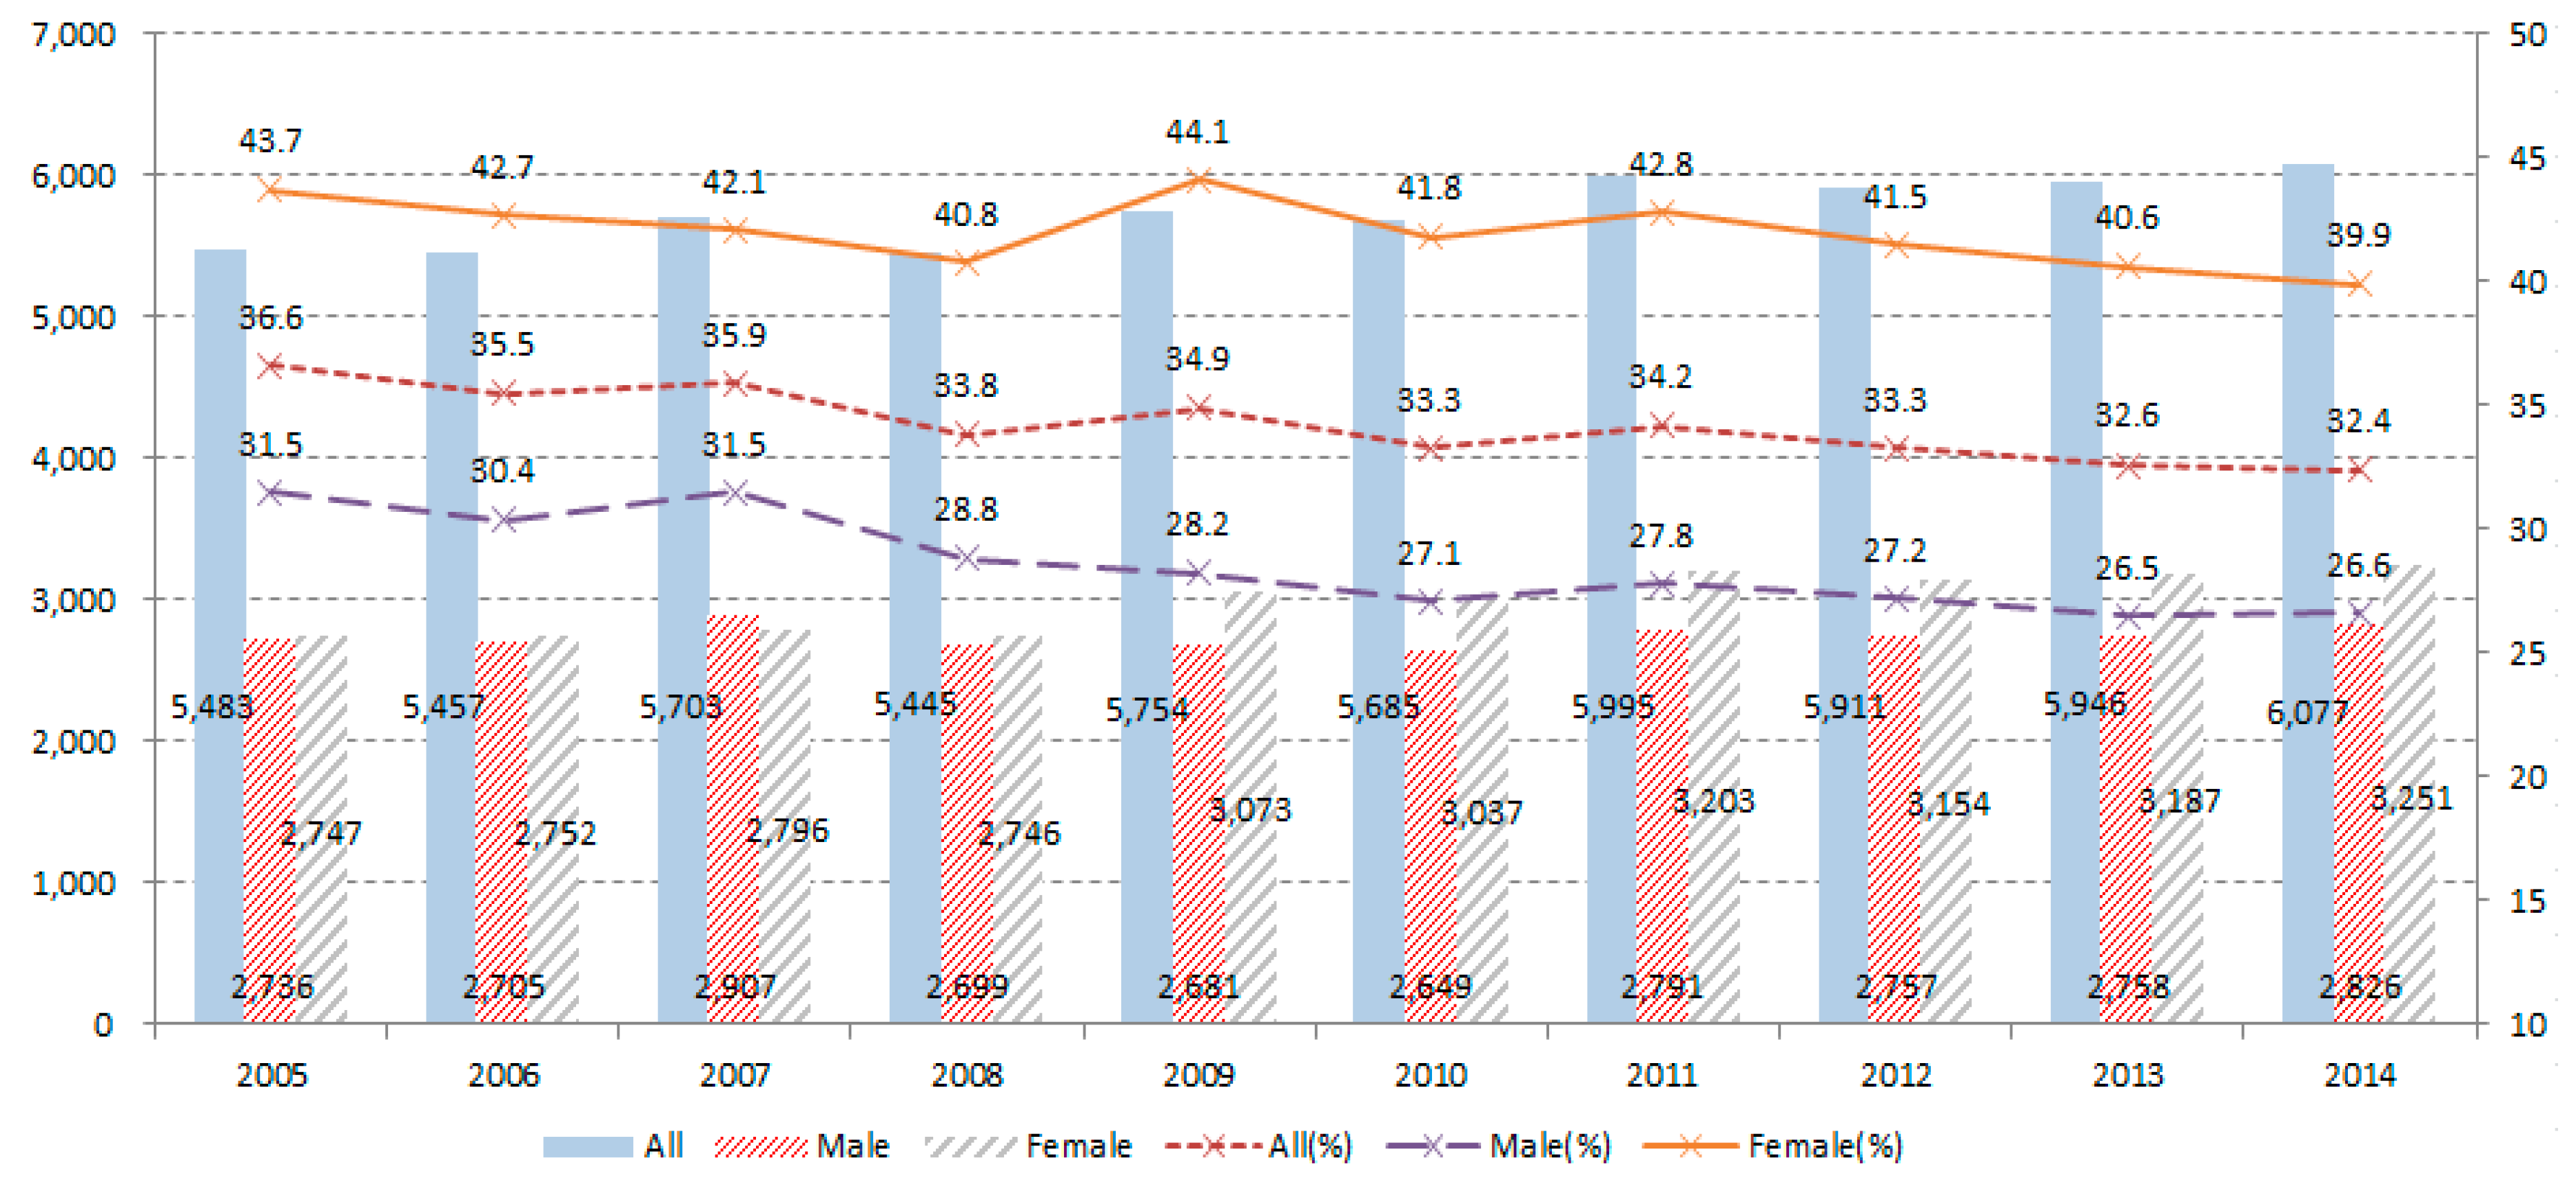
20]. For example, according to the Labor Force Population Additional Survey of the Korean National Statistical Office, the proportion of regular to irregular workers has barely changed between 2005 and 2014. The proportion of regular workers remained at 63%–67%, while that of non-standard workers remained at 33%–36% (Non-standard employment includes (1) temporary workers, (2) part-time workers, and (3) non-regular workers. Temporary workers include fixed-term workers and non-fixed-term workers. Fixed-term workers are workers that are subject to fixed labor contract periods and non-fixed-term workers are workers who are not subject to fixed labor contract periods, but can continue to work through repeated renewal of the contract as well as those who cannot be expected to continue working for involuntary reasons. Part-time workers are those that are supposed to work less than 36 hours per week. Non-regular workers include dispatched workers (the employer that pays the wages under the employment relationship and the user of the labor are not the same), service workers (jobs in which workers are employed by a service company and work for other companies that sign a service contract with the service company), special-type workers (determine the method for providing services, work on their own, jobs in which the workers are paid for the work they do after providing goods and services to customers through operations such as personal recruiting, sales, delivery, transportation services), domestic workers, and daily workers). Furthermore, as can be seen in
Figure 2, the proportion of irregular workers among female workers was approximately 1.5 times greater than that among male workers, and the difference between them has changed little.
Prior to analysis, the structural features of the South Korean labor market will be outlined using the 2005–2014 supplementary surveys on the economically active population conducted by the National Statistical Office. In general, the imperfect functioning and dual structuring of labor markets are attributed to gender or racial discrimination, differences in human capital, differences in the ability to pay, or the characteristics of businesses, such as firm size,
etc. In this context, this study will classify the entire labor market into the employed, the unemployed, and the non-economically active population and will segment the employed into paid and non-paid workers. This group will then examine the distribution. In addition, this study will empirically address the interrelationship between the dual structure of the labor market and working conditions by classifying the labor markets in terms of firm size (large/SMEs) and employment type (standard/non-standard), and then compare the gender gaps in working conditions, such as the wages, social insurance coverage, and fringe benefits for each group (The firm size and employment types significantly affect the structure of the labor market. First, firm size has a close relationship with the market power of the corporate product market. Assuming all other conditions are equal, the larger the enterprise is, the greater the likelihood that it will exercise monopolistic power in the product market. Dominant power in the product market in the case of a large enterprise is reflected in the form of monopoly power in the contract/subcontract relations with small and medium enterprises, imposing lower prices on small and medium enterprises. As reported by existing studies, market power in the product market heightens the possibility of trade union formation. The influential power of those kinds of large enterprise unions may—coupled with the market power—affect the management and labor-management relations of small and medium enterprises. Accordingly, a close correlation exists between the distribution of firm sizes and the competitive structure of the labor market [
20]). Thus, the large and standard paid worker group, which is deemed to be the core labor market, is defined as the primary labor market and the remaining paid worker group is defined as the secondary labor market. Lastly, the unemployed and non-economically active population group is defined as a sort of peripheral labor market.
Figure 2.
The ratio of non-standard workers by gender (units: thousands; %); Source: National Statistical Office, supplementary surveys on the economically active population (August 2005–August 2014) [
22]; Note: This graph was reconstructed by the authors for the purpose of this research.
Figure 2.
The ratio of non-standard workers by gender (units: thousands; %); Source: National Statistical Office, supplementary surveys on the economically active population (August 2005–August 2014) [
22]; Note: This graph was reconstructed by the authors for the purpose of this research.
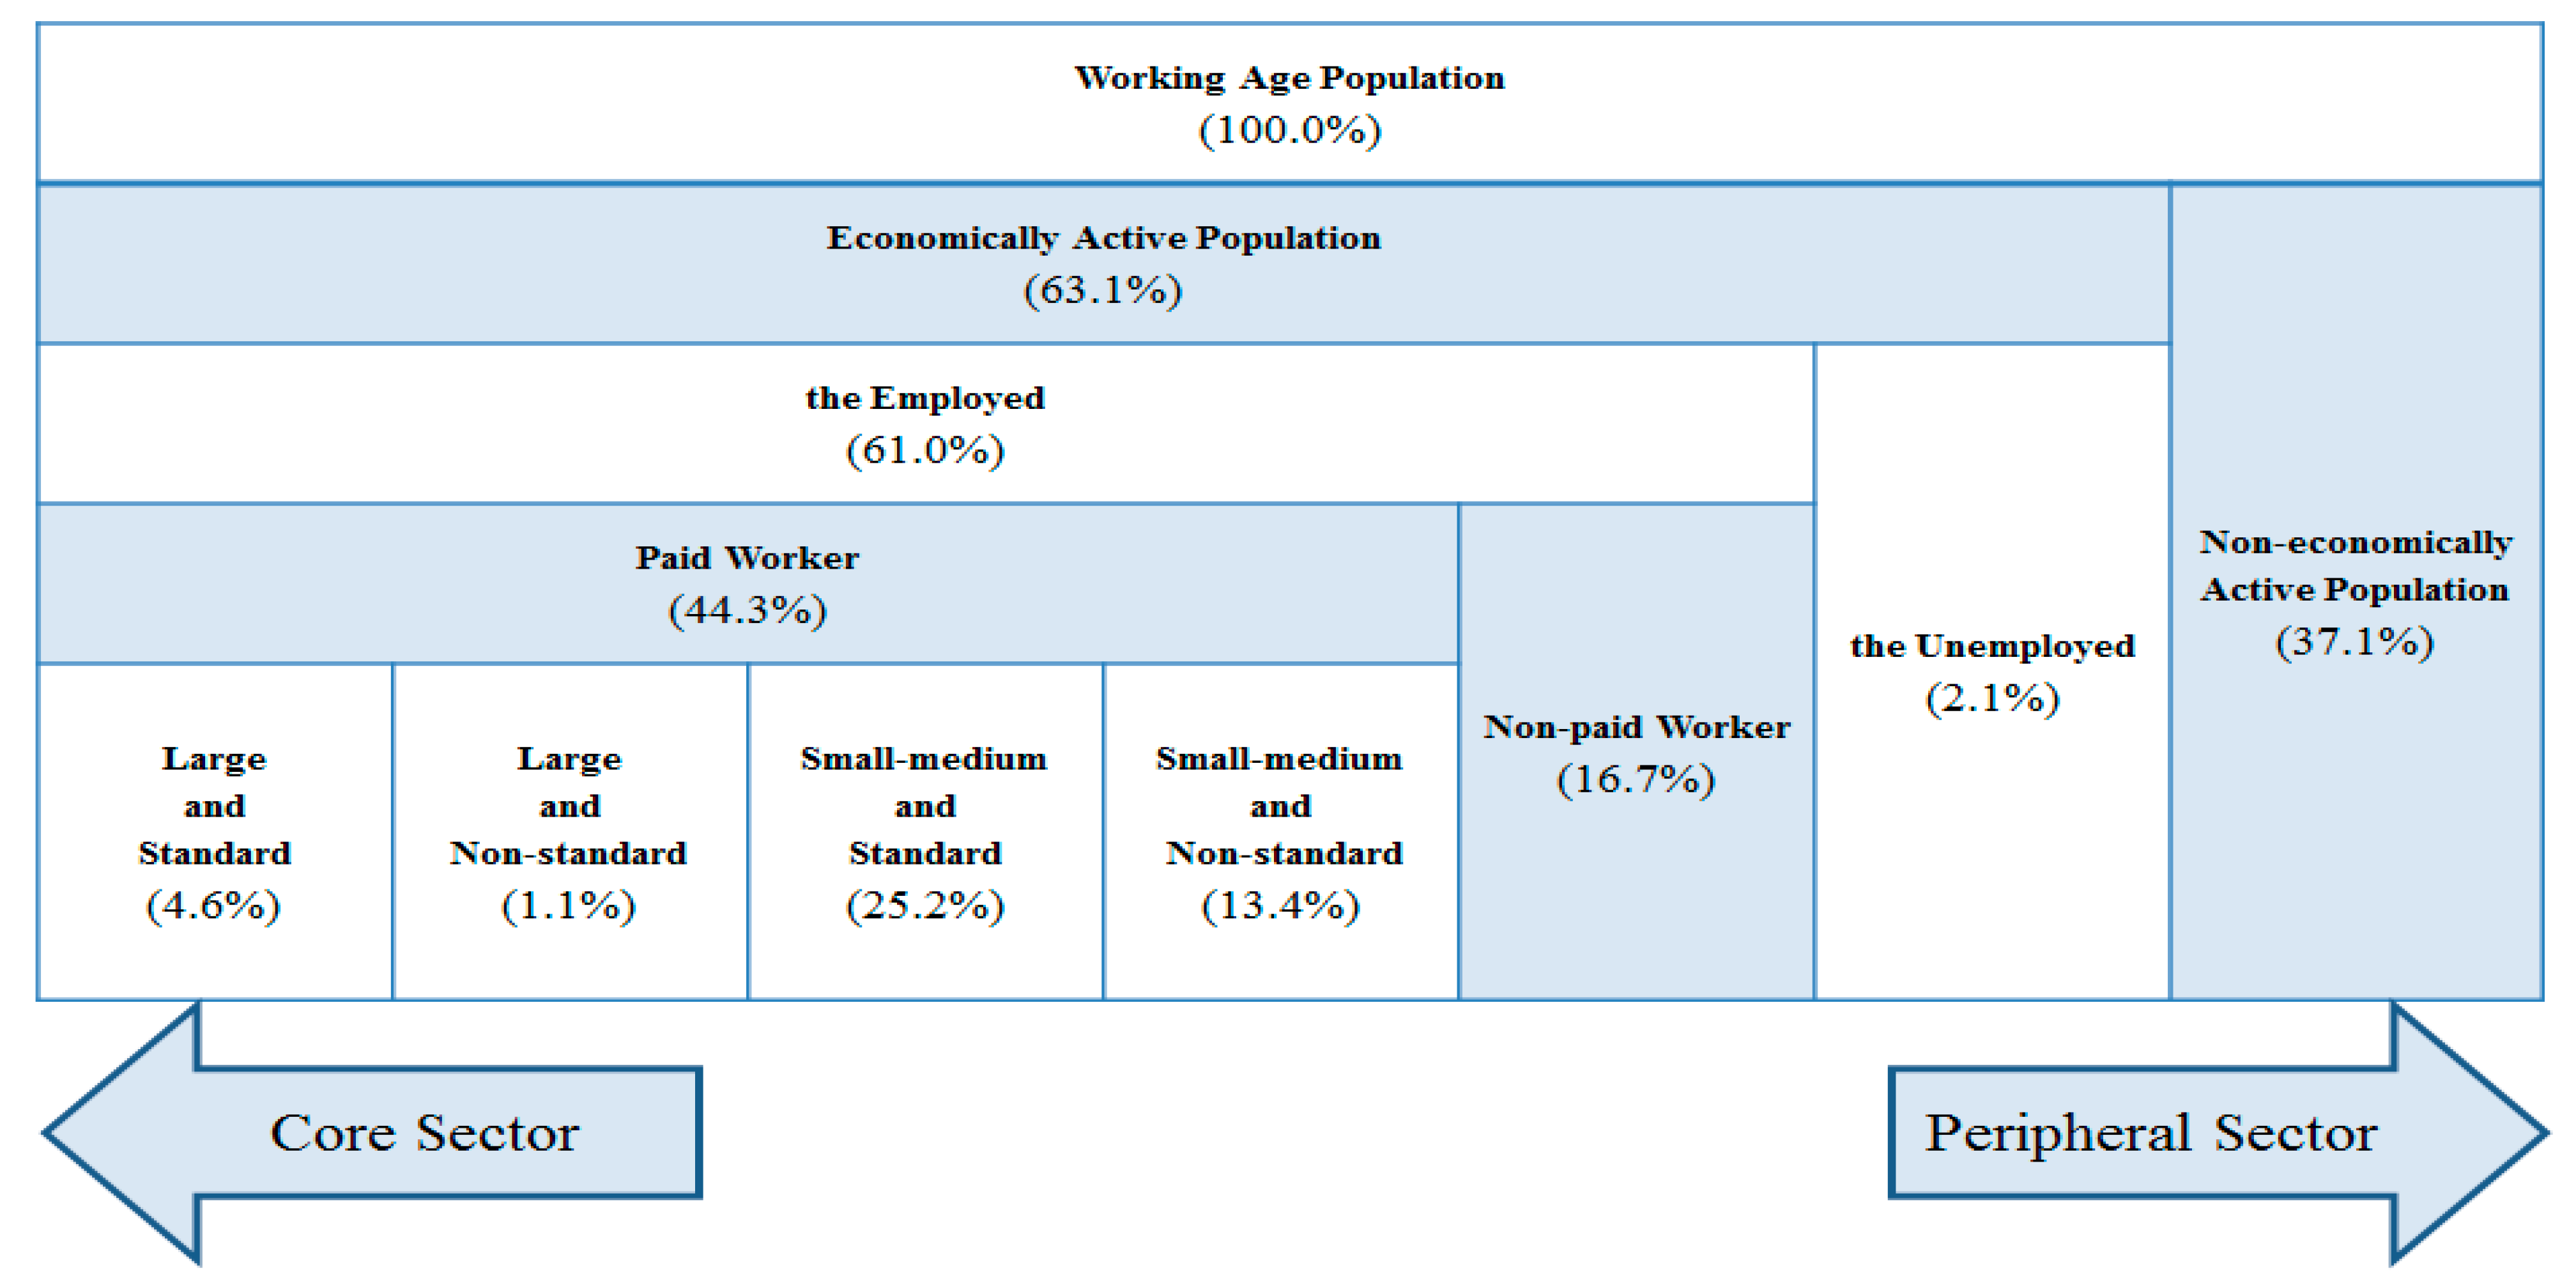
Figure 3 is a summary sketch of the structure of the South Korean labor market, based on supplementary surveys on the economically active population (August 2014). First, out of the entire productive population of 42,571,000 people, approximately 63.1% (26,862,000 people) were shown to be economically active and approximately 37.1% (10,467,000 people) were shown to be non-economically active. In addition, in the economically active population, the employed accounted for 61% and the unemployed accounted for 2.1%. In the employed group, paid workers accounted for 44.3% and non-paid workers accounted for 16.7%. Examining the group in more detail by classifying paid employment into large and standard employment, large and non-standard employment, small–medium and standard employment, small–medium and non-standard employment, approximately 4.6% of workers (1,937,000 people) were distributed in the large and standard employment category of the primary labor market as the core labor market. Approximately 13.4% (5,708,000 people) were distributed in the small–medium and non-standard employment as the most peripheral labor market. Therefore, the South Korean population in the peripheral labor market is triple the number in the core labor market. Furthermore, it can be seen that only a very small proportion of the entire productive population is distributed in the large and standard employment market, which can be classified as the core labor market.
Figure 3.
The stratified structure of the South Korean labor market (2014); Source: National Statistical Office, supplementary surveys on the economically active population (August 2014) [
22]; Note: This figure was reconstructed by the authors for the purpose of this research.
Figure 3.
The stratified structure of the South Korean labor market (2014); Source: National Statistical Office, supplementary surveys on the economically active population (August 2014) [
22]; Note: This figure was reconstructed by the authors for the purpose of this research.
Table 2 shows the changing trends of the South Korean labor market structure for the most recent 10 years from 2005 to 2014, segmented by gender. According to the results, the number and proportion of men in the paid worker group was larger in the large and standard labor market or the core labor market than those of women since 2005. That is, the number of men increased by 278,000 in 2014 compared with the number in 2005, whereas the number of women increased by less than half the male rate at 134,000. However, in the small–medium and non-standard employment market or the most peripheral labor market, the number of men increased slightly by 89,000 while the number of women increased significantly by 511,000. The proportion of men decreased from 6.6% to 6.1%, whereas the proportion of women increased from 6.7% to 7.3%. Women were found to be greater in number and ratio in the peripheral labor market, unlike in the core labor market (This study examined the gender proportion by classifying the entire productive population into the employed (paid workers, non-paid workers), the unemployed and the non-economically active population. If the gender proportion is examined for only wageworkers, the centralization of women in the peripheral labor market is expected to be much larger. For example, according to the study by Kim [
23] that analyzed the proportion of non-regular workers in Korea for the period from 2005 to 2013, the total proportion of non-regular workers is declining. The phenomenon is reported to be caused especially by the decrease in temporary workers. In addition, from the analysis by gender, the number of women in the non-regular workforce is higher than men. Although both groups showed a decreasing trend in the proportion of non-regular workers for the period from 2005 to 2013, men showed a decrease of 5% from 31.5% to 26.5% for the period, whereas women showed a decrease of 3.1% from 43.7%% to 40.6%, which was relatively lower).
Within the peripheral labor market segmented into the unemployed and non-economically active population in addition to paid workers, the proportion of women is apparently increasing in size and ratio, unlike that of men. More specifically, it can be seen that the male unemployed decreased from 550,000 in 2005 to 539,000 in 2014 (1.4% → 1.3%), whereas the female unemployed increased from 292,000 in 2005 to 351,000 in 2014 (0.8% → 0.8%). In addition, non-economically active men increased from 4,802,000 in 2005 to 5,330,000 in 2014 while the non-economically active women increased from 9,936,000 in 2005 to 10,467,000 in 2014. Although the increase in the non-economically active population is similar for both males and females, the problem is that the number of non-economically active women is double that of men and the gap remains over time without decreasing. That is, the biggest problem in the South Korean labor market is that the number of women who enter the core labor market is conspicuously small. Furthermore, the number of women who fall into the secondary and tertiary markets is conspicuously large.
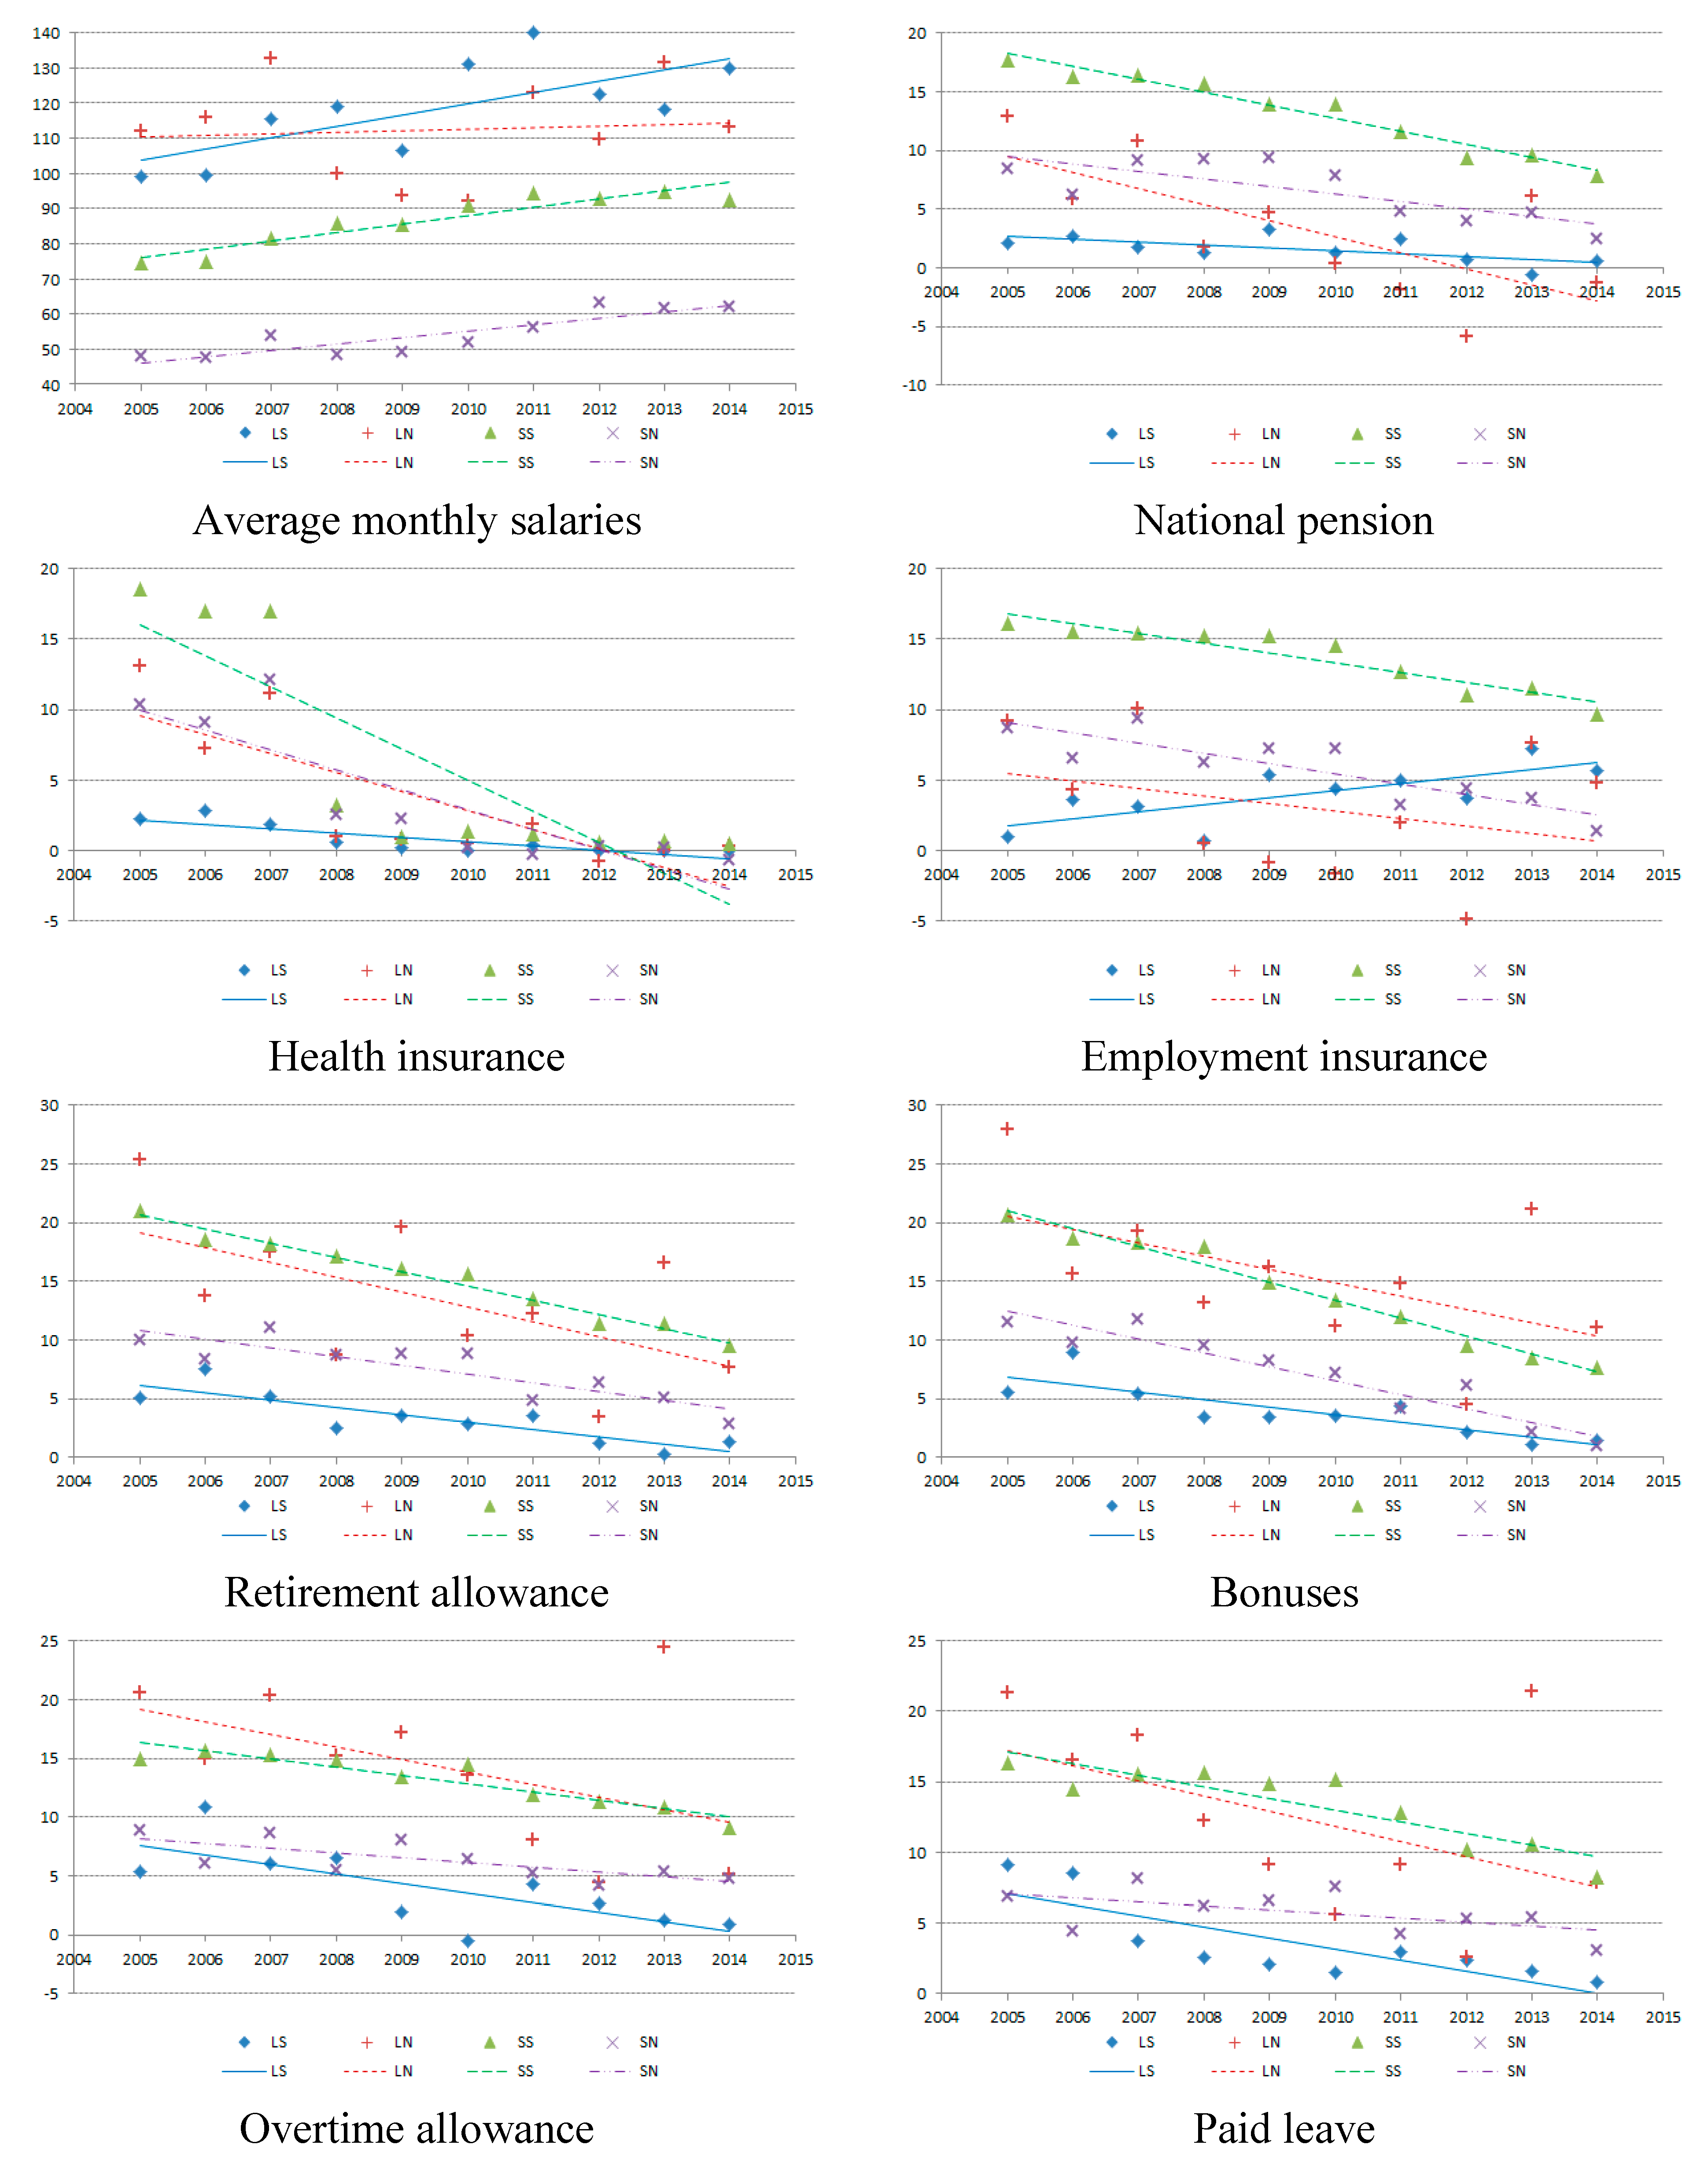
Figure 4 shows the gender gap analysis results of working conditions (wage, social insurance coverage, and fringe benefits coverage) for each labor market, with the entire labor market classified into four segments in terms of firm size and employment type and including only for the paid workers in the entire employed category. From the analysis results, as expected, men received higher wages, higher social insurance coverage and higher fringe benefits than women in almost all labor markets. More specifically, wage gaps between genders appeared to increase over time in almost all labor markets. That is, the wage gaps between genders increased over time in large and non-standard employment (LN), small–medium and standard employment (SS), and small–medium and non-standard employment (SN), but not in large and standard employment (LS).
Gaps in social insurance between the genders shrunk in almost all labor markets, such as the national pension, health insurance, unemployment insurance, etc., in contrast to wages. Especially, in health insurance, the coverage gaps between genders have been shrinking rapidly since 2005, and there has been little difference since 2011. However, in unemployment insurance, the coverage gap has been increasing in the large and standard employment labor market. For fringe benefits, such as retirement allowance, bonuses, overtime allowance, and paid leave, as with social insurance, the coverage gender gap has been shrinking over time.
Summarizing the analysis results, the wage gap between genders showed an increasing trend in almost all labor markets, whereas gender gaps in social insurance coverage and fringe benefits, as with social insurance, has been shrinking over time in almost all labor markets. However, in the small–medium and standard employment and the small–medium and non-standard employment labor markets in which women were relatively better represented, the coverage gender gaps are still considerable in social insurance coverage and fringe benefits.
Table 1 and
Figure 4 show an image of the South Korean labor market structure. The percentage of workers free from these market rules is 3.4%. This segment receives superposed protection based on the product market power, monopolistic supply of the labor force, and legal regulations. There are high entry barriers to this group as a result and the insiders enjoy high salaries and fringe benefits. If we consider the difference in wage and working conditions and the level of social security, it is possible to understand the market structure according to the insider–outsider models. In other words, the South Korean labor market features a multi-level dual structure in the large-standard structure, which ensures that persuasive power insiders of that labor market will be a small group of workers that comprise an extremely low ratio of all workers [
20,
21].
Table 1.
Stratified structure of the South Korean labor market (trends) (units: thousands; %).
Table 1.
Stratified structure of the South Korean labor market (trends) (units: thousands; %).
| Economic Activity State | Working Age Population | Total |
|---|
| Economically Active Population | Non-economically Active Population |
|---|
| Employed | Unemployed |
|---|
| Paid Worker | Non-paid Worker |
|---|
| Large and Standard | Large and Non-standard | Small–medium and Standard | Small–medium and Non-standard |
|---|
| Gender | Male | Female | Male | Female | Male | Female | Male | Female | Male | Female | Male | Female | Male | Female |
|---|
| Year | |
|---|
| 2005 | 1170 | 355 | 218 | 157 | 4777 | 3185 | 2518 | 2590 | 4649 | 3230 | 550 | 292 | 4802 | 9936 | 38,42 |
| (3.0) | (0.9) | (0.6) | (0.4) | (12.4) | (8.3) | (6.6) | (6.7) | (12.1) | (8.4) | (1.4) | (0.8) | (12.5) | (25.9) | (100.0) |
| 2006 | 1126 | 346 | 209 | 160 | 5078 | 3345 | 2496 | 2592 | 4596 | 3217 | 506 | 301 | 4,891 | 9972 | 38,835 |
| (2.9) | (0.9) | (0.5) | (0.4) | (13.1) | (8.6) | (6.4) | (6.7) | (11.8) | (8.3) | (1.3) | (0.8) | (12.6) | (25.7) | (100.0) |
| 2007 | 1117 | 359 | 216 | 142 | 5211 | 3492 | 2691 | 2654 | 4440 | 3135 | 501 | 255 | 4942 | 10,076 | 39,232 |
| (2.9) | (0.9) | (0.6) | (0.4) | (13.3) | (8.9) | (6.9) | (6.8) | (11.3) | (8.0) | (1.3) | (0.7) | (12.6) | (25.7) | (100.0) |
| 2008 | 1162 | 370 | 184 | 136 | 5505 | 3622 | 2515 | 2609 | 4414 | 3099 | 508 | 255 | 5068 | 10,209 | 39,657 |
| (2.9) | (0.9) | (0.5) | (0.3) | (13.9) | (9.1) | (6.3) | (6.6) | (11.1) | (7.8) | (1.3) | (0.6) | (12.8) | (25.7) | (100.0) |
| 2009 | 1278 | 381 | 183 | 160 | 5555 | 3511 | 2499 | 2912 | 4273 | 2868 | 606 | 299 | 5244 | 10,399 | 40,168 |
| (3.2) | (1.0) | (0.5) | (0.4) | (13.8) | (8.7) | (6.2) | (7.3) | (10.6) | (7.1) | (1.5) | (0.7) | (13.1) | (25.9) | (100.0) |
| 2010 | 1223 | 408 | 141 | 156 | 5911 | 3821 | 2508 | 2880 | 4223 | 2735 | 523 | 308 | 5351 | 10,464 | 40,651 |
| (3.0) | (1.0) | (0.4) | (0.4) | (14.5) | (9.4) | (6.2) | (7.1) | (10.4) | (6.7) | (1.3) | (0.8) | (13.2) | (25.7) | (100.0) |
| 2011 | 1207 | 419 | 176 | 162 | 6035 | 3854 | 2616 | 3042 | 4239 | 2746 | 486 | 276 | 5350 | 10,512 | 41,119 |
| (2.9) | (1.0) | (0.4) | (0.4) | (14.7) | (9.4) | (6.4) | (7.4) | (10.3) | (6.7) | (1.2) | (0.7) | (13.0) | (25.6) | (100.0) |
| 2012 | 1338 | 439 | 177 | 129 | 6039 | 4007 | 2580 | 3026 | 4363 | 2762 | 474 | 290 | 5393 | 10,649 | 41,664 |
| (3.2) | (1.1) | (0.4) | (0.3) | (14.5) | (9.6) | (6.2) | (7.3) | (10.5) | (6.6) | (1.1) | (0.7) | (12.9) | (25.6) | (100.0) |
| 2013 | 1399 | 458 | 182 | 151 | 6235 | 4203 | 2576 | 3037 | 4272 | 2779 | 498 | 285 | 5458 | 10,636 | 42,168 |
| (3.3) | (1.1) | (0.4) | (0.4) | (14.8) | (10.0) | (6.1) | (7.2) | (10.1) | (6.6) | (1.2) | (0.7) | (12.9) | (25.2) | (100.0) |
| 2014 | 1448 | 489 | 219 | 151 | 6361 | 4401 | 2607 | 3101 | 4323 | 2785 | 539 | 351 | 5330 | 10,467 | 42,571 |
| (3.4) | (1.2) | (0.5) | (0.4) | (14.9) | (10.3) | (6.1) | (7.3) | (10.2) | (6.5) | (1.3) | (0.8) | (12.5) | (24.6) | (100.0) |
Figure 4.
Gender gap in working conditions by division in the South Korean labor market (units: 10,000
won; %); Source: National Statistical Office, and supplementary surveys on the economically active population (August 2005–2014) [
22]; Notes: (1) LS (Large and Standard worker), LN (Large and Non-standard worker), SS (Small–medium and Standard worker), SN (Small–medium and Non-standard worker). (2) This table was reconstructed by the authors for the purpose of this research.
3. Labor Mobility Analysis in Korean Labor Market
3.1. Transition Analysis
Since the supplementary surveys on the economically active population of the National Statistical Office consist of cross-sectional data, it is possible to calculate the number and proportion of workers in a given year and to compare the long-term time-series trends while estimating individuals' economic activities. However, the drawback is that it is impossible to observe how the economic activity state of individuals or the labor mobility changes over time. Thus, it is necessary to utilize panel data to examine how the economic activity state of individuals or labor mobility develops in the dual-structured South Korean labor market in order to complement the drawback. The analysis was conducted after constructing a balanced panel utilizing the Korean Labor and Income Panel Study (KLIPS) 6th–15th (2003–2012) data from the Korea Labor Institute in order to review how the economic activity state change or labor mobility by gender progresses in the stratified labor market of Korea (The Korean Labor and Income Panel Study (KLIPS), conducted by the Koran Labor Institute, was designed to provide researchers and policy-makers with an empirical foundation for analyzing the dynamic aspects of the Korean labor market. Begun in 1998, the KLIPS provides longitudinal data concerning representative samples of Korean individuals and the family units in which they reside. The KLIPS sample is an equal probability sample of households from seven metropolitan and urban areas in eight provinces. The original number of household samples was 5000, and a total of 13,317 individuals were interviewed in 1998. More than 70% of the original sample was included in subsequent follow-up surveys. The individuals in the sample represent a variety of industry affiliations, from manufacturing to public services).
The use of micro panel data and multi-state stochastic models has led to a change of theories in the empirical labor market literature. In particular, the individual labor market transitions between different labor market states are now traceable through Markov chain models [
24,
25] (Labor status mobility can be considered a process in which changes in states occur randomly through time, and the probability of transitions between particular states are governed by Markov transition matrices [
25]). Markov chain models enable the estimation of transition probabilities when the subjects are observed only at discrete time points, and hence, exact transition dates are not available.
A Markov chain is defined as a sequence of random variables
xn (
n = 0, 1, 2, …), where
xn represents values in a finite space A, together with a transition kernel
that defines the probability that
xn equals a particular value given a previous value
xn-j. We consider a Markov chain with this property as follows.
So that the distribution of
xn+1 given the past is completely determined only by the preceding value
xn. The transition kernel is a transition matrix
T with the following element.
Informally, this is the probability of transition from
x to
y. For a finite-state Markov chain, the set
A of the value (or state) that
xn may assume is finite with, say,
m elements. Then,
where
,
x = 1, …,
m.
The T matrix can be estimated by the maximum likelihood estimator for txy = Nxy/Nx, where Nxy is the number of transitions from state x to y and Nx is the number of transitions out of state x.
For our specific purposes, we consider xn to denote the labor market state of a given individual at time n. We define the state space A to consist of six labor market states: Large and Standard worker (Cohort 1; LS), Large and Non-standard worker (Cohort 2; LN), Small–medium and Standard worker (Cohort 3; SS), Small–medium and Non-standard worker (Cohort 4; SN), Non-paid worker (Cohort 5; NW), and the Unemployed and Non-economically active population (Cohort 6; UN).
In the following analysis, we estimate the T-matrix of raw transition probabilities for 2003–2006, 2003–2009, and 2003–2012. That is, we construct three different T-matrices for three, six and nine year transitions. In this way, we are able to compare transition tendencies across different time spans.
Table 2 through
Table 4 show the results of the gender-specific analysis on transitions over time in the labor market and the economic state to which the individuals belong.
Table 2,
Table 3 and
Table 4 show the changes after three years, six years, and nine years, respectively. First, looking at the state changes of the wage workers after three years (
Table 2), the likelihood of workers in the large and standard employment market remaining in the same category was 61.1%. The likelihood was 45.5% for those in the large and non-standard employment market, 65.5% in the small–medium and standard employment market and 55.6% in the small–medium and non-standard employment market. State changes and the labor mobility ratio were larger in SMEs than in large companies and were also larger in non-standard employment than in standard employment. In addition, the proportion of workers that remained in non-paid positions was 90.6% and the proportion that remained unemployed was 87.4%. Furthermore, it can be seen that the proportion of unpaid workers that transition to paid employment is relatively very low.
Comparing the entire sample by gender, the proportion of workers in the large and standard employment market that remained in the same category after 3 years was 62.6% of men and 58.7% of women. In the large and non-standard employment market, 43.6% of men and 46.8% of women continued working in the same market after three years, 72.3% of men and 60.7% of women remained in the existing small–medium and standard employment market while 59.5% of men and 51.8% of women remained in the existing small–medium and non-standard employment market. In addition, 91.8% of men and 89.0% of women in existing non-paid worker position remained non-paid while 79.0% of men and 90.0% of women that were unemployed remained so after three years (An explanation for the gender gap in unemployment rates may be related to labor market institutions. Institutions that compress wages (like minimum wages or trade unions) or act to the disadvantage of groups with lower levels of labor market attachment (like firing costs and the widespread use of temporary contracts) may magnify the impact of human capital differences on unemployment rates. As the overall level of unemployment is high in many European countries, employers may have long queues of workers for jobs, and this acts to the disadvantage of women, as it makes it easier to indulge in any residual prejudice against women [
26]).
Table 2.
Transition probability by Markov chain process (), 2003–2006 (%).
Table 2.
Transition probability by Markov chain process (), 2003–2006 (%).
| T State | T + 1 State |
| All | LS | LN | SS | SN | NW | UN |
| LS | 61.17 | 5.45 | 16.94 | 2.70 | 3.49 | 10.26 |
| LN | 13.81 | 45.52 | 2.49 | 17.41 | 4.98 | 15.80 |
| SS | 15.34 | 2.24 | 68.54 | 4.64 | 2.98 | 6.25 |
| SN | 3.99 | 15.08 | 6.33 | 55.63 | 3.99 | 14.99 |
| NW | 1.19 | 1.04 | 0.48 | 0.99 | 90.60 | 5.71 |
| UN | 3.10 | 2.44 | 2.03 | 2.71 | 2.23 | 87.49 |
| Total | 11.75 | 5.21 | 13.87 | 6.72 | 22.43 | 40.01 |
| Male | LS | LN | SS | SN | NW | UN |
| LS | 62.66 | 4.14 | 19.59 | 2.47 | 4.06 | 7.09 |
| LN | 16.27 | 43.67 | 3.31 | 20.18 | 4.82 | 11.75 |
| SS | 15.75 | 1.86 | 72.33 | 3.44 | 2.19 | 4.43 |
| SN | 3.68 | 15.76 | 5.95 | 59.54 | 3.50 | 11.56 |
| NW | 1.26 | 0.95 | 0.63 | 0.99 | 91.85 | 4.32 |
| UN | 5.13 | 3.64 | 4.26 | 4.45 | 3.52 | 79.00 |
| Total | 16.11 | 5.12 | 21.68 | 7.60 | 28.40 | 21.08 |
| Female | LS | LN | SS | SN | NW | UN |
| LS | 58.77 | 7.55 | 12.68 | 3.07 | 2.56 | 15.36 |
| LN | 12.08 | 46.82 | 1.91 | 15.47 | 5.08 | 18.64 |
| SS | 14.51 | 3.04 | 60.74 | 7.09 | 4.61 | 10.01 |
| SN | 4.29 | 14.41 | 6.69 | 51.80 | 4.46 | 18.35 |
| NW | 1.09 | 1.15 | 0.29 | 0.98 | 89.02 | 7.48 |
| UN | 2.51 | 2.08 | 1.37 | 2.19 | 1.85 | 90.00 |
| Total | 8.32 | 5.29 | 7.72 | 6.03 | 17.72 | 54.93 |
A similar pattern was observed in state changes after six years (
Table 3). More specifically, the proportion of workers that stayed in the large and standard employment market was 60.8%. Those that continued working in the large and non-standard employment market comprised 44.8%; 73.7% remained in the small–medium and standard employment market, and 59.6% remained in the small–medium and non-standard employment market six years later. Furthermore, the state changes and labor mobility ratio were larger in SMEs than in large companies and were also larger in non-standard employment than in standard employment. In addition, the proportion of workers in that remained in non-paid positions six years later was 91.9% and the proportion that remained unemployed was 87.9%. Thus, the proportion of unpaid workers that transitioned to paid workers was relatively low, and the mobility ratio was lower compared with the changes after three years.
Comparing the entire sample by gender, workers that remained in the large and standard employment market after six years were 61.5% of men and 59.7% of women. Those that remained in the large and non-standard employment market were 42.3% of men and 46.6% of women, 76.9% of men and 67.0% of women continued in the small–medium and standard employment market for six years while 63.6% of men and 55.8% of women remained in the small–medium and non-standard employment market. In addition, the proportion of workers that remained in non-paid positions for six years was 92.3% of men and 89.7% of women. During the same period, 80.9% of men and 90.1% of women remained unemployed. Thus, a persistence phenomenon was observed in which the likelihood of mobility decreased over time compared with the situation after three years.
Table 3.
Transition probability by Markov chain process (), 2003–2009 (%).
Table 3.
Transition probability by Markov chain process (), 2003–2009 (%).
| T State | T + 1 State |
| All | LS | LN | SS | SN | NW | UN |
| LS | 60.85 | 4.11 | 19.75 | 2.57 | 3.32 | 9.40 |
| LN | 8.88 | 44.82 | 3.13 | 23.35 | 4.50 | 15.32 |
| SS | 13.49 | 1.46 | 73.75 | 3.51 | 2.26 | 5.53 |
| SN | 3.09 | 14.54 | 5.64 | 59.68 | 2.92 | 14.13 |
| NW | 1.04 | 0.89 | 0.62 | 0.96 | 91.19 | 5.30 |
| UN | 2.45 | 2.18 | 1.96 | 3.13 | 2.30 | 87.99 |
| Total | 10.70 | 4.97 | 14.47 | 7.56 | 22.44 | 39.87 |
| Male | LS | LN | SS | SN | NW | UN |
| LS | 61.58 | 3.13 | 22.50 | 2.14 | 3.99 | 6.66 |
| LN | 10.27 | 42.30 | 3.78 | 27.43 | 5.00 | 11.22 |
| SS | 13.42 | 1.22 | 76.93 | 2.41 | 2.01 | 4.00 |
| SN | 2.88 | 14.81 | 5.93 | 63.62 | 2.80 | 9.96 |
| NW | 1.08 | 0.83 | 0.81 | 0.95 | 92.32 | 4.01 |
| UN | 3.90 | 2.91 | 3.75 | 4.75 | 3.75 | 80.93 |
| Total | 14.42 | 4.76 | 22.47 | 8.38 | 28.50 | 21.46 |
| Female | LS | LN | SS | SN | NW | UN |
| LS | 59.72 | 5.64 | 15.52 | 3.23 | 2.28 | 13.62 |
| LN | 7.87 | 46.65 | 2.66 | 20.37 | 4.13 | 18.31 |
| SS | 13.64 | 1.98 | 67.01 | 5.83 | 2.76 | 8.77 |
| SN | 3.29 | 14.26 | 5.37 | 55.85 | 3.04 | 18.19 |
| NW | 1.00 | 0.97 | 0.37 | 0.97 | 89.75 | 6.93 |
| UN | 2.01 | 1.95 | 1.41 | 2.63 | 1.85 | 90.14 |
| Total | 7.77 | 5.13 | 8.15 | 6.91 | 17.66 | 54.37 |
The state changes after nine years were also similar to the pattern observed after three and six years (
Table 4). From the results of the analysis, the proportion of workers that stayed in the large and standard employment market for nine years was 60.8%. Those that remained in the large and non-standard employment market comprised 46.6%, 77.0% continued working in the small–medium and standard employment market and 64.2% remained in the existing small–medium and non-standard employment market after nine years. In addition, the proportion of workers that remained in non-paid positions was 91.2% and 88.1% of unemployed individuals remained so after nine years. Thus, the proportion of workers that transitioned from unpaid to paid positions was relatively low, and the mobility ratio was similar to or lower than the situation after six years.
Comparing the entire sample by gender, the proportion of workers that stayed in the large and standard employment market for nine years was 61.1% of men and 60.4% of women. The proportion that remained in the large and non-standard employment market was 44.6% of men and 48.0% of women, 79.4% of men and 72.3% of women remained in the small–medium and standard employment market, while 67.4% of men and 61.2% of women continued working in the small–medium and non-standard employment market after nine years. In addition, the proportion of workers that remained in non-paid positions for nine years was 92.5% of men and 89.6% of women while 82.5% of men and 89.8% of women who were unemployed remained so for nine years. Thus, the results were similar to the situation after six years.
Table 4.
Transition probability by Markov chain process (), 2003–20012 (%).
Table 4.
Transition probability by Markov chain process (), 2003–20012 (%).
| T State | T + 1 State |
| All | LS | LN | SS | SN | NW | UN |
| LS | 60.87 | 3.76 | 21.08 | 2.40 | 3.16 | 8.73 |
| LN | 7.42 | 46.65 | 2.77 | 24.67 | 4.05 | 14.44 |
| SS | 11.55 | 1.11 | 77.08 | 3.30 | 1.87 | 5.08 |
| SN | 2.22 | 12.78 | 4.81 | 64.22 | 2.59 | 13.38 |
| NW | 0.96 | 0.79 | 0.58 | 1.12 | 91.27 | 5.28 |
| UN | 2.00 | 2.10 | 1.92 | 3.61 | 2.25 | 88.12 |
| Total | 9.35 | 4.78 | 15.34 | 8.84 | 22.17 | 39.51 |
| Male | LS | LN | SS | SN | NW | UN |
| LS | 61.14 | 3.00 | 23.84 | 1.93 | 3.89 | 6.20 |
| LN | 8.71 | 44.62 | 3.33 | 28.28 | 4.70 | 10.37 |
| SS | 11.63 | 0.95 | 79.42 | 2.53 | 1.88 | 3.59 |
| SN | 2.07 | 12.63 | 4.95 | 67.44 | 2.64 | 10.28 |
| NW | 1.05 | 0.72 | 0.74 | 1.08 | 92.56 | 3.85 |
| UN | 3.11 | 2.56 | 3.31 | 5.05 | 3.39 | 82.57 |
| Total | 12.49 | 4.45 | 23.28 | 9.46 | 28.36 | 21.97 |
| Female | LS | LN | SS | SN | NW | UN |
| LS | 60.46 | 4.89 | 16.97 | 3.10 | 2.07 | 12.51 |
| LN | 6.53 | 48.06 | 2.38 | 22.16 | 3.60 | 17.27 |
| SS | 11.39 | 1.45 | 72.39 | 4.86 | 1.86 | 8.13 |
| SN | 2.37 | 12.92 | 4.69 | 61.28 | 2.54 | 16.21 |
| NW | 0.85 | 0.87 | 0.39 | 1.16 | 89.63 | 7.12 |
| UN | 1.65 | 1.95 | 1.48 | 3.16 | 1.89 | 89.87 |
| Total | 6.89 | 5.04 | 9.09 | 8.35 | 17.30 | 53.33 |
Summarizing the above analysis results, it can be seen that state changes and labor mobility did not increase, but rather decreased or remained steady over time. These results indicate the state-dependence in the state changes and labor mobility. Comprehensively outlining the differences in the gender analysis results, with the large and standard employment market as the core labor market and SMEs, non-standard, and unemployed categories as the peripheral labor market, it can be seen that men were more likely to stay in the core labor market than in the peripheral labor market. Men were more likely to transition towards the core market rather than the peripheral market if they transitioned. Women were more likely to stay in the peripheral labor market than in the core labor market and to transition to the relatively weak peripheral market when they transitioned. For example, comparing the gender distribution after three years, the distribution of men and women in the large and standard employment market or the core labor market was 16.1% and 8.3%. Men and women had respective distributions of 21.0% and 54.9% in the unemployed group and in the most peripheral labor markets. The results indicate that these trends become more prevalent over time.
3.2. The Incidence of Labor Mobility Analysis
It is of paramount practical and policy-making interest to identify the variables related to the probability of worker transitions. In order to characterize the mobility patterns in more detail, we utilized the multi-nomial logit (MNL) specification to model the labor market transitions. The MNL model offers a statistically rigorous way to predict the probability of each possible transition as a function of individual characteristics.
Formally, a simple MNL model specifies the following.
where
Zi is a case-specific regressor for each individual
i and
Xi, t {0, 1, 2, …,
K} is the labor market state of individual
i at time
t. In order for the MNL model to be identifiable, one outcome
k K is specified as the base or reference group such that
= 0. Thereafter, the parameter vector
is straightforward to estimate using the maximum likelihood estimation (MLE) method.
In this study, we modified the above MNL methodology to be compatible with our specific purposes and comparable to existing studies in other countries. We estimated six simple multinomial logit regressions for each labor market state of departure, namely Large and Standard worker (Cohort 1; LS), Large and Non-standard worker (Cohort 2; LN), Small–medium and Standard worker (Cohort 3; SS), Small–medium and Non-standard worker (Cohort 4; SN), Non-paid worker (Cohort 5; NW), and the Unemployed and Non-economically active population (Cohort 6; UN). For robustness validation, this analysis was repeated for all five samples (i.e., 2003–2006, 2003–2009, and 2003–2012 panels, as was done in the transition analysis section). To this end, the dependent variable in each regression conveyed a different interpretation. The dependent variable was defined as a categorical variable that has a value of 0 if the individual maintains his/her labor market state from 2003 to 2012. Values are assigned from 1 to 5 for each of the five possible outflows. Consider the subsample of individuals who were employed as large firm-standard workers in 2003. The dependent variable has the value “0” if the individual remained a large firm-standard worker in 2012. If the state of the individual changes in 2012, the dependent variable assumes values from 1 to 5 for transitions into large firm and non-standard worker (Cohort 2), small–medium firm and standard worker (Cohort 3), small–medium firm and non-standard worker (Cohort 4), non-paid worker (Cohort 5), and the unemployed and non-economically active population (Cohort 6) states, respectively.
The results of empirical analysis on labor mobility determinants by economic activity state are presented in
Table 5 (The results of empirical analysis on labor mobility determinants after three and six years are presented in
Table A1 and
Table A2 of the
Appendix. Only the signs of the statistically significant variables are displayed in the results Tables. The other demographics associated with individual characteristics also displayed considerable relationships with labor market transitions. Interpretation of the different explanatory variables is omitted in the body to focus on gender differences in labor mobility. To simplify the results of the analysis of other variables, younger and married workers were more likely to move to the core labor marker than older and unmarried workers. In addition, better-educated individuals were more likely to move to the core labor marker than to the peripheral labor market). The results of empirical analysis on labor mobility determinants for the large and standard market workers (Cohort 1–Cohort 4) in the core labor market showed that men were more likely to stay longer in the core labor market than women. Furthermore, women were more likely to move to the peripheral labor market such as the large and non-standard labor market, small–medium and standard labor market, and the unemployed market, rather than to the large and standard labor market or the core labor market. This trend was statistically significant. The results of empirical analysis on labor mobility determinants for the large and non-standard market workers showed that men were more likely to move to the standard employment market, which is deemed the core labor market. The trend was also statistically significant. That is, men in non-standard employment sectors with weak stability even in large companies were highly likely to move to the large and standard employment or small–medium and standard employment markets with relatively good stability. Furthermore, the results of empirical analysis on the labor mobility determinants for small–medium and standard workers showed that men were more likely than women to move to the large and non-standard employment sectors or to the core labor market. The difference was statistically significant. In contrast, women were more likely to move to the large and non-standard labor market, the small–medium and standard labor market, and the unemployed market, which comprise the peripheral labor market. Finally, the results of empirical analysis on labor mobility determinants of small–medium and non-standard workers showed that men were more likely to move to the small–medium and standard employment sector than women, with a statistically significant difference. In addition, women were more likely than men to fall into the unemployed state, which is regarded as the most peripheral labor market. Both men and women in small–medium and non-standard employment markets have difficulty moving to other wageworker categories.
Table 5.
Multi-nomial logit estimation results 2003–2012.
Table 5.
Multi-nomial logit estimation results 2003–2012.
| | Transition out of LS | Transition out of LN |
| LS → LN | LS → SS | LS → SN | LS → NW | LS → UN | LN → LS | LN → SS | LN → SN | LN → NW | LN → UN |
| Gender | −1.279 ** | −0.108 * | 0.443 | 3.225 | −5.920 *** | 2.698 *** | 5.899 *** | 1.206 | 4.563 | −0.539 |
| Age | 0.019 | −0.026 *** | 0.041 *** | 0.036 *** | −0.026 *** | −0.041 *** | 0.038 ** | −0.023 ** | −0.008 | −0.010 |
| Experience | −0.098 *** | 0.000 | 0.001 ** | 0.001 ** | −0.029 *** | −0.024 | −0.023 | 0.000 | 0.002 | 0.001 |
| Marriage | −0.033 | −0.234 ** | −0.365 *** | −0.171 | −0.546 *** | 0.303 | 0.231 | 0.679 *** | 0.921 *** | −0.417 ** |
| GenderAge | 0.023 | 0.010 | −0.014 | −0.061 *** | −0.109 *** | 0.054 *** | 0.105 *** | −0.025* | −0.092 *** | 0.017 |
| Middle | −1.733 *** | −1.431 *** | −0.572 ** | −1.355 *** | −0.972 *** | −1.249 *** | 1.506 *** | −0.661 *** | −0.162 | −0.722 *** |
| High | −2.210 *** | −1.673 *** | −1.051 *** | −1.454 *** | −1.615 *** | −0.357 | 1.401 *** | −0.223 | 0.154 | −0.095 |
| College | −2.688 *** | −1.508 *** | −2.174 *** | −1.275 *** | −1.503 *** | −0.475 | 3.332 *** | −1.202 *** | −1.735 | −0.710 |
| University + | −4.125 *** | −1.668 *** | −1.840 *** | −1.558 *** | −1.679 *** | −1.327 *** | 1.761 *** | −1.699 | −1.406 *** | −0.247 |
| Transition out of SS | Transition out of SN |
| SS → LS | SS → LN | SS → SN | SS → NW | SS → UN | SN → LS | SN → LN | SN → SS | SN → NW | SN → UN |
| Gender | 1.153 *** | −1.990 *** | −4.014 *** | 2.570 *** | −4.937 *** | −0.973 | −0.088 | 2.168 *** | 0.373 | −6.042 *** |
| Age | 0.035 *** | 0.028 *** | 0.014 ** | 0.086 *** | 0.020 *** | −0.018 | 0.000 | −0.008 | −0.016 * | −0.027 *** |
| Experience | 0.000 * | 0.000 | 0.000 | -0.001 | −0.000 | −0.032 ** | −0.011 | −0.001 | 0.000 | −0.030 *** |
| Marriage | −0.291 ** | −0.377 ** | −0.564 *** | 0.019 | −0.931 *** | −0.156 | 0.249 | 0.080 | 0.598 *** | −0.357 *** |
| GenderAge | 0.029 *** | −0.031 *** | −0.075 *** | 0.062 | −0.084 *** | 0.012 | 0.000 | 0.051 | −0.011 | −0.103 |
| Middle | 0.342 | 0.173 | 0.334 ** | 0.661 *** | −0.527 *** | −0.468 | 0.373 * | 0.779 ** | −0.690 *** | −0.902 *** |
| High | 0.161 | −0.387 * | −0.699 *** | 0.204 | −1.496 *** | 0.291 | 0.607 *** | 1.800 *** | 0.453 ** | −0.457 *** |
| College | −0.197 | −1.241 *** | −1.382 *** | 0.161 | −1.354 *** | 2.008 *** | −0.883 | 2.979 *** | 0.518 | −0.136 |
| University + | −0.258 | −2.944 *** | −2.275 *** | −0.036 | −1.888 *** | 0.074 | 0.144 | 3.192 *** | 1.788 *** | −0.739 ** |
| | Transition out of NW | Transition out of UN |
| NW → LS | NW → LN | NW → SS | NW → SN | NW → UN | UN → LS | UN → LN | UN → SS | UN → SN | UN → NW |
| Gender | 0.565 | 0.636 | 1.144 ** | −1.945 *** | −4.044 *** | 1.782 *** | 1.688 *** | 2.588 *** | 1.937 *** | 3.941 *** |
| Age | −0.038 *** | −0.050 *** | −0.091 *** | −0.035 *** | 0.018 *** | −0.023 *** | 0.011 * | −0.058 *** | 0.014 *** | 0.048 *** |
| Experience | −0.083 *** | −0.000 | 0.000 ** | −0.000 * | −0.000 * | −0.003 | −0.073 *** | −0.002 | −0.117 *** | 0.000 |
| Marriage | −0.162 | 0.204 | 0.722 *** | −0.481 *** | −0.406 *** | 0.031 | 0.226 * | 0.294 *** | 0.219 ** | 0.706 *** |
| GenderAge | −0.007 | −0.016 | 0.027 ** | 0.033 | 0.057 | −0.026 *** | −0.038 *** | −0.035 *** | −0.032 *** | −0.081 *** |
| Middle | 0.014 | 0.049 | 0.885 *** | 0.618 *** | 0.177 ** | −0.092 | −0.220 | −0.106 | 0.265 | 0.344 * |
| High | 0.344 | 0.277 | 0.518 ** | 0.664 *** | 0.004 | 1.064 *** | 0.221 | 0.295 | −0.275 * | 0.464 *** |
| College | 1.008 *** | 0.431 | 0.866 *** | 0.806 *** | 0.204 | 2.082 *** | 0.412 * | 0.925 *** | −0.216 ** | 0.648 *** |
| University + | 0.272 | 0.500 * | 1.044 *** | −0.160 | 0.257 ** | 1.079 *** | −1.134 *** | 1.097 *** | −0.434 | 0.950 *** |
Looking at the non-paid worker, the unemployed, and non-economically active populations (Cohort 1–Cohort 4), the results of empirical analysis on labor mobility determinants showed that men were more likely to move to the small–medium and non-standard employment markets at a statistically significant rate. Women who transitioned to other markets were more likely to move to the small–medium and non-standard employment market or the peripheral labor market compared with men. In addition, women were more likely to move to the unemployed state from the non-paid worker state. The results of empirical analysis on labor mobility determinants for the unemployed and non-economically active population showed than men were more likely to move to the economically active state. That is, men were highly likely to move to the large and standard employment market or the core labor market from the small–medium and non-standard employment sectors or the peripheral labor market. In other words, once women fall into the unemployed state, they are more vulnerable in terms of moving to the employed or economically active state.
To summarize the analysis results, gender appears to be the factor that determines whether a worker stays in the core labor market or moves to the core labor market from the peripheral labor market. That is, men are more likely to stay longer in the core labor market and are relatively less likely to move to the peripheral labor market. In contrast, women are more likely to stay in the peripheral labor market and more likely to move to another peripheral labor market when they move.
4. Conclusions and Policy Suggestions
Free movement between states of economic activities is an essential element for resolving conflicts between ranks and improving labor market efficiency and equity. In the same vein, even within one country in which the proportion of individuals in the peripheral labor market is higher, labor markets with free mobility to the core labor market and other labor markets devoid of free mobility to the core labor market will have very different impacts on the social and economic experiences of individuals. This is because it is difficult to expect that individuals can move upward to better labor markets if the individuals have difficulty escaping from the peripheral labor market once they have fallen into that market [
10,
28,
29].
Prior studies that analyzed the existing dual labor market structure in South Korea identified the dual labor market structure through wages. In contrast, this study examined the gender distribution in the South Korean labor market, which is characterized by the prevalent dual market structure, by using the Supplementary Survey on the Economically Active Population for the last 10 years (2010–2014) administered by the National Statistical Office. This study also evaluated how the gender gaps in working conditions, such as wages, social insurance coverage, and fringe benefits, have changed in terms of the long-term time-series. In addition, this study conducted an empirical analysis on how the labor mobility of individuals changes over time and on the factors that determine the labor dynamics of individuals by utilizing the Korean Labor and Income Panel Study (KLIPS) 6th–15th data (2003–2012) from the Korea Labor Institute to overcome the limitations of cross-sectional data analysis. The major results are as follows.
First, the number and proportion of men in the large and standard employment market, which is the primary labor market deemed the core labor market, compared to the proportion of women since 2005. The number of men increased by 278,000 in 2014 compared with the number in 2005, whereas the number of women increased by 134,000, less than half that of men. However, in the small–medium and non-standard employment market, which is the secondary labor market deemed the peripheral labor market, the number of men increased slightly by 89,000 compared with 2005, whereas women increased significantly by 511,000.
Second, the number and proportion of women in the unemployed and non-economically active population have increased over time compared to men. The increase in the number of men and women in the non-economically active state was found to be similar. However, the problem is that the number of women in a non-economically active state is twice as large as that of men and the gap remained at the same level over time. That is, it can be said that the biggest problem in the South Korean labor market is that women who enter the core labor market are significantly smaller in number and those who fall into the peripheral labor market or the tertiary market are significantly larger in number than men.
Third, from the analysis of the gender gap in working conditions for only paid workers, the gender gaps in wages have increased in almost all markets, whereas the gender gaps in social insurance coverage and fringe benefits have shrunk in almost all markets. However, the gender gaps in social insurance coverage and fringe benefits are still considerable in the small–medium and standard employment labor market and, concurrently, in the small–medium and non-standard employment labor market.
Fourth, state changes and labor mobility did not increase in frequency, but rather decreased or remained at the similar level, which proves the conjecture of state-dependence for the state changes and labor mobility. In addition, the results of the gender analysis show that men are more likely to stay in the core labor market than the peripheral labor market and tend to move to the markets closer to the core market rather than the peripheral market. In contrast, women are more likely to stay in the peripheral labor market than in the core labor market and tend to move to the relatively weak peripheral labor market. For example, comparing the gender distribution after mobility in three years, the distribution of men and women was 16.1% and 8.3%, respectively, in the large and standard employment market or the primary labor market deemed the core labor market. The respective distribution of men and women was 21.0% and 54.9% in the unemployed state, which is part of the tertiary labor market. Therefore, it can be seen that the changes are maintained at the same level and persist over time.
Despite the various measures implemented for gender equality, why are men concentrated in the primary labor market or the core labor market while women are concentrated in the secondary labor market or the peripheral labor market. Also, why are there gaps in working conditions even when men and women work in the same workplace and what kind of policy measures are necessary to resolve these problems?
First, it is necessary to create jobs for women through flexibility in the primary labor market. It is also necessary to implement policies that improve the rate of female settlement in the primary labor market to maintain or attract female workers. It is necessary to design a system that facilitates returning to work for women after maternity and childcare leave by expanding flextime jobs and similar programs put forth by the Korean government. In addition, it is necessary to concentrate the efforts to expand the employment of women in the primary labor market through affirmative action. Currently, the system is designed for affirmative action to be applied only to workplaces with 500 or more employees or public companies. Hence, large workplaces with more than 300 and less than 500 employees lie in the blind spot of the system due to lack of institutional arrangements for female employment [
30]. It is necessary to prepare more active labor market policies by strengthening the link between welfare policies and employment policies for working women-centric child care.
Secondly, as confirmed through empirical analysis, although the gender gap in working conditions such as wage, social insurance coverage and fringe benefits have greatly improved, there still exists a considerable gap between the genders. Systems that indirectly affect these gaps are related to affirmative action schemes for non-standard employment (Act on protection of fixed-term and part-time workers and Act on protection of dispatched workers). The system was implemented for the purpose of equal work-equal pay for standard and non-standard labor, but the effectiveness of the law is increasingly weakening in smaller companies. Consequently, the law works against women, who are concentrated in the small–medium and non-standard employment market or the secondary labor market. It is necessary to provide the associated social safety nets to the secondary labor market in a fairer, wider and denser manner to solve these problems.
It is typical to oppose labor market flexibility from the perspective of women’s rights. If labor market flexibility promotes job creation through primary labor market flexibility while men are concentrated in the primary labor market and women are concentrated in the secondary labor market, the flexibility will not necessarily result in the loss of female workers, which is a concern from the perspective of women’s rights. The problem is that the above concerns will be realized when the flexibility of the primary labor market expands into employment insecurity in the secondary labor market or when the employment insecurity develops into job insecurity for all women. Generally, the labor system in stratified labor markets should protect workers in the secondary labor market, who are the weaker party, and create good-quality jobs by energizing the primary labor market. However, there is a more common tendency for greater protection in the primary labor market and greater instability in the secondary labor market because of exemptions in the law for illegal or deviant workers. The empirical study results indicated that this phenomenon caused more women to become victims of the stratified labor market. A considerable numbers of the victims became economically inactive and were expelled from the labor markets.
Indiscriminate flexibility policies such as simple gender equality policies without taking into consideration the stratified labor market structure will worsen the situation. Although lots of labor policies have been proposed to resolve the gender gaps in employment and working conditions, few policy suggestions have been customized to specifically eliminate the dual labor market structure. Therefore, the effectiveness of the system and policies would be even greater with dual labor market reforms as the prerequisite. Complex and holistic approaches like stratified-labor-market-perceptive gender equality policies are necessary for South Korea.


