1. Introduction
In the last few years, the idea of sustainability has had an increasingly central role in public debate and discussions concerning the use of natural resources and economic development. The theory of “sustainability” has originated a wide range of interpretations and meanings [
1,
2,
3,
4,
5].
More recently, the idea of energy has been redrafted and a new model founded on the principle of sustainability has become increasingly popular. The idea of sustainable energy is founded on three main principles: production pertaining to technologies for generating energy, particularly those using renewable sources, use which encompasses the different classes of energy efficiency and saving, and environmental impact in terms of pollution and the use of natural resources, which should be minimized [
6].
The International Energy Agency (IEA) underlines that achieving sustainability is essential to making a determined effort to activate the development and propagation of technologies for the decarbonization of the energy system. The Agency also stresses that the majority of technologies that could play a leading role in the shift towards low-carbon energy systems are still progressing very slowly [
6].
Energy crops are specifically targeted in the production of biofuels (solid, liquid, and gaseous) and the development of vegetal products with specific attributes that make them suitable for industrial processing and transformation into energy. Energy crops can be considered among the most promising sources of renewable energy; however, we have to add that their environmental sustainability is still a rather controversial topic [
7,
8]. Although LCA is an excellent environmental evaluation tool, it is not able to manage uncertain input data. The procedure of measuring sustainability is a complex task because it must deal with attributes that in many cases are very difficult to define precisely. Furthermore, the available information can involve both qualitative and quantitative aspects.
Instead, fuzzy-set based methods, it has been proven, deal with uncertainty in environmental topics [
9]. The innovative contribution proposed by fuzzy logic is the representation of uncertain and vague information using fuzzy rules. A fuzzy inference system (FIS) constitutes the practice of formulating mapping from the input to an output using fuzzy logic. The idea is to reproduce a solution by decoding it from the domain of knowledge with the calculus of fuzzy IF-THEN rules [
9].
In this paper, a fuzzy expert system is proposed to assess the sustainability of production and use of biomass for energy purposes. The paper is then structured as follows: the next section presents the basic concepts of fuzzy inference theory.
Section 3 describes the use of fuzzy inference to build an index of sustainability while in
Section 4 the testing of the fuzzy index is presented. Finally,
Section 5 closes the paper with a conclusion.
2. Fuzzy Inference System: A Theoretical Review
An Fuzzy Inference System (FIS) contains the knowledge and experience of an expert, in the design of a system that controls a process whose input–output relations are defined by a set of fuzzy control rules, e.g., IF–THEN rules [
10]. Fuzzy logic-reasoning contains two types of information. The first concerns the labels and membership functions assigned to the input and output variables. The accurate selection of these represents one of the most critical stages in the design model. The other type of information is related to rule-base which processes the fuzzy values of the inputs to fuzzy values of the outputs [
11].
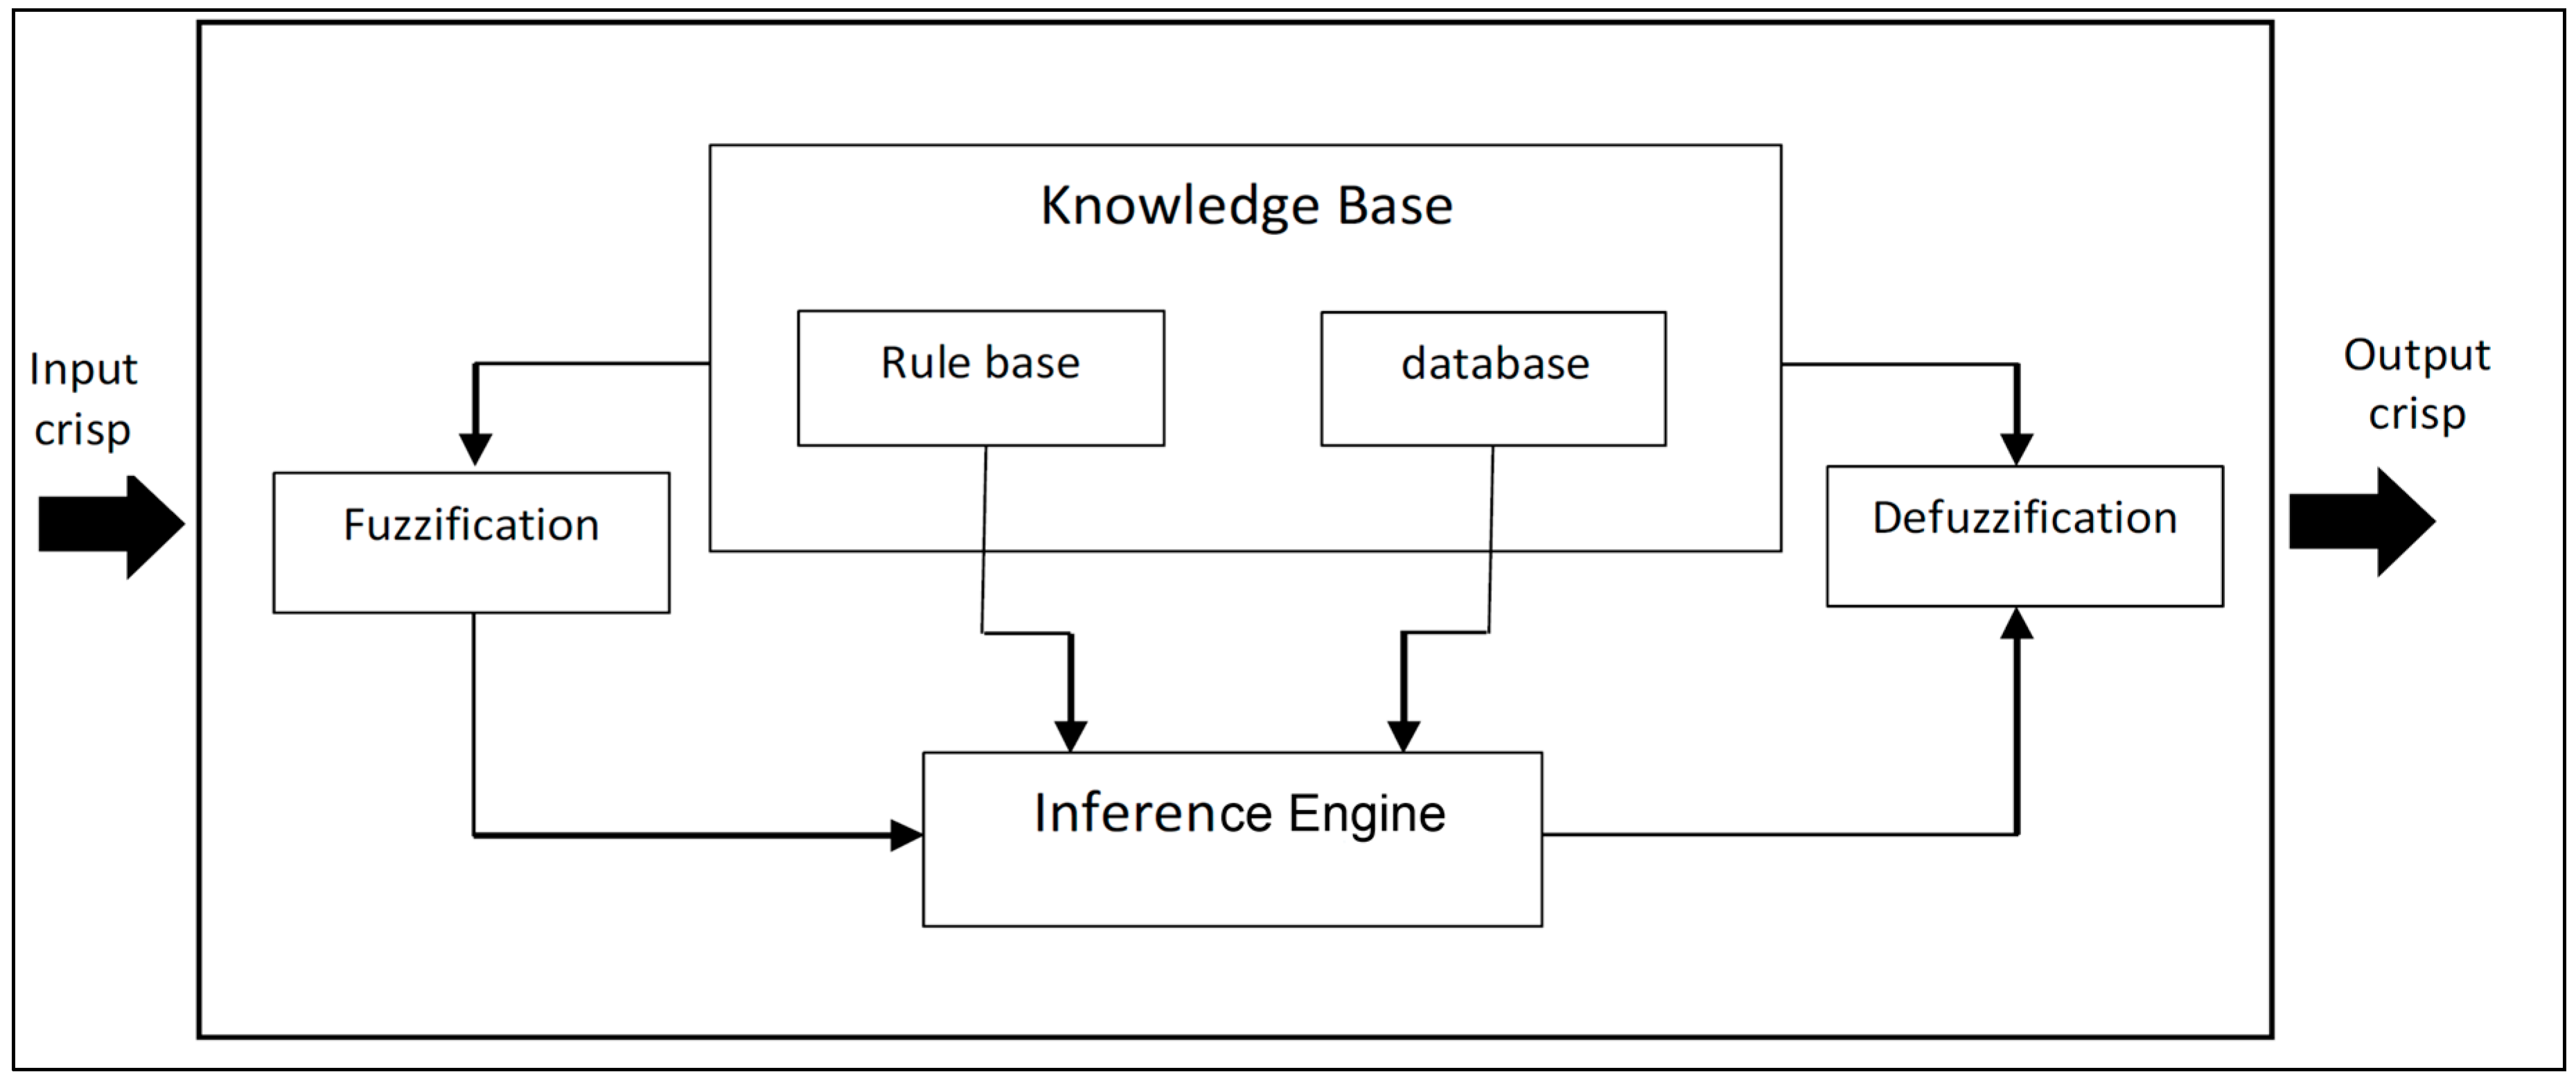
An FIS is composed of three blocks. The first,
fuzzification, converts crisp value input to a linguistic variable using the membership functions kept in the knowledge base. To the second block, the
inference engine, is assigned the task of evaluating the input’s degree of membership to the fuzzy output sets using the fuzzy rules. Finally, the
defuzzifier block transforms the fuzzy output into a crisp value. The inference engine is the FIS heart, and can reproduce the human decision-making process by performing approximate reasoning in order to achieve a control strategy [
10]. The inference stage utilizes the fuzzy input values to activate the inference rules and generate the fuzzy output value. The generic architecture of the fuzzy expert system is shown in
Figure 1.
Figure 1.
Architecture of a fuzzy expert system.
Figure 1.
Architecture of a fuzzy expert system.
In a fuzzy inference model (approximate reasoning) the reasoning process is based on a series of
if-then rules as a kind of expert knowledge [
12,
13]. The conditional statement (or proposition) contains a
premise, the if-part, and a
conclusion, the then-part [
12,
14]. The knowledge included in a fuzzy control system is made up of a group of several rules of the form “
if X is A then Y is B”, or, more generally, “
if X1 is A1 and ...and Xn is An then Y is B”, where
A,
An,
B are fuzzy sets [
15]. The
knowledge base, which comprehends general knowledge concerning a problem domain, joins antecedents with consequences or premises with conclusions [
16] (see
Figure 1). The most commonly used fuzzy inference technique was proposed by Mamdani. However, in Mamdani-type FIS the number of rules grows with the number of premise-part variables. As the number of rules grows the activity of assembling rules can become very burdensome and sometimes it becomes difficult to comprehend the relationships between the premises and consequences [
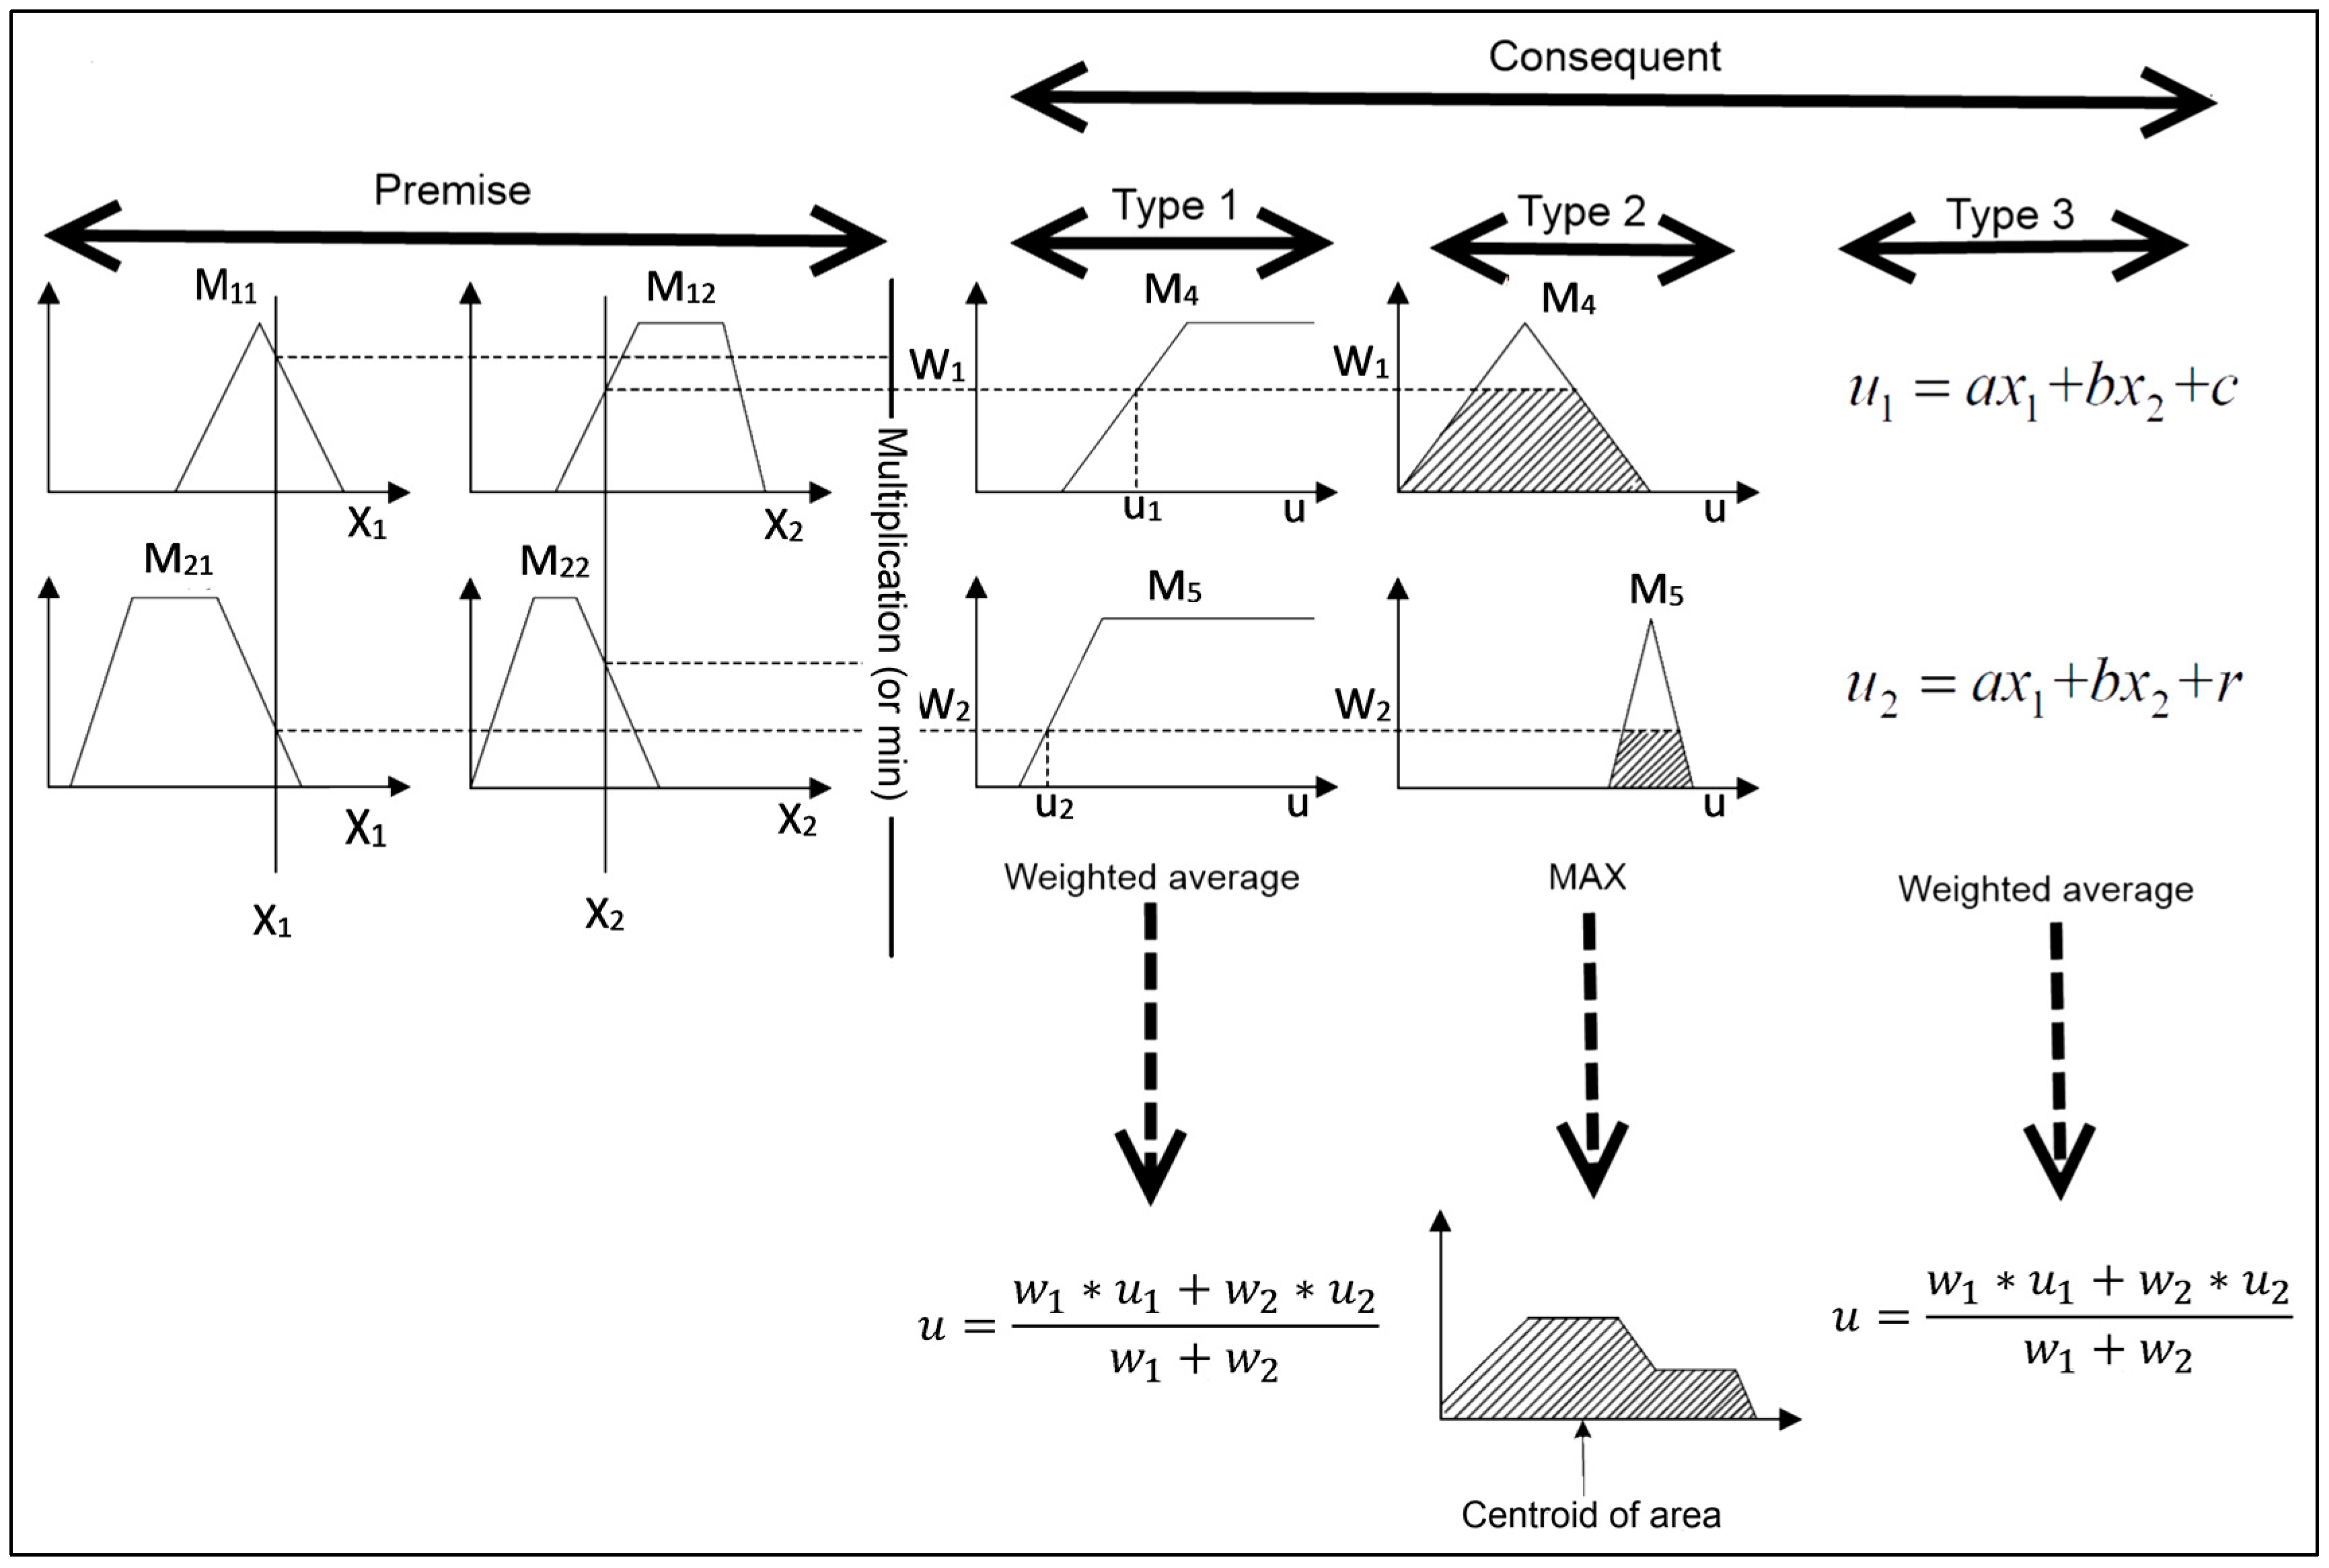
17]. A Sugeno-type method (or Takagi-Sugeno-Kang) has fuzzy inputs and a crisp output (linear combination of the inputs). It is computationally efficient and suitable to work with optimization and adaptive techniques, so it is very adequate for control problems, mainly for dynamic nonlinear systems [
18]. Sugeno method develops a systematic approach to generate fuzzy rules from a given input-output data set. It changes the consequent (then part) of Mamdani rule with a function (Equation) of the input variables. The T-S style fuzzy rule is: IF
x is
A AND
y is
B THEN
z is
f (
x, y) where
x,
y and
z are linguistic variables,
A and
B are fuzzy sets on universe of discourses
X and
Y and
f (
x, y) is a mathematical function [
18]. Sugeno-type FIS uses weighted average to compute the crisp output while Mamdani-type FIS uses the technique of defuzzification of a fuzzy output. The first two parts of the fuzzy inference process, fuzzifying the inputs and applying the fuzzy operator, are the same [
9]. The main difference is that the Sugeno output membership functions are either linear or constant [
9]. In
Figure 2 different types of fuzzy systems are shown. Type two is Mamdani FIS with output function based on overall fuzzy output, while type three is the Takagi-Sugeno fuzzy inference.
Fuzzy sets theory has been applied successfully in recent years for dealing with sustainability and environmental topics. The pioneers are certainly Phillis and Andriantiatsaholiniaina [
19], Phillis
et al. [
20], Phillis
et al. [
21]. They proposed a model called Sustainability Assessment by Fuzzy Evaluation (SAFE). Ocampo-Duque
et al. [
22], Icaga [
23], and Lermontov
et al. [
24] proposed the use of fuzzy set for dealing with water quality. Fisher [
25] applied the fuzzy sets to the study of air quality. Prato [
26] developed a fuzzy adaptive management tool for evaluating the vulnerability of an ecosystem as a result of climate change. Marchini
et al. [
27] described a framework for designing fuzzy indices of environmental conditions. Gonzalez
et al. [
28] integrated life cycle assessment (LCA) methodology and fuzzy reasoning. Silvert [
29] showed how fuzzy logic can be applied to analysis of ecological impacts.
Figure 2.
Different types of Fuzzy inference system [
30].
Figure 2.
Different types of Fuzzy inference system [
30].
3. Fuzzy Inference for Measuring the Sustainability of Biomass
Fuzzy inference is a process of obtaining new knowledge through existing knowledge using fuzzy logic. This process of formulating the mapping from a given input to an output produces a basis on which decisions can be made or patterns discerned. In this approach, the solution of a problem derives from human interpretation of data, expertise, etc.
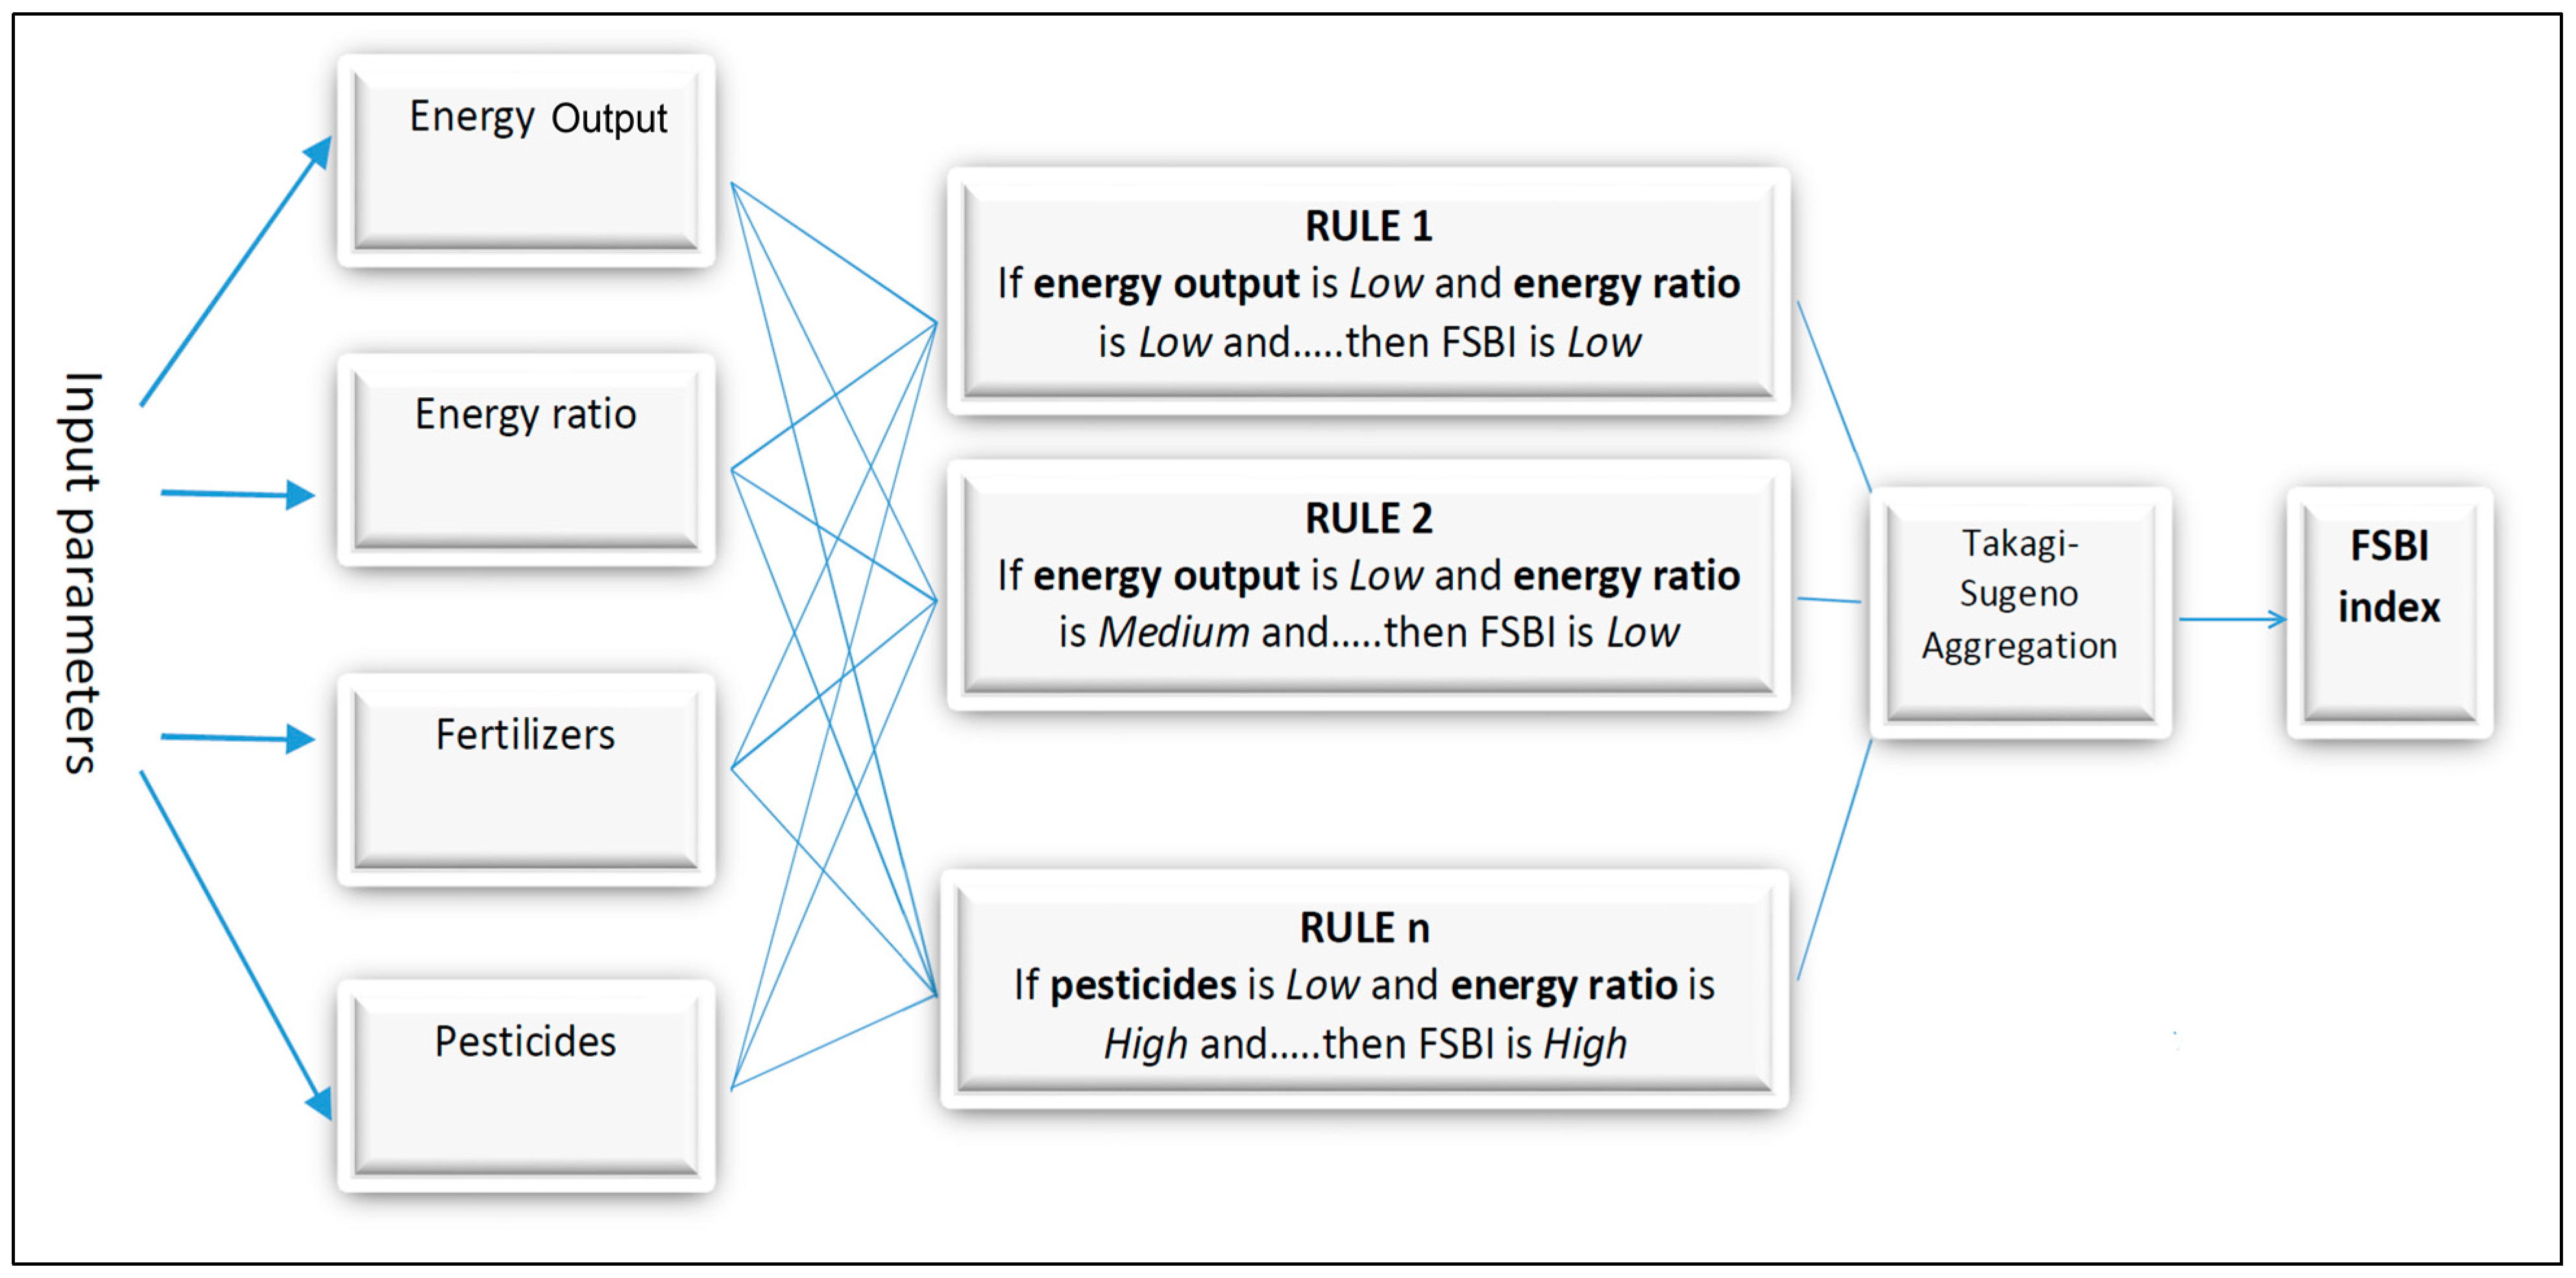
We propose an approach using fuzzy inference to build a fuzzy index which measures the sustainability grade of energy crops and deals with uncertain data. The first step of fuzzy expert system design is definition of inputs and output parameters (see the
Figure 3). We describe the input variables with their membership functions and then we show the results of the testing. In our model we select four parameters: (a) energy output; (b) energy balance (output/input ratio); (c) fertilizers; and (d) pesticides. The choice to select the first two variables (a and b) depends on the need to include information about the energy dimension of sustainability while the other two (c and d) involve information about the chemical pressure deriving from crop cultivation. The use of chemical substances such as pesticides and fertilizers releases contaminants into the environment which need to be considered in a process of sustainability assessment. These parameters were selected considering their strict correlation to the characteristics of environmental sustainability. We could have also put other parameters in the model but very often data are available in the literature in an unbundled way. Our first proposal focused on parameters data that could be easily accessed in a database or literature of energy crops. Then we decide to use not many but significant and incisive parameters with consolidated literature data.
Figure 3.
Proposed FIS for designing the sustainable index.
Figure 3.
Proposed FIS for designing the sustainable index.
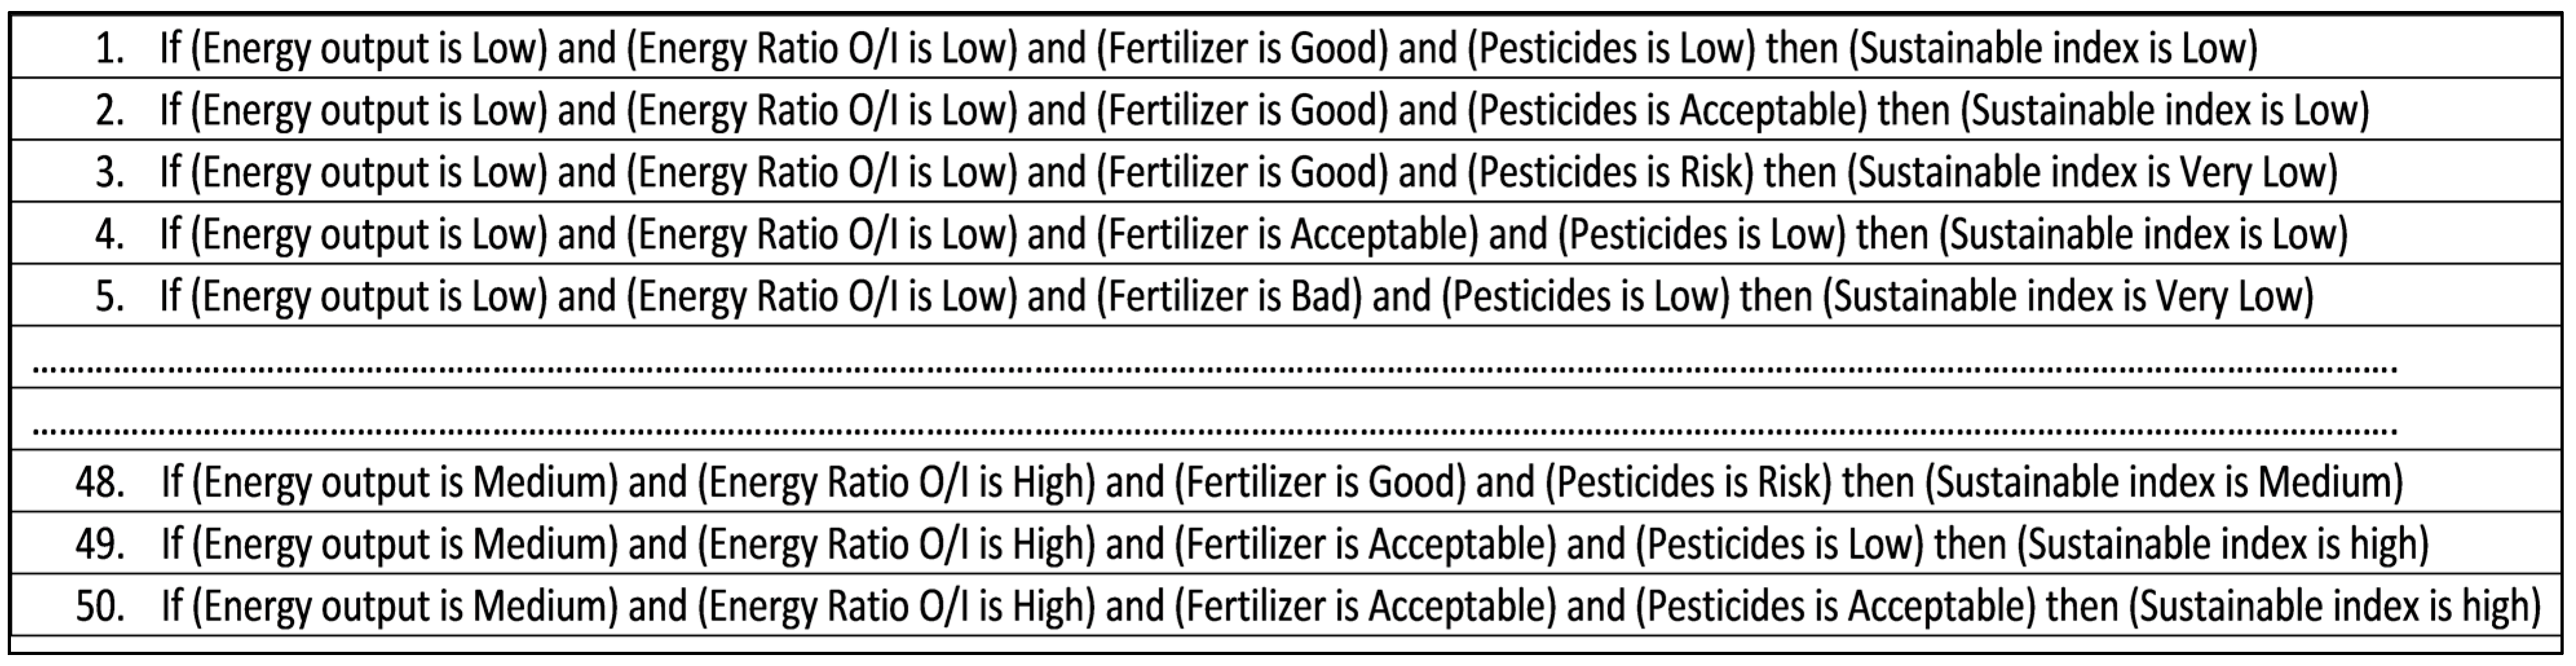
After that, some experts defined and adjusted the parameters and the membership functions (MF) that represent the kernel of the inference model. In particular, the experts were asked to define the linguistic values and the thresholds of each value. Each expert determined the above mentioned information based on personal experience and an agreement among the experts was reached quickly. Once the fuzzy variables and membership functions have been described, the
if-then fuzzy rule base can be defined. The number of fuzzy rules defined depends on the possible combination of membership functions. FIS with
j-input variables has
r =
p j rules, where
p is the number of linguistic terms per input variable. As the dimension and complexity of a system increases, the size of the rule base increases exponentially [
13]. In this system 81
if-then rules have been defined; in the following
Figure 4 some of these are reported as examples.
The variables selected are the following:
(a) Energy output
The first variable used in this study is the energy output, that is to say, biomass production in energy terms expressed in GJ ha
–1. Data from the literature [
31] attributes an energy output value of between 260 GJ ha
–1 and 530 GJ ha
–1 for miscanthus, between 240 GJ ha
–1 and 600 GJ ha
–1 for the giant reed, between 155 GJ ha
–1 and 252 GJ ha
–1 for the cardoon and, finally, between 334 GJ ha
–1 and 507 GJ ha
–1 for sorghum. This input variable has three fuzzy sets: “Low”, “Medium”, and “High”. MFs of “Low” and “High” are trapezoidal, while MF of “Middle” is triangular. Their Equations (1)–(3) are shown below:
(b) Energy balance (output/input ratio)
For the purposes of the overall evaluation of environmental sustainability, one crucial piece of information is that regarding the energy balance. It represents a balance between the amount of energy used for production phase (inputs) and the energy that the biomass will supply (outputs). It is mostly positive for many promising crops, both as output–input gain and ratio [
31]. To represent the information contained in the energy balance in this analysis, an output/input ratio is used. Three fuzzy sets are selected, “Low”, “Medium”, and “High” and their MF is shown in Equations (4)–(6).
(c) Fertilizers
This variable supplies information regarding the quantity of fertilizers needed to sustain and develop the crops. In fact, from the data in the literature, it can be seen that there is no ideal or “standard” quantity of fertilizers to be used on crops. Indeed, this quantity may vary greatly according to the type of soil and the climatic conditions encountered. The data of the fertilizer input (kg/ha
-1) refers to the total quantity of various fertilizers (N + K
2O + P
2O
5) used on the crops [
32,
33].
This variable has three fuzzy sets, “Good”, “Acceptable”, and “Bad” and their MF is shown in Equations (7)–(9).
(d) Pesticides
They help to increase agricultural production and productivity, but their use causes damage to agricultural land, fisheries, fauna and flora, and affects human health through contamination of soil and groundwater [
34,
35]. For the pesticide variable a score ranging from zero to 150 has been employed. The authors calculated the pesticide score by multiplying the amount of each pesticide applied per hectare per year by the toxicity score of each pesticide [
33].
For this variable, three fuzzy-sets have been selected, “Low”, “Acceptable”, and “Risk” and the related Equations (10)–(12).
The output variable of the model is represented by a fuzzy index that states the sustainability level of a particular crop for energy use (fuzzy sustainable biomass index—FSBI). The index is in the form of linguistic ratings described as “Very Low”, “Low”, “Medium”, “High”, and “Very High”. Lastly, according to Sugeno-type FIS, the weighted average is used to compute the crisp output.
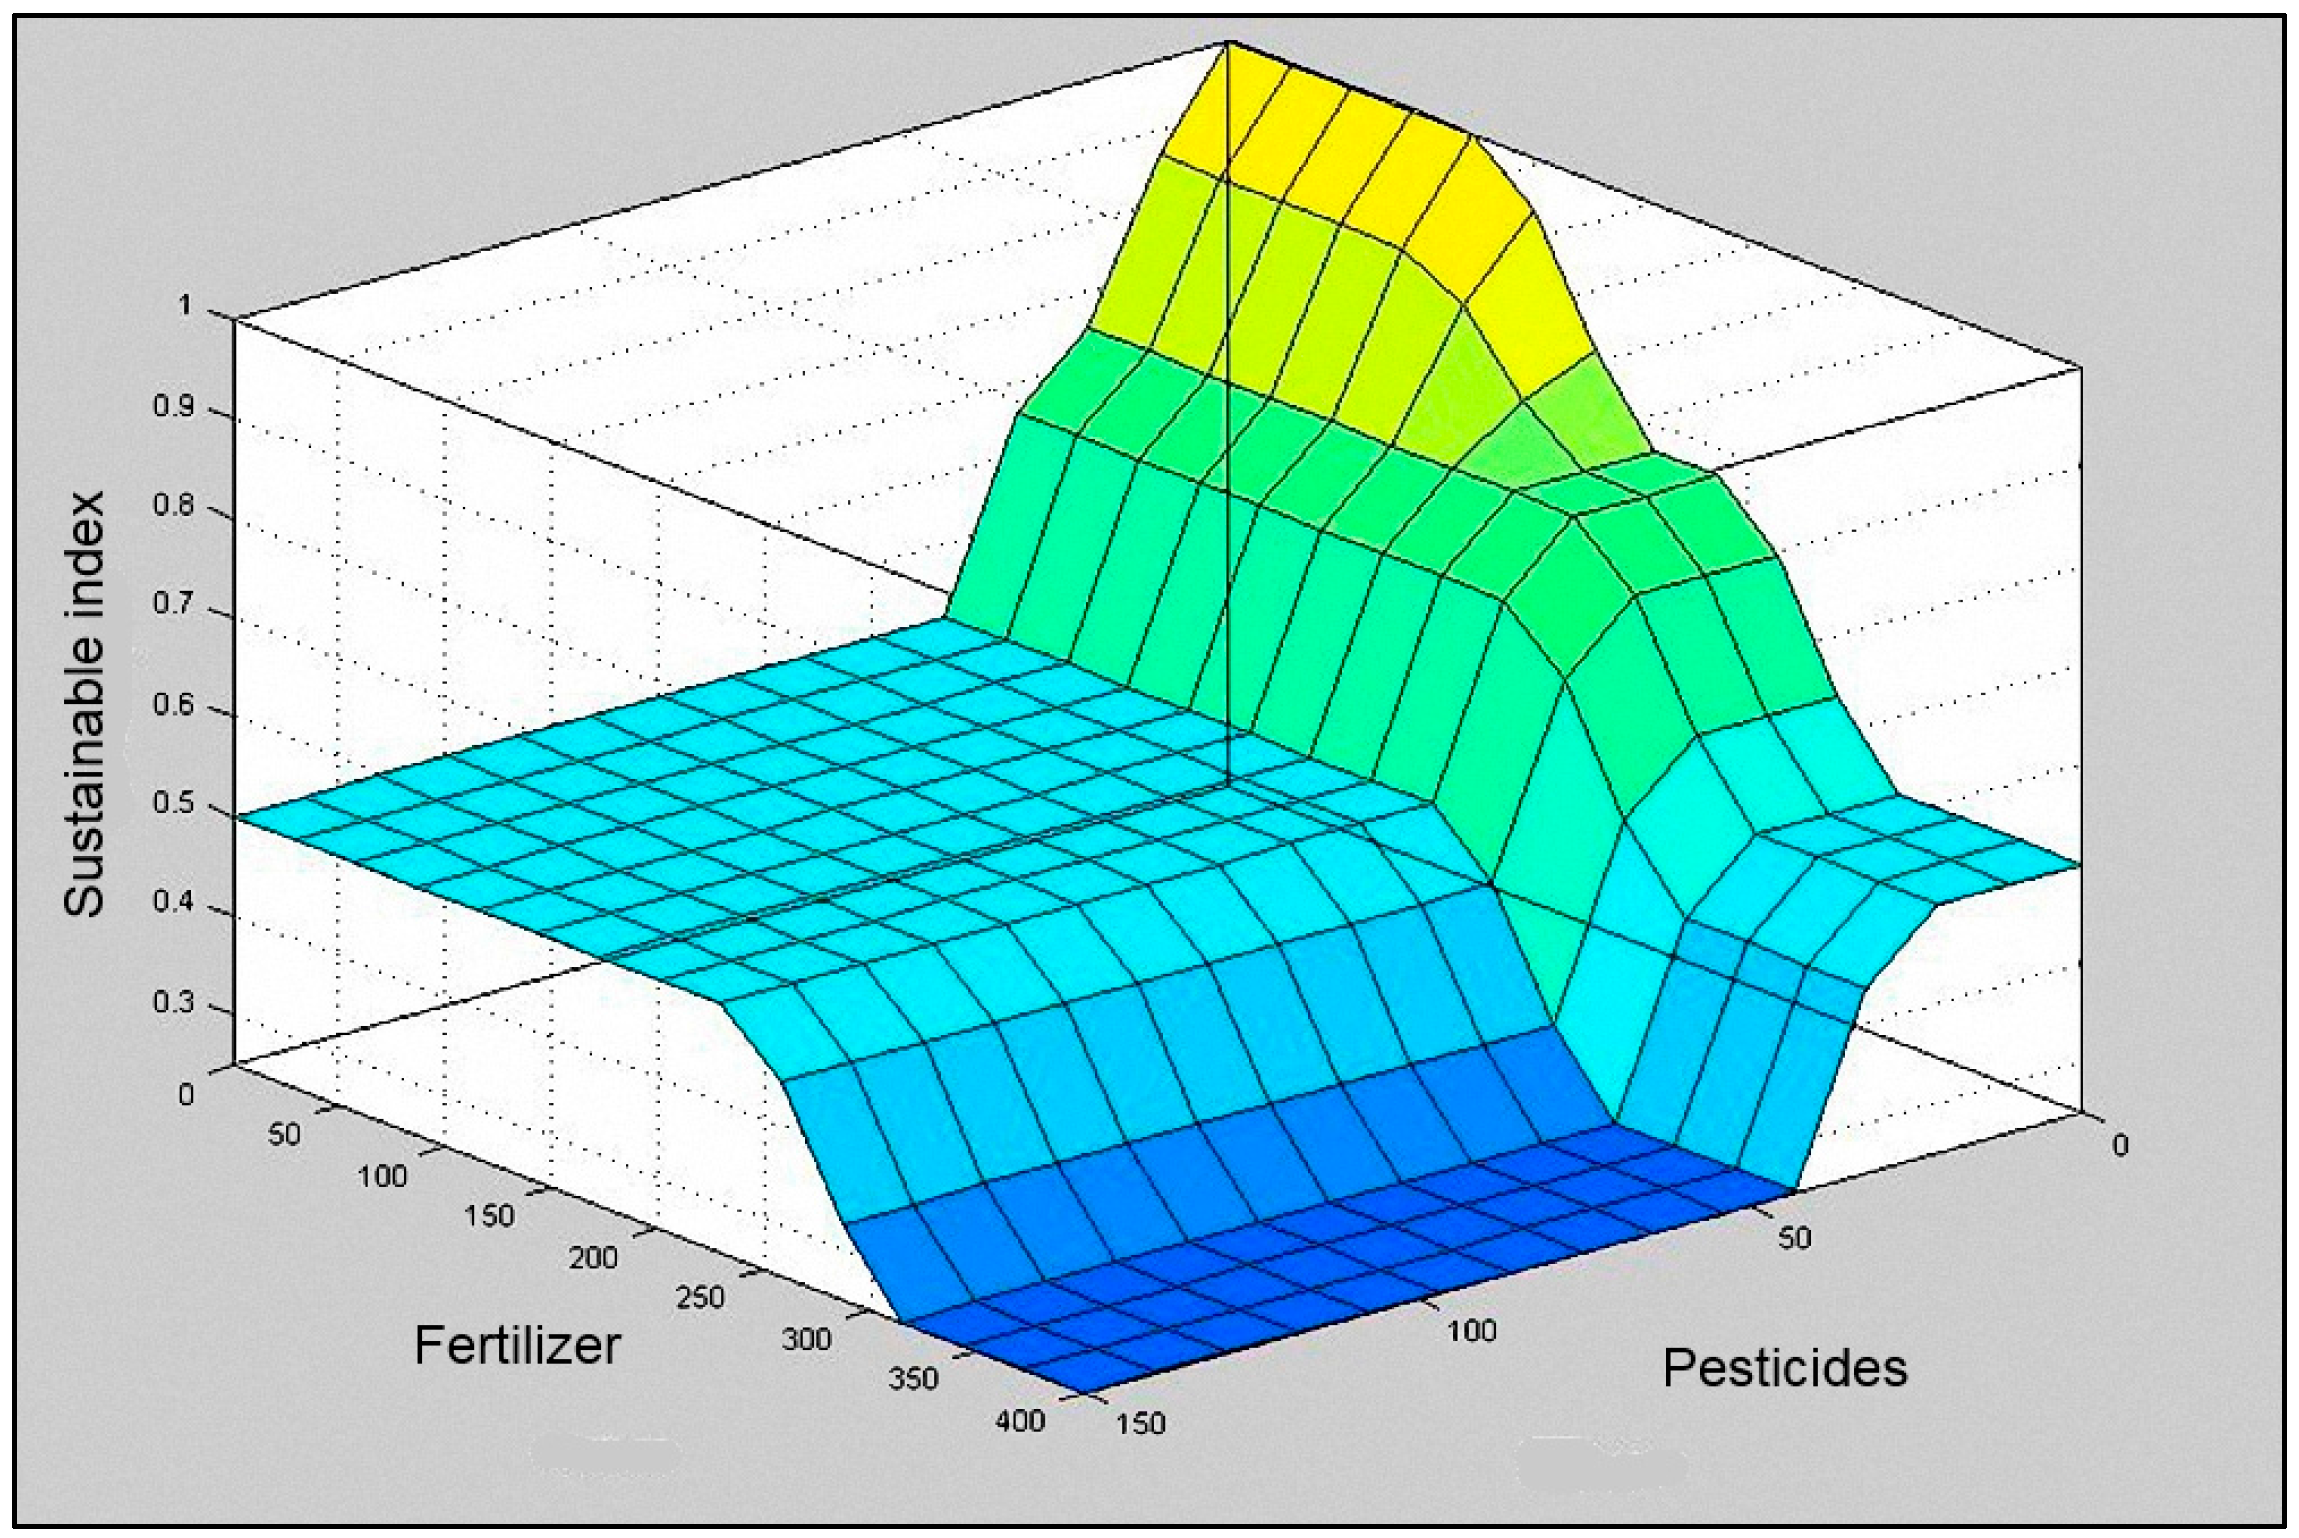
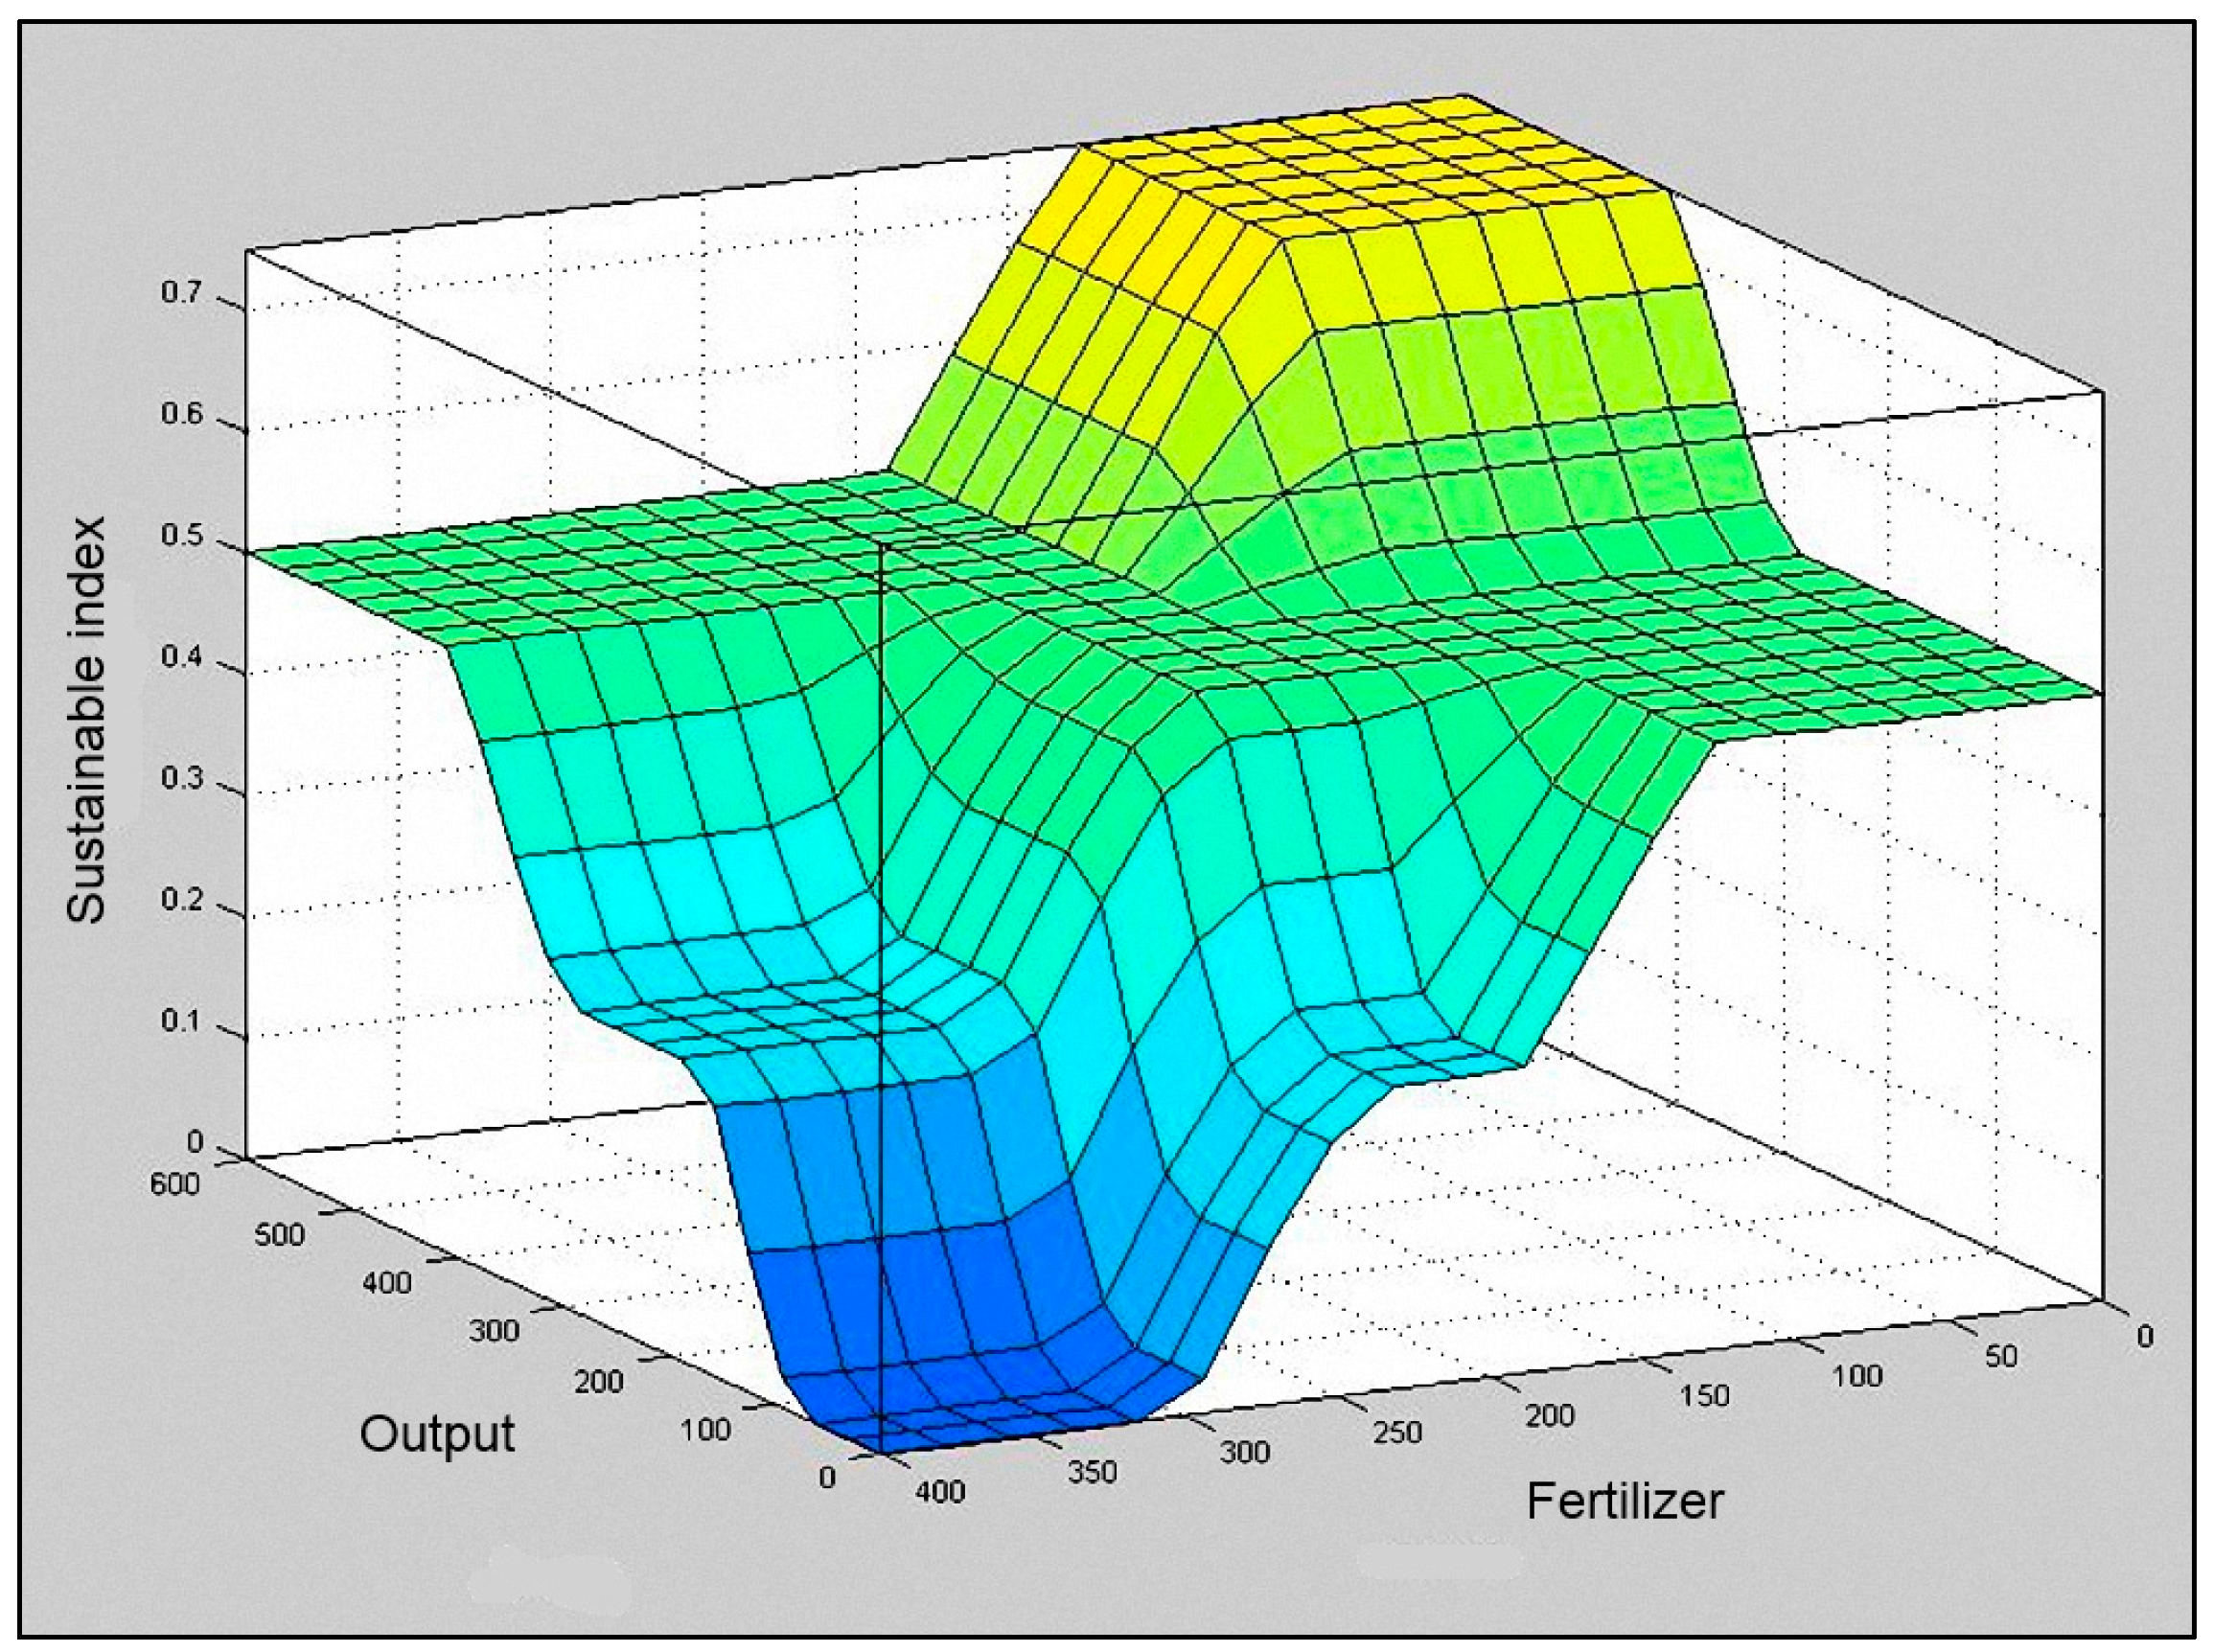
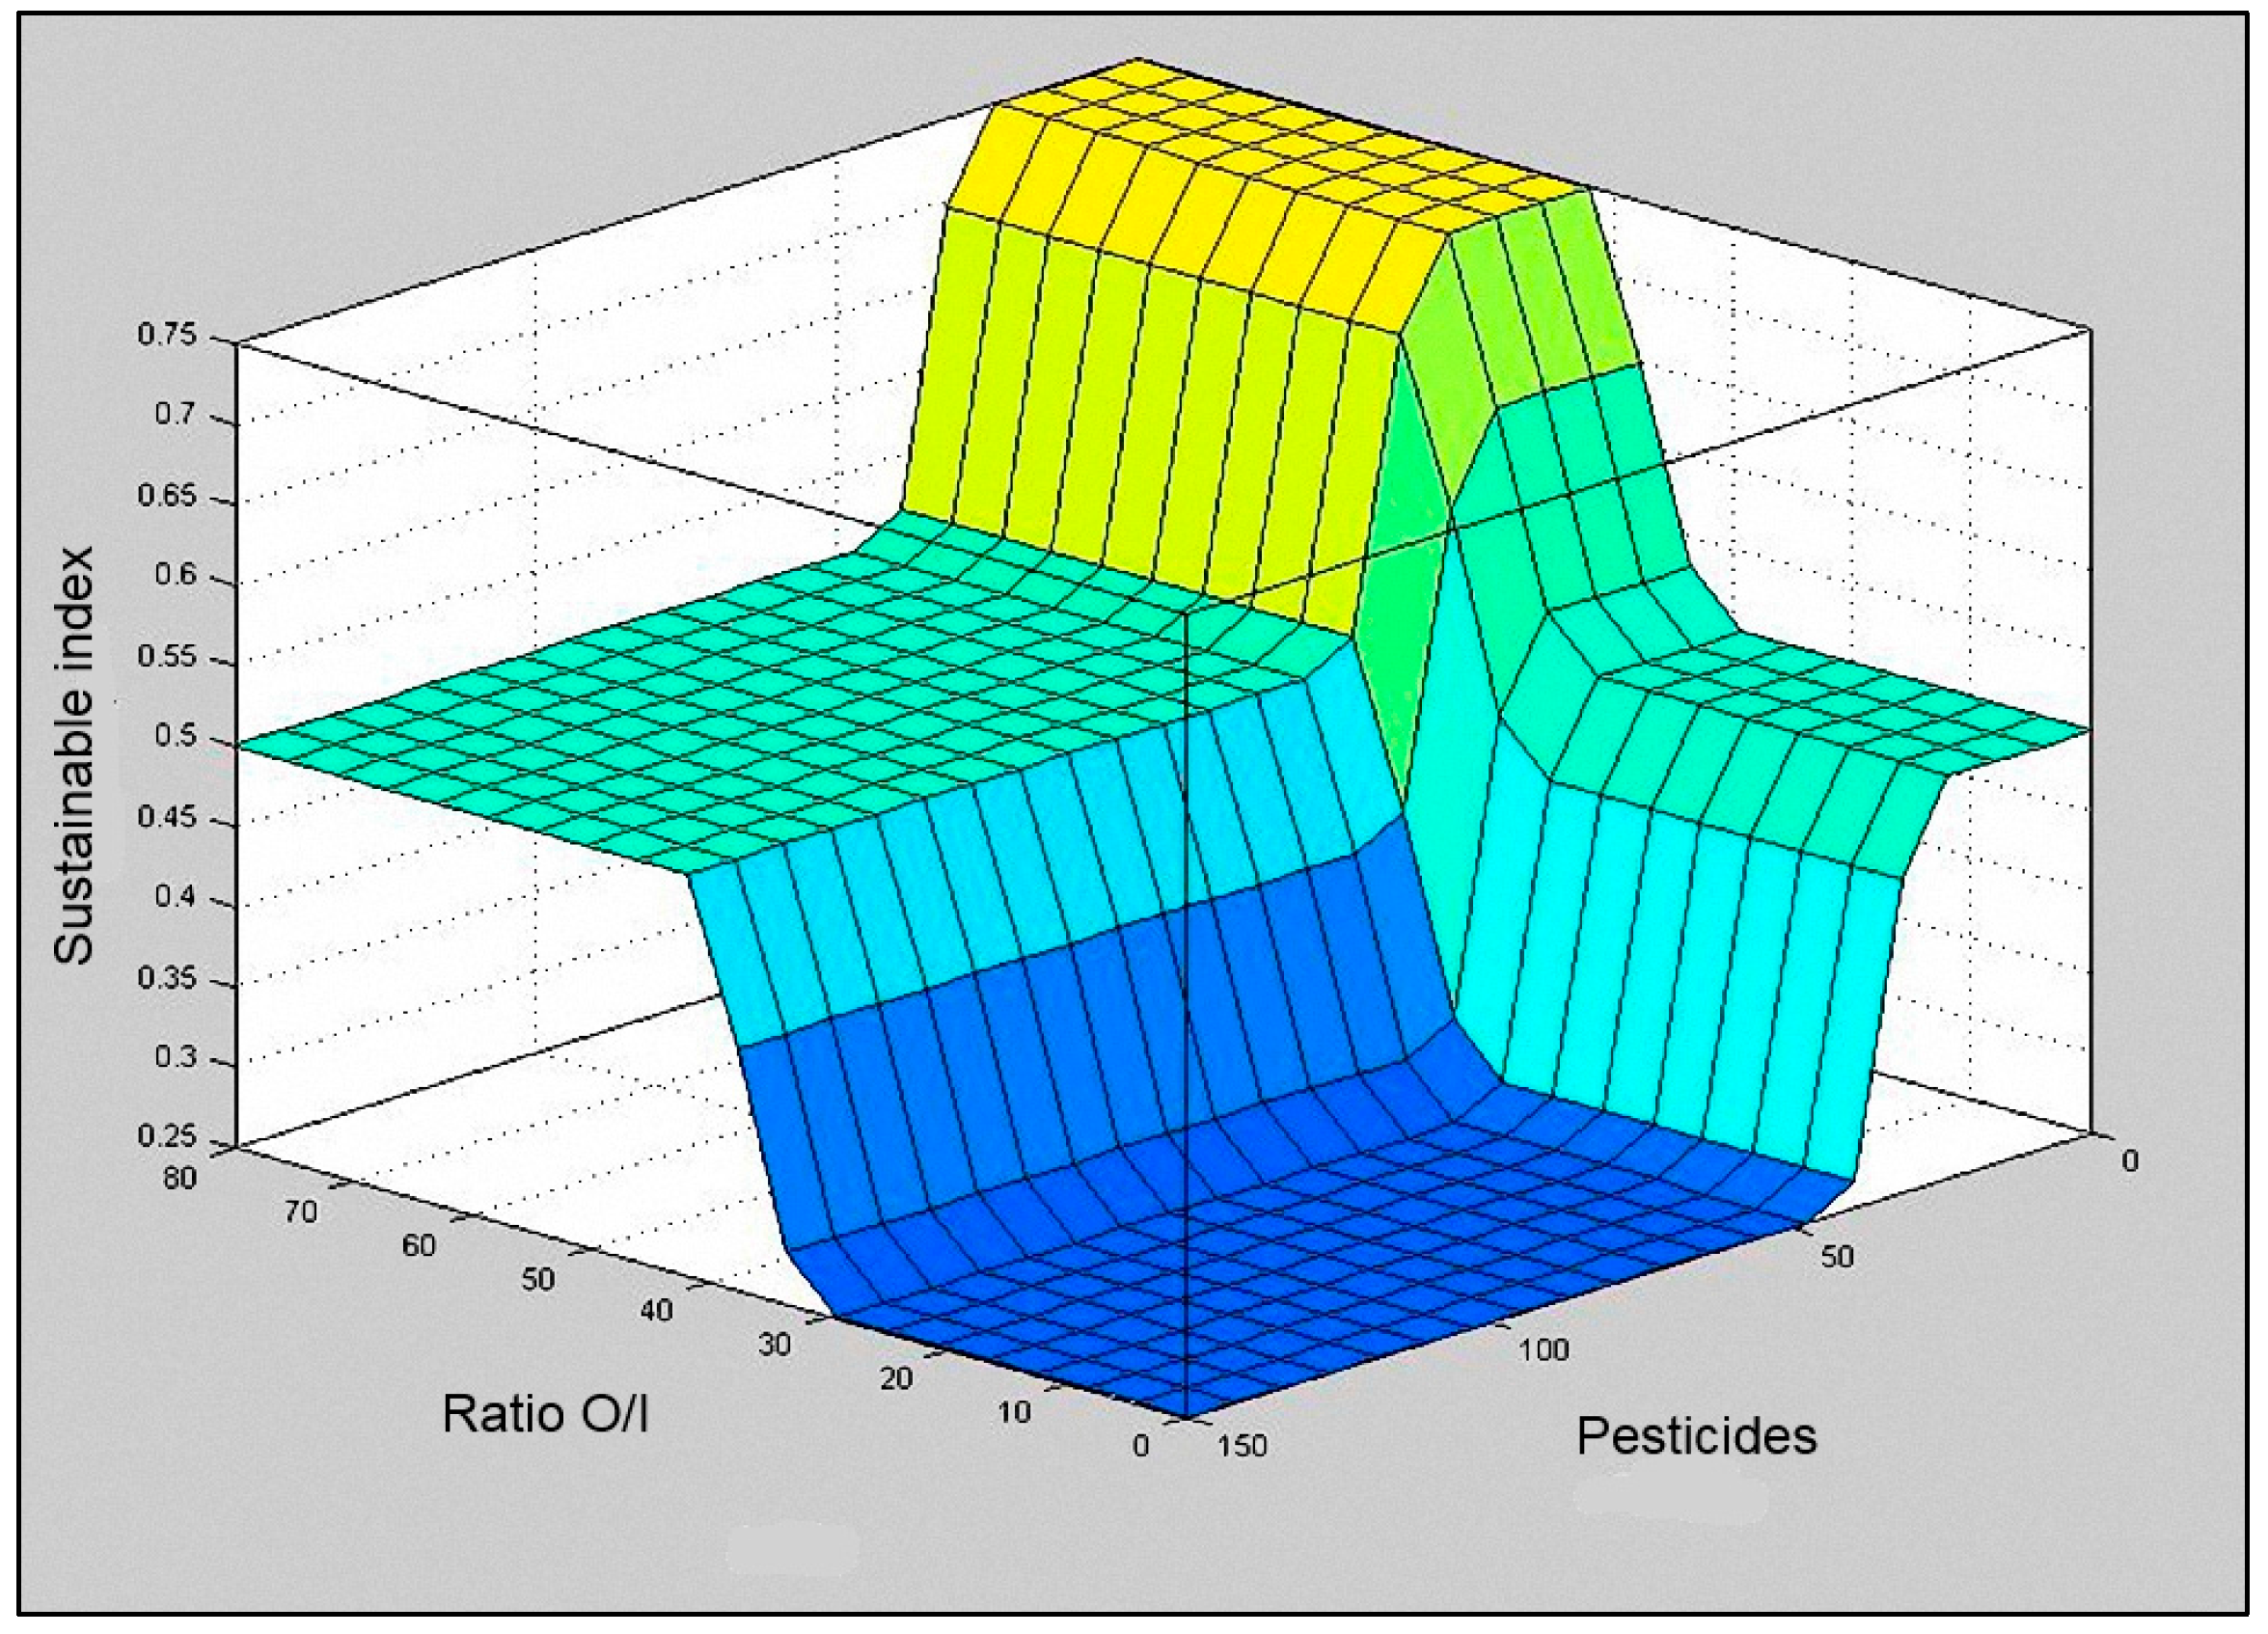
In
Figure 5,
Figure 6 and
Figure 7, the output surface of the system based on the input set is shown. Surfer viewer is a three dimensional plot that allows the relation between fuzzy sustainable index and any two input sets to be examined according to the set rules.
Figure 5.
Surface viewer of “Fertilizers” and “Pesticides”.
Figure 5.
Surface viewer of “Fertilizers” and “Pesticides”.
Figure 6.
Surface viewer of “Output” and “Fertilizers”.
Figure 6.
Surface viewer of “Output” and “Fertilizers”.
Figure 7.
Surface viewer of “Ratio O/I” and “Pesticides”.
Figure 7.
Surface viewer of “Ratio O/I” and “Pesticides”.
4. Discussion and Testing
To test the FIS for the sustainability evaluation, some energy crop species were selected (
Table 1). The literature data, used for the computation of the fuzzy index of the main energy crops, are reported also in
Table 1. The data were only available in a wide range (min–max), so the numerical results are reported also in a range. For example, for the miscanthus, we found the following data in the literature: Energy output (260–530), Energy O/I ratio (12–66), Fertilizers (152–252) and Pesticides (0–15). Then, the obtained FSBI is included in a range between 0.481 and 0.659. Once the FIS has been calibrated it is ready to treat new input values. For example, if we put the values of miscanthus in the system (260, 12,152,0) these values are processed using the related fuzzy sets and decision rules produce a single result value corresponding to FSBI and so on with other and new crops. It is very important to highlight that the parameter data used for this application must not be understood in an absolute sense.
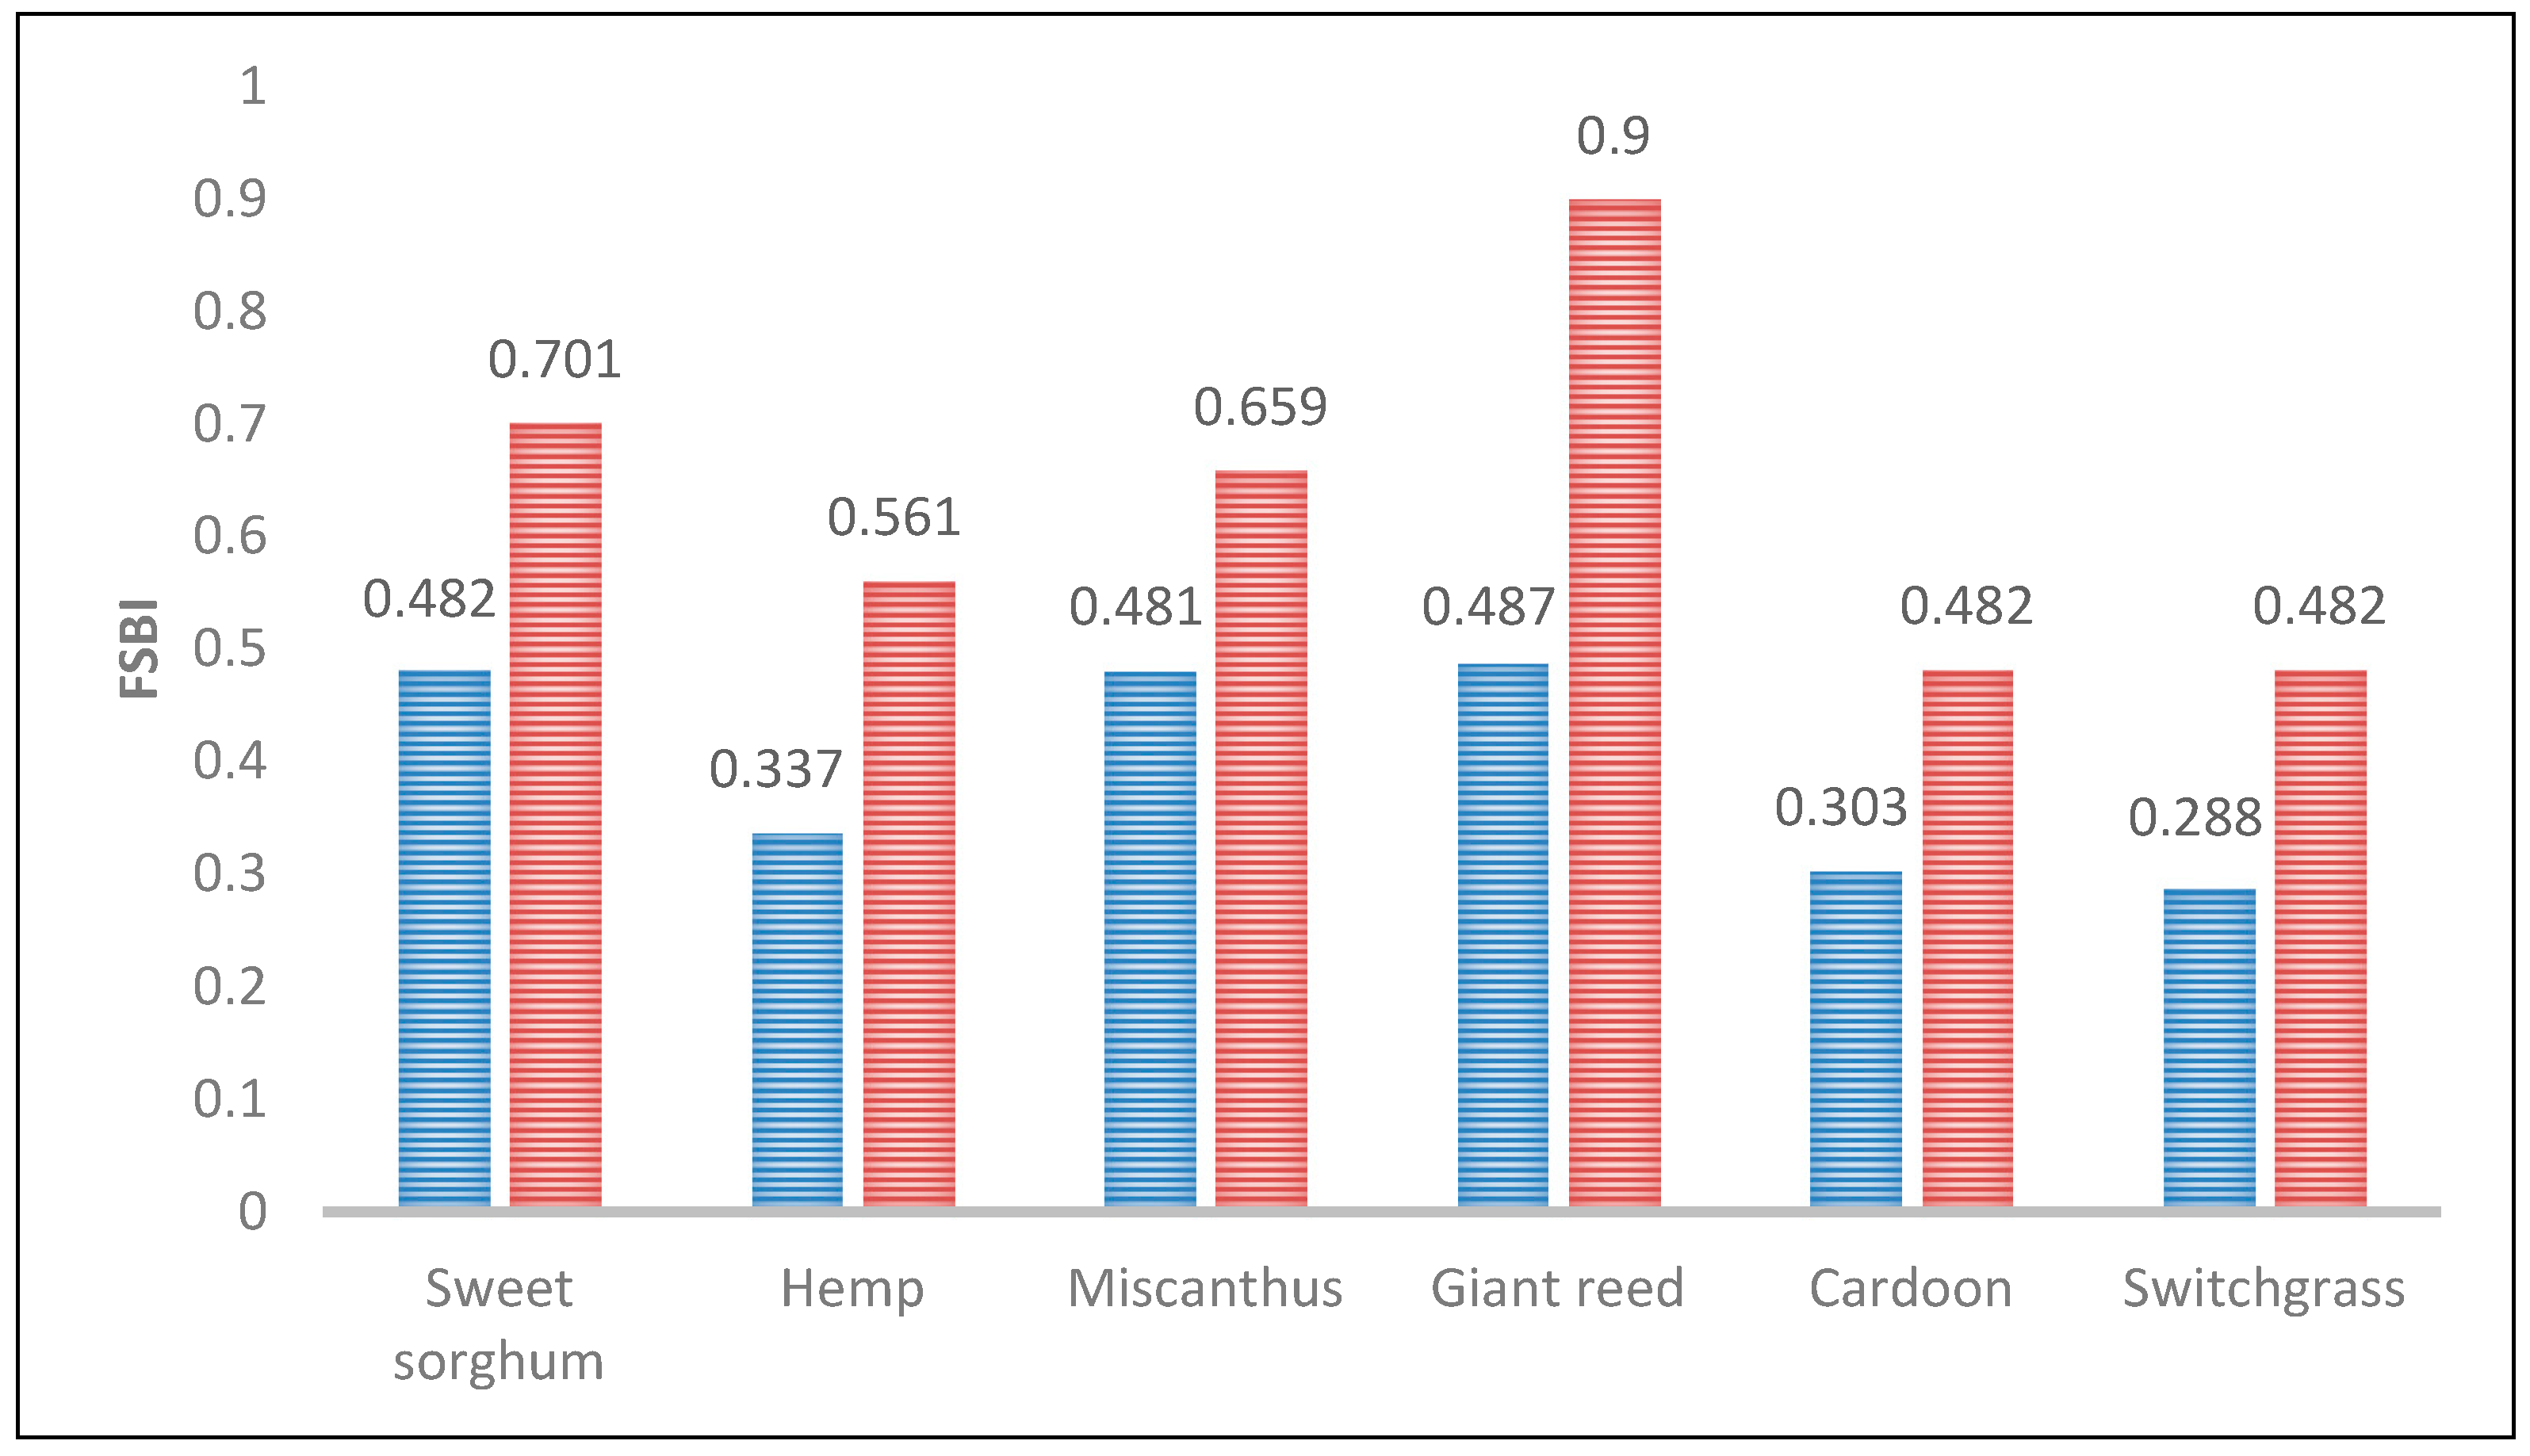
Based on these inputs values (see
Table 1), we obtain the highest FSBI for the giant reed (0.487–0.9), followed by sweet sorghum (0.482–0.701), and miscanthus (0.481–0.659). In the middle ranking we have the hemp (0.337–0.561) and finally the worst FSBI is computed for the cardoon (0.303–0.482) and switchgrass (0.288–0.482) (see
Table 2 and
Figure 8).
Table 1.
Input data for selected crops.
Table 1.
Input data for selected crops.
| Input Data |
|---|
| Crops | Energy Output (GJ ha–1) | Energy O/I (ratio) | Fertilizer (kg/ha–1) | Pesticide (score) |
|---|
| Sweet Sorghum | 334–507 | 10–32 | 245–3900 | 3–10 |
| Hemp | 128–270 | 5–20 | 156–295 | 0 |
| Miscanthus | 260–530 | 12–66 | 152–252 | 0–15 |
| Giant Reed | 240–600 | 11–75 | 167–227 | 0 |
| Cardoon | 155–252 | 7–31 | 149–459 | 0–4 |
| Switchgrass | 174–435 | 8–54 | 96–146 | 42 |
Table 2.
Results of Fuzzy Sustainable Biomass Index (FSBI).
Table 2.
Results of Fuzzy Sustainable Biomass Index (FSBI).
| Crops | FSBI |
|---|
| Sweet Sorghum | 0.482–0.701 |
| Hemp | 0.337–0.561 |
| Miscanthus | 0.481–0.659 |
| Giant Reed | 0.487–0.9 |
| Cardoon | 0.303–0.482 |
| Switchgrass | 0.288–0.482 |
This work tries to demonstrate that fuzzy sets are suitable for uncertain approximate reasoning and allow decision making with estimated values where information is incomplete or uncertain. Indeed for all parameters selected the input data are available only in a range (min–max) and very often the traditional environmental assessment methods are not able to process these kind of data.
The proposed fuzzy sustainable biomass index—FSBI allows an immediate and preliminary assessment of the sustainability degree of biomasses for energy purposes using few significant parameters. The results of the FSBI computation are reported also in
Figure 8. From the analysis of the figure we can observe the range (min–max) of the FSBI between selected crops.
Figure 8.
Range of “Fuzzy Sustainable Biomass Index” (FSBI).
Figure 8.
Range of “Fuzzy Sustainable Biomass Index” (FSBI).
The application of the fuzzy model in the field of sustainability allows to integrate knowledge with linguistic expressions. The linguistic variable is extremely useful in such cases, namely to deal with situations that are not well defined that need to be expressed quantitatively [
36].
We believe that fuzzy sets can be used to manage the sustainability because this is intrinsically complex, vague and difficult to measure. FIS compared with other models is based on systematic observation and on the verification of factors influencing the result, thus it is not a “black box” type of decision model but a transparent tool that can be updated with new knowledge.
5. Conclusions
In this paper, we proposed a fuzzy expert system to assess the sustainability of energy crops. In particular, a fuzzy sustainable biomass index (FSBI) was calculated using energy output, energy output/input ratio, fertilizers, and pesticides as input variables. The paper offers a way to manage the uncertainty in the processes of sustainability assessment. Fuzzy sets are suitable for approximate reasoning and allow decision-making with estimated values where information is incomplete or uncertain. An FIS contains information and experience of an expert in the design of a system that controls a process whose input–output relations are defined by a set of fuzzy control rules. The obtained results also demonstrate the capacity of the fuzzy-sets to assemble various pieces of knowledge and decode it into more transparent indices for environmental management. A Takagi-Sugeno-type inference method has been used because it is data processing efficient and works well with optimization problems.
The system was tested on sweet sorghum, hemp, miscanthus, giant reed, cardoon, and switchgrass. Once the calculation had been carried out, we obtained the best performance of FSBI for the giant reed (0.487–0.9), and the worst for the switchgrass (0.288–0.482). In the future, we aim to improve the model by including other variables and more accurate data.


