Article

What is the Influence of the Planning Framework on the Land Use Change Trajectories? Photointerpretation Analysis in the 1958–2011 Period for a Medium/Small Sized City

by
Mário Monteiro
1 and
Alexandre Oliveira Tavares
1,2,*
1
Department of Earth Sciences, Faculty of Science and Technology, University of Coimbra, Coimbra 3030-790, Portugal
2
Centre for Social Studies, University of Coimbra, Coimbra 3000-995, Portugal
*
Author to whom correspondence should be addressed.
Sustainability 2015, 7(9), 11727-11755; https://doi.org/10.3390/su70911727
Submission received: 6 June 2015 / Revised: 14 August 2015 / Accepted: 19 August 2015 / Published: 25 August 2015
(This article belongs to the Special Issue Urban Land and Sustainable Development)

Abstract

:
Medium/small sized cities create a polycentric urban system representing the backbone of their territory, characterized by profound changes on land use. The objective of this study is to evaluate the spatial and temporal dynamics of land use in a medium/small city in Portugal during the period 1958–2011, and the relation with the planning framework. The assessment involves land use changes recognition in the period 1958–2011, calculation of the stability grade indicator, and the losses and gains between classes. The rate of artificialization and its relation with the planning framework was also evaluated. The results for the city of Viseu showed a main decrease in annual crops and arable lands, with an increase of the continuous and discontinuous urban fabric. The changes are systematic transitions, marked by planning framework and its typology, objectives and scale enforcement. A plan addressing the city encouraged land use changes in the fringe, while a municipal Master Plan determined sequent transformation in all areas. The land use changes and the artificialization processes enabled the identification of three periods where planning framework was forthright. The study underlines the importance of a planning framework for medium/small sized cities for urban sprawl and artificialization processes.

1. Introduction

Land changes in urban areas, especially the conversion of cropland and forest land to urban uses, is one of the most important forms of global environmental changes [1]. Cities of small and medium scale are frequently characterized by profound changes in land use, a heterogeneous occupation, and a high level of infrastructure and equipment, where hazardous processes, natural and technological, have cumulative presence with economically and socially relevant damages and losses [2]. The relevance of these cities is also pointed out by some authors [3,4,5,6], presenting a complex social distribution and organization, with the increase of territorial vulnerability. However, as stated by the European Territorial Strategy and the Territorial Agenda of European Union [7,8], these cities create a polycentric urban system, where their interdependency forms are especially important for rural regions and represent the backbone of their territory because of the ability to generate jobs and permit the dissemination of certain urban functions [9].
Different studies consider land use and the urban expansion as a combined outcome of societal needs, supported by planning preparation actions [10,11,12,13]. Understanding long-term dynamics of the landscape and transitions of land use is fundamental to dimension the past and future effects and for the recognition of present landscape structure [14,15,16,17,18].
Some authors have investigated land-use changes through a comparative evaluation of land-cover image sources [13,19,20,21,22,23], using detection techniques involving different images and sources.
The use of satellite imagery and aerial photographs for interpretation has made it possible to integrate sets of images from several observation periods obtained from different sources and using different scales. The reconstitution of the transformation path using those images, in accordance with uniform classification principles and field validation capabilities, has been explored in other studies to reveal the dynamics of land-use transformation [20,24,25,26,27].
The analysis of changes on land use and occupation in the territory, with special focus in the processes from small and medium cities, allows the evaluation of consistency in urban expansion scenarios, the vulnerability of ecosystems, and the maintenance of the distinctive morphological and socio-cultural features [1,4,21,26,28,29,30].
Several authors present indicators to monitor urban expansion and temporal dynamics which are major triggering factors in land use change processes [31,32,33]. Different research groups point sets of indicators responsible for the characteristics of landscapes and land use change [34,35,36,37], namely related with the planning framework [13,38,39,40].
The main objective of this study is to evaluate the spatial and temporal dynamics of land use over time in an inland medium/small city of Portugal during the period 1958–2011, and the relation with the planning framework. The research questions we want to answer are:
What are the changes in land use in the period 1958–2011, using five moments of analysis?
What are the stability grade and the dynamics of losses and gains between classes of land use?
What is the zoning model for land use change and artificialization process?
What is the relation between land use trajectories and the planning framework?

2. Materials and Methods
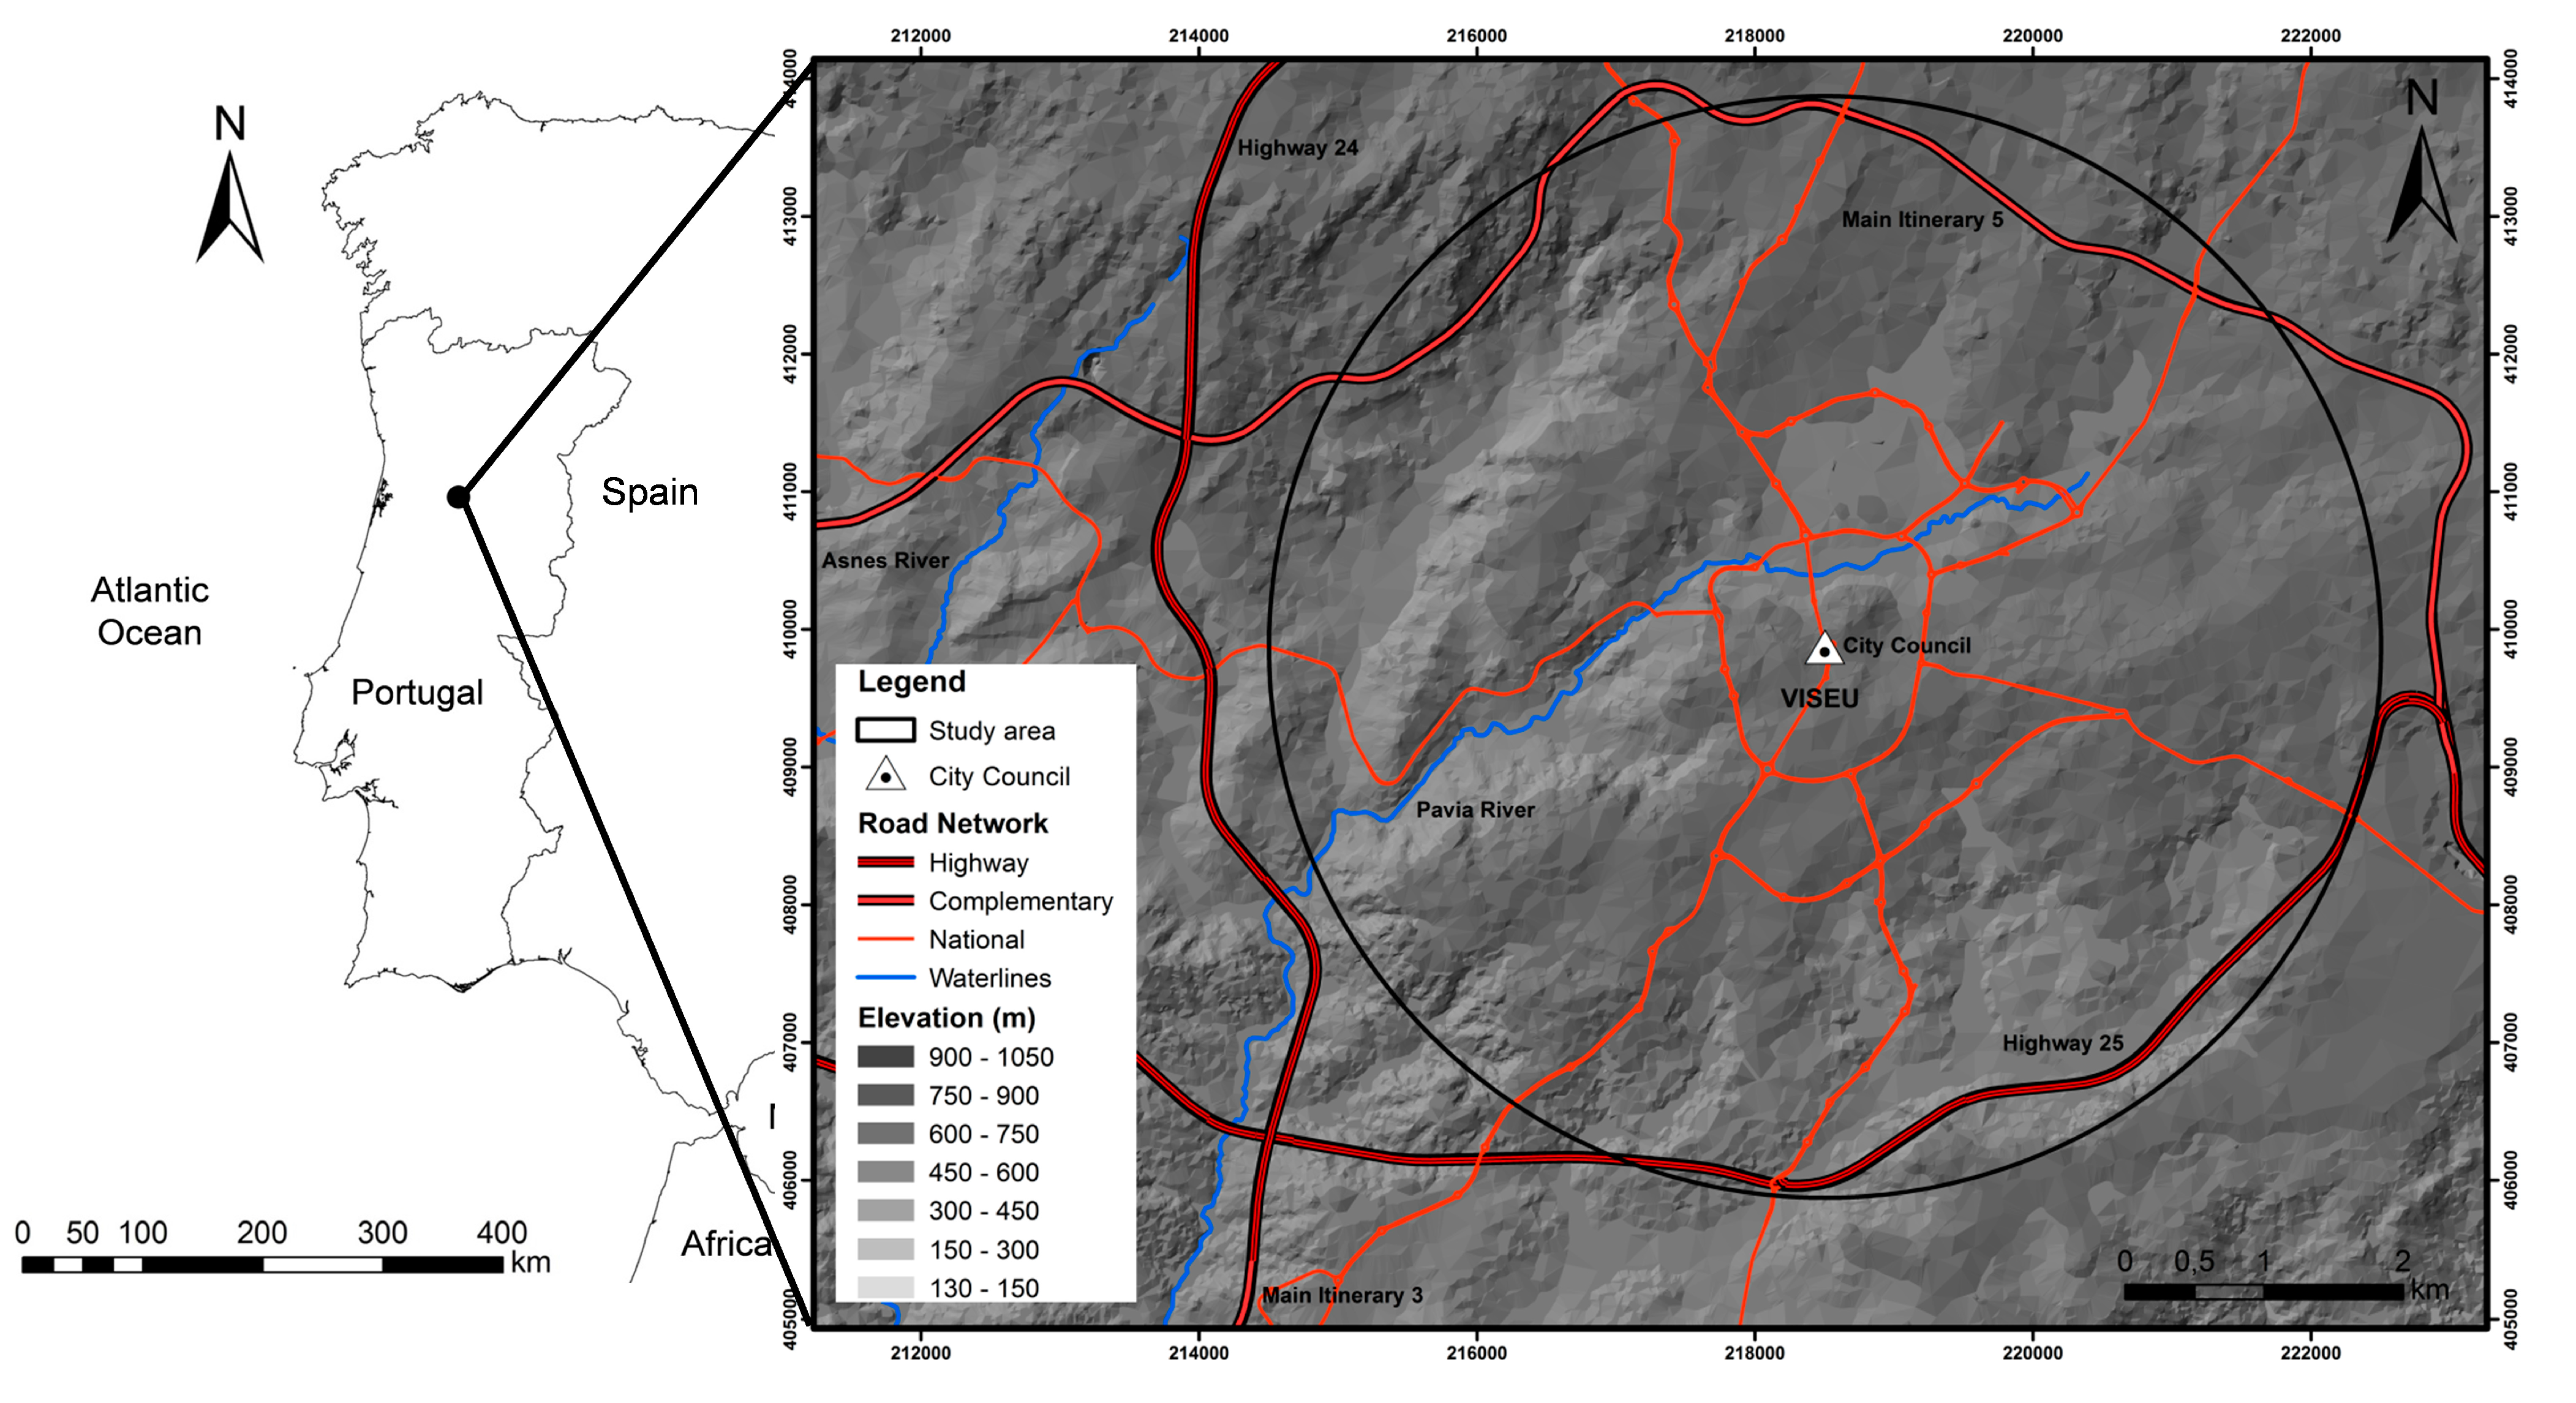
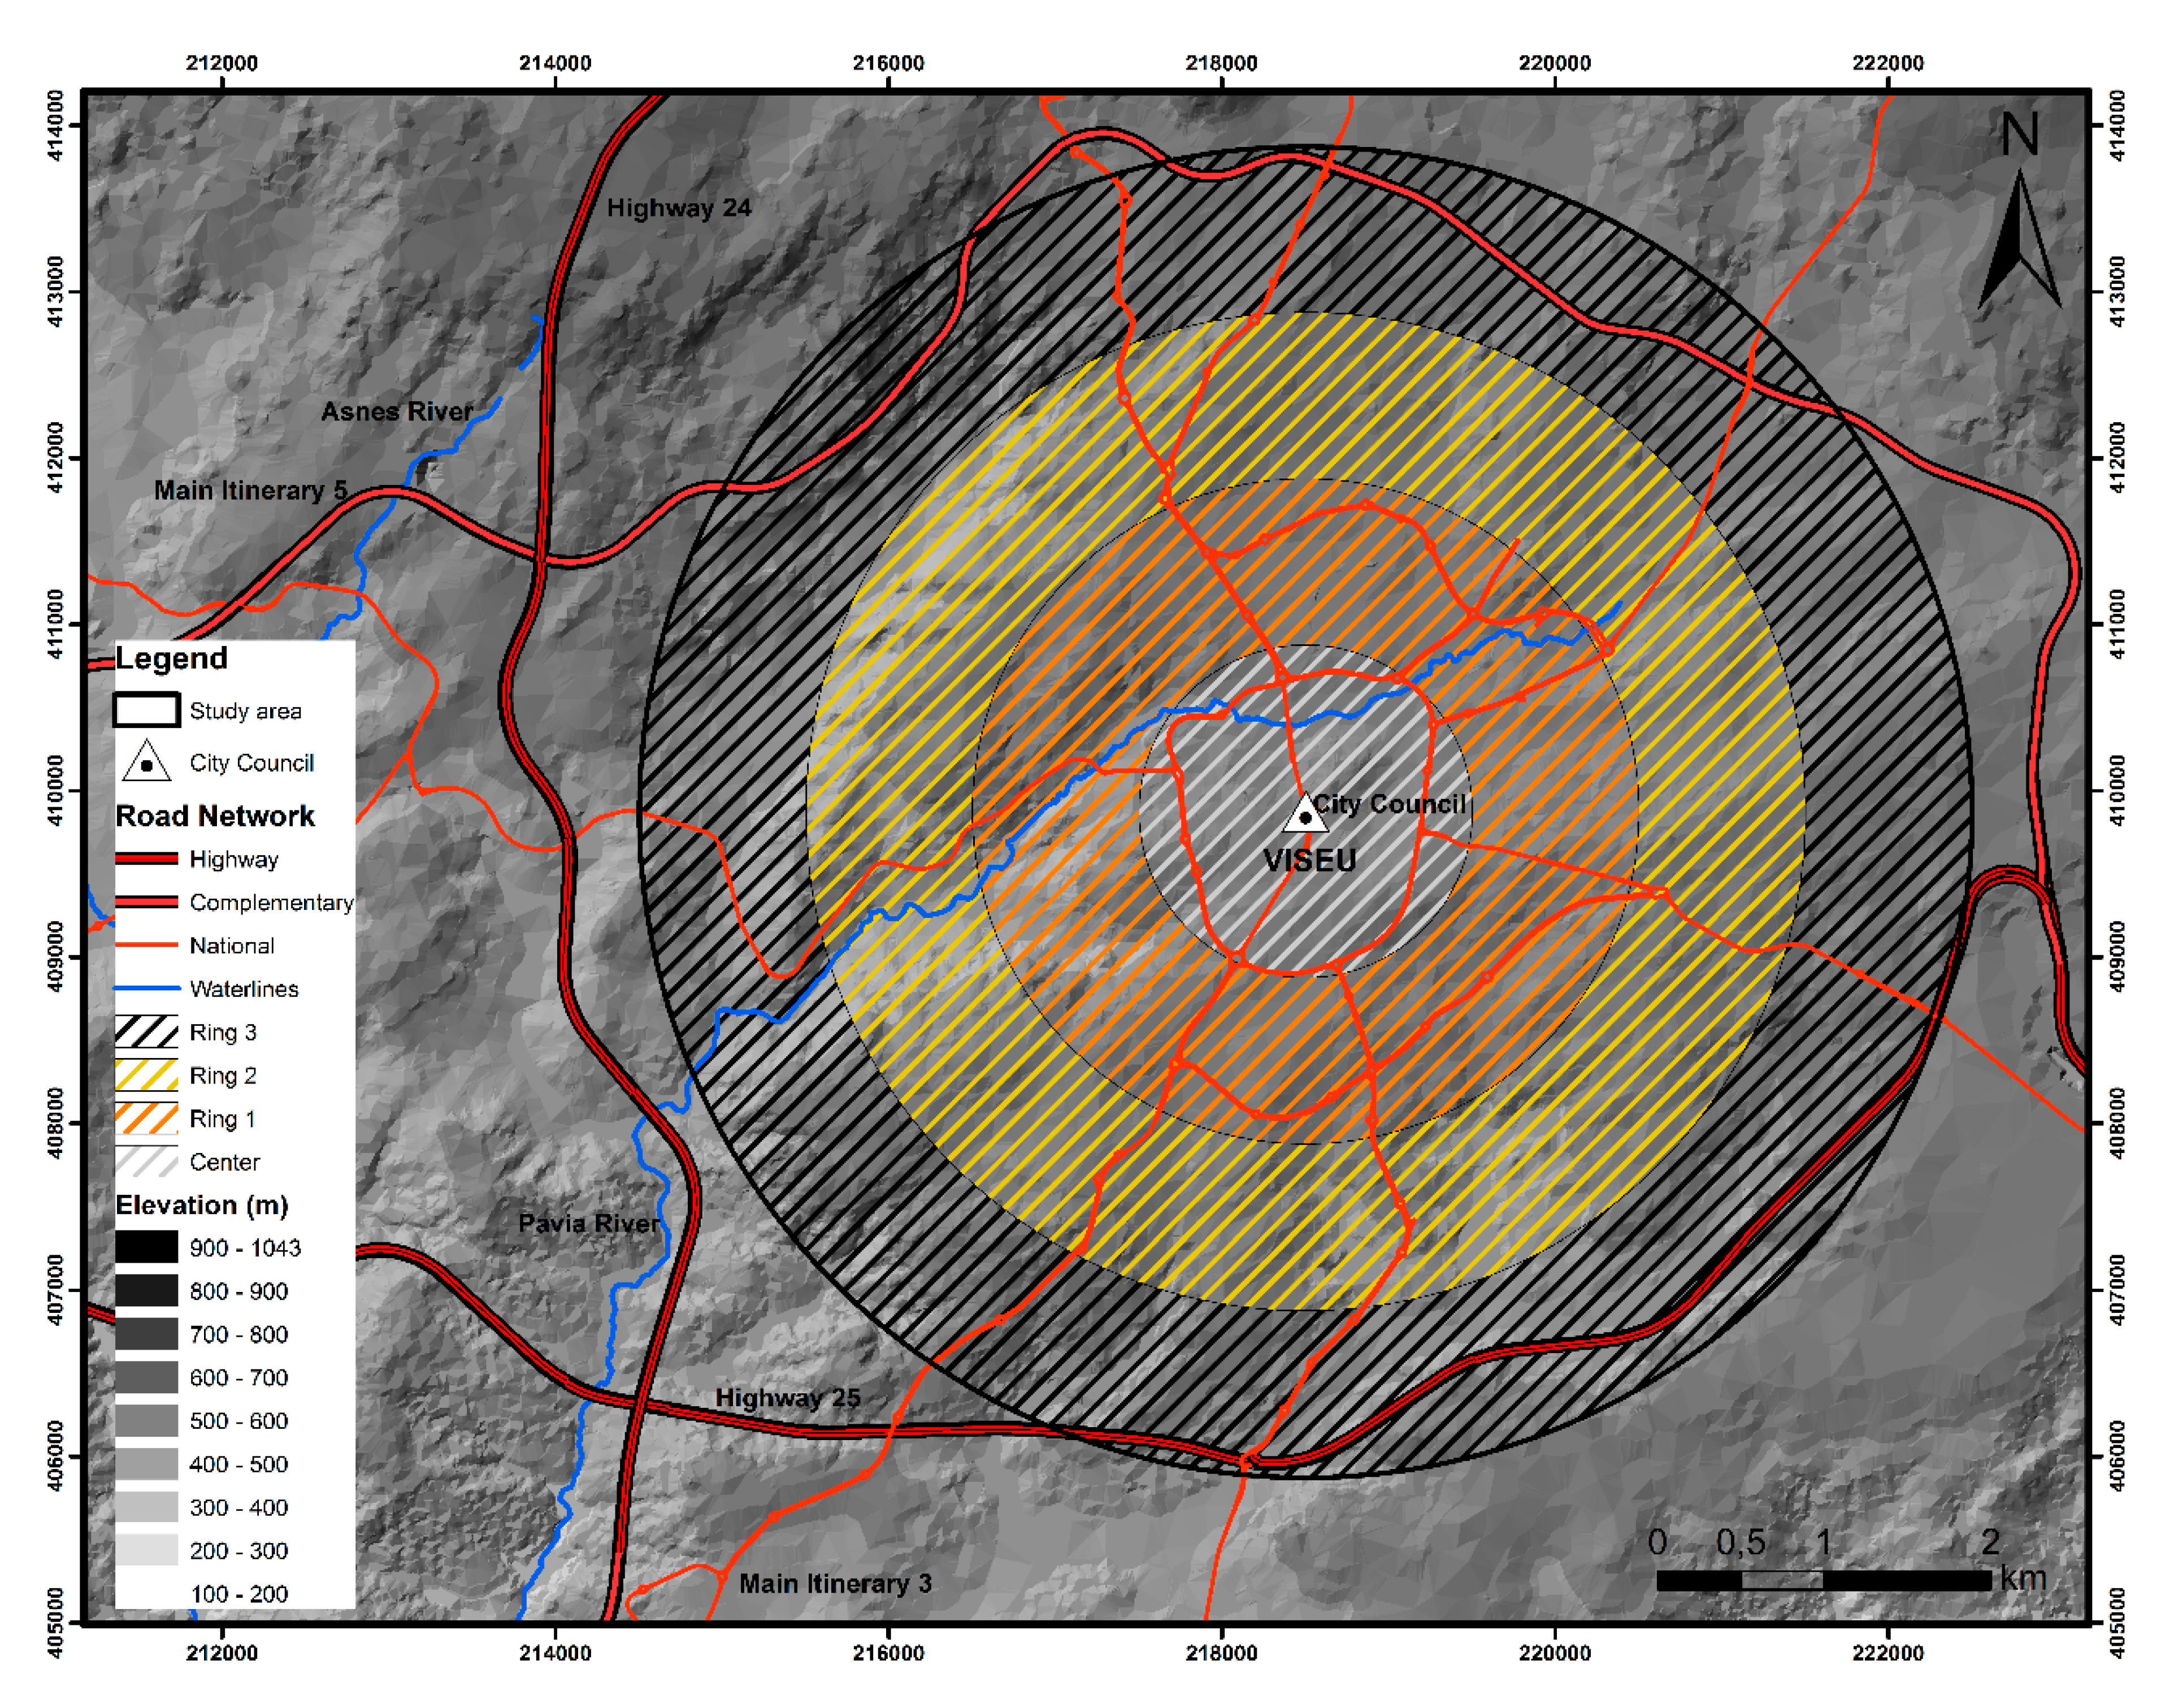
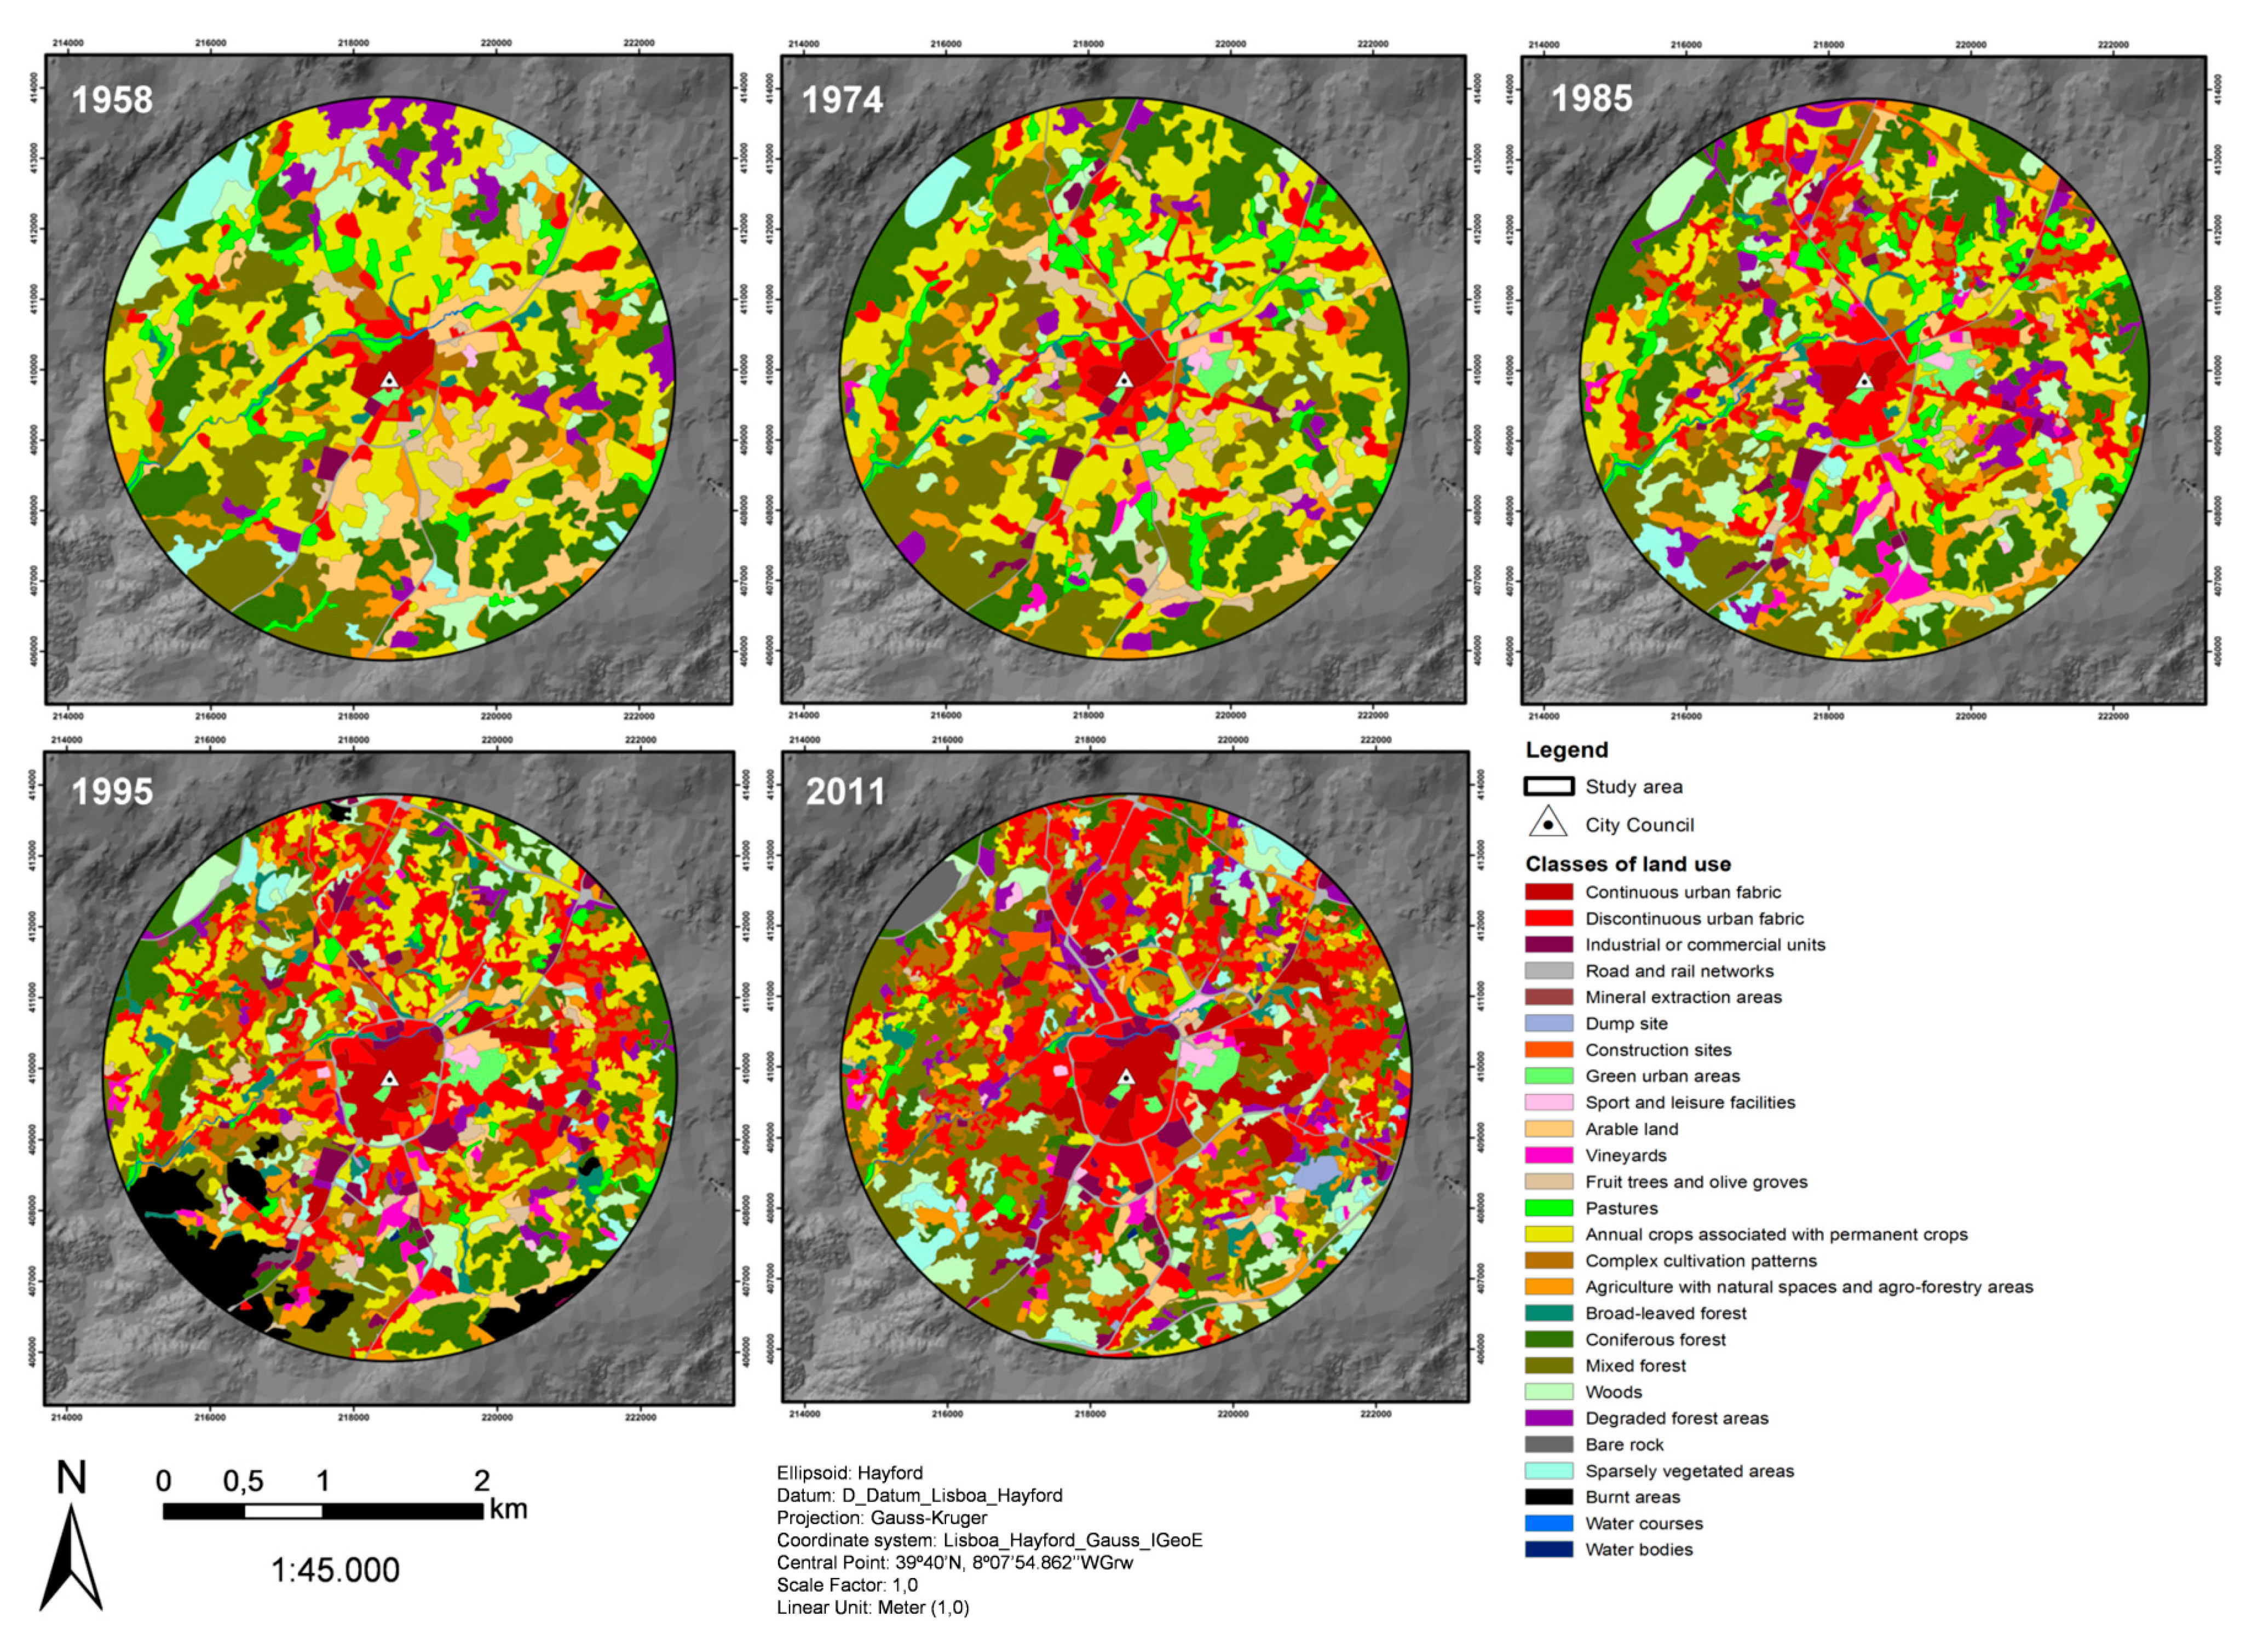
2.1. Study Area

The study area is located in the Central Region of Portugal and it is a part of the municipal area of Viseu (Figure 1). The county of Viseu is a district capital and centre of the NUT III (Dão-Lafões), which presents one of the highest population consolidations in the inland of Portugal, polarizing several neighbouring municipalities.
Figure 1. Location of the study area.
Sustainability 07 11727 g001
In morphological terms, the area is surrounded by mountains where the regional hypsometric values can reach 1043 m about 17 km away from the city centre. The study area is characterized by hills sometimes marked by river valleys, with altitudes values ranging from 300 to 600 m, approximately.
The geology of the area consists essentially of hercinic granite rocks, with small expressions of metasedimentary rocks and sedimentary and alluvial deposits preserved in tectonic depressions and related to the large rivers that cross the region [41].
The region has a Mediterranean climate with a well-defined dry season, although short (July and August). The average annual temperatures vary between 10 °C and 15 °C and the annual precipitation ranges from 400 to 2400 mm, with unstable winter atmospheric conditions, due to the influence of mountains, with long lasting periods of concentrated rainfall [42,43].
The land occupation is a further evidence of the heterogeneity of the municipality of Viseu. It is dominated by forest areas, essentially wild pine followed by agricultural areas, uncultivated areas, and artificial areas. The most distant parishes of the city centre have a higher forest area [42].
In biogeographical terms, the municipality of Viseu is located in the Eurosiberian Region. More precisely, the study area represents the Galician-Portuguese Sector, specifically in the Miniense Subsector, that is characterized by the existence of seasoned oak of Rusco aculeate-Quercetum roboris quercetosum suberis and furze (Ulex europaeus and Ulex micranthus) [44].
Regarding human occupation, the municipality of Viseu has 99,274 inhabitants according to the 2011 Census [45]. Figure 2 shows the evolution, in the period 1950–2011, of the resident population in the municipal area and in the parishes that are within the study area. It presents a small variation by the year 1970, with a sequent population increase (24%), where the growth of the municipal population is essentially in the study area.
Figure 2. Demographic and socio-economic indicators: (a) municipal and study area resident population; (b) number of family households; (c) number of electricity consumers; (d) employed population by activity sectors, according the PORDATA database [46].
Sustainability 07 11727 g002
Figure 2 presents some municipal demographic and socio-economic indicators which demonstrate the progressive number of the resident population and the crescent number of family households. The population increase between 1970 and 1990 was influenced by the social integration of returned Portuguese, both from the former colonies and emigrants in Europe. The population and household increase after 1990 expresses the general improvement of well-being after joining the European community and concentration on the city from residents from surrounding rural municipalities. These socio-economic dynamics are expressed by the sharp increase in the number of electricity consumers, accompanying the increase of the population active in the tertiary sector at the same time reducing the importance of the primary sector. Industrialization, in the seventies, and the tertiary activities in the eighties and nineties, were influenced by road infrastructure construction, with the correspondent accessibility improvement.
Those aspects reinforced the increment of centrality and attractiveness of the town, which is expressed by a spatial urban growth, and achieving the characteristics of a medium-sized city in the national context [47], and a small-sized city according the EC definition [48].
To evaluate the land use and occupation changes, and the progressive urban expansion and infrastructure, which reflect the planning framework, a study area was selected, presented in Figure 1. It is centred in the City Council of Viseu, neighbour of the XV ancient town, and has a circular shape with 4 km radius, with 50.26 km2 of area. The circle represents or partially covers nine parishes of the municipal territory, including the urban core and the peri-urban areas.
As mentioned by J. Almeida [47], the urban model of the city of Viseu is defined by a dominant and compact centre and develops in “stellar” form, growing the city quickly to the outside along the pre-existent road network, which provides the appearance of peri-urban areas of some size, later connected by concentric pathways [48,49]. For S. Almeida [49] the urban fabric development has been conditioned by urban structures, namely the encircling roads, but also the by collective equipment’s location.
In the last 50 years two former master plans influenced urban expansion, the infrastructure network, and the constrained areas protection. A city urbanization plan was approved in 1952 and a Municipal master plan was published in 1995, which is currently being replaced. Between these two instruments there were partial plans, such as the Hidroprojecto Urban Plan (1971) and Macroplan Urban Plan (1983) that has never been approved, but with informal application for new urbanization areas, or the Polis Program (2000)—Urban Rehabilitation Program and Environmental Improvement of Cities. In Figure 3 some of the cartographic extracts of these plans are represented, emphasizing that by 1983 the plans were partial, focusing mainly in the urban core of the city, and in 1995 acquired the municipal level, which has been complemented by plans further detailed (layout plans, urbanization plans, and a rehabilitation plan), and also the 2013 Municipal Master Plan under approval.

2.2. Land Cover Data

The analysis of the land use and occupation change was supported by a set of five photographic mosaics from different periods, between 1958 and 2011, as described in Table 1. According to the initial characteristics of the images, they were digitalized, georeferenced, processed and analyzed using the ArcGIS 10.2 software (ESRI®). To adjust the different imagery scale three procedures were carried out (single operator, minimum unit of area, and backward analysis). Due to differing contrast levels, the 1958, 1974, and 1985 images had to be cross-referenced with other topographic representations. In order to integrate images from different sources consistently, a supervised analysis was performed using fieldwork as a control. A Datum_73_Hayford_Gauss_IGeoE was used as the geographic coordinate system in the process of georeferencing.
Figure 3. Examples of cartography associated to the planning framework of Viseu: (a) Urbanization Ante-Plan (1952); (b) Macroplan Urban Plan (1983); (c) Municipal Master Plan (1995); (d) Layout Plan (2008); (e) Spatial plan classification (Municipal Master Plan, 2013).
Sustainability 07 11727 g003
Table 1. Data source characteristics.
DateFormatType imageScaleSource
1958PrintBlack & White1: 26,000IGeoE
1974DigitalBlack & White1: 15,000IGP
1985DigitalBlack & White1: 15,000IGP
1995DigitalFalse colour1: 10,000CNIG
2011DigitalColour1: 10,000IGP
IGeoE: Army Geographic Institute; IGP: Portuguese Geographic Institute; CNIG: National Center of Geographical Information.
In another phase, based on the categories of land use and occupation of the Corine Land Cover [50], a classification system has been developed and identified by classes organized according to numerical codes (Table 2) [51,52].
Table 2. Classification terms.
CodesCorine Land Cover
Classes and SubclassesApplied Classes
111Continuous urban fabric
112Discontinuous urban fabric
121Industrial or commercial units
122Road and rail networks and associated landRoad and rail networks
131Mineral extraction areas
132Dump site
133Construction sites
141Green urban areas
142Sport and leisure facilities
211Non-irrigated arable landArable land
221Vineyards
222Fruit trees and berry plantationsFruit trees and olive groves
223Olive groves
231Pastures
241Annual crops associated with permanent crops
242Complex cultivation patterns
243Land principally occupied by agriculture, with significant areas of natural vegetationAgriculture with natural spaces and agro-forestry areas
244Agro-forestry areas
311Broad-leaved forest
312Coniferous forest
313Mixed forest
321Natural grassland
322Moors and heathlandWoods
323Sclerophyllous vegetation
324Transitional woodland/shrubDegraded forest areas
332Bare rock
333Sparsely vegetated areas
334Burnt areas
511Water courses
512Water bodies
Then, the classification of polygons of land use from each set of images was performed and incorporated into the geographic information system generated [17,18,53] wherein all polygons were classified using a minimum unit of analysis with 1 hectare and supported on a 1:10,000 scale.

2.3. Spatial and Temporal Changes in Land Use and Annual Rate of Artificialization

In order to evaluate the dynamics of land use and occupation a map to map comparison method was used involving the set of successive images, with cross-references to define the transitions of land use and land cover and also the measurement of the stability grade (SG) in each time period.
The maps created for each year were used to produce matrices for the periods 1958–1974, 1974–1985, 1985–1995, 1995–2011, and 1958–2011. In the Table 3, the calculation algorithms for the different indicators considered are presented.
Table 3. Equations of the calculated indicators.
DesignationEquationLegend
Change in land cover
CHi = (pi. − p.i)/p.i
CHi—change in land cover for the period in column i
pi.—the column total for the grid cells
p.i—row total for the grid cells in the same category i
Conversion areas corresponding to gains and losses for a given year
P(i).j = (pj,i − pi,j)/(pj – pi) × 100 i≠j
P(i),j—percentage by type j in the total conversion of category row i
pj,i and pi,j—express the individual entry in the change matrix
Stability grade
SG = [(CixA2…5CixA1)/TA] x 100
SG—indicator of the consistency and represent the global stability of the classes of land use in the year A1 for the year A2…5
CixA2…5—sum of the areas of the different classes (ix) at the subsequent time point
CixA1—sum of the areas of the different classes (ix) at time point 1
TA—total area studied (km2)
Annual rate of artificialization of surfaces
AS = [UAn + i − UAi/nTAn + i] × 100%
AS—evaluastudy area
TAn + i—total study area to be calculated at the time point i + n
UA n + i and UAi—surfaces with urban fabric and infrastrutures in the target unit at time i + n and i
n—number of years in each time period
The Equation (1), used in other studies [13,36,54] was applied in order to express the land use transition dynamics between two periods.
The conversion areas corresponding to gains and losses for a given year, relative to the year under comparison were calculated in relation to the total land-use type using Equation (2).
To express the total area that has not experienced a possible transition to a different category of land use and occupation, the indicator stability grade (SG) was defined as shown in Equation (3).
An annual rate of artificialization (AS) was calculated using Equation (4), expressing the unceasing increase in urbanization, namely related with peri-urbanization. This indicator combines urban transformation processes that express soil sealing and vegetation cover change, from the continuous and discontinuous urban fabric, industrial or commercial units, road and rail networks, mineral extraction areas, dump site, construction sites, green urban areas, and sport and leisure facilities.
In order to understand if the major changes in land use and occupation in the study area occur in the central area or in the periphery, and according to other studies [22,55,56], it was decided to divide the area into 4 different sections with increasing distances from the center point (city hall), as shown in Figure 4.
Figure 4. Subdivision of the study area in four different sections to calculate the stability grade in each one.
Sustainability 07 11727 g004
For this purpose, four buffers were defined with distances of 1, 2, 3, and 4 km respectively, relative to city council point. As a result, a central circle and three rings with increasing distances from the central point were originated. The focus of this analysis was to establish a model of land use change dynamics according with the spatial planning framework which presents different scales and spatial enforcement. Thereafter the stability grade was calculated for the four sections in the five different periods of analysis.
To analyze the relationship between land use change and planning processes in the city of Viseu, different instruments of planning were compiled, between 1952 and 2008. For each of them there was an analysis of the objectives, the type, and area of enforcement.
For these plans, a content analysis of the planning documents and associated reports was made, supported by methods [57,58]. The special protection legal regimes which present constraints to planning and land use transformations were also identified.
Table 4 presents the planning framework for the period of analysis, and also indicates the previous plans and the recent master plan.
Table 4. Planning framework.
Date of ApprovalPlanning Framework DescriptionEnforcement Area
1952Urbanization Ante-Plan, with the major purpose to resolve the intra-urban circulation and regional connectivity.City
1971Hidroprojecto Urban Plan for encircling road definition, urban requalification and new residential neighborhoods proposal.City
1983Macroplan Urban Plan projecting new residential neighborhoods, health and educational equipment’s location, and encircling road consolidation.City
1992RAN—Agricultural Protection Regime, for soils with agricultural potential.Municipal non urban
1988 to 199317 Layout Plans with local occupation proposals and infrastructure implementation rules.Local
1995Municipal Master Plan, establishing a development strategy, a spatial plan model and defining urban policies and regulatory guidelines for the municipal territory.Municipal
1996REN—Ecologic Regime Protection, for sensitive ecological and natural risk susceptibility areas.Municipal non urban
1996 to 984 Layout Plans with local occupation proposals and infrastructure implementation rules.Local
2000POLIS Programme—Urban Infrastructure Planning and Urban Rehabilitation providing urban interventions in disqualified areas and develop green urban areas and leisure facilities.Local
2003 to 20137 Layout Plans with local occupation proposals and infrastructure implementation rules.Local
2013Municipal Master Plan (Revision), with development strategy and an urban consolidation proposal.Municipal
As can be observed, during the period of analysis the first initial plans had a central city enforcement, and were responsible for creating new residential areas, infrastructures and an encircling road network. These plans were supported by local plans for urban occupation proposal. The plans with municipal characteristics and enforcement were approved in 1995, and supported by a regulatory agricultural and ecological protection regime for non-urban areas. Yet, in addition to these plans, some urbanization plans, layout plans and a rehabilitation plan emerged.

3. Results

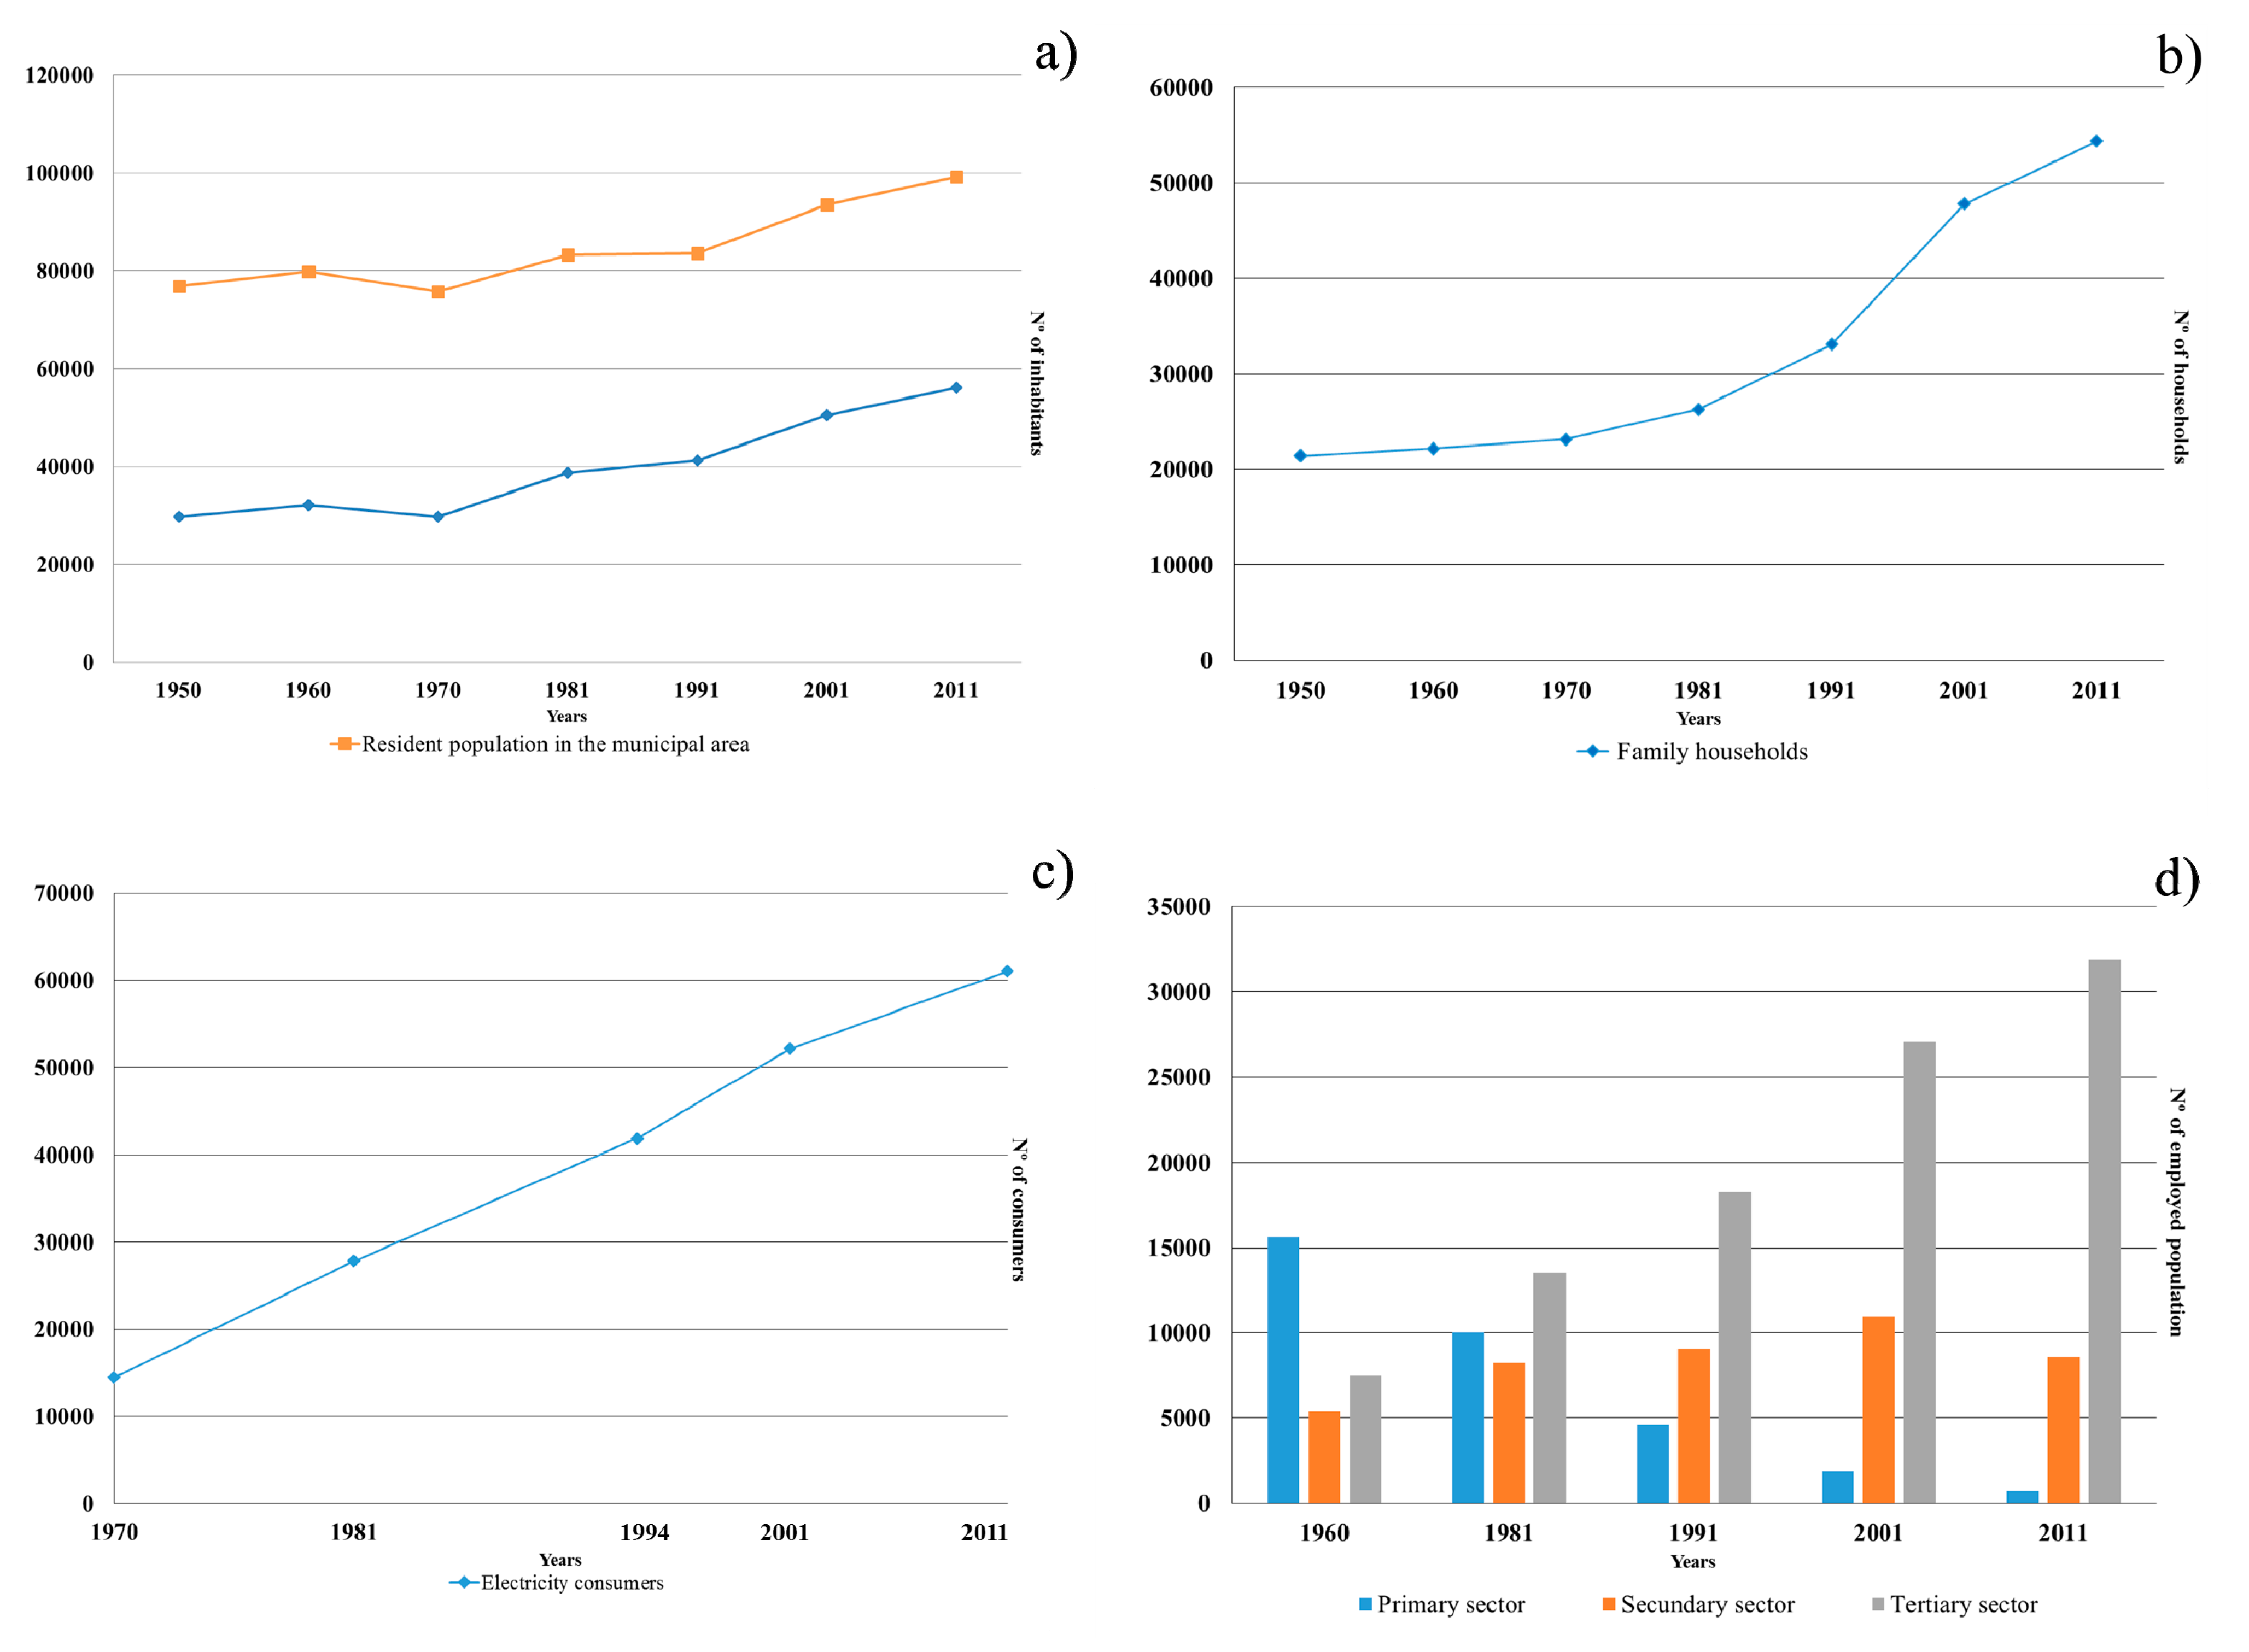
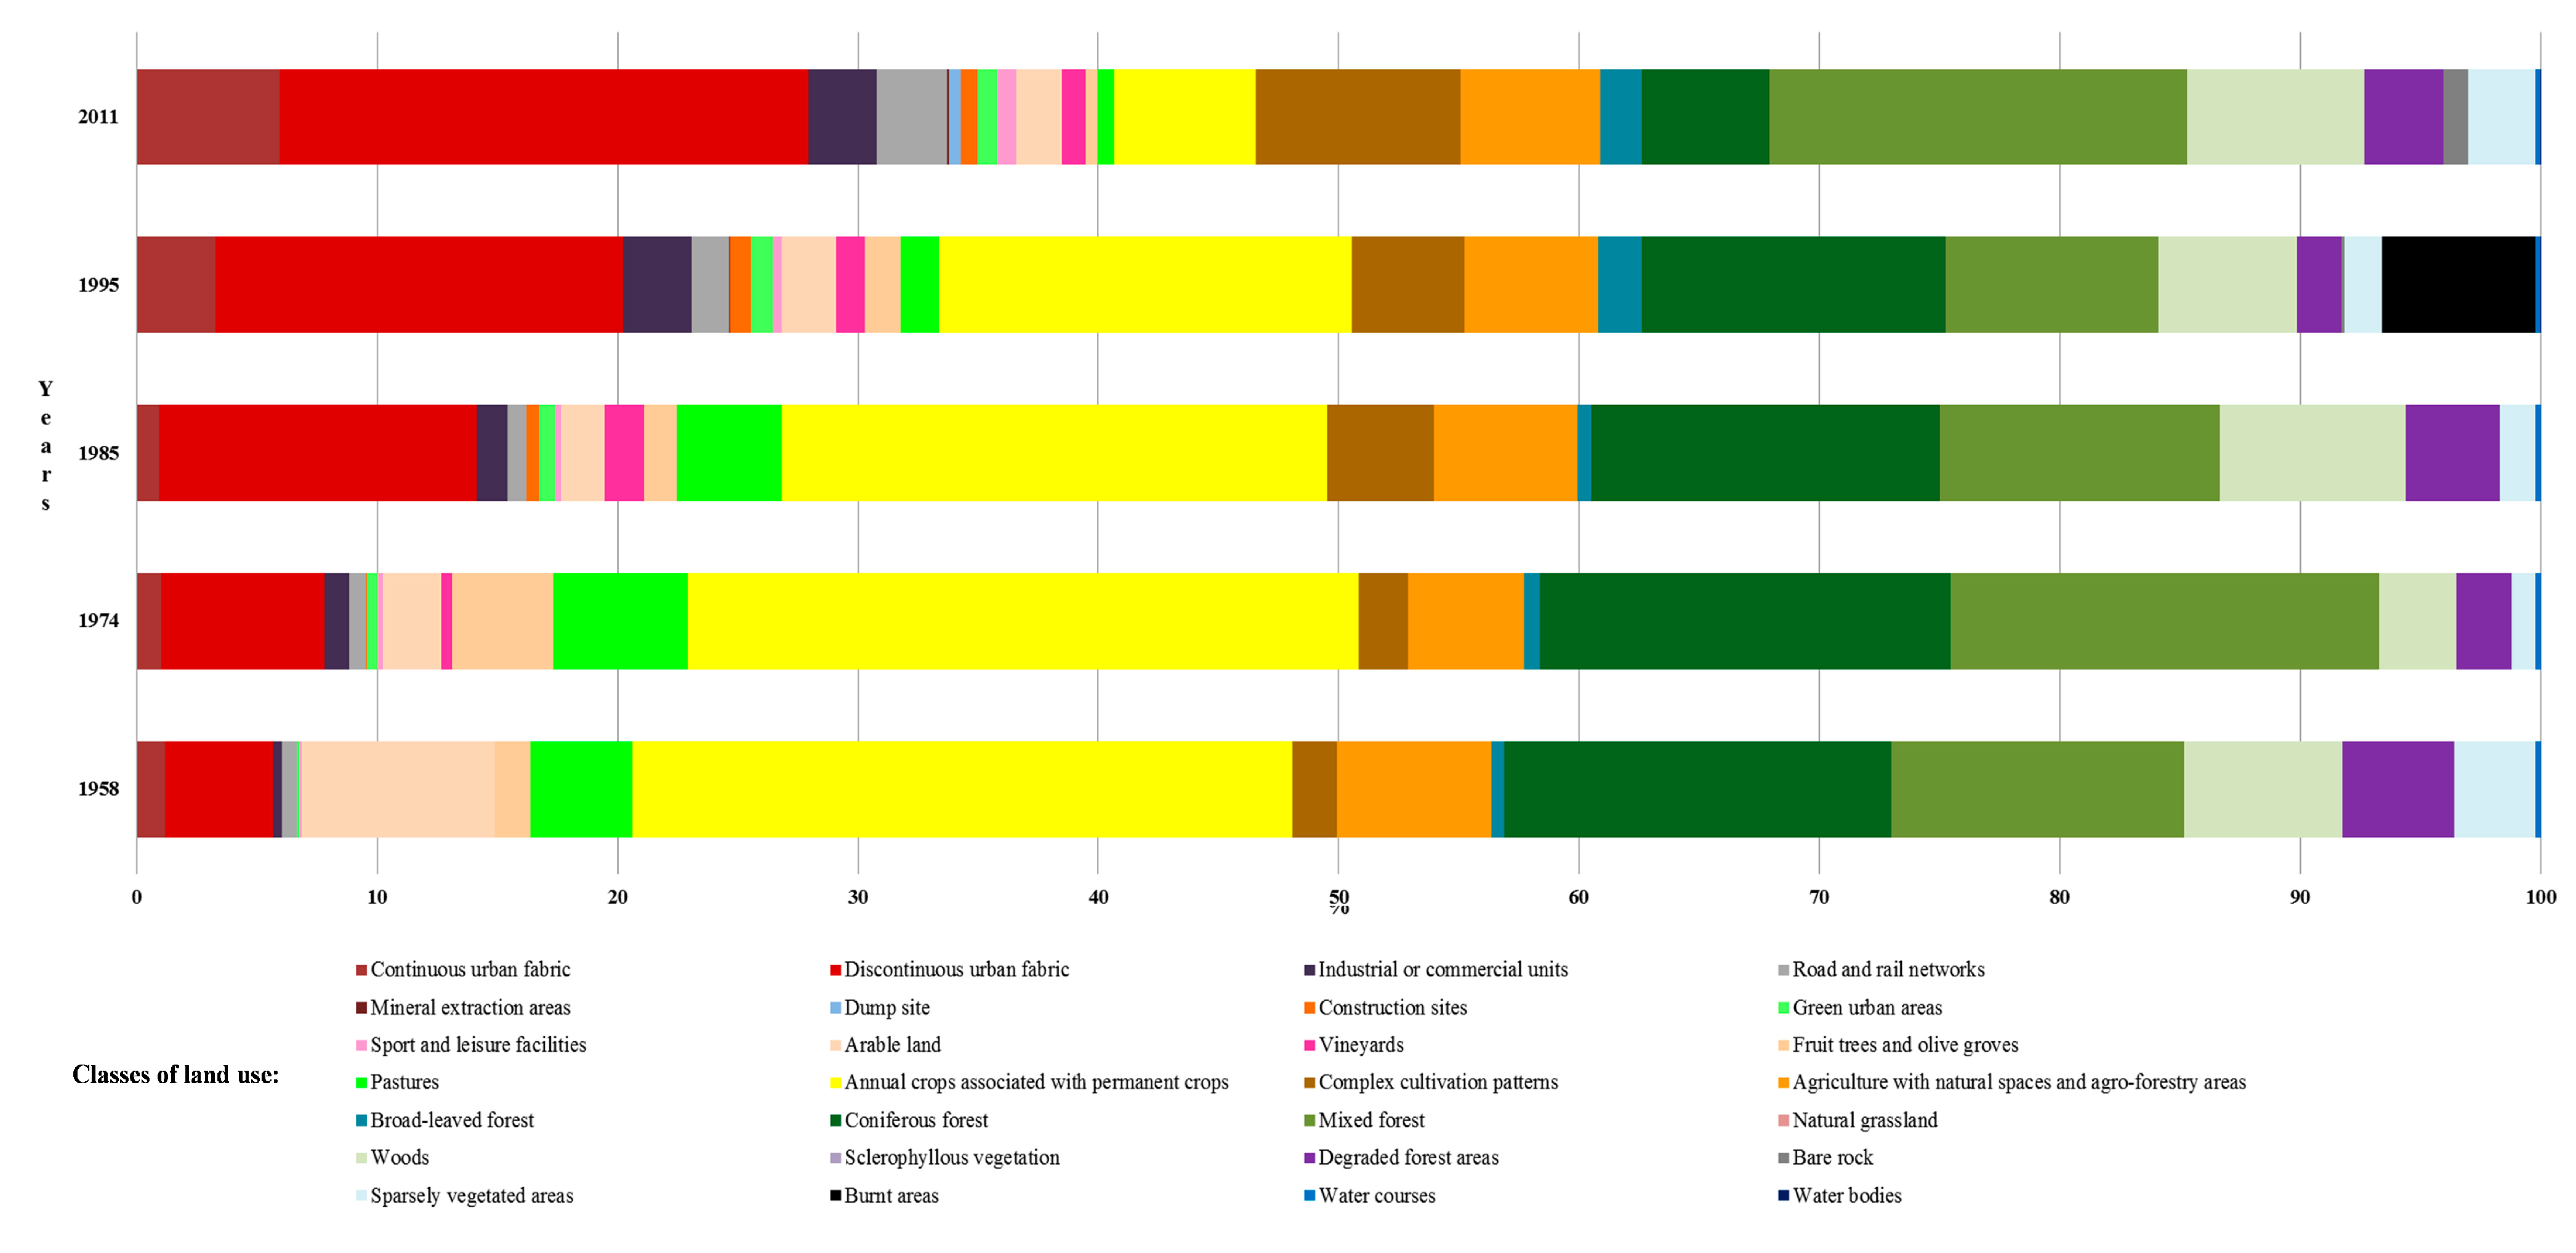
3.1. Temporal Patterns for Land Use Change in the Study Area

Using the methods described a systematic analysis and classification of land use and occupation was produced for the five moments (1958, 1974, 1985, 1995, 2011) in the study area.
Table 5 shows the classes applied to the use and occupation of land, the number of polygons of each class and the respective area and percentage. Twenty six different classes of land use and occupation have been identified in the circle area under the analysis (Figure 5). The images only presented five classes with episodic representation (mineral extraction areas, dump site, construction sites, burnt areas, and water bodies). As observable, over the analysis period there was a steady increase in the urban area, namely on the discontinuous urban fabric. This process was still associated with increasing complex cultivation patterns. Since 1985 there has been a considerable decrease in areas with annual crops associated with permanent crop and pasture use. The display also shows the maintenance of forest areas, with constant values above 30% of the study area.
Figure 5. Representations of subclasses of land use from 1958 to 2011 in the study area.
Sustainability 07 11727 g005
The cartographic outputs present in Figure 6 show differentiated changes in the different sectors of the area with a variety of trajectories. The analysis indicates some systematic transitions involving an increase in urban areas and a decrease in agricultural areas, as well as the transformation of forest types and the episodic occurrence of wildfires. The analysis also reveals a continuous increase in the number of polygons between 1958 and 2011, which demonstrates the fragmentation of the landscape, representing a fast expansion process with new corridors [4] with impacts on natural systems and landscape homogeneity [59,60].
Table 5. Number of patches, areas, and percentages for each land use and occupation in the study area, according to the Corine Land Cover classification.
Classes AppliedPatch (no)Area (ha)Percentage
YearYearYears
195819741985199520111958197419851995201119581974198519952011
Continuous urban fabric11141059.8550.1746.78165.22299.311.191.000.933.295.95
Discontinuous urban fabric3050749294225.15342.33664.74851.491104.774.486.8113.2316.9421.98
Industrial or commercial units21117363118.1851.2363.90143.19142.950.361.021.272.85284
Road and rail networks2112231.2836.6639.2678.83146.220.620.730.781.572.91
Mineral extraction areas 12 1.795.89 0.040.12
Dump site 12 1.1223.17 0.020.46
Construction sites 16107 1.5927.0042.5336.63 0.030.540.850.73
Green urban areas122646.6422.7234.0045.7541.470.130.450.680.910.83
Sport and leisure facilities124594.489.5911.1719.2939.280.090.190.220.380.78
Arable land2011121625403.45121.7591.74113.393.718.032.421.832.251.86
Vineyards 4181516 23.2281.5660.5750.27 0.461.621.211.00
Fruit trees and olive groves12382218973.05212.0769.4773.8523.901.454.221.381.470.48
Pastures2647432413213.12280.87218.6980.5335.394.245.594.351.600.70
Annual crops associated with permanent crops38657391571381.421401.641139.36862.04296.8727.4827.8922.6717.155.91
Complex cultivation patterns1327575912192.03103.69223.73236.81428.841.832.064.454.718.53
Agriculture with natural spaces and agro-forestry areas4547636783322.89242.37300.87278.81291.446.424.825.995.555.80
Broad-leaved forest7118212427.9632.5128.1890.8186.480.560.650.561.811.72
Coniferous forest3835476436808.75860.43729.02635.46267.4016.0917.1214.5012.645.32
Mixed forest2539495463611.20894.55584.78445.33871.7912.1617.8011.638.8617.34
Woods2736474960331.73161.03388.73289.58371.896.603.207.735.767.40
Degraded forest areas1621302647233.74116.64196.9293.16165.714.652.323.921.853.30
Bare rock 11 6.0350.37 0.121.00
Sparsely vegetated areas122101725169.2250.7775.0178.37141.023.371.011.491.562.81
Burnt areas 10 320.25 6.37
Water courses1223312.2410.5511.4710.9710.270.240.210.230.220.20
Water bodies 11 1.31.34 0.030.03
Total3174535866937455026.385026.385026.385026.385026.38100.00100.00100.00100.00100.00
Figure 6. Land use and occupation in the area studied, based on image classifications by year.
Sustainability 07 11727 g006
In the study area, and having as focal point the city center—center of the considered circle, two different transformations can be observed. Firstly, there is an increase of the urban areas with a continuous fabric, discontinuous fabric, industrial or commercial units, road and rail networks, green urban areas, and sport and leisure facilities, as well as complex cultivation patterns. Secondly, a systematic decrease in the annual crops associated with permanent crops, and a routing on the forest occupation.
The analysis of land use change shows some temporal transitional processes (e.g., forest and semi-natural areas, forest and burnt areas) representing casuistic losses of forest space.
The results also show the growth of pattern complexity and reveal the general increase of the artificial areas from the central part of the study area to the periphery, contrasting with a continuous decrease of the agricultural areas. These results illustrate the peri-urbanization and rururbanization processes with the increase of classes of urban fabric and complex cultivation patterns.

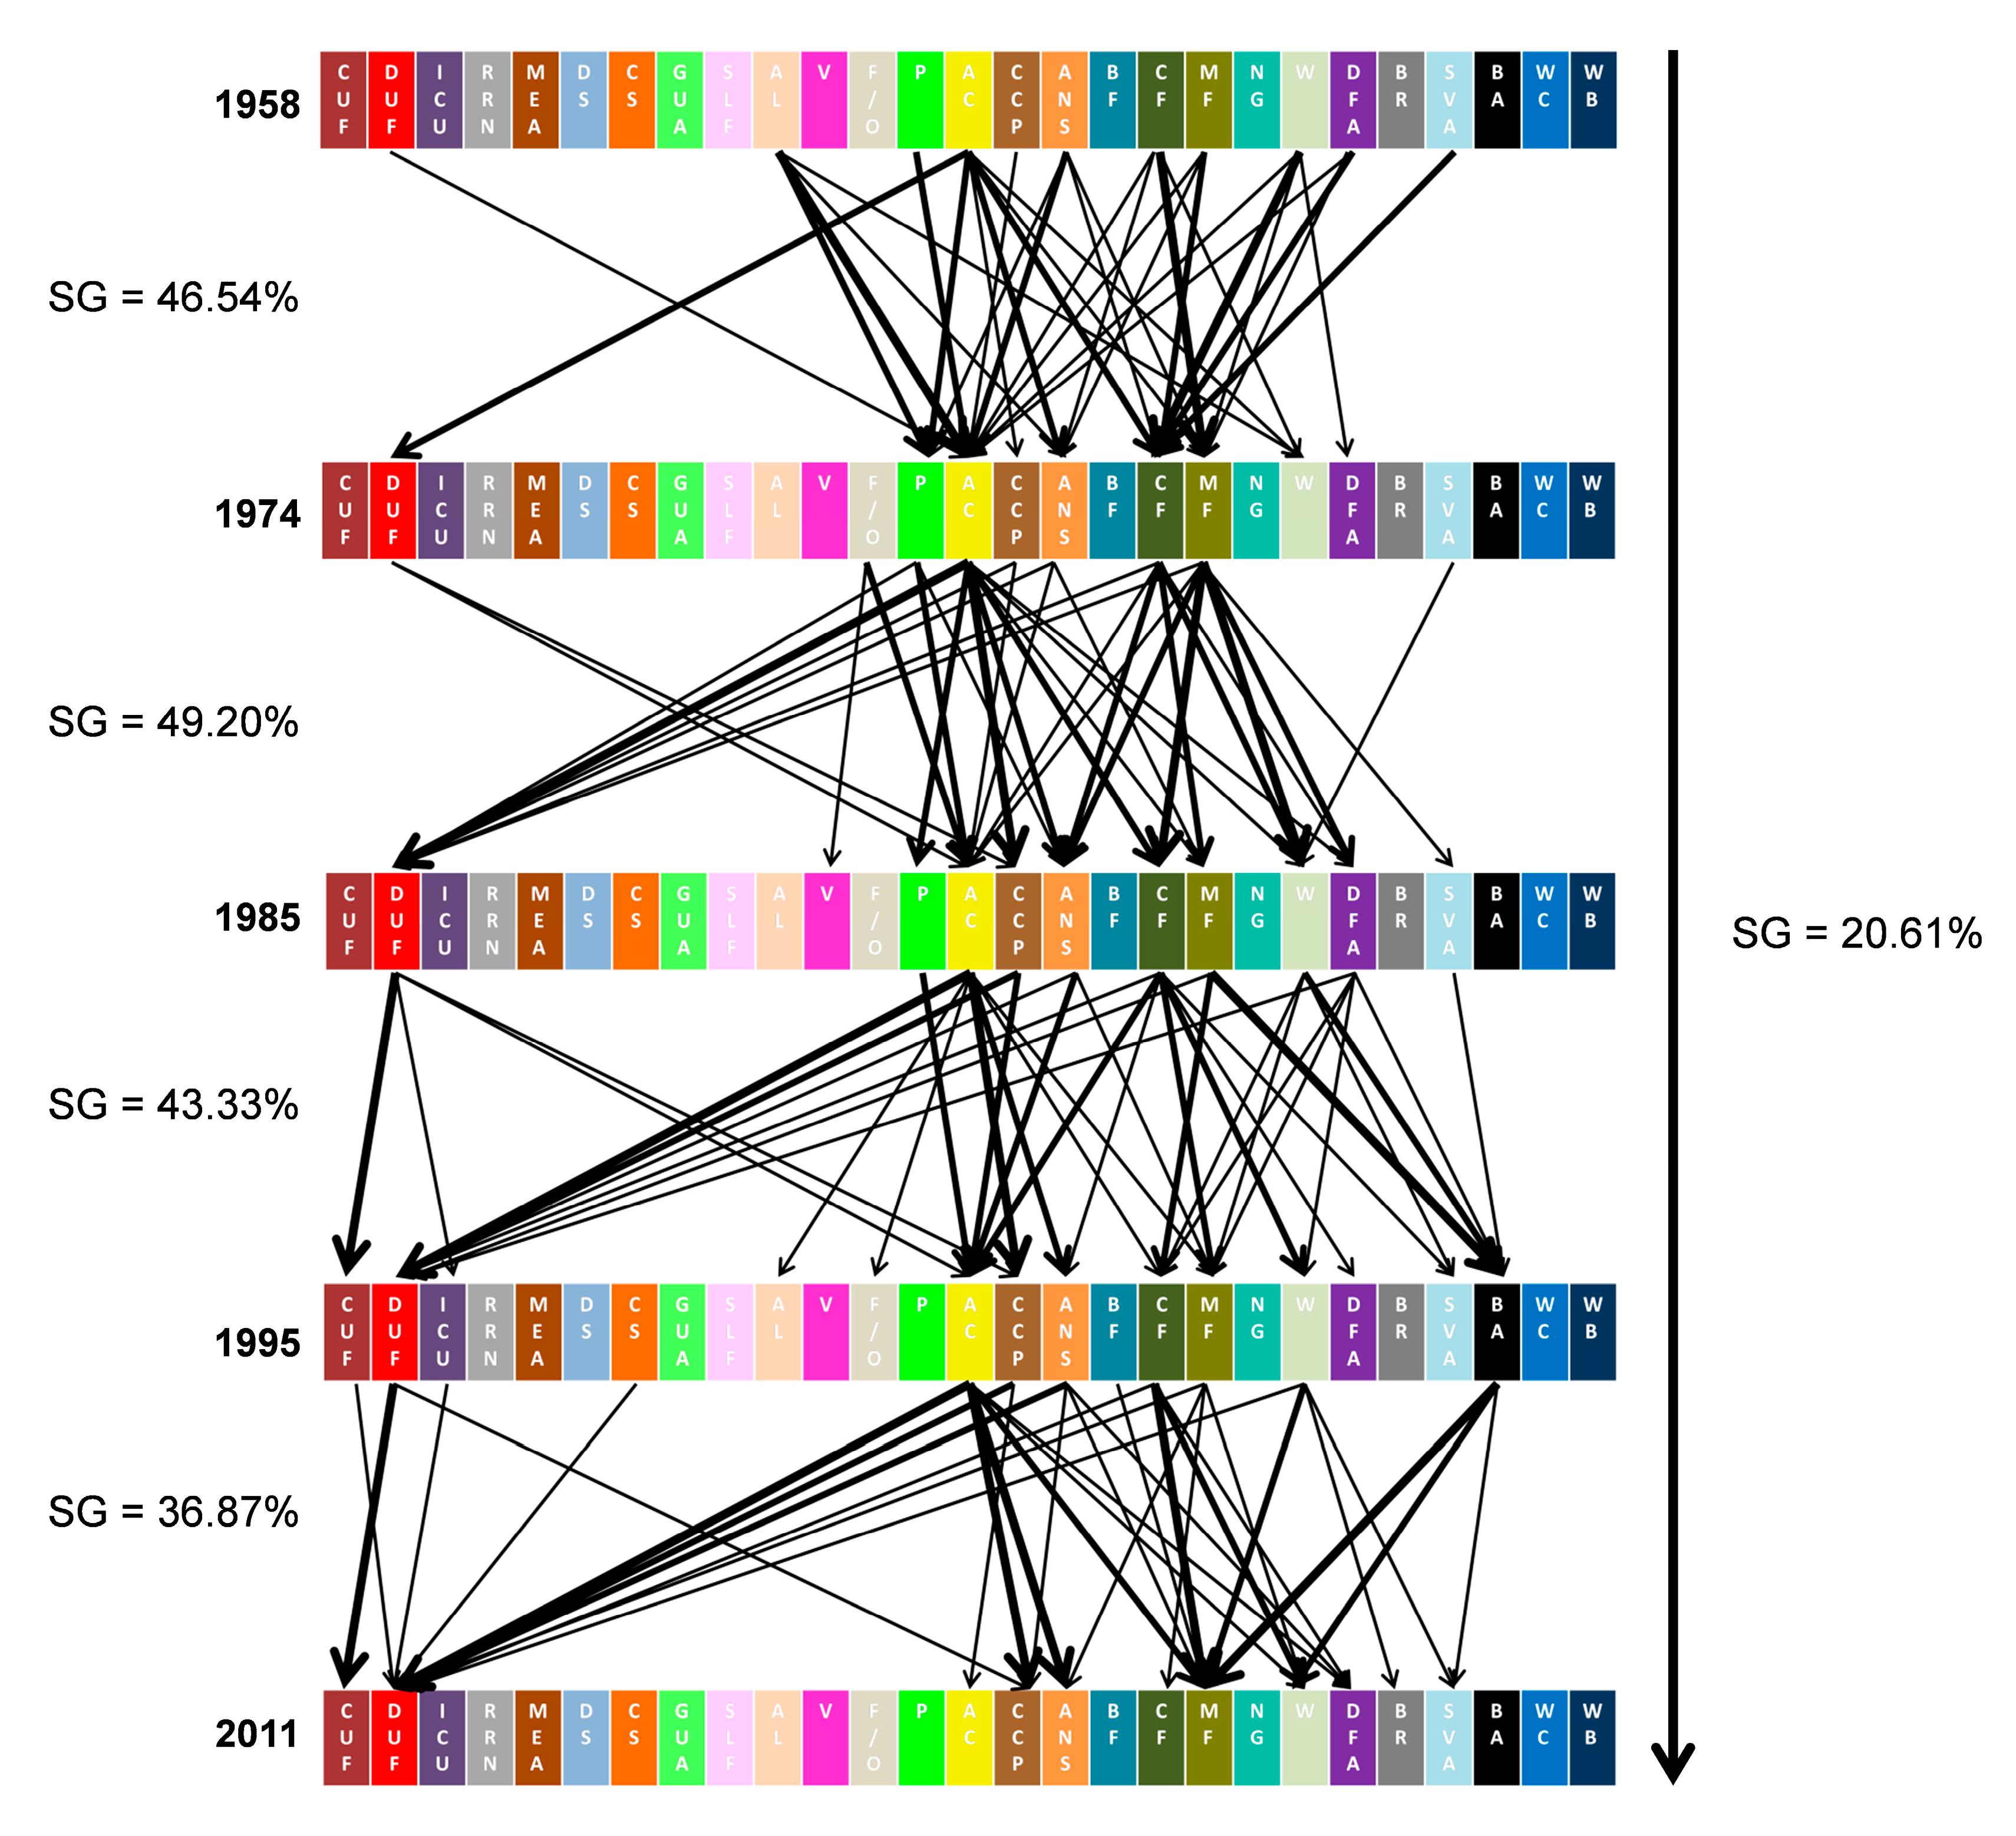
3.2. Dynamic Analysis of Changes in Land Use in the Study Area

The transformation matrices for 1958–1974, 1974–1985, 1985–1995, 1995–2011, and 1958–2011 allowed for a detailed study of the dynamics of land use and occupation in five periods of analysis. For each period of analysis a transformation matrix was generated, and the respective stability grade calculated.
The results obtained in the matrices allowed the creation of a scheme (Figure 7), illustrating the dynamics of land use in the different periods and highlighting the visual trajectory of transformation between classes. The scale used to achieve the results presented in the figure, is comprised of three ranges (0.2 to 0.5 km2; 0.5 to 1 km2, and > 1km2) that represent the higher or lower amount of area transferred between classes from period to period. The results show both the dominant dynamics and the differentiated processes for the various periods analyzed, highlighting specific gains and losses within the overall transformation and indicates a continuous trajectory of urbanization for the overall period (1958–2011), namely supported by the annual crops. The scheme also demonstrated a dynamic involving agricultural areas, with a loss in the annual crops and pastures and a gain in the complex cultivation patterns and agriculture with natural spaces and agro-forestry areas. The period between 1958–1974 shows an increase in the forest, with consequent evolution to woods and degraded forest areas, with the exception of the casuistic transition associated with the burnt areas.
When analyzing the dynamics of land use with the stability grade indicator, it reveals distinctive frames for particular periods. The global stability indicator presents contrasting values ranging from 36.87% (in the period 1995–2011) to 46.54% (in the period 1958–1974). The data shows a discontinuous sequence in which the stability grade increases from 1958 to 1985 and decreases from 1985 to 2011. In the periods 1958–1974 and 1974–1985, the SG values are quite similar (46.54% and 49.20%), but from 1985 to 2011 the SG decreases by approximately 12%, meaning that the largest transitions in land use in the study area took place from 1985 onwards.
In order to express the percentage of conversions in relation to the total land cover type, an internal transition matrix was created, for the period 1958–2011. Table 6 detailed the gains and losses for the period under analysis (1958–2011) for the 26 classes of land use and occupation. This matrix was obtained by cross-referencing the maps of 1958 and 2011 and the results show the units of change for each land use class and indicate the (%) rate of change. The results in general show an increase in the urban fabric and infra-structures associated, supported by the arable lands, fruit trees and olive groves, pastures, annual crops and agriculture with natural spaces and agro-forestry areas. In the agricultural areas, it is possible to verify an increase in the complex cultivation patterns (360.22%), opposed to the rest of the classes that present losses. Gains in broad-leaved, mixed forest and woods should also be noted. The results also reflect the decrease in coniferous forest, degraded forest areas, and sparsely vegetated areas. The matrix demonstrates the low stability grade (SG) for the period 1958–2011 (20.61%) reflecting the changes and dynamics between the different land use classes. This means that 79.39% of the land cover has experienced changes, showing intensive land use dynamics during the study period.
Table 6. Transformations in land use and occupation in the study area (%).
Land coverLoss or gain in 2011Type (1)%Type (2)%Type (3)%Type (4)%Type (5)%Type (6)%Type (7)%Type (8)%
CUF406.78AC30.10DUF17.35MF14.81AL8.97ANS/AF7.40DFA5.68CF4.38CCP4.18
DUF393.75AC43.53CF15.39W10.00ANS/AF8.01MF7.75DFA6.87FT/OL3.52CCP2.23
ICU741.18AL16.20MF13.00AC12.74CF12.28P11.83ANS/AF9.40DFA5.83W4.99
RRN377.42AC24.75AL15.29DFA10.13CF10.08ANS/AF8.03W7.78MF7.19P6.58
MEA CF66.45AC22.30W11.24
DS MF35.69ANS/AF24.60AL21.09AC12.05CF6.58
CS CF38.07AC27.43P16.33DFA7.50MF7.49AL1.71FT/OL1.24ANS/AF0.23
GUA566.67MF49.83AC22.18BF12.82CCP7.64DUF6.71CUF−2.85AL3.55RRN0.48
SLF850.00AL32.14CF30.16CCP17.14AC12.66MF5.10DFA4.72WC0.62W0.30
AL−76.73AC7.10W1.82CF2.91ANS/AF14.19P1.82DFA1.11DUF8.19MF13.31
V AL34.30AC32.19CF12.25MF9.45ANS/AF9.35W0.78DUF0.55FT/OL0.47
FT/OL−67.12AC−15.04AL−16.10SLF−1.99MF7.91DUF63.08CF−0.28W5.94RRN4.43
P-83.10AC12.16AL−3.16CCP6.87CF177.73SVA−0.34ANS/AF8.04MF22.54BF5.90
AC−78.44AL−2.03P−1.99ANS/AF9.49CF1.39DUF35.30CCP21.99W2.71MF11.53
CCP360.22AC70.80ANS/AF12.81AL9.52CF5.83DFA2.72P3.62W3.27DUF−5.84
ANS/AF−10.46AC−327.34AL−139.70CF−44.80MF116.87W0.34P−45.43DFA24.41FT/OL−16.61
BF230.77AC44.24AL25.29CF21.95P17.92ANS/AF5.31MF3.20CCP3.28W1.20
CF−66.96DFA−0.93W19.38MF35.32AC−2.79SVA1.52AL−1.67ANS/AF2.60CCP3.63
MF42.25CF73.38AC47.99W2.34ANS/AF14.11AL15.82P15.37DFA6.12SVA−9.95
W12.35CF261.31MF−15.18AC73.12SVA16.18DFA17.38ANS/AF0.27AL14.07P17.08
DFA−30.21AC−60.97CF7.43W10.26P−21.10ANS/AF−11.29MF23.43SVA3.68AL−5.07
BR SVA81.13CF18.87
SVA−17.06MF−91.97CF−29.12W23.05DFA−8.88ANS/AF−9.22AL−10.81BF−5.71AC−2.72
BA
WC−9.09P−70.42AC3.96AL−6.62DUF26.71CCP25.30CF−14.12CUF4.08MF10.66
WB AL83.29CF16.71
Land coverLoss or gain in 2011Type (9)%Type (10)%Type (11)%Type (12)%Type (13)%Type (14)%Type (15)%Type (16)%Type (17)%
CUF406.78P3.33FT/OL2.80GUA0.41W0.42RRN0.34ICU−0.23WC0.03BF0.02
DUF393.75AL2.88P3.08SVA1.40BF0.72RRN0.12ICU−0.55WC0.06CUF−4.72GUA−0.27
ICU741.18DUF3.86SVA4.49RRN1.63CCP1.40BF0.91CUF0.44FT/OL0.45WC0.39GUA0.15
RRN377.42CCP6.01SVA5.71DUF−0.89FT/OL1.89WC0.08BF0.01
MEA
DS
CS
GUA566.67SLF0.10FT/OL0.09
SLF850.00BF0.22P0.04ANS/AF0.01
AL−76.73WC0.04RRN5.67FT/OL2.55
V DFA0.47SLF0.13SVA0.04
FT/OL−67.12CCP20.44
P-83.10WC0.78
AC−78.44DFA3.82FT/OL0.68WC−0.01RRN2.62
CCP360.22MF2.68FT/OL2.98WC0.15SVA0.12BF−0.57RRN−2.05
ANS/AF−10.46DUF224.09BF9.87SVA8.26WC−3.50CCP137.21RRN29.36
BF230.77DFA0.58WC0.38DUF−10.80
CF−66.96P0.12DUF25.00ICU2.83RRN2.14
MF42.25FT/OL1.49DUF−26.17BF−0.72CCP−3.47RRN−3.17WC0.08
W12.35FT/OL7.27DUF−219.16CCP−27.42BF−1.74RRN−22.28
DFA−30.21CCP13.48FT/OL−3.41DUF88.83WC−0.38
BR
SVA−17.06P2.13RRN23.27
BA
WC−9.09BF11.22ANS/AF55.99
WB
Figure 7. Dynamic transformations of land use for the study area and the stability grade (SG) for each period. CUF: Continuous urban fabric; DUF: Discontinuous urban fabric; ICU: Industrial or commercial units; RRN: Road and rail networks; MEA: Mineral extraction areas; DS: Dump site; CS: Construction sites; GUA: Green urban areas; SLF: Sport and leisure facilities; AL: Arable land; V: Vineyards; FT/OL: Fruit trees and olive groves; P: Pastures; AC: Annual crops associated with permanent crops; CCP: Complex cultivation patterns; ANS/AF: Agriculture with natural spaces and agro-forestry areas ; BF: Broad-leaved forest; CF: Coniferous forest; MF: Mixed forest; W: Woods; DFA: Degraded forest areas; BR: Bare rock; SVA: Sparsely vegetated areas; BA: Burnt areas; WC: Water courses; WB: Water bodies.
Sustainability 07 11727 g007
The final results show the general gains and losses for the discontinuous urban fabric from annual crops and coniferous forest (positive values), generating continuous urban fabric, industrial and commercial units and green urban areas (negative values). The conversion areas involving agriculture with natural spaces and agro-forestry areas display substantial losses to discontinuous urban fabric, complex cultivation patterns, and mixed forest.

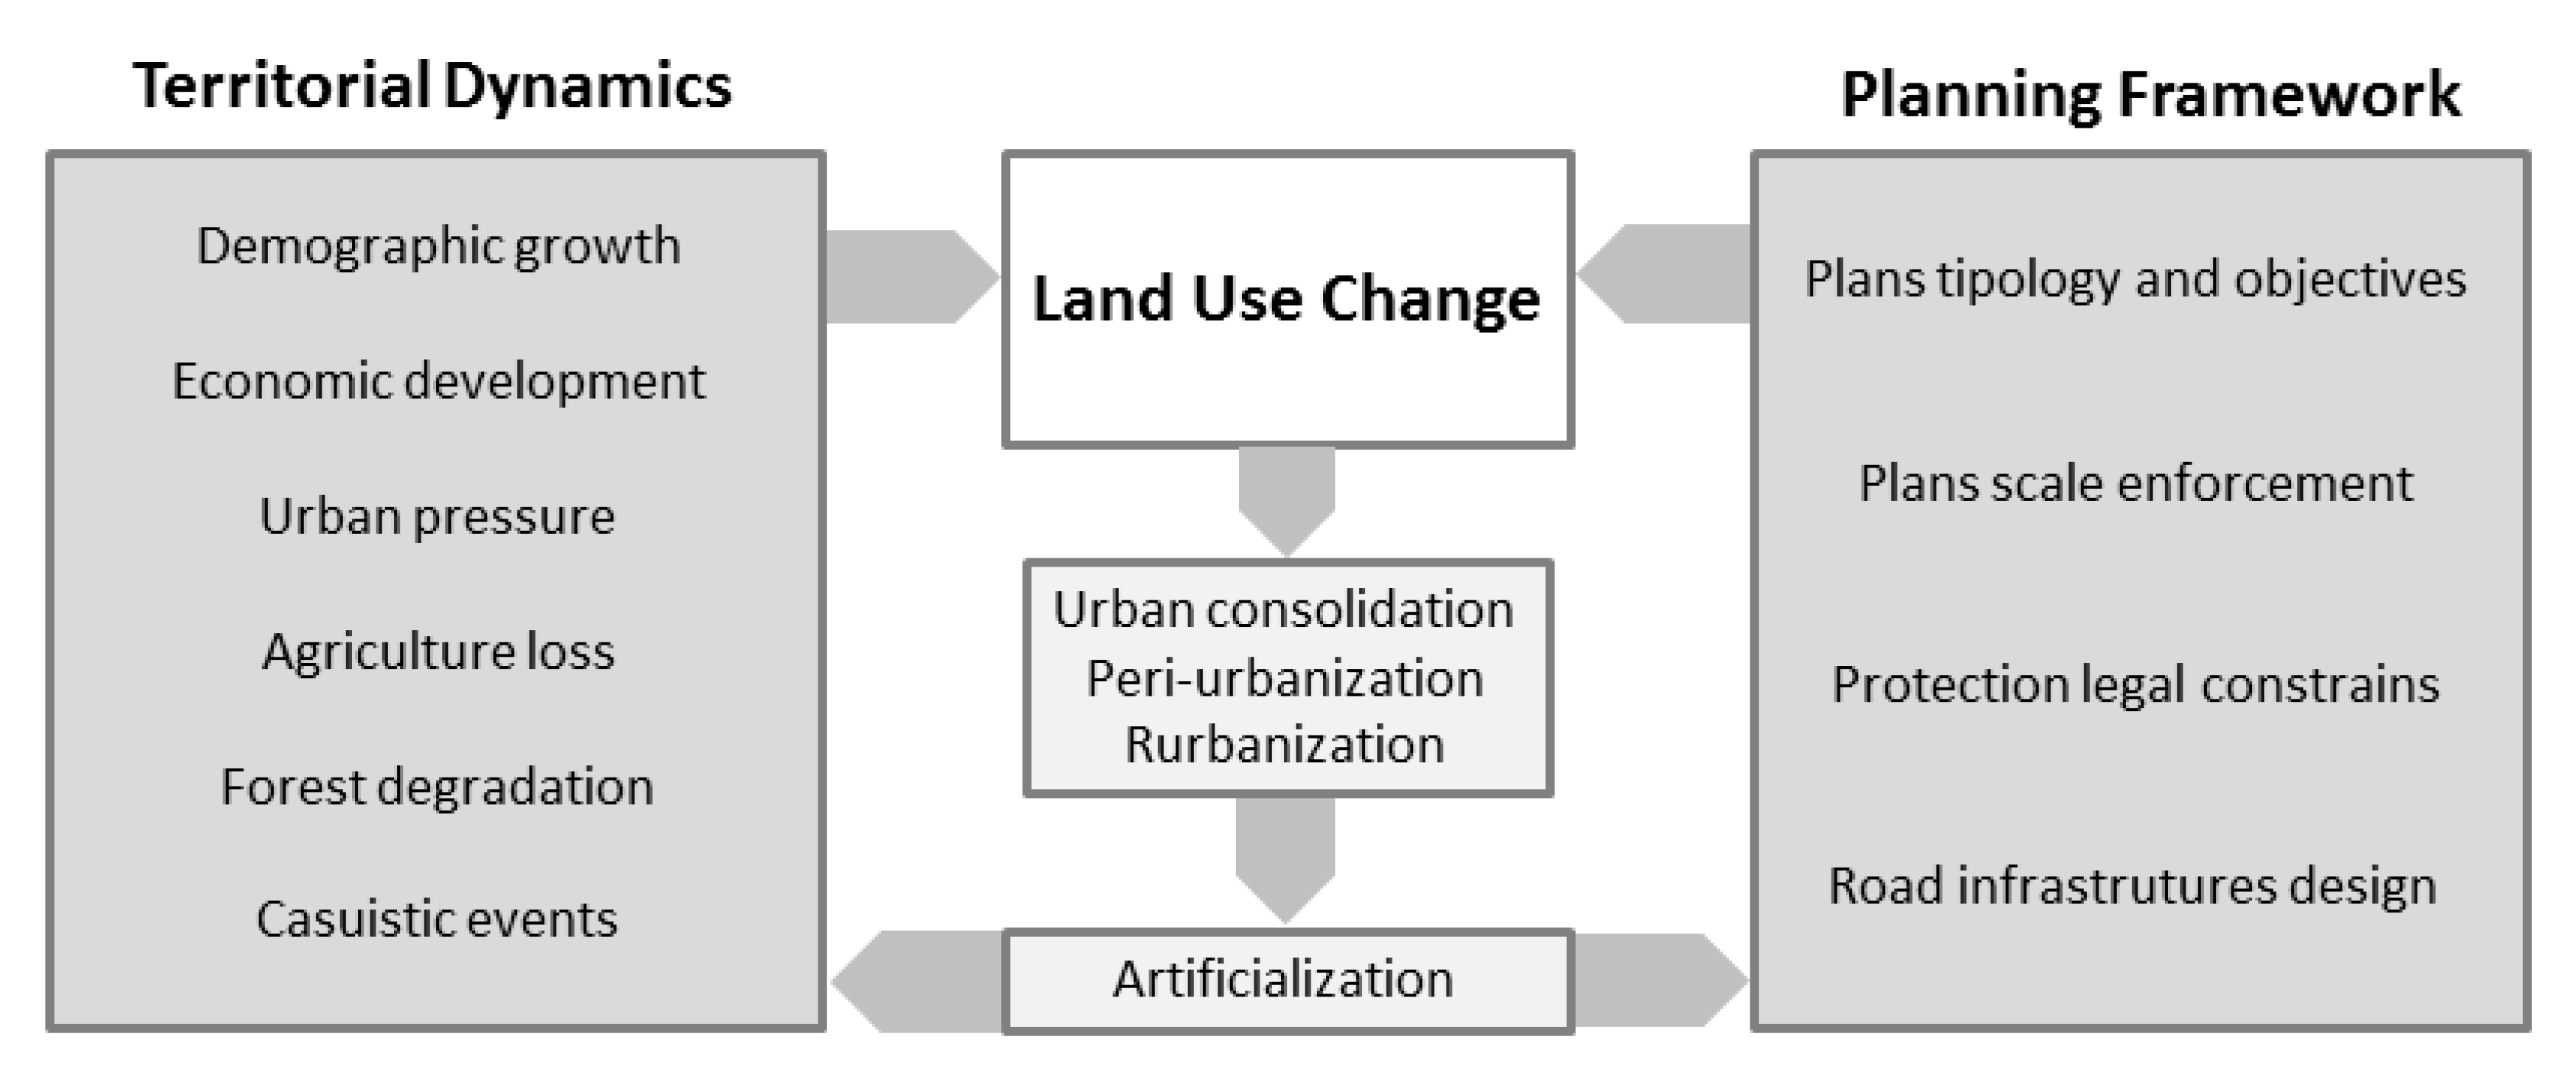
3.3. Model for Land Use Change and Artificialization Processes

Expressing the land use change dynamics in the study area, Table 7 presents the aggregation of five classes of land use, scaling up the classes determined over time the process of artificialization. The results point, for each period, to the gain of artificial areas with the percentage that remains artificial and the one added from other previous land use. This expresses soil sealing, vegetation cover change, and antrophic actions with soil consummation for urban fabric, industrial or commercial units, road and rail networks, mineral extraction areas, dump sites, construction sites, green urban areas and sport and leisure facilities. As can be observed in Figure 6 and Table 7, the biggest transformations happened from the agricultural and shrub vegetation areas. The forest conversion to artificial area is successive, with a major rate in the period 1995–2010.
Table 7. Transformations in land use and occupation in the study area (%).
1958–19741974–19851985–19951995–20111958–2011
Study areaArtificial Areas (%)
Artificial areas78.5581.2785.3189.7790.91
Agricultural areas6.7213.0718.4419.9136.91
Forest areas2.626.616.9413.5726.12
Shrub vegetation areas5.4811.5517.3525.4636.51
Sparsely vegetated areas2.942.048.008.1515.29
CenterArtificial Areas (%)
Artificial areas91.1894.0898.5197.0798.55
Agricultural areas28.0829.3166.2756.5289.80
Forest areas8.7030.4364.2957.1482.61
Shrub vegetation areas0.000.00100.00100.000.00
Sparsely vegetated areas0.000.000.000.000.00
Ring 1Artificial Areas (%)
Artificial areas72.8480.3185.5889.7686.08
Agricultural areas7.0913.2521.0825.3146.10
Forest areas13.3310.8513.3321.3145.03
Shrub vegetation areas9.0915.2231.4845.7650.00
Sparsely vegetated areas33.3333.3326.6746.1540.00
Ring 2Artificial Areas (%)
Artificial areas70.9175.8984.4789.6687.72
Agricultural areas5.0613.8314.6419.0232.30
Forest areas1.199.967.0116.3133.13
Shrub vegetation areas13.6615.8523.5827.2755.43
Sparsely vegetated areas6.2550.0040.0017.7447.06
Ring 3Artificial Areas (%)
Artificial areas70.4269.9076.6283.2880.28
Agricultural areas4.019.5713.9917.1424.88
Forest areas1.303.755.149.8515.84
Shrub vegetation areas1.128.787.2211.1826.05
Sparsely vegetated areas1.360.001.824.248.90
When analyzing the evolution for the center zone and the three rings it is noted that the artificialization of agricultural areas decreases from the center to the periphery, the decrease from 1985 in center area and on ring 1 being especially evident. The artificialization of forest areas occurred rapidly since 1974 in the center area, verifying that there is a progressive use on the different rings, but more noticeably from 1995 onwards.
The use of shrub areas and sparse vegetation for artificialization processes has a tendency of gradual use over time, more evident in the center than at the periphery, but also expressing temporal and spatial peak usage.
This process of artificialization in general involves a sequence of land use change and occupation from: (1) agricultural areas to forest; (2) forest to shrub or sparsely vegetation areas; (3) shrub or sparse vegetation areas to artificial areas, is recognized as common dynamic in the peri-urbanization processes.
The results also emphasize the changes to artificialized areas with an urban fabric and infrastructures associated, namely during the periods of 1985–1995 and 1995–2011.
In order to realize the major changes in the land use and occupation and the relation with the spatial variation from the central area or in the periphery, the partial stability grade (SG) was calculated for the 4 sections considered, in the five different periods of analysis.
Looking to the stability grade study into the four sectors, the dynamics of land use also reveal distinctive frames, as we can see in Figure 8, which shows the results of the stability grade of each sector in the different periods of time analyzed.
Figure 8. Stability grade for the 4 sections of the study area in the periods of analysis.
Sustainability 07 11727 g008
The Figure 8 analysis shows a similar trend in the periods 1958–1974 and 1974–1985 for stability grade, where the SG decreases in the following order: central sector, ring 3, ring 1 and ring 2. This means that larger changes occur in the intermediate sectors (ring 1 and ring 2) in relation to the proximity to the city center, but also expressing the city planning framework. This made a tight transformation process for the excluded plan areas in the fringe of the central area possible, and potentiated the peri-urbanization and rururbanization processes. In the period 1985–1995 the trend of SG is different, presenting a continuous decrease from ring 3 to the central sector, showing that the dynamic of land use is more intensive in the urban core of the study area with the influence of the Hidroprojecto Urban Plan (1971) and Macroplan Urban Plan (1983) that increased the artificialization. In the last period (1995–2011), with a municipal master plan that includes all the sectors in the planning framework, the trend is the inverse of the period 1985–1995, with a continuous decrease from the center to the ring 3. In this period the high value of the SG in the central sector (63.06%) is tangible compared with the rings 1, 2 and 3, which means that larger changes occurred in the peripheral zones of urban core. The stabilization of the urban core and consequent intensive dynamics of land use in peripheral zones are in accordance with the directives of the Master Plan approved in 1995.
When analyzing the overall trend for the period 1958–2011, it can be observed that the periurbanization and rururbanization processes that occurred outside the boundaries of the planning framework trace the whole evolution of land use and occupation, corresponding to both ring 1 and ring 2 low stability grades (18.60% and 17.22%, respectively).

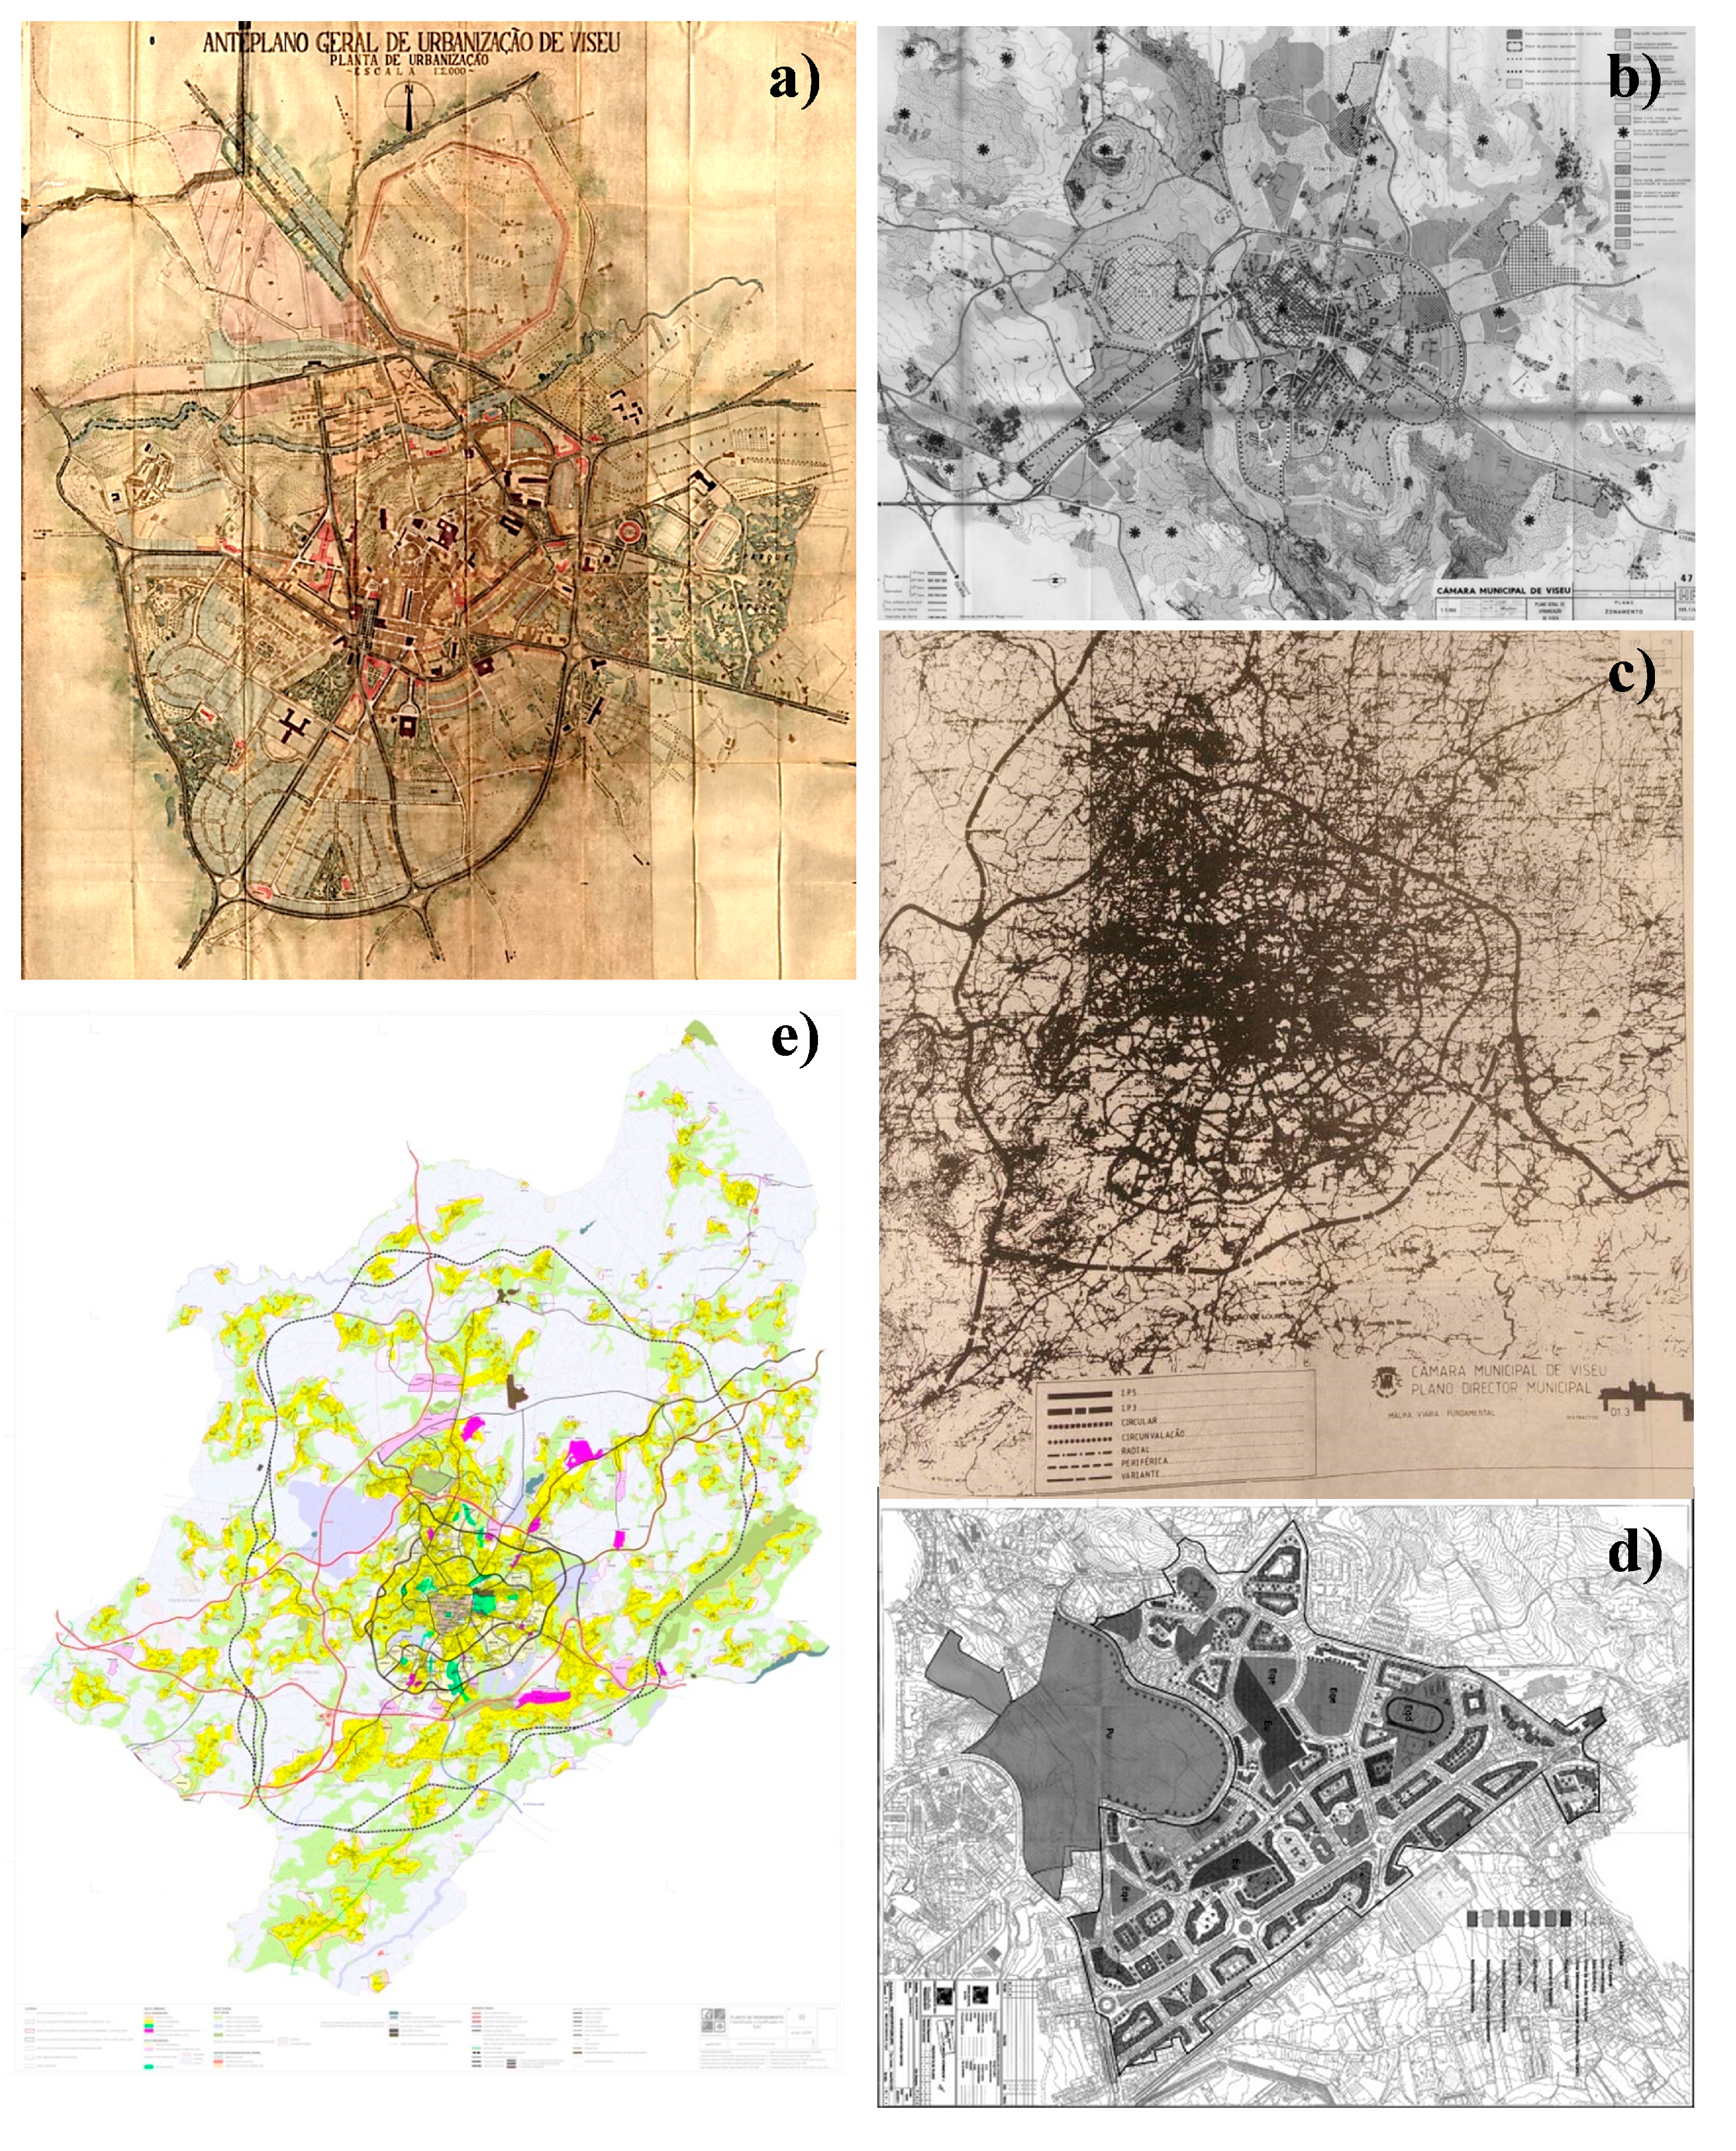
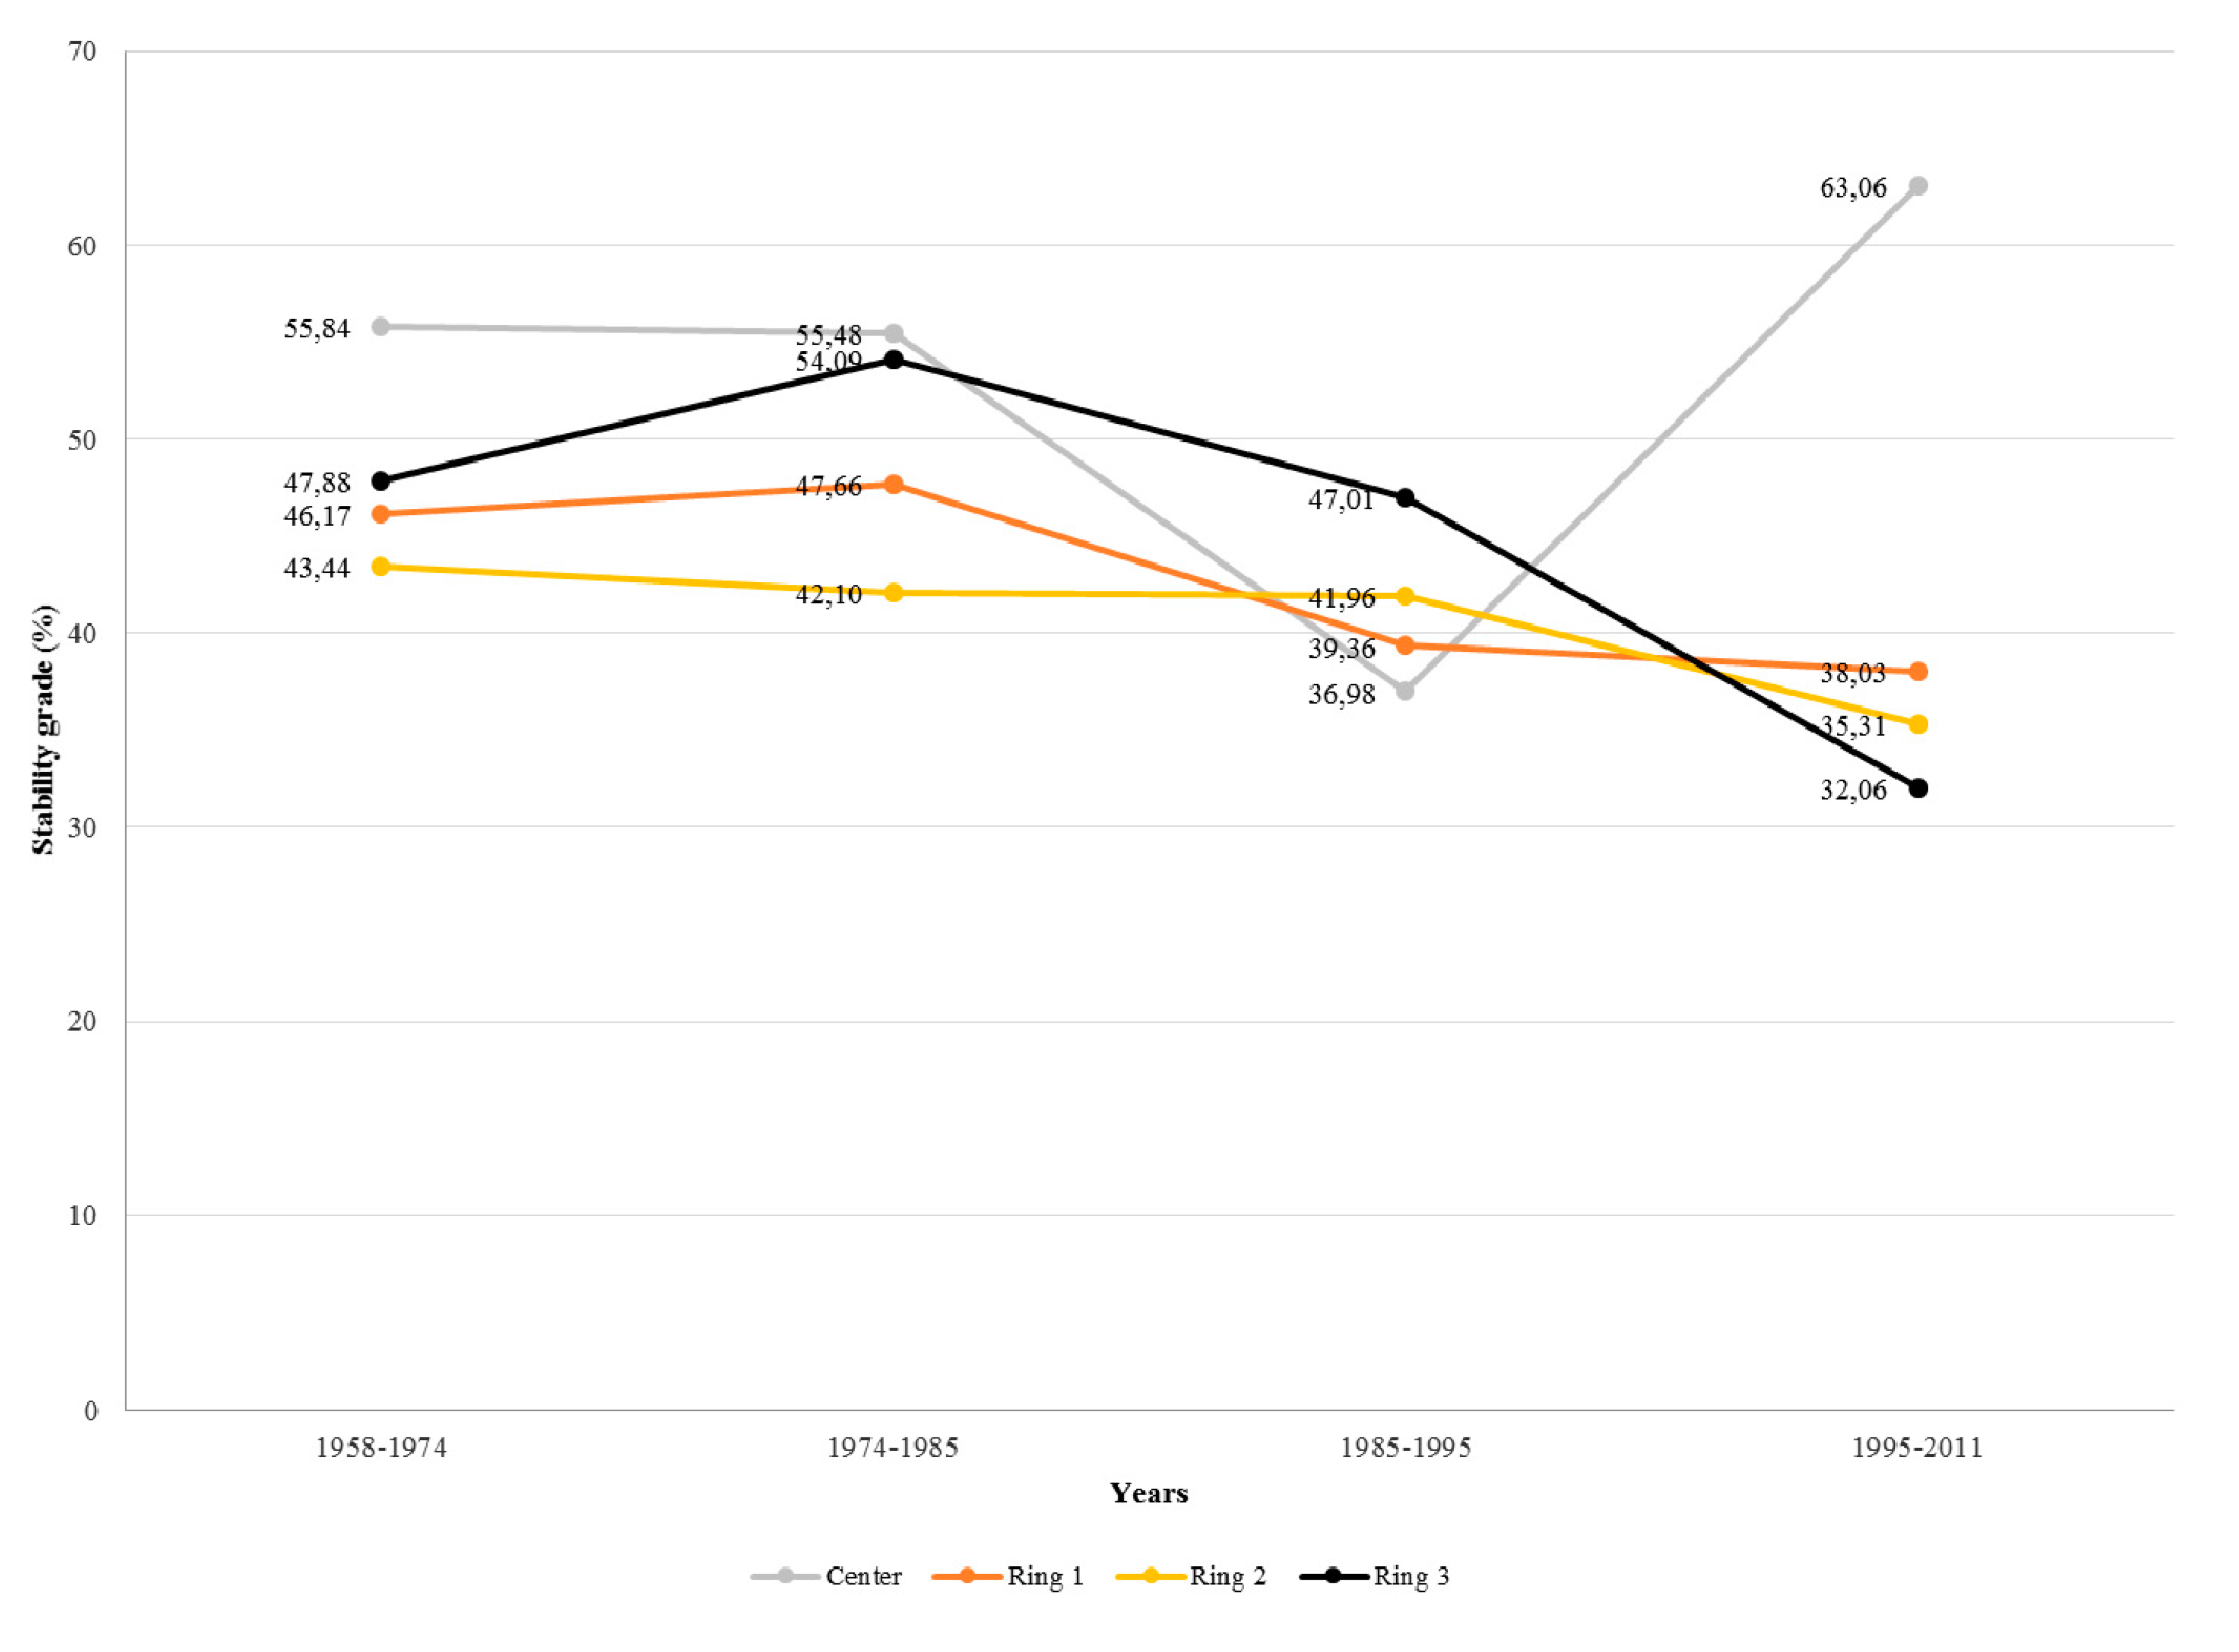
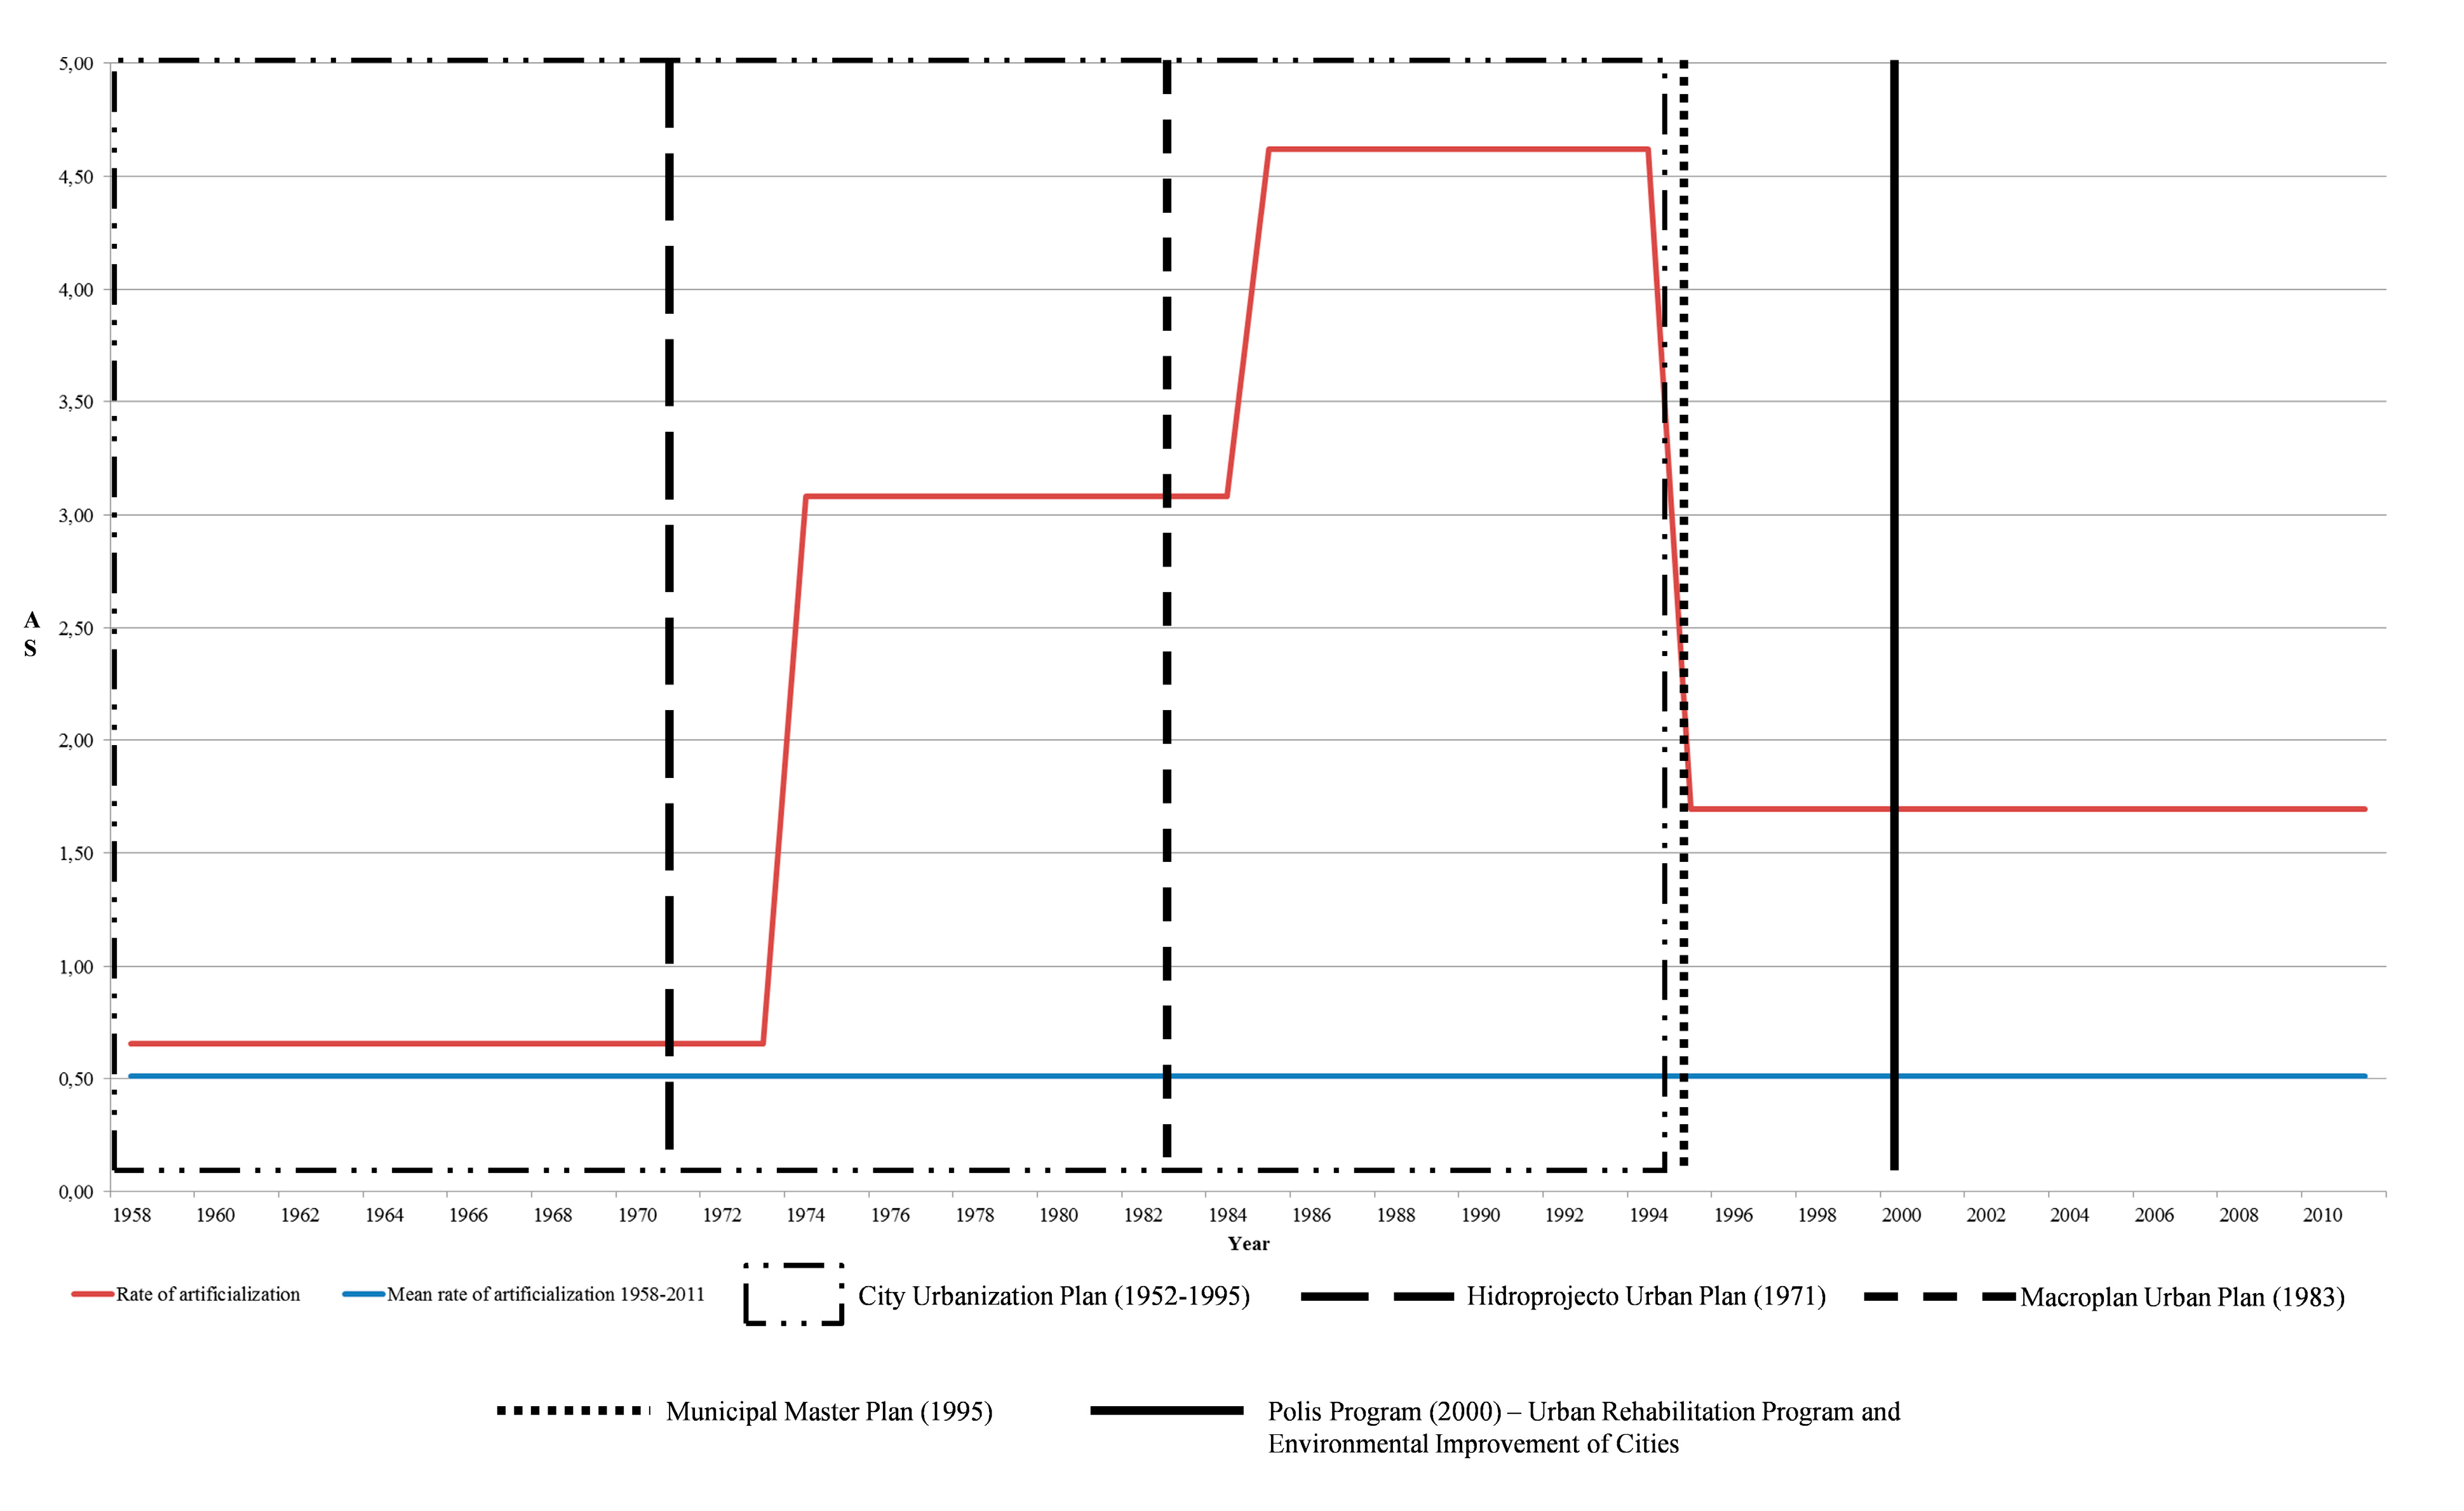
3.4. Land Use Trajectories and Planning Framework

The focus of this analysis is to deepen the model of land use change dynamics according to the spatial planning framework which presents different scales and spatial enforcement.
The graphic present in Figure 9 also show a relationship between the planning process and the rate of artificialization.
Figure 9. Annual rate of the artificialization of surfaces (AS) and the respective mean for the period 1958–2011 and the relation with the planning framework.
Sustainability 07 11727 g009
The results show that the informal partial Plans (Hidroprojecto Urban Plan and Macroplan Urban Plan) influence the increase of the artificialization rate, as they respond to pressures to the occupation of the territory for new residential or service areas. These plans are directly related to the peri-urbanization processes and the definition of new road infrastructures. With the approval of the Master Plan in 1995 there has been a decrease in the artificialization rate. This plan fits all land use and occupation processes for the whole county and is a regulatory plan supported by two restriction regimes (agriculture-RAN and ecological-REN), leading to a decrease in the annual rate of artificialization, despite the increase in continuous and discontinuous urban areas.
The increasing distances from the center point (city hall), as shown in Figure 4, and the different planning framework typology, objectives, and enforcement in the study area produced during time different dynamics on land use change.
A zoning model for land use change and the artificialization processes can be summarised as:
(a)
In the period 1958–1985 the major transformation occurred in the fringe of the central area (ring 1 and ring 2) which are outer areas for the central urban planning enforcement. The agricultural areas are the principal source of the artificialization process, with the subsequent use of the forest areas;
(b)
For the period 1985–1995 the stability grade is directly related to the distance for the city council central point, which reflects the influence of the non-formalised central urban plan, and the encircling road consolidation. This period also reflects the intensification of the artificialization processes namely using the shrub vegetation areas and sparsely vegetated areas, which represent abandoned areas or areas with reserve urban qualification.
The period 1995–2011 expresses the influence of a master plan with municipal enforcement. The degree of stability intensely downloaded to the central area now operates in reverse to the different rings. So, there is a major change towards the peripheral ring, which expresses a process of municipal urban sprawl with periurbanization and rururbanization processes. Observing the artificialization areas, the gains are mainly from the agricultural areas, forest areas, shrub vegetation areas, and sparsely vegetated areas.
These processes namely represent a deep transformation on rings 1 and 2, supported by partial plans and the road infrastructure design and construction, which often outweighs the planning processes by economic or political decision propose. Those artificialized areas present considerable gains from annual crops, arable lands, and pastures, defining those classes as one of the most important in the trajectories of land use and occupation in the study area, but associated with systematic transitions involving the forest, shrub vegetation, and sparsely vegetated areas. The casuistic transformation with land use classes resulting from forest fires, the appearance of mineral extraction areas, and waste disposal areas do not reflect the planning framework, in opposition to the modification on the stream waters margins related with legal constrains or rehabilitation plan.

4. Discussion and Conclusions

The five cartographic outputs for changes in land use and occupation underline the main decrease in annual crops and arable lands, the increase in artificial areas, namely the continuous and discontinuous urban fabric, the industrial and commercial units and the road network as well as the complex cultivation patterns and the forest routing involving different typologies.
The data representation demonstrates that urban occupation has increased gradually since 1958. The increase of artificial areas since the 70s results in the follow-up, at first, of industrial growth and afterwards, tertiary sector growth with the overall improvement of well-being [47].
The transformation of the agricultural land to urban areas is evident in this study case, as well in other contexts [5,61,62], and reflecting similar changes in Portugal [13,63]. In the area, an increase in landscape fragmentation, accompanied by increased complex cultivation patterns, translates the evolution of the rural areas [64,65] with peri-urbanization and rururbanization processes.
In general terms, there has been a continuous increase in the urban area (from 5.7% to 27.9% of the area), and the stability of the area occupied by agriculture with natural spaces and agro-forestry areas (around 6%). It was also possible to observe a decrease in the annual crops (from 27.5% to 5.9% of the area) and in the coniferous forests (from 16.1% to 5.3% of the area), especially underlined in the 1995 and 2011 images. This represents the general transition of the rural areas, with loss of agricultural areas and forest degradation, and can be clearly associated with small and medium sized city urban expansion.
The results for the study area confirm processes that can be classified as systematic transitions, contrasting with some land use changes marked by casuistic trajectories in the case of land use classes resulting from forest fires or the appearance of mineral extraction areas and waste disposal areas.
In a broad sense there has been a continuous increase in the artificial areas, with a general transition of the rural areas that can be clearly associated with the small and medium sized cities urban expansion. For this study area, but also referred to other urban contexts [13,56,66,67] a general sequence of land use change and occupation from: (1) agricultural areas to forest; (2) forest to shrub or sparsely vegetated areas; (3) shrub or sparsely vegetated areas to artificial areas, is recognized as common dynamic in the artificialization processes.
This study stressed the importance of monitoring the stability grade to identify the sequences of major changes in land use. This indicator points to a low level of stabilization, 20.61%, which reflects the intensive dynamics of the changing classes in the area. The temporal dynamics between the 26 classes identified also reveals distinct transformation phases with loss and gain conversions, justifiable by territorial planning framework [47], which is also noted in other geographical contexts [13,63,68].
Some of the systematic transitions are clearly marked by the planning process, involving partial Plans (city urban, urbanization or layout plans), Master Plans, and Regulatory Protection Regimes.
This does point out that a plan that addresses only the city encourages the land use change in the fringe, while the municipal Master Plan determines the transformation processes in all areas, revealing systematic transformations.
The results demonstrated that the transformation processes within the study area are supported by a history of urban occupation, including the discontinuous fabric and encircling road network as well as the loss of agricultural activities to the emergence of new housing residences and equipments. The results have also shown the urban planning framework as a driver on land use and occupation changes, differencing and marking the territory and its systematic transformations, according to the type, objectives and scale, as pointed by [40].
The Figure 10 summarized the two forces that act on the land use change: the territorial dynamics and the planning framework.
The zoning model approach for land use change and the artificialization processes enables the identification of three periods where the planning framework was forthright. The results show different dynamics on land use change, to the central areas and the fringe, directly related with planning scope and the scale enforcement.
Figure 10. Forcers acting on land use and occupation changes, promoting the artificialization processes.
Sustainability 07 11727 g010
This conclusion highlighted the importance of the planning framework for medium/small sized cities on processes of urban sprawl and the periurbanization and rururbanization processes. The study also underlined the relevance of road infrastructure design and construction on zoning land use changes and enabled territorial dynamics with systematic transformations. According to Antrop [4] the evolution can translate an expanding changing pattern for the period 1958–1985, an exploding changing for the period 1985–1995 corresponding to a several urbanization and layout plans on the central area and the close rings, and a broad ring development for the period 1995–2011 promoted by the municipal Master Plan.
The results obtained show temporal and spatial processes of land use and occupation changes that affect the medium and small sized cities as recognized from different authors [1,3,24,69,70,71,72], and underlining the national cycles of evolution on the processes of urbanization and infrastructures construction that spread the artificialization in different ways through space [31,40,66,73,74].
These achievements support the discussion about the influence of the national planning system in relation to the spatial inequalities and as drivers on the land use change and management processes [75,76].
Land use change studies of medium/small cities and there specific patterns and processes of artificialization are needed. Planning the territory in a grounded and creative way requires a deep knowledge about the systematic and casuistic processes of land use and occupation and the different forcers, stressing the goals pointed out by different authors [33,77,78].
Giving consistent attention to historical planning framework ascendance on the land use change processes could support new strategies and regulatory regimes to manage and maintain the landscape heterogeneity and the multifunctional land use, avoiding conflicts and promoting recognition from actors.
Reshaping or rebuilding the medium/small sized cities is a constant challenge for planner and local inhabitants, balancing new functionalities and infrastructures with diversity values and ecological corridors where the land use dynamics are drivers to create new functions and offer a basis for planning and decision making.

Acknowledgments

The authors would like to thank the support provided by the FORLAND project.

Author Contributions

Mário Monteiro author designed the research and analyzed the data and wrote the paper. Alexandre Oliveira Tavares designed the research, analyzed the data and wrote the paper. All authors read and approved the final manuscript.

Conflicts of Interest

The authors declare no conflict of interest.

References

  1. Rounsevell, M.D.A.; Reginster, I.; Araújo, M.B.; Carter, T.R.; Dendoncker, N.; Ewert, F.; House, J.I.; Kankaanpää, S.; Leemans, R.; Metzger, M.J.; et al. A coherent set of future land use change scenarios for Europe. Agric. Ecosyst. Environ. 2006, 114, 57–68. [Google Scholar] [CrossRef]
  2. Turok, I.; Mykhnenko, V. The trajectories of European cities, 1960–2005. Cities 2007, 24, 165–182. [Google Scholar] [CrossRef]
  3. Antrop, M. Changing patterns in the urbanized countryside of Western Europe. Landsc. Ecol. 2000, 15, 257–270. [Google Scholar] [CrossRef]
  4. Antrop, M. Landscape change and the urbanization process in Europe. Landsc. Urban Plan. 2004, 67, 9–26. [Google Scholar] [CrossRef]
  5. Kasanko, M.; Barredo, J.I.; Lavalle, C.; McCormick, N.; Demicheli, L.; Sagris, V.; Brezger, A. Are European cities becoming dispersed? A comparative analysis of 15 European urban areas. Landsc. Urban Plan. 2006, 77, 111–130. [Google Scholar] [CrossRef]
  6. Schwarz, N. Urban form revisited—Selecting indicators for characterising Europe cities. Landsc. Urban Plan. 2010, 96, 29–47. [Google Scholar] [CrossRef]
  7. Euroepan Comission (EC). ESDP European Spatial Development Perspective. Towards Balanced and Sustainable Development of the Territory of the European Union; Euroepan Comission: Luxembourg, 1999. [Google Scholar]
  8. European Union. Territorial Agenda of the European Union. In Proceedings of the Agreed on the Informal Ministerial Meeting on Urban Development and Territorial Cohesion, Leipzig, Germany, 24–25 May 2007.
  9. European Spatial Planning Observatory Network (ESPON). The Role of Small and Medium-Sized Towns in Europe; European Spatial Planning Observatory Network: Viena, Austria, 2006. [Google Scholar]
  10. Fahmi, F.Z.; Hudalah, D.; Rahayu, P.; Woltjer, J. Extended urbanization in small and medium-sized cities: The case of Cirebon, Indonesia. Habitat Int. 2014, 42, 1–10. [Google Scholar] [CrossRef]
  11. Han, S.S. Urban expansion in contemporary China: What can we learn from a small town? Land Use Policy 2010, 27, 780–787. [Google Scholar] [CrossRef]
  12. Solon, J. Spatial context of urbanization: Landscape pattern and changes between 1950 and 1990 in the Warsaw metropolitan area, Poland. Landsc. Urban Plan. 2009, 93, 250–261. [Google Scholar] [CrossRef]
  13. Tavares, A.O.; Pato, R.L.; Magalhães, M.C. Spatial and temporal land use change and occupation over the last half century in a peri-urban area. Appl. Geogr. 2012, 34, 432–444. [Google Scholar] [CrossRef]
  14. Acosta, A.; Carranza, M.L.; Giancola, M. Landscape change and ecosystem classification in a municipal district of a small city (Isernia, Central Italy). Environ. Monit. Assess. 2005, 108, 323–335. [Google Scholar] [CrossRef] [PubMed]
  15. Shahraki, S.Z.; Sauri, D.; Serra, P.; Modugno, S.; Seifolddini, F.; Pourahmad, A. Urban sprawl pattern and land-use change detection in Yazd, Iran. Habitat Int. 2011, 35, 521–528. [Google Scholar] [CrossRef]
  16. Siciliano, G. Urbanization strategies, rural development and land use changes in China: A multiple-level integrated assessment. Land Use Policy. 2012, 29, 165–178. [Google Scholar] [CrossRef]
  17. Skokanová, H.; Havlíček, M.; Borovec, R.; Demek, J.; Eremiášová, R.; Chrudina, Z.; Mackovӗin, P.; Rysková, R.; Slavík, P.; Stránská, T.; et al. Development of land use and main land use change processes in the period 1836–2006: Case study in the Czech Republic. J. Maps 2012, 8, 88–96. [Google Scholar] [CrossRef]
  18. Tavares, A.O.; Monteiro, M.; Vargas, M.A.; Pato, R.L.; Serra, R. Land use change and forest routing in a rural context: The relevance of the community-based management and planning framework. Appl. Geogr. 2014, 52, 153–171. [Google Scholar] [CrossRef]
  19. Aspinall, R. Modelling land use change with generalized linear models—A multi-model analysis of change between 1860 and 2000 in Gallatin Valley, Montana. J. Environ. Manag. 2004, 72, 91–103. [Google Scholar] [CrossRef] [PubMed]
  20. Braimoh, A.K. Random and systematic land-cover transitions in northern Ghana. Agric. Ecosyst. Environ. 2006, 113, 254–263. [Google Scholar] [CrossRef]
  21. Díaz-Pacheco, J.; García-Palomares, J.C. A highly detailed land-use vector map for Madrid region based on photo-interpretation. J. Maps 2014, 10, 424–433. [Google Scholar] [CrossRef]
  22. Díaz-Palacios-Sisternes, S.; Ayuga, F.; García, A.I. A method for detecting and describing land use transformations: An examination of Madrid’s southern urban-rural gradient between 1990 and 2006. Cities 2014, 40, 99–110. [Google Scholar] [CrossRef]
  23. Sönmez, N.K.; Onur, I.; Sari, M.; Maktav, D. Monitoring changes in land cover/use by CORINE methodology using aerial photographs and IKONOS satellite images: A case study for Kemer, Antalya, Turkey. Int. J. Remote Sens. 2009, 30, 1771–1778. [Google Scholar] [CrossRef]
  24. Catalan, B.; Sauri, D.; Serra, P. Urban sprawl in the mediterranean?: Patterns of growth and change in the Barcelona Metropolitan Region 1993–2000. Landsc. Urban Plan. 2008, 85, 174–184. [Google Scholar] [CrossRef]
  25. Deng, J.S.; Wang, K.; Hong, Y.; Qi, J.G. Spatio-temporal dynamics and evolution of land use change and landscape pattern in response to rapid urbanization. Landsc. Urban Plan. 2009, 92, 187–198. [Google Scholar] [CrossRef]
  26. Liu, T.; Yang, X. Monitoring land changes in an urban area using satellite imagery, GIS and landscape metrics. Appl. Geogr. 2015, 56, 42–54. [Google Scholar] [CrossRef]
  27. Tapiador, F.J.; Casanova, J.L. Land use mapping methodology using remote sensing for the regional planning directives in Segovia, Spain. Landsc. Urban Plan. 2003, 62, 103–115. [Google Scholar] [CrossRef]
  28. Henríquez, C.; Azócar, G.; Romero, H. Monitoring and modeling the urban growth of two mid-sized Chilean cities. Habitat Int. 2006, 30, 945–964. [Google Scholar] [CrossRef]
  29. Verburg, P.H.; van Berkel, D.B.; van Doorn, A.M.; van Eupen, M.; van den Heiligenberg, H.A.R.M. Trajectories of land use change in Europe: A model-based exploration of rural futures. Landsc. Ecol. 2010, 25, 217–232. [Google Scholar] [CrossRef]
  30. Wu, K.; Zhang, H. Land use dynamics, built-up land expansion patterns, and driving forces analysis of the fast-growing Hangzhou metropolitan area, eastern China (1978–2008). Appl. Geogr. 2012, 34, 137–145. [Google Scholar] [CrossRef]
  31. Diogo, V.; Koomen, E. Land Use Change in Portugal, 1990–2006: Main Processes and Underlying Factors. Cartographica 2012, 47, 237–249. [Google Scholar] [CrossRef]
  32. Li, X.; Zhou, W.; Ouyang, Z. Forty years of urban expansion in Beijing: What is the relative importance of physical, socioeconomic and neighborhood factors? Appl. Geogr. 2013, 38, 1–10. [Google Scholar] [CrossRef]
  33. Verburg, P.; Schot, P.; Dijst, M.; Veldkamp, A. Land use change modelling: Current practice and research priorities. GeoJournal 2004, 61, 309–324. [Google Scholar] [CrossRef]
  34. Hietel, E.; Waldhardt, R.; Otte, A. Linking socio-economic factors, environment and land cover in the German Highlands, 1945–1999. J. Environ. Manag. 2005, 75, 133–143. [Google Scholar] [CrossRef]
  35. Hietel, E.; Waldhardt, R.; Otte, A. Statistical modelling of land-cover changes based on key socio-economic indicators. Ecol. Econ. 2007, 62, 496–507. [Google Scholar] [CrossRef]
  36. Long, H.; Tang, G.; Li, X.; Heilig, G.K. Socio-economic driving forces of land-use change in Kunshan, the Yangtze River Delta economic area of China. J. Environ. Manag. 2007, 83, 352–364. [Google Scholar] [CrossRef] [PubMed]
  37. Serra, P.; Pons, X.; Saurí, D. Land-cover and land use change in a Mediterranean landscape: A spatial analysis of driving forces integrating biophysical and human factors. Appl. Geogr. 2008, 28, 189–209. [Google Scholar] [CrossRef]
  38. Long, Y.; Gub, Y.; Han, H. Spatiotemporal heterogeneity of urban planning implementation effectiveness: Evidence from five urban Master Plans of Beijing. Landsc. Urban Plan. 2012, 108, 103–111. [Google Scholar] [CrossRef]
  39. Parcerisas, L.; Marull, J.; Pino, J.; Tello, E.; Coll, F.; Basnou, C. Land use changes, landscape ecology and their socioeconomic driving forces in the Spanish Mediterranean coast (El Maresme County, 1850–2005). Environ. Sci. Policy 2012, 23, 120–132. [Google Scholar] [CrossRef]
  40. Pato, R.; Castro, P.; Tavares, A. The relevance of physical forces on land-use change and planning process. J. Environ. Plan. Man. 2015. [Google Scholar] [CrossRef]
  41. Ferreira, N.; Godinho, M.M.; Neves, L.; Pereira, A.; Sequeira, A.; Castro, P.; Bento dos Santos, T. Explanatory Notice of 17-A Sheet of the Geological Map of Portugal (1:50,000); National Laboratory for Energy and Geology: Lisbon, Portugal, 2010. [Google Scholar]
  42. CMV. Municipal Plan for the Defense of Forest Fire; Câmara Municipal de Viseu: Viseu, Portugal, 2007. [Google Scholar]
  43. IGP. Forest Fire Risk Cartography—Viseu District Report; Portuguese Geographic Institute: Lisbon, Portugal, 2004. [Google Scholar]
  44. Costa, J.C.; Aguiar, C.; Capelo, J.; Lousã, M.; Neto, C. Biogeography of Continental Portugal. Available online: http://www.researchgate.net/profile/Jorge_Capelo/publication/228540962_Biogeografia_de_Portugal_continental/links/0912f50bdcbe96ec29000000.pdf (accessed on 24 August 2015).
  45. INE. 2011 Census Definitive Results—Portugal; National Institute of Statistics: Lisbon, Portugal, 2012. [Google Scholar]
  46. PORDATA—Database Contemporary Portugal. Available online: http://www.pordata.pt/ (accessed on 10 October 2015).
  47. Almeida, J.R. The Urban Dynamic of Viseu in the Second Half of the 20th Century. Master’s Thesis, University of Porto, Porto, Portugal, 2000. [Google Scholar]
  48. Dijkstra, L.; Poelman, H. Cities in Europe: The New OECD-EC Definition; European Commission: Brussels, Belgium, 2012. [Google Scholar]
  49. Almeida, S. Anchors of Development. The Collective Equipment in Urban Design: The Case of Viseu of the Twentieth Century to the Most Recent Expansion. Master’s Thesis, University of Coimbra, Coimbra, Portugal, 2015. [Google Scholar]
  50. EEA. Corine Land Cover (CLC1990) 100 m—Version 12/2000; European Environmental Agency: Copenhagen, Denmark, 2000. [Google Scholar]
  51. Bossard, M.; Feranec, J.; Otahel, J. Corine Land Cover Technical Guide—Addendum; Technical Report No 40; European Environmental Agency: Copenhagen, Denmark, 2000. [Google Scholar]
  52. Nery, F. CORINE Land Cover Nomenclature: Commented Portuguese Version; Portuguese Geographic Institute: Lisbon, Portugal, 2007. [Google Scholar]
  53. Piwowar, J.M. Digital image analysis. In Remote Sensing; Aronoff, S., Ed.; ESRI Press: Redlands, CA, USA, 2005; pp. 287–335. [Google Scholar]
  54. Castanheira, J.M.; Aranha, J. Study of the change in land cover in the Alto Tâmega valley. Multi-temporal study with Landsat-5 TM e Landsat-7 ETM+ images. In Proceedings of the VIII Meeting of Geographic Information Users, Oeiras, Portugal, 2–4 June 2004.
  55. Freire, S.; Santos, T.; Tenedório, J.A. Recent urbanization and land use/land cover change in Portugal—The influence of coastline and coastal urban centers. J. Coast. Res. 2009, 56, 1499–1503. [Google Scholar]
  56. Freiria, S.; Tavares, A. Towards the acknowledgment of the urban-rural interface as a spatial category. IJEE 2011, 5, 292–300. [Google Scholar]
  57. Elo, S.; Kyngӓs, H. The qualitative content analysis process. J. Adv. Nurs. 2008, 62, 107–115. [Google Scholar] [CrossRef] [PubMed]
  58. GAO. Content Analysis: A Methodology for Structuring and Analyzing Written Material; Program Evaluation and Methodology Division, United States General Accounting Office: Washington, DC, USA, 1996. [Google Scholar]
  59. Giulio, M.; Holderegger, R.; Tobias, S. Effects of habitat and landscape fragmentation on humans and biodiversity in densely populated landscapes. J. Environ. Manag. 2009, 90, 2959–2968. [Google Scholar] [CrossRef] [PubMed]
  60. Pӑtru-Stupariu, I.; Stupariu, M.; Tudor, C.; Grӑdinaru, S.; Gavrilidis, A.; Kienast, F.; Hersperger, A. Landscape fragmentation in Romania’s Southern Carpathians: Testing a European assessment with local data. Landsc. Urban Plan. 2015, 143, 1–8. [Google Scholar] [CrossRef]
  61. Russo, P.; Tomaselli, G.; Pappalardo, G. Marginal periurban agricultural areas: A support method for landscape planning. Land Use Policy 2014, 41, 97–109. [Google Scholar] [CrossRef]
  62. Su, S.; Jiang, Z.; Zhang, Q.; Zhang, Y. Transformations of agricultural landscapes under rapid urbanization: A threat to sustainability in Hang-Jia-Hu region, China. Appl. Geogr. 2011, 31, 439–499. [Google Scholar] [CrossRef]
  63. Jones, N.; de Graaff, J.; Rodrigo, I.; Duarte, F. Historical review of land use changes in Portugal (before and after EU integration in 1986) and their implications for land degradation and conservation, with a focus on Centro and Alentejo regions. Appl. Geogr. 2011, 31, 1036–1048. [Google Scholar] [CrossRef]
  64. Bodesmo, N.; Pacicco, L.; Romano, B.; Ranfa, A. The role of environmental and socio-demographic indicators in the analysis of land use changes in a protected area of the Natura 2000 Network: The case study of Lake Trasimeno, Umbria, Central Italy. Environ. Monit. Assess. 2012, 184, 831–843. [Google Scholar] [CrossRef] [PubMed]
  65. Hasse, J.E.; Lathrop, R.G. Land resource impact indicators of urban sprawl. Appl. Geogr. 2003, 23, 159–175. [Google Scholar] [CrossRef]
  66. Araya, Y.; Cabral, P. Analysis and modeling of urban land cover change in Setubal and Sesimbra, Portugal. Remote Sens. 2010, 2, 1549–1563. [Google Scholar] [CrossRef]
  67. De Noronha Vaz, E.; Nijkamp, P.; Painho, M.; Caetano, M. A multi-scenario forecast of urban change: A study on urban growth in the Algarve. Landsc. Urban Plan. 2012, 104, 201–211. [Google Scholar] [CrossRef]
  68. Gong, J.; Chen, W.; Liu, Y.; Wang, J. The intensity change of urban development land: Implications for the city master plan of Guangzhou, China. Land Use Policy 2014, 40, 91–100. [Google Scholar] [CrossRef]
  69. Aguilera, F.; Valenzuela, L.; Botequilha-Leitão, A. Landscape metrics in the analysis of urban land use patterns: A case study in a Spanish metropolitan area. Landsc. Urban Plan. 2011, 99, 226–238. [Google Scholar] [CrossRef]
  70. Romano, B.; Zullo, F. Models of urban land use in Europe: Assessment tools and criticalities. Int. J. Agric. Environ. Inform. Syst. 2013, 4, 80–97. [Google Scholar] [CrossRef]
  71. Roose, A.; Kull, A.; Gauk, M.; Tali, T. Land use policy shocks in the post-communist urban fringe: A case study of Estonia. Land Use Policy 2013, 30, 76–83. [Google Scholar] [CrossRef]
  72. Salvati, L.; Sateriano, A.; Bajocco, S. To grow or to sprawl? Land cover relationships in a Mediterranean City Region and implications for land use management. Cities 2013, 30, 113–121. [Google Scholar] [CrossRef]
  73. Caetano, M.; Araújo, A.; Nunes, A.; Nunes, V.; Pereira, M. Accuracy Assessment of the CORINE Land Cover 2006 Map of Continental Portugal. Technical Report; Geographic Portuguese Institute: Lisbon, Portugal, 2009. [Google Scholar]
  74. Petrov, L.; Lavalle, C.; Kasanko, M. Urban land use scenarios for a tourist region in Europe: Applying the MOLAND model to Algarve, Portugal. Landsc. Urban Plan. 2009, 92, 10–23. [Google Scholar] [CrossRef]
  75. Cardoso, R.; Breda-Vázquez, I. Social justice as a guide to planning theory and practice: Analyzing the Portuguese planning system. Int. J. Urban Reg. Res. 2007, 31, 384–400. [Google Scholar] [CrossRef]
  76. Pires, A.R. The fragile foundations of European spatial planning in Portugal. Eur. Plan. Stud. 2005, 13, 237–252. [Google Scholar] [CrossRef]
  77. Claessens, L.; Schoorl, J.; Verburg, P.; Geraedts, L.; Veldkamp, A. Modelling interactions and feedback mechanisms between land use change and landscape processes. Agric. Ecosyst. Environ. 2009, 129, 157–170. [Google Scholar] [CrossRef]
  78. Turcu, C. Re-thinking sustainability indicators: Local perspectives of urban sustainability. J. Environ. Plan. Manag. 2013, 56, 695–719. [Google Scholar] [CrossRef]

