
Scaled Experimental Study on Maximum Smoke Temperature along Corridors Subject to Room Fires

Abstract
:1. Introduction
2. Theoretical Analysis
2.1. Mass Doorflow Rate
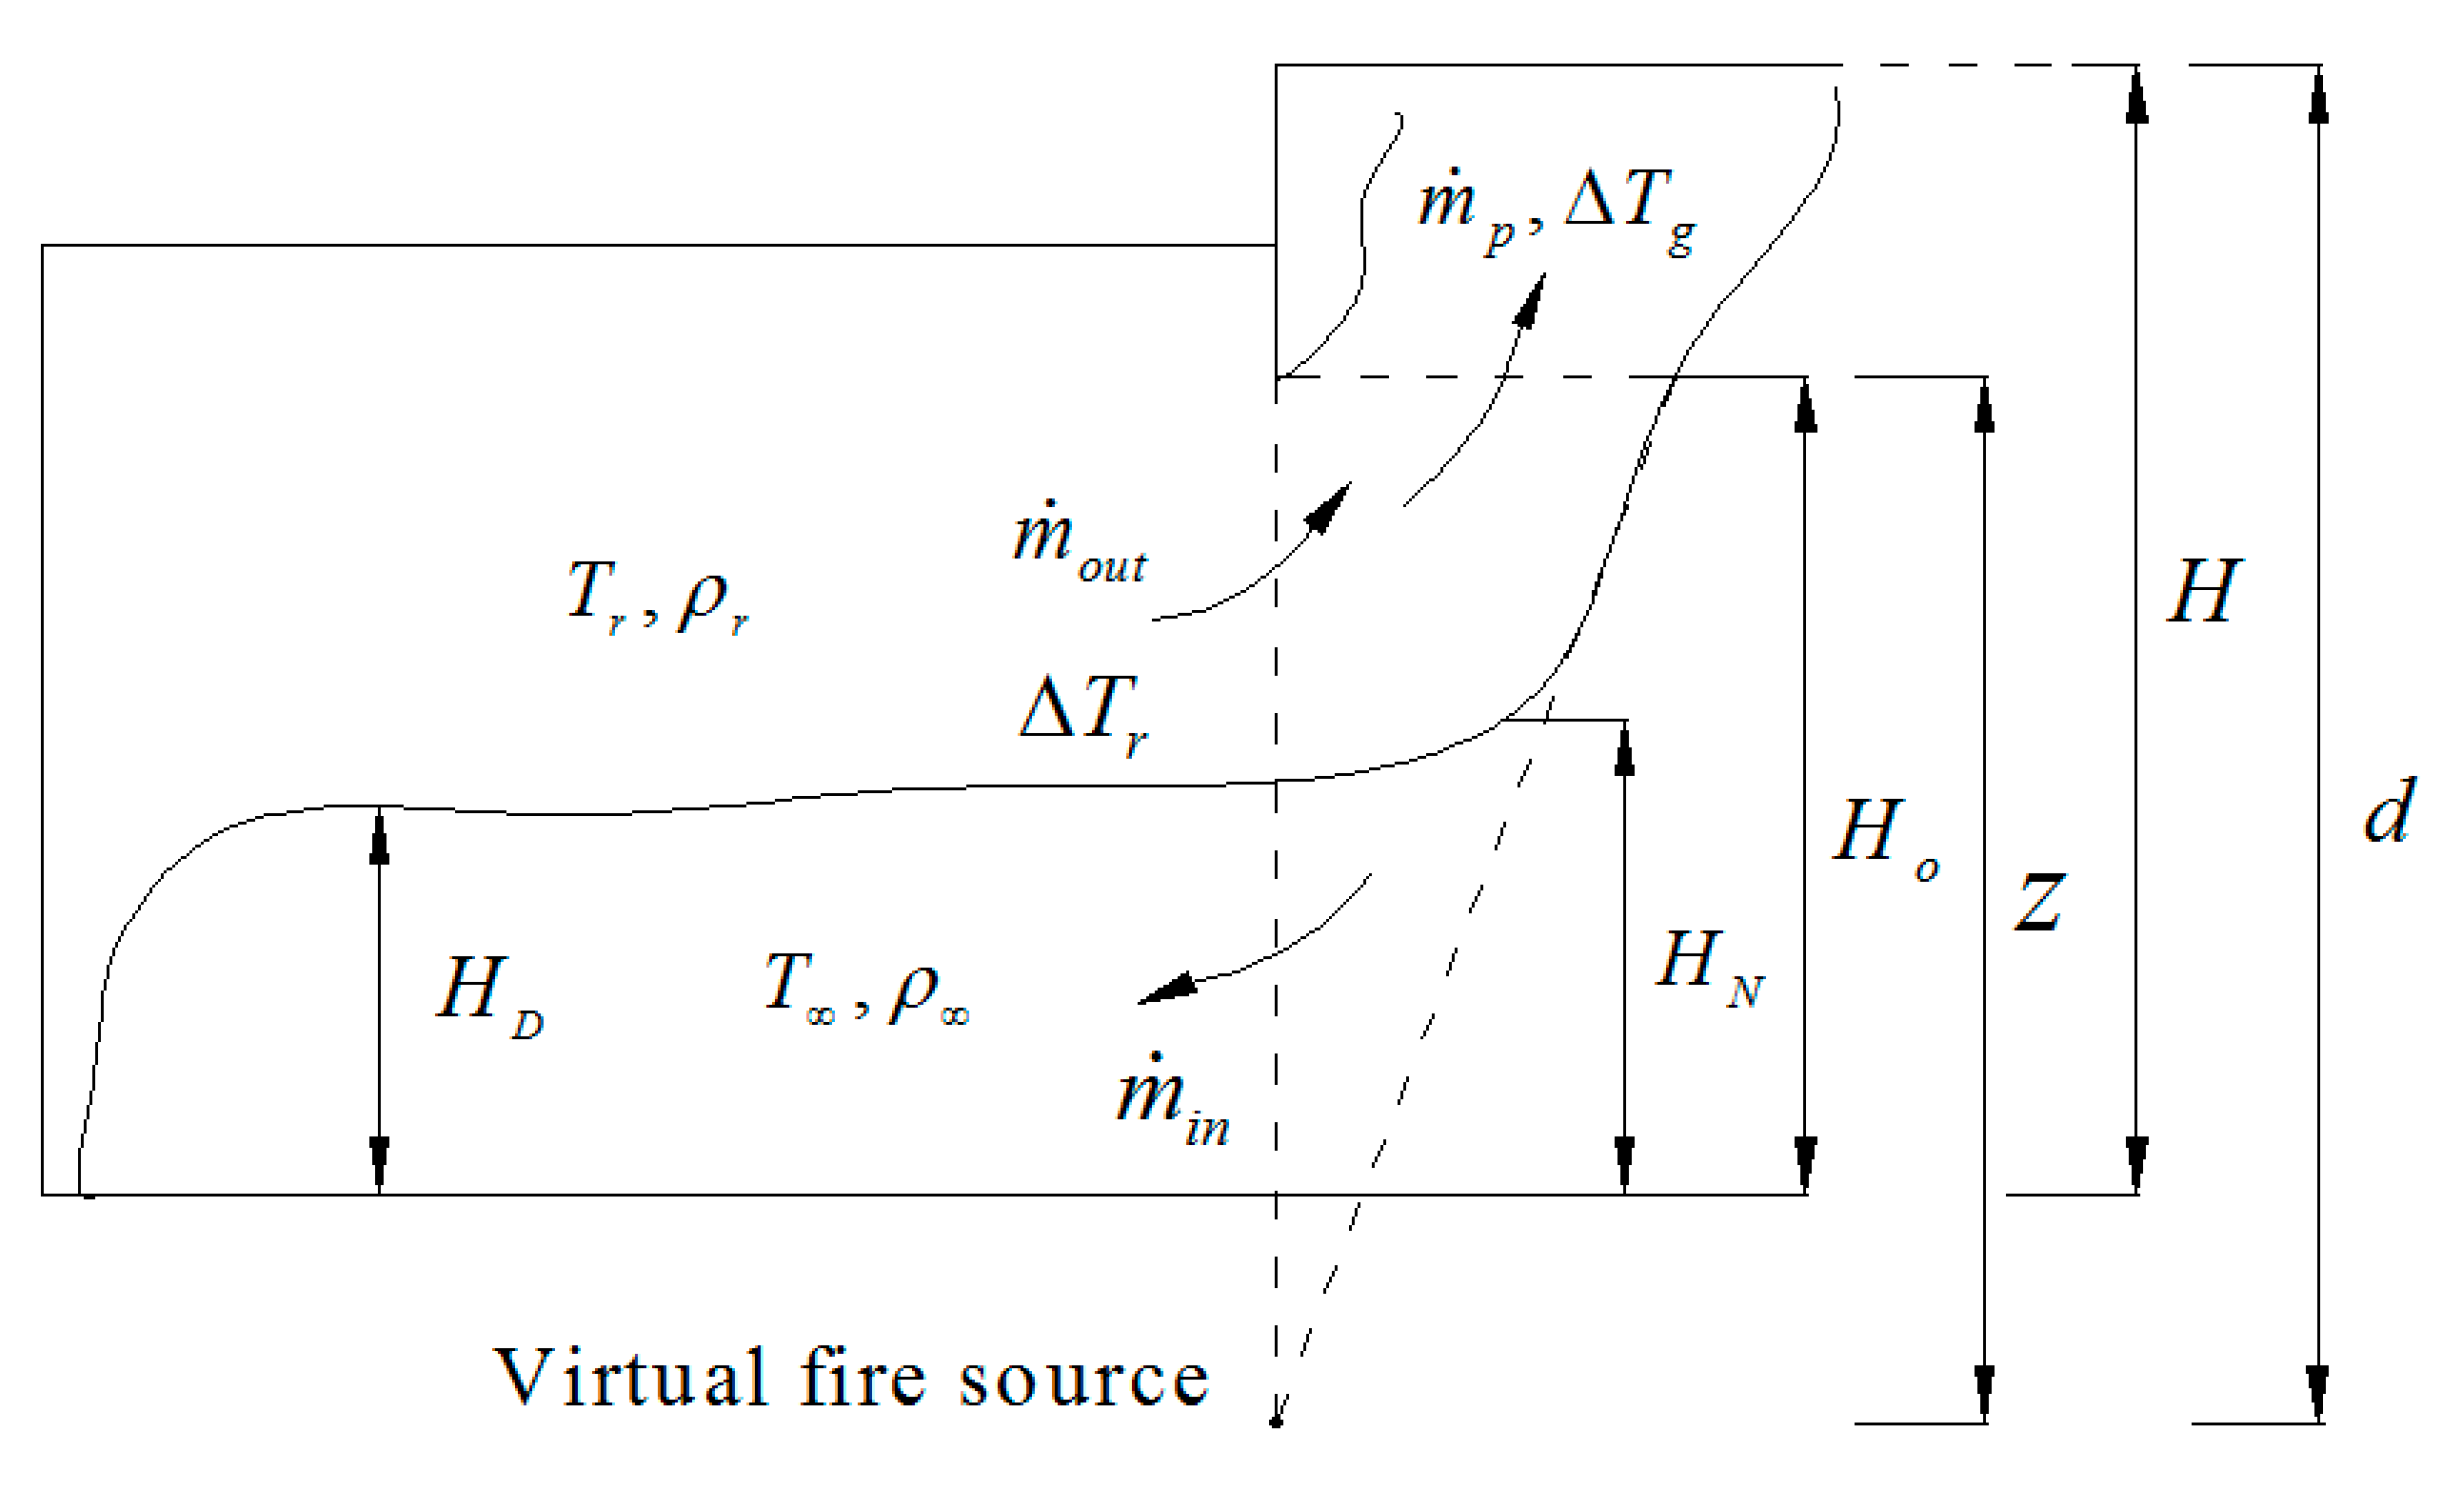
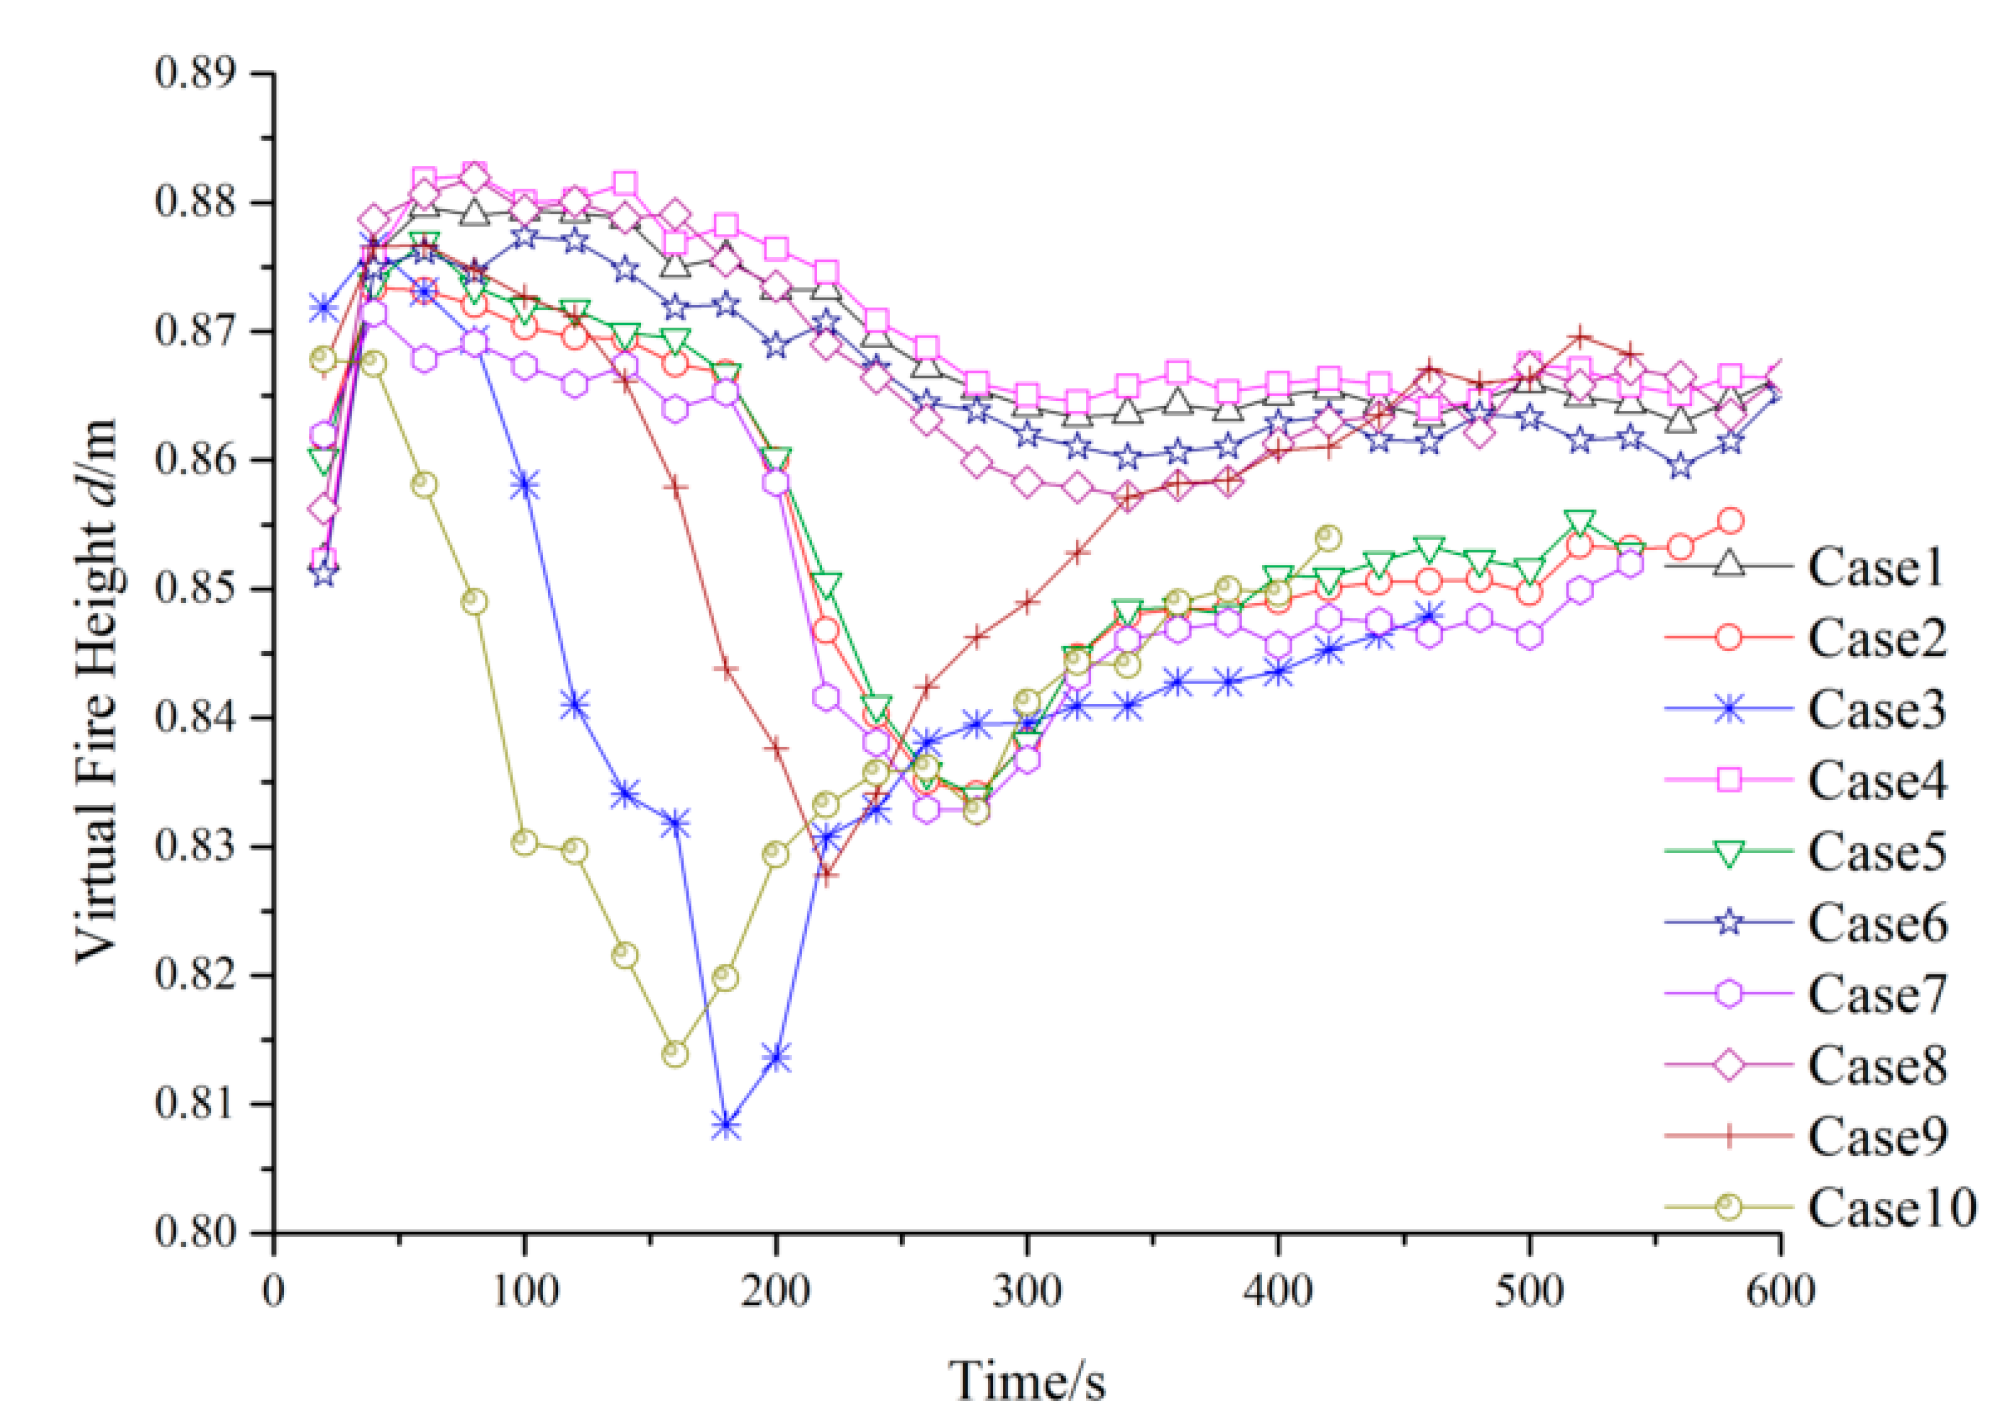
2.2. Virtual Fire
2.3. Dimensional Analysis
- (a)
- The role of virtual point-source fire was equivalent to the effect of fire from room to corridor;
- (b)
- There was no radiation loss for virtual point-source fire, all the virtual fire energy was released through convection;
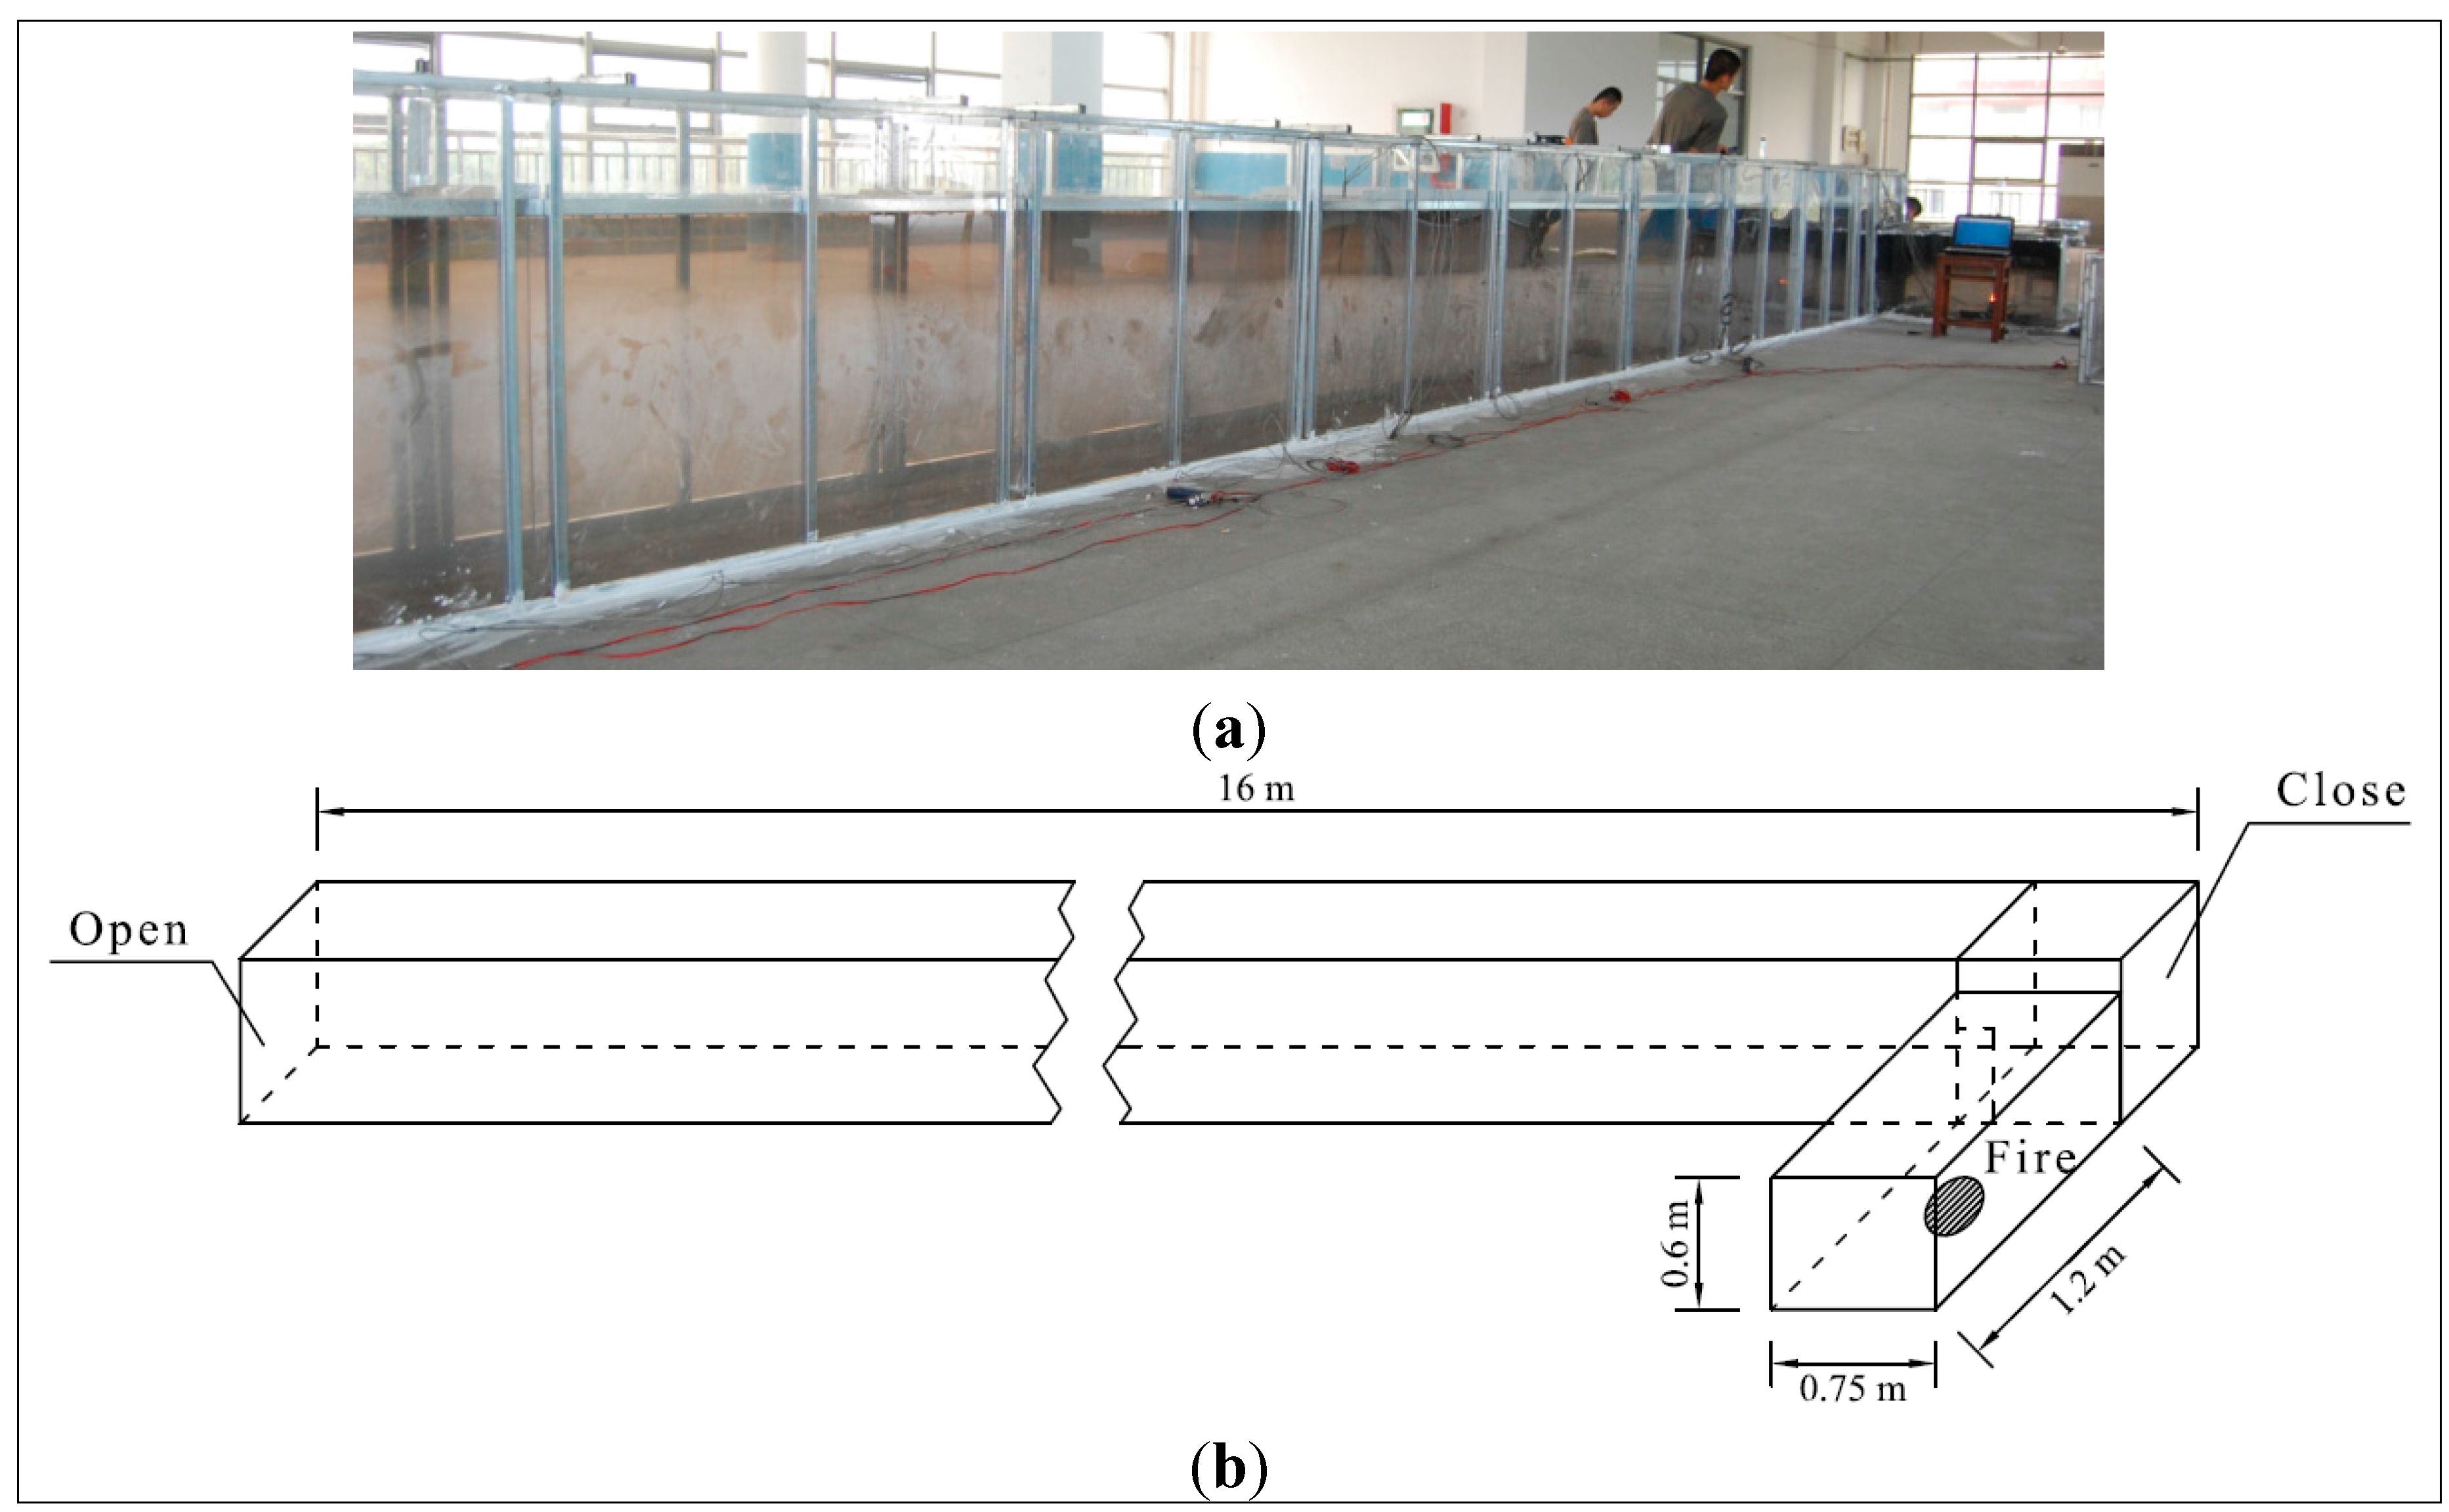
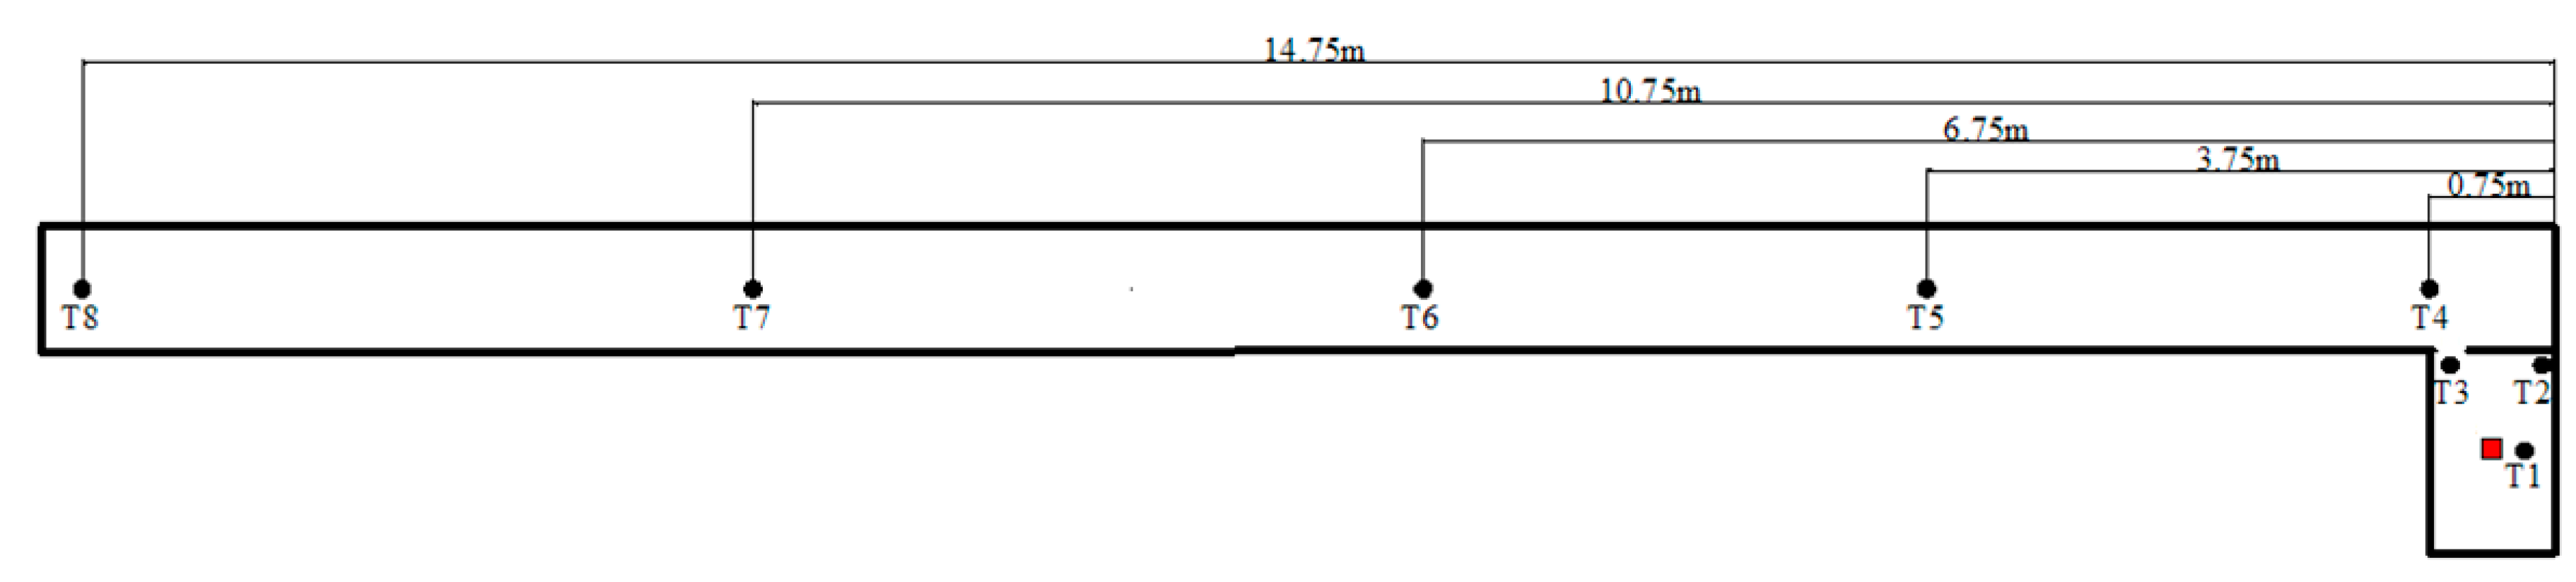
3. Experiments


| Case No. | Pool Diameter (cm) | Fuel Volume (mL) | Corridor Height (cm) | Corridor Width (cm) | Qmax (kW) | Qv,max (kW) | Qv,max × 10−3 |
|---|---|---|---|---|---|---|---|
| 1 | 10 | 100 | 75 | 50 | 9.76 | 1.38 | 1.79 |
| 2 | 14.1 | 200 | 75 | 50 | 29.7 | 2.97 | 4.2 |
| 3 | 20 | 300 | 75 | 50 | 63.11 | 3.66 | 5.59 |
| 4 | 10 | 100 | 75 | 40 | 9.54 | 1.31 | 1.7 |
| 5 | 14.1 | 200 | 75 | 40 | 29.46 | 2.96 | 4.18 |
| 6 | 10 | 100 | 75 | 60 | 12.18 | 1.5 | 1.97 |
| 7 | 14.1 | 200 | 75 | 60 | 31.07 | 3.07 | 4.37 |
| 8 | 10 | 100 | 60 | 50 | 11.99 | 1.94 | 2.56 |
| 9 | 14.1 | 200 | 60 | 50 | 31.56 | 3.49 | 5.03 |
| 10 | 20 | 300 | 60 | 50 | 65.58 | 4.73 | 7.27 |

4. Results and Discussion
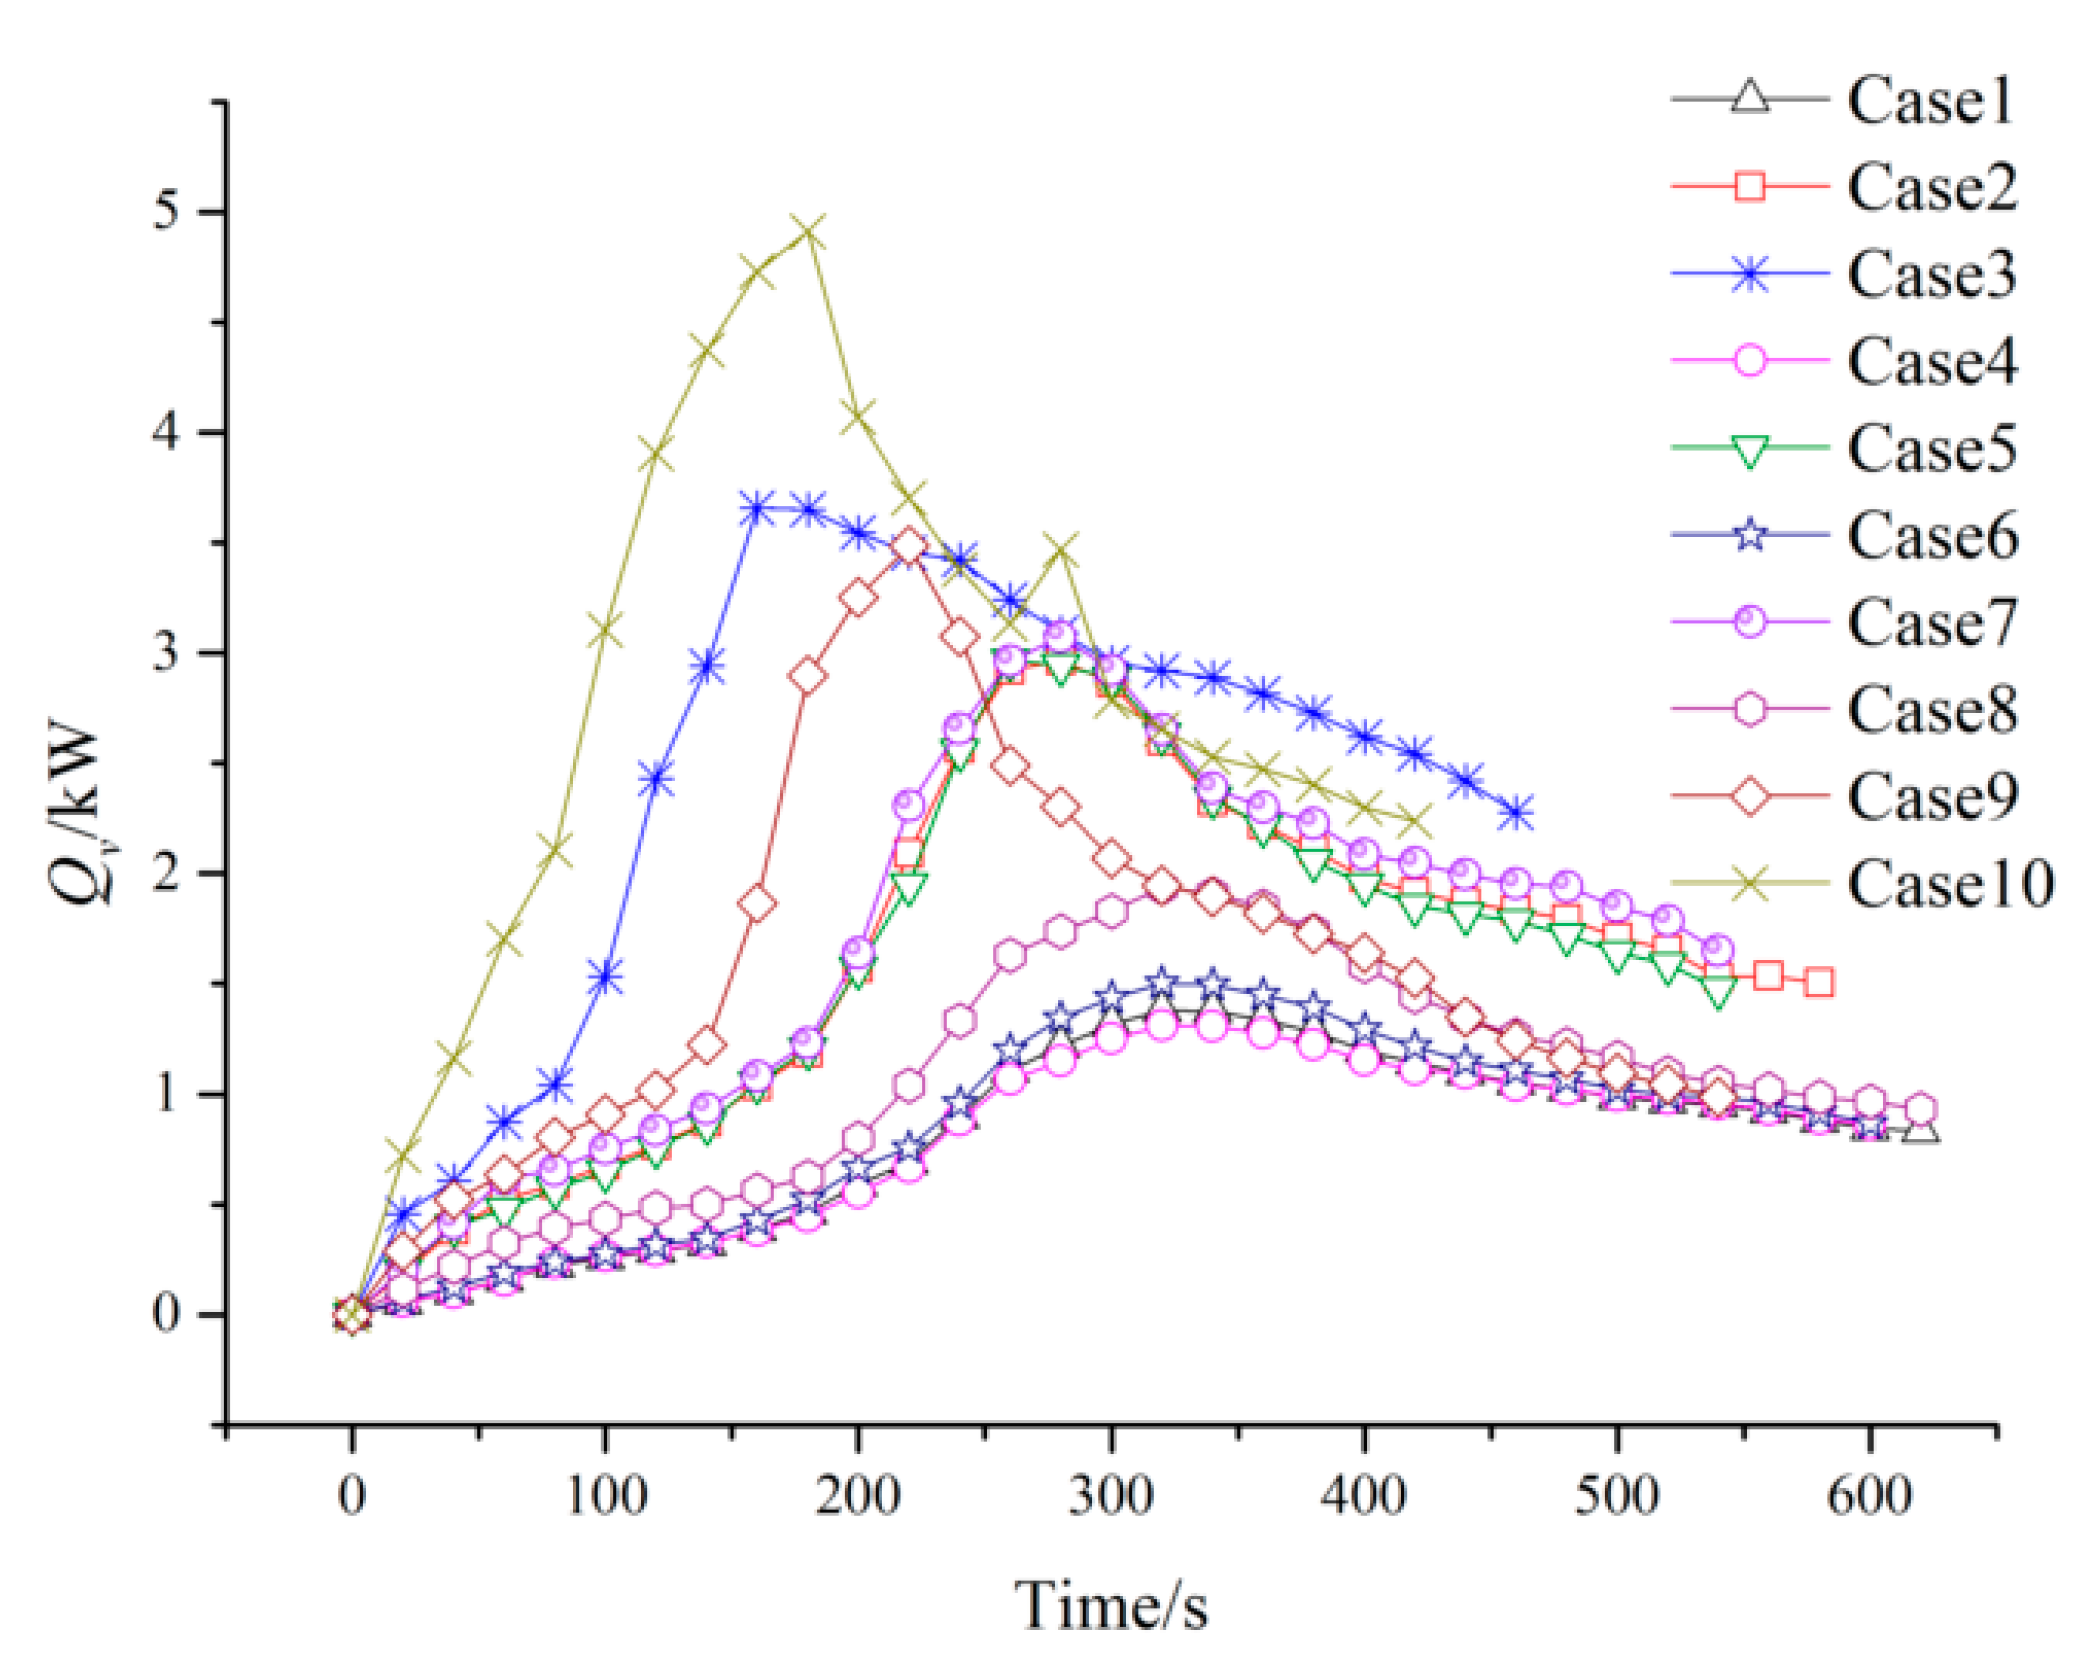
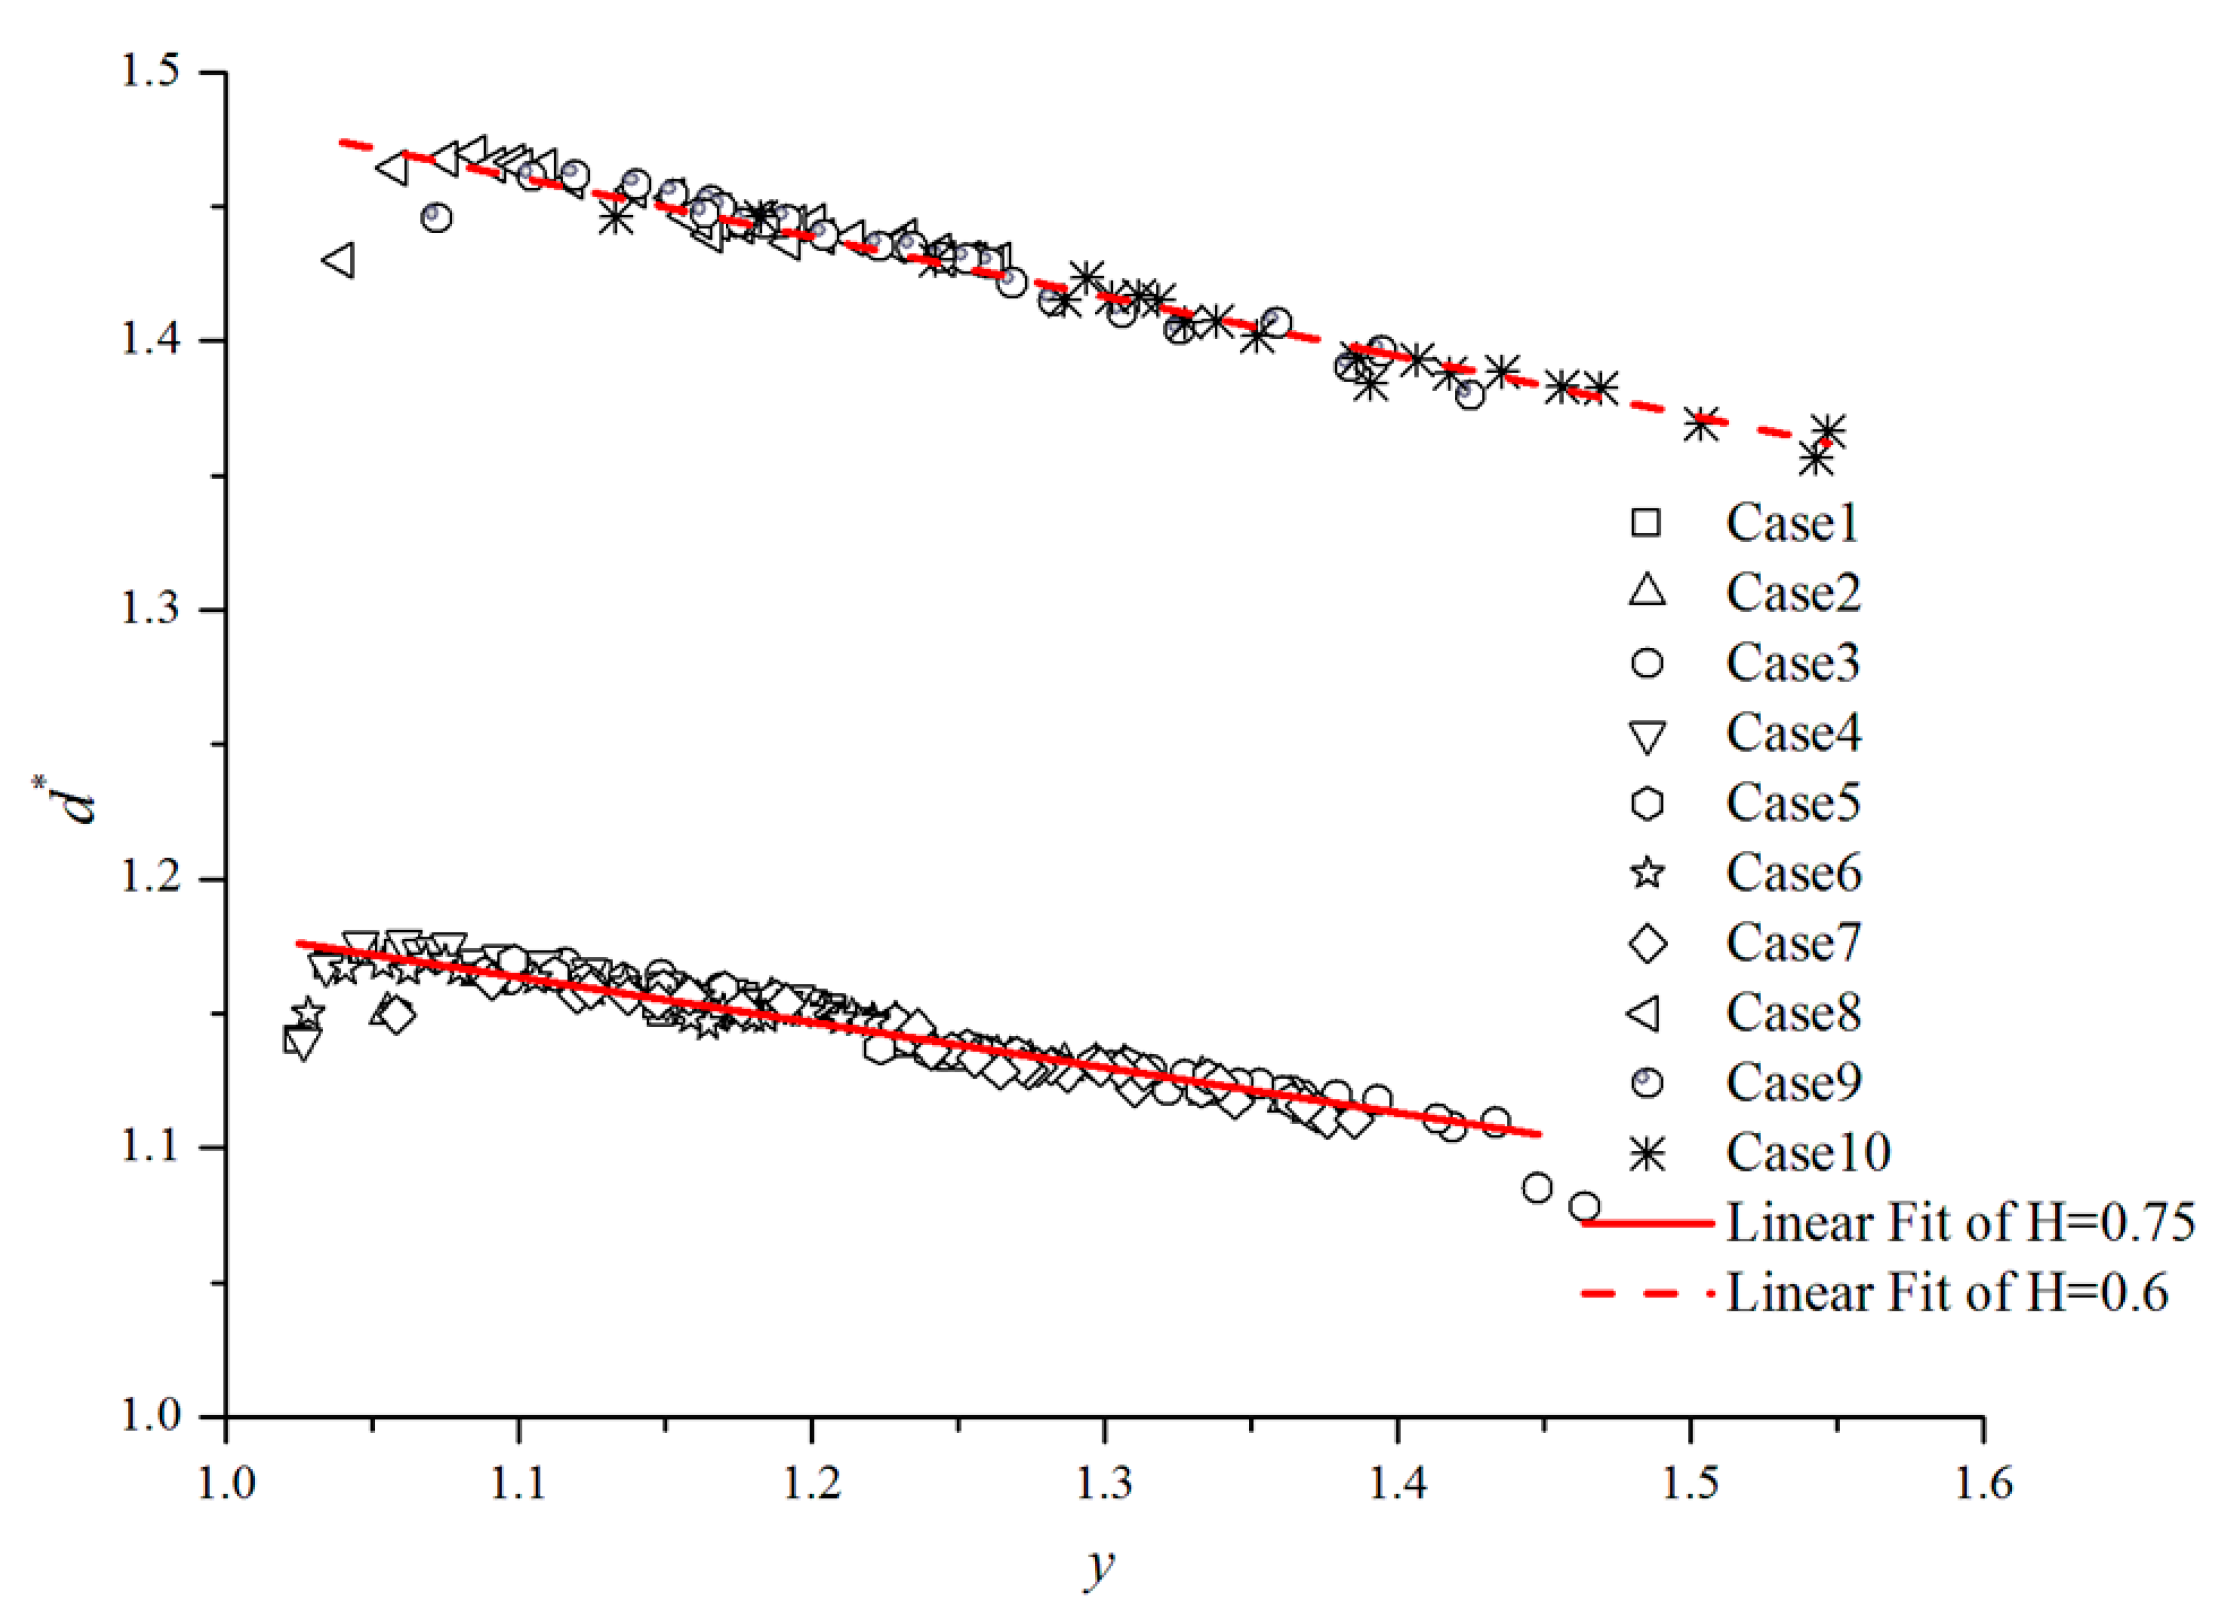
4.1. Virtual Fire HRR and the Distance from Virtual Fire Source to Corridor Ceiling

4.2. Correlations between the Virtual Fire and Smoke Temperature in Fire Room

4.3. The Correlations between Virtual Fire and Real Pool Fire in Room
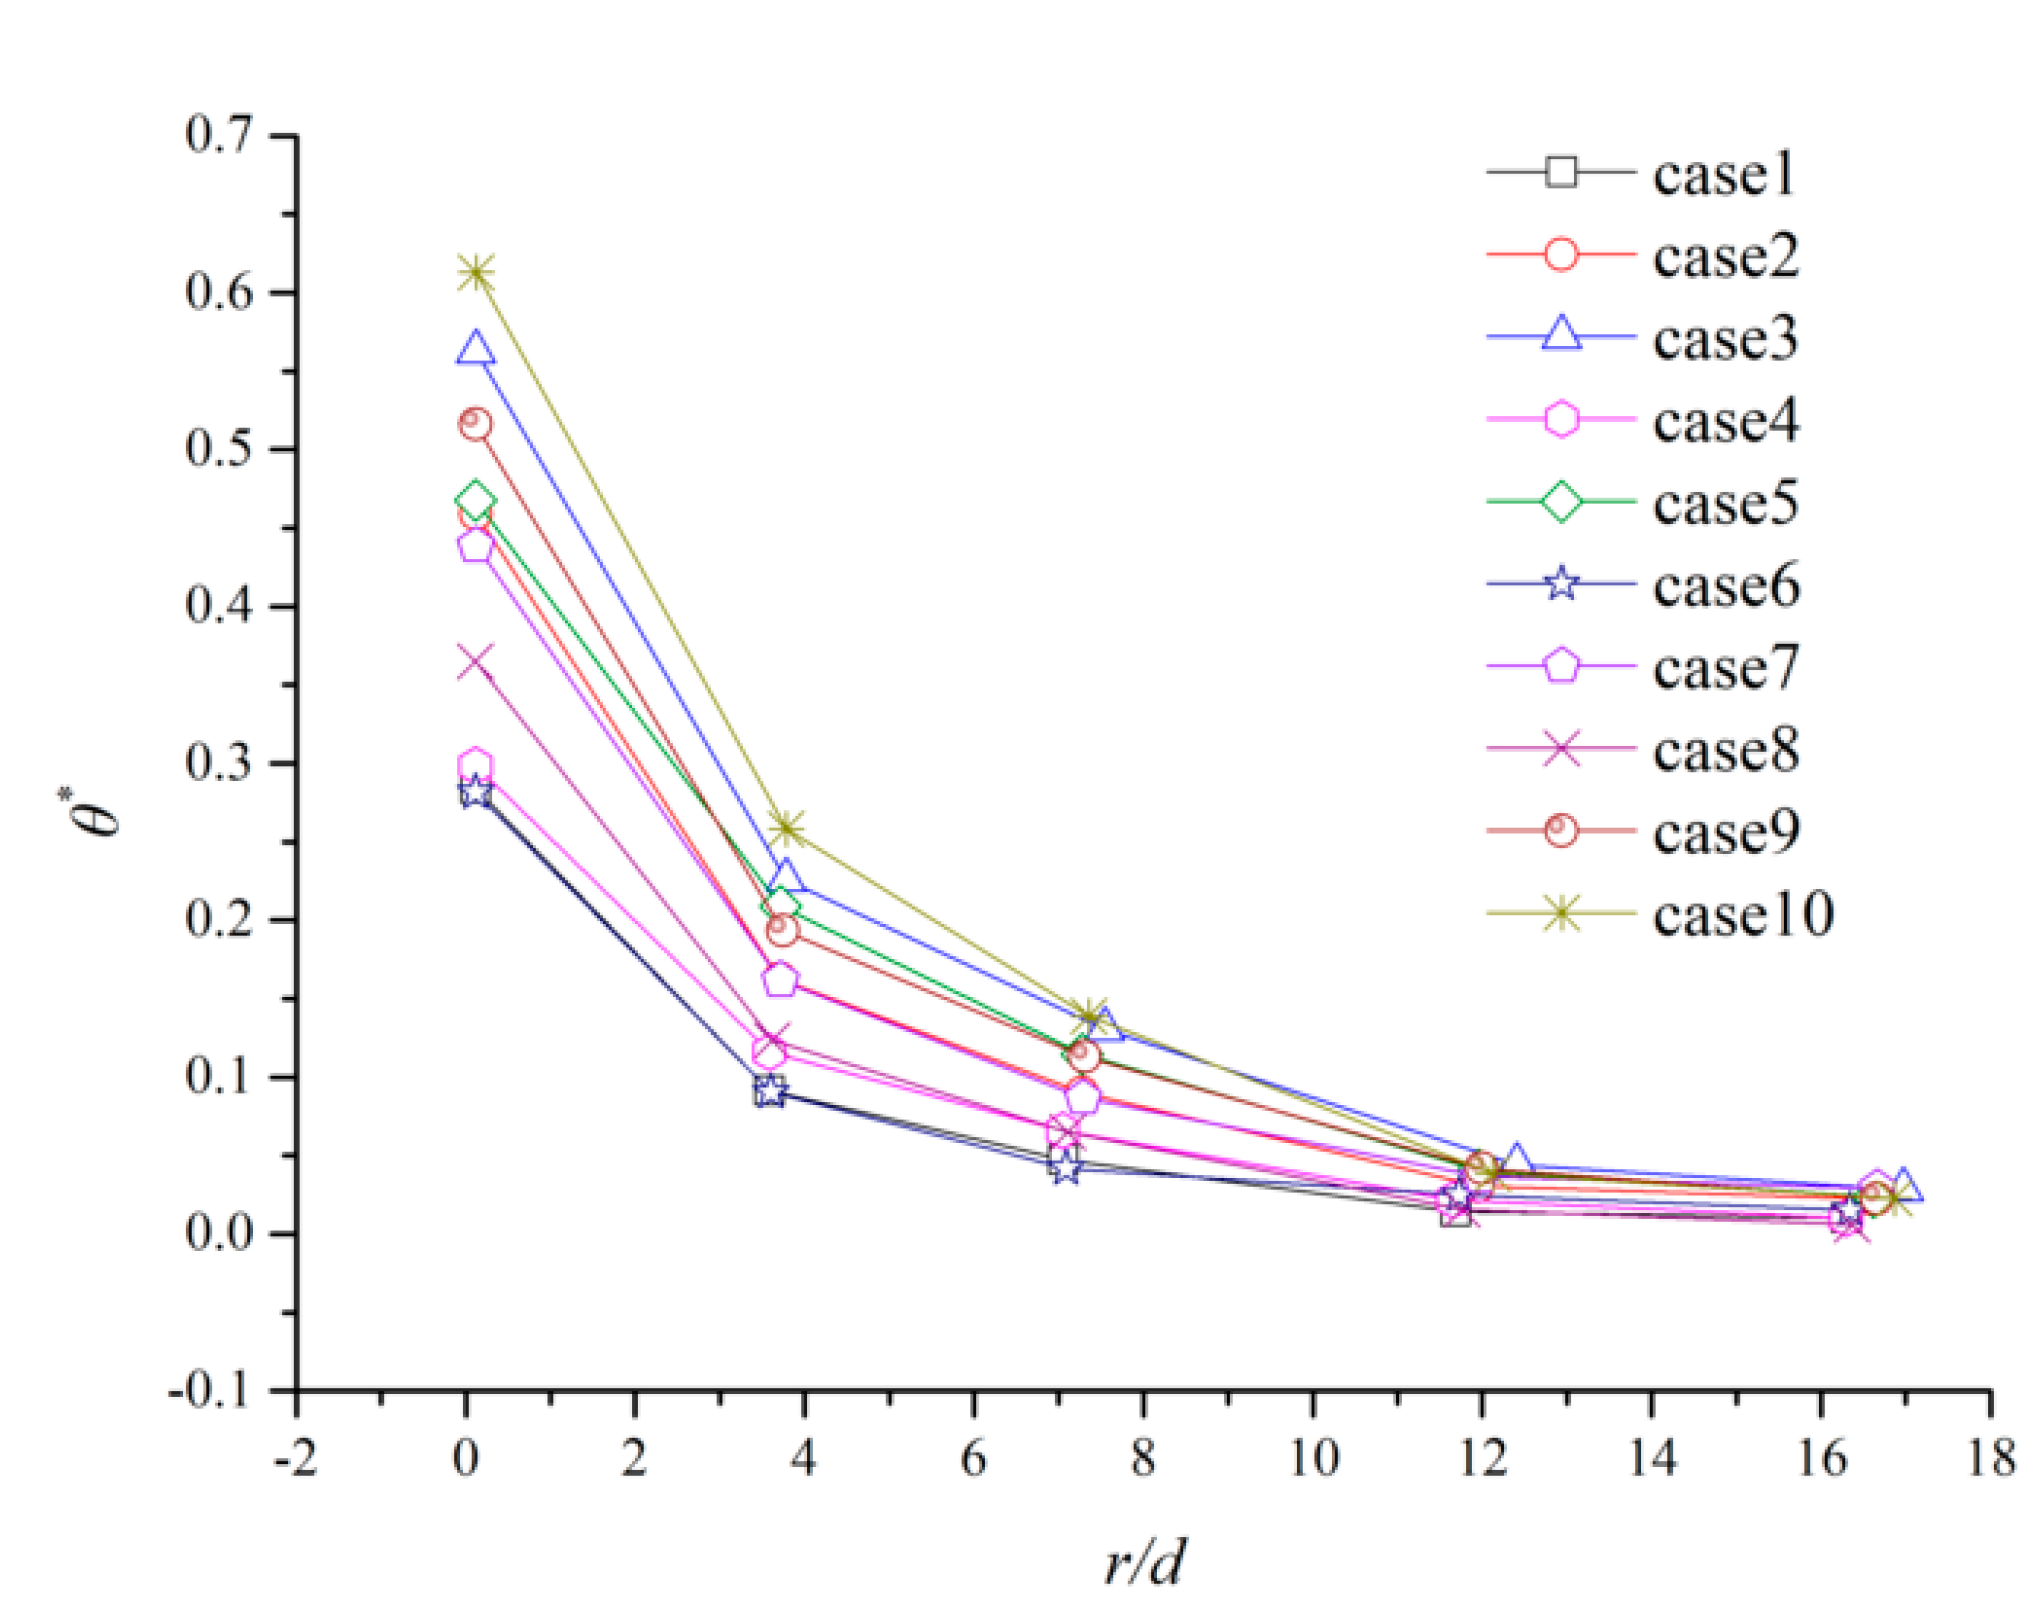
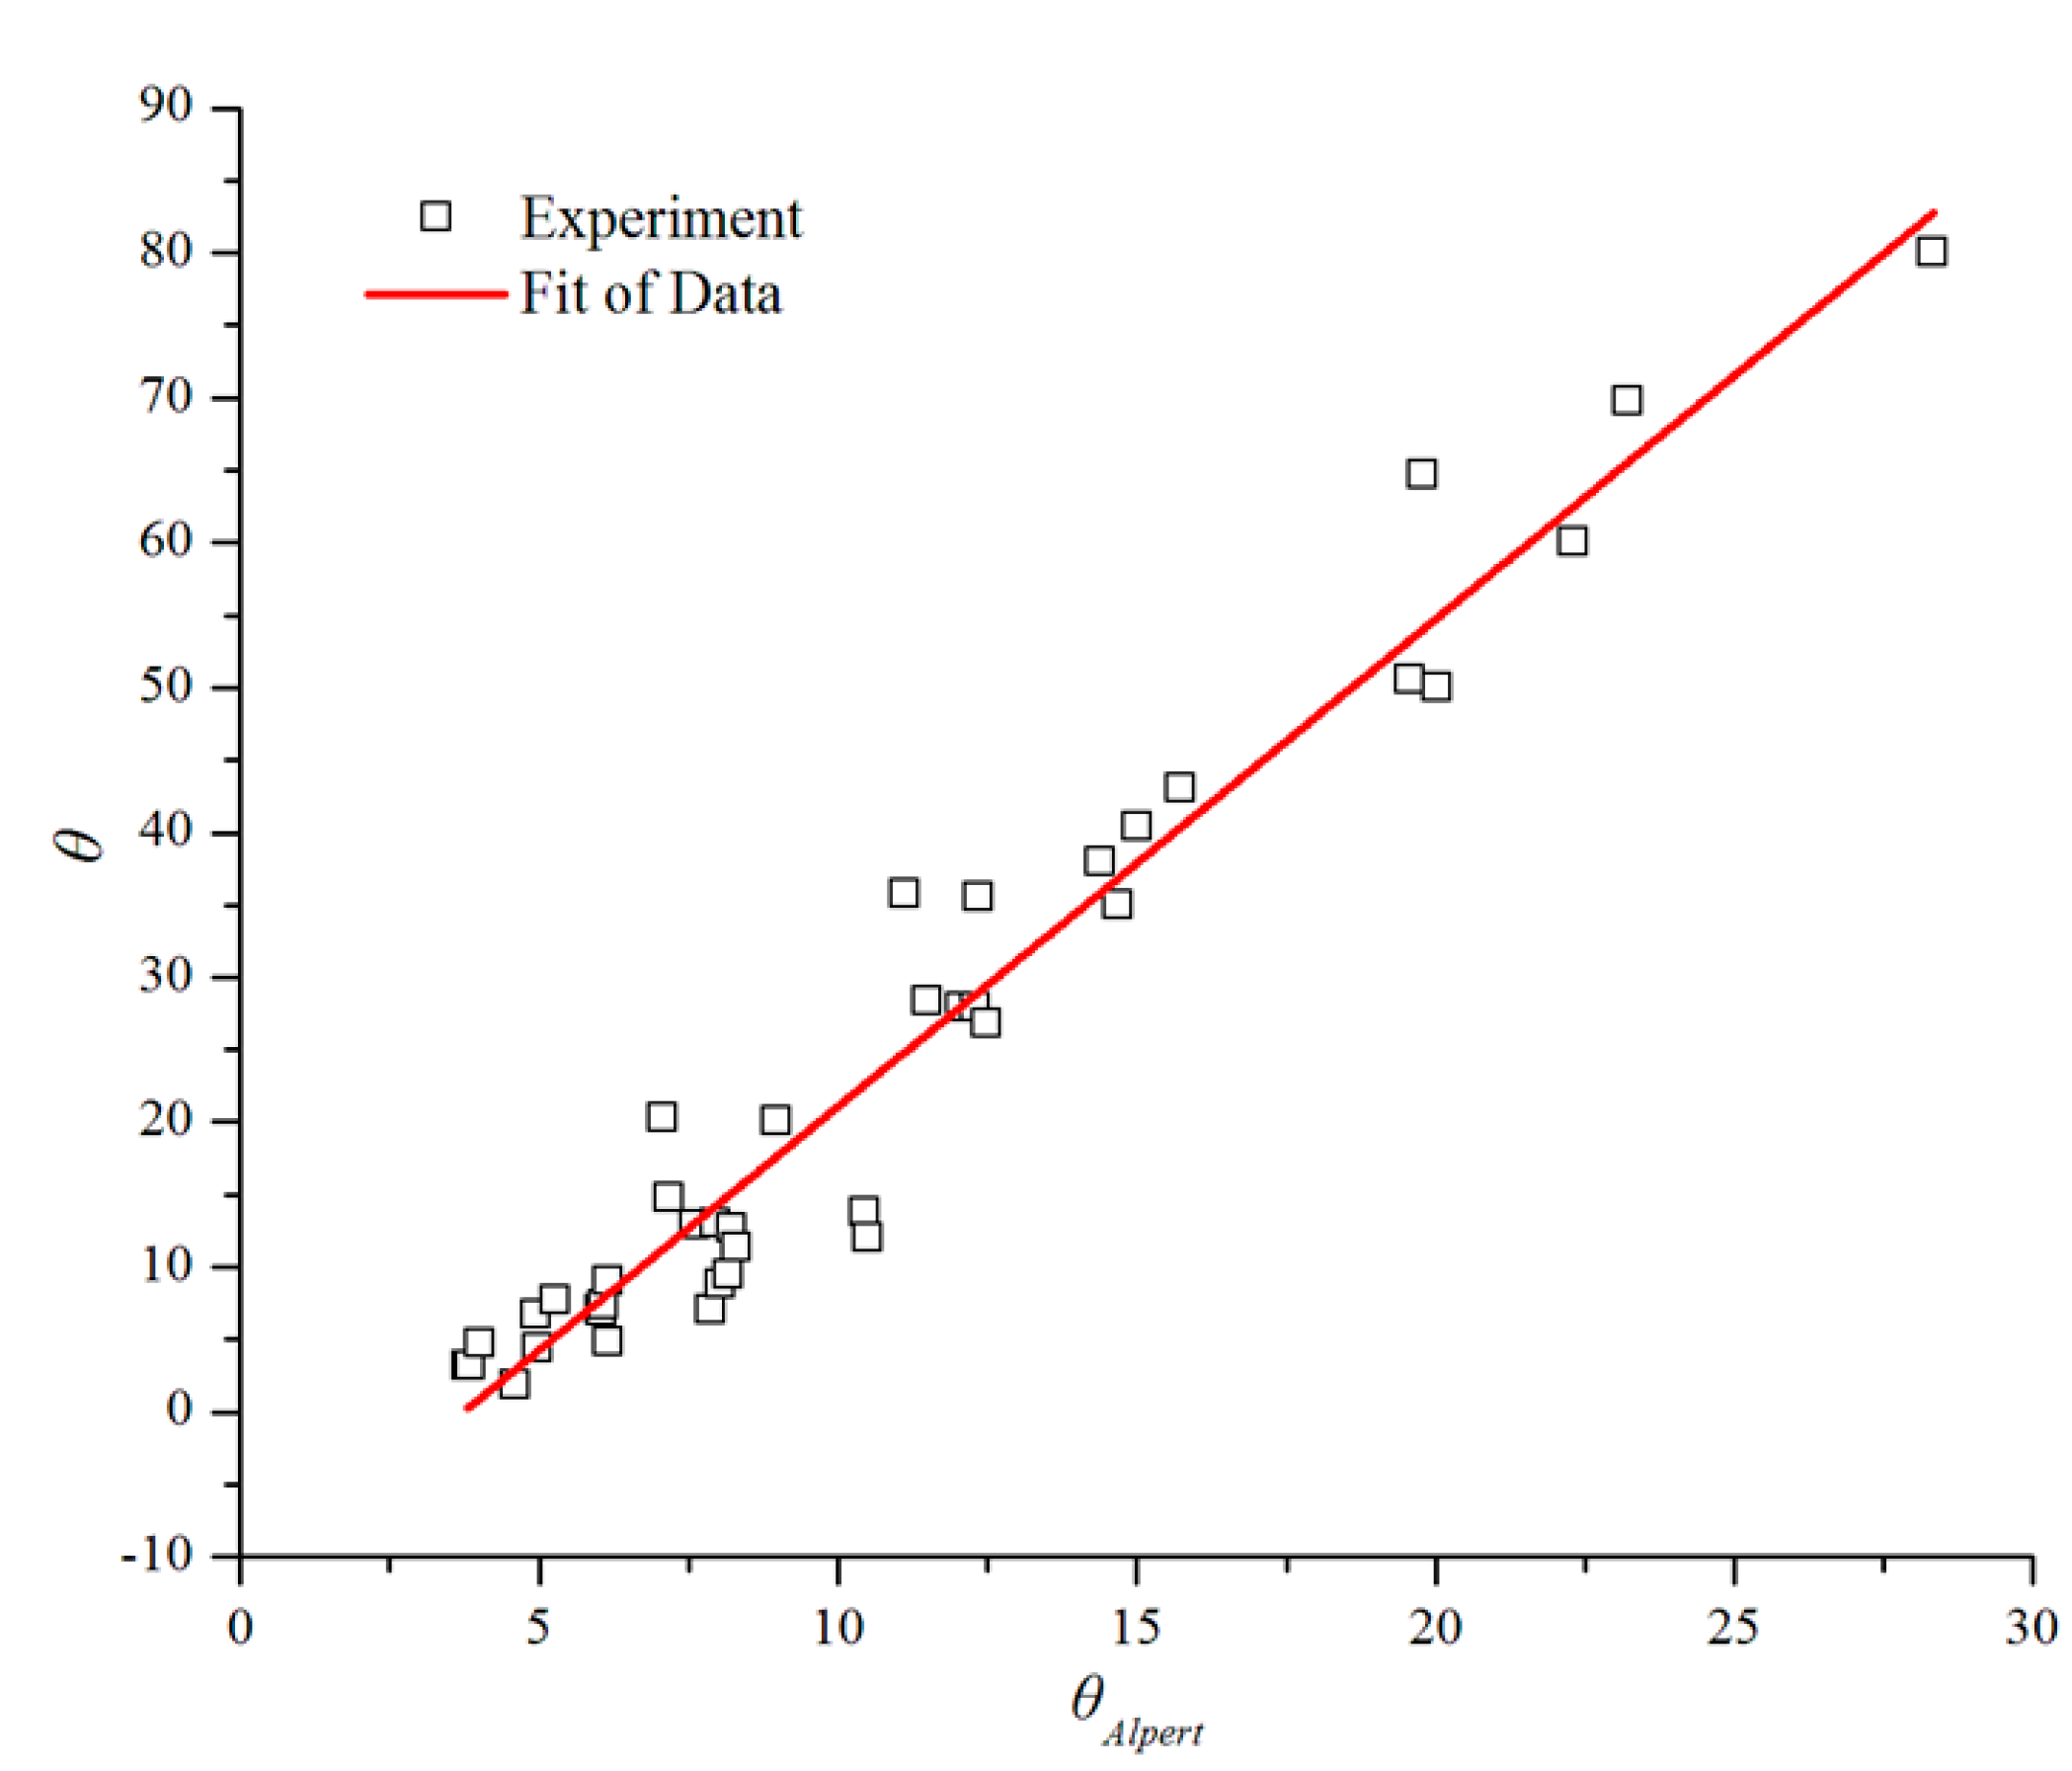
4.4. Maximum Temperature in the Corridor

| Case NO. | 1 | 2 | 3 | 4 | 5 | 6 | 7 | 8 | 9 | 10 |
|---|---|---|---|---|---|---|---|---|---|---|
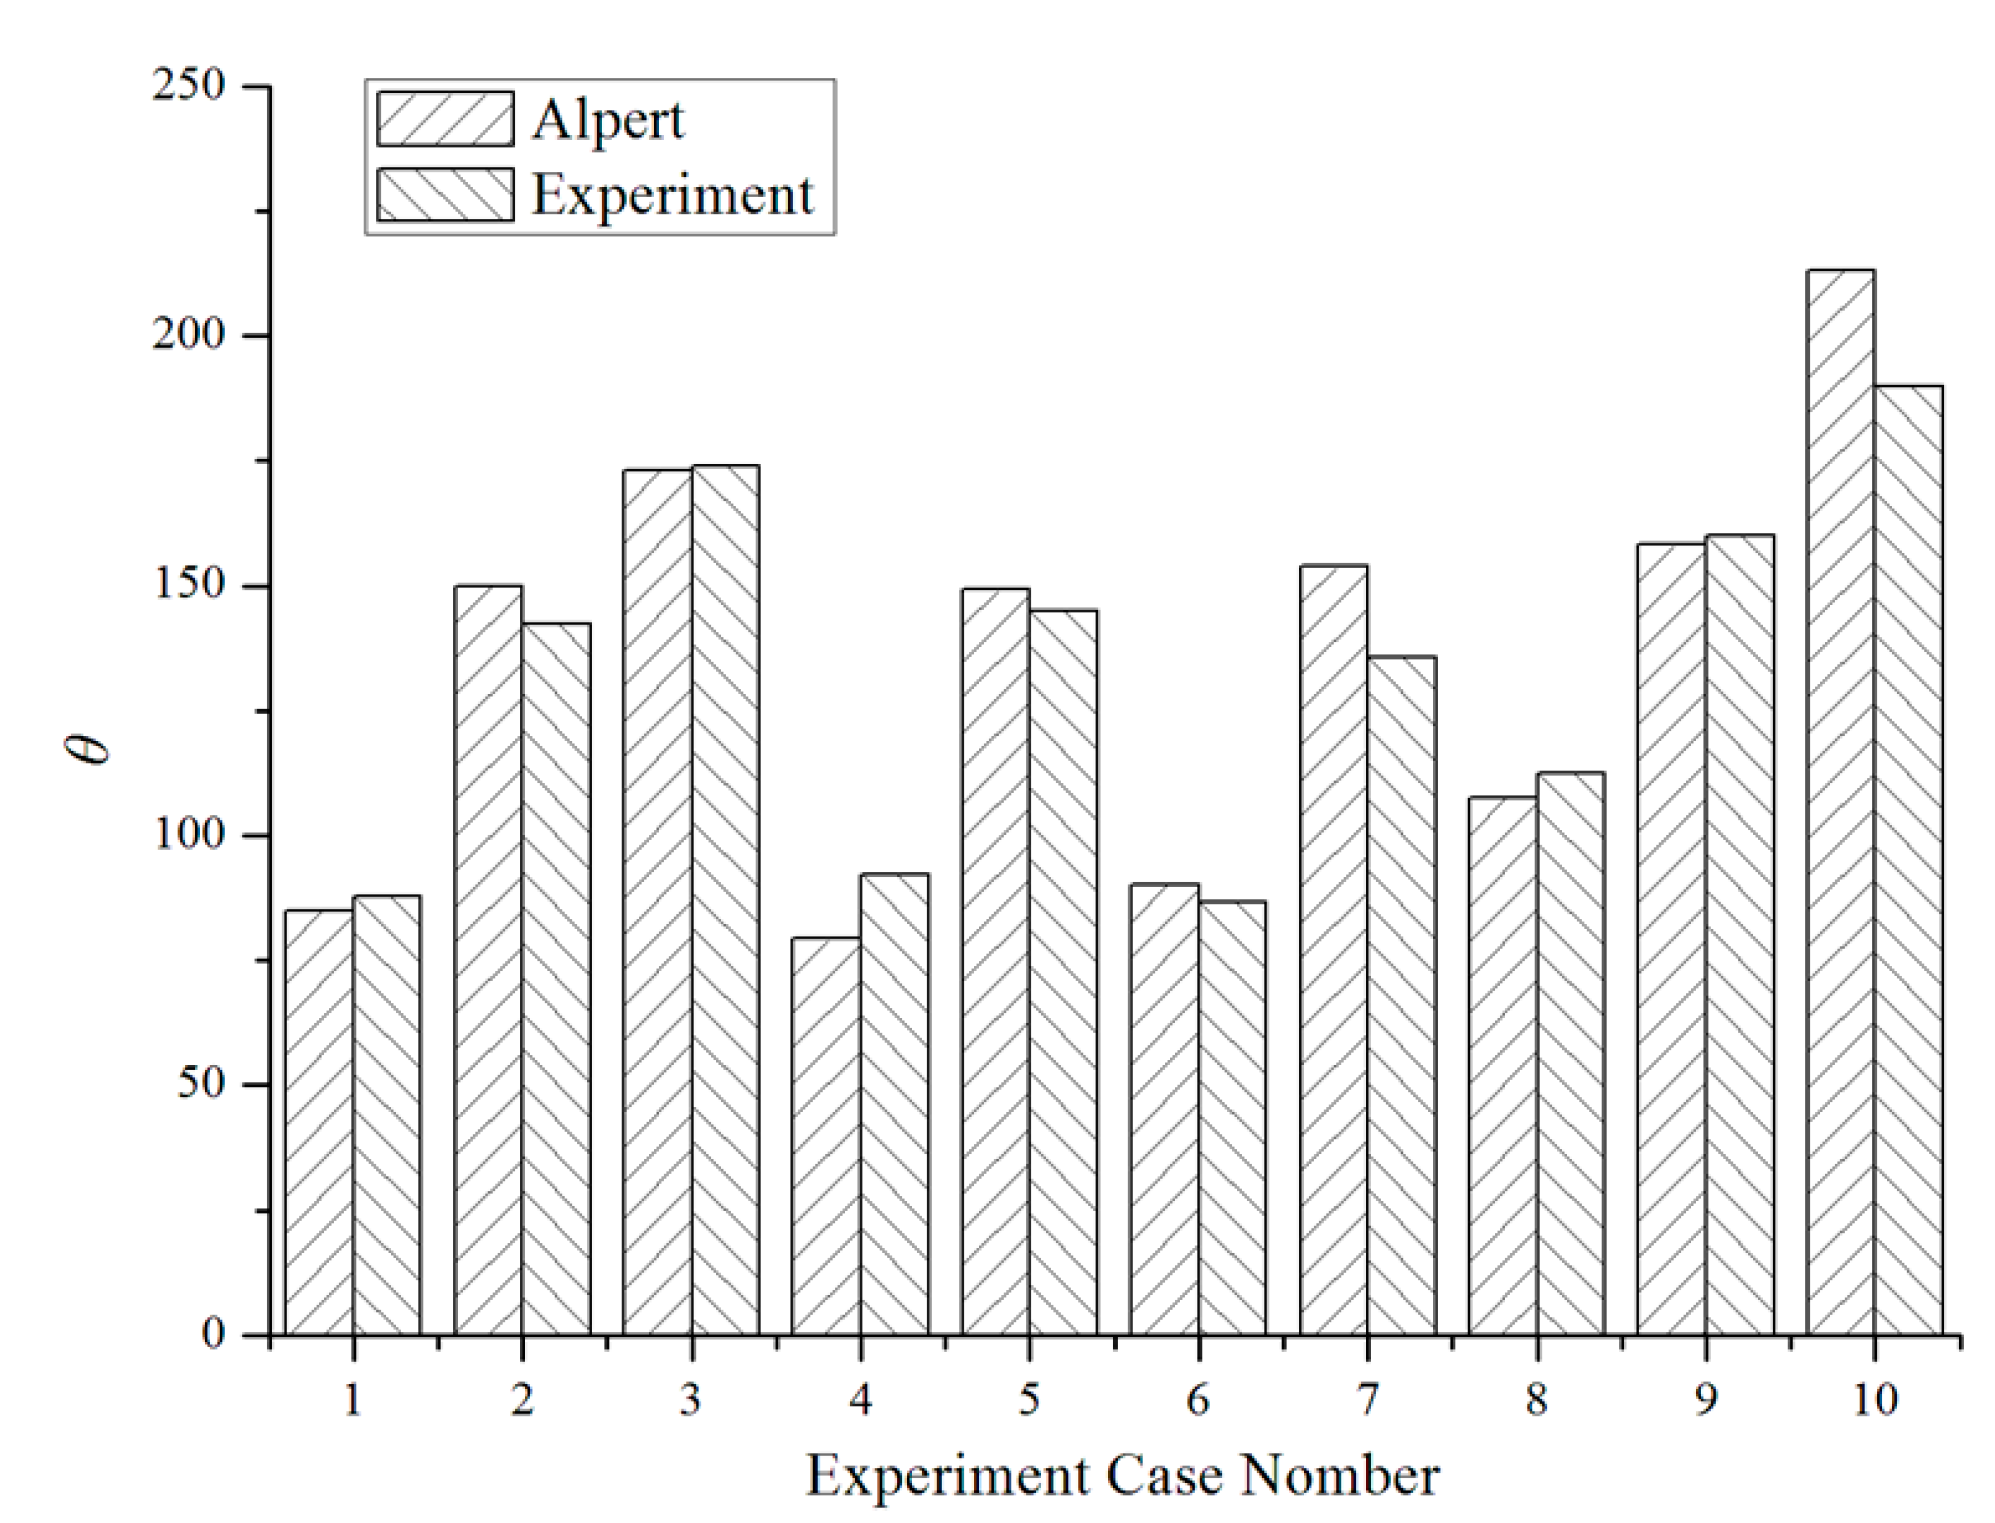
| Experiment/K | 87.9 | 142.4 | 173.9 | 92.2 | 144.9 | 86.8 | 135.6 | 112.5 | 160 | 190 |
| Alpert/K | 85 | 149.9 | 173.1 | 79.3 | 149.3 | 90.2 | 153.9 | 107.7 | 158.3 | 213.2 |
| Error/% | 3.33 | 5.28 | 0.43 | 13.97 | 3.03 | 3.89 | 13.46 | 4.3 | 1.07 | 12.19 |

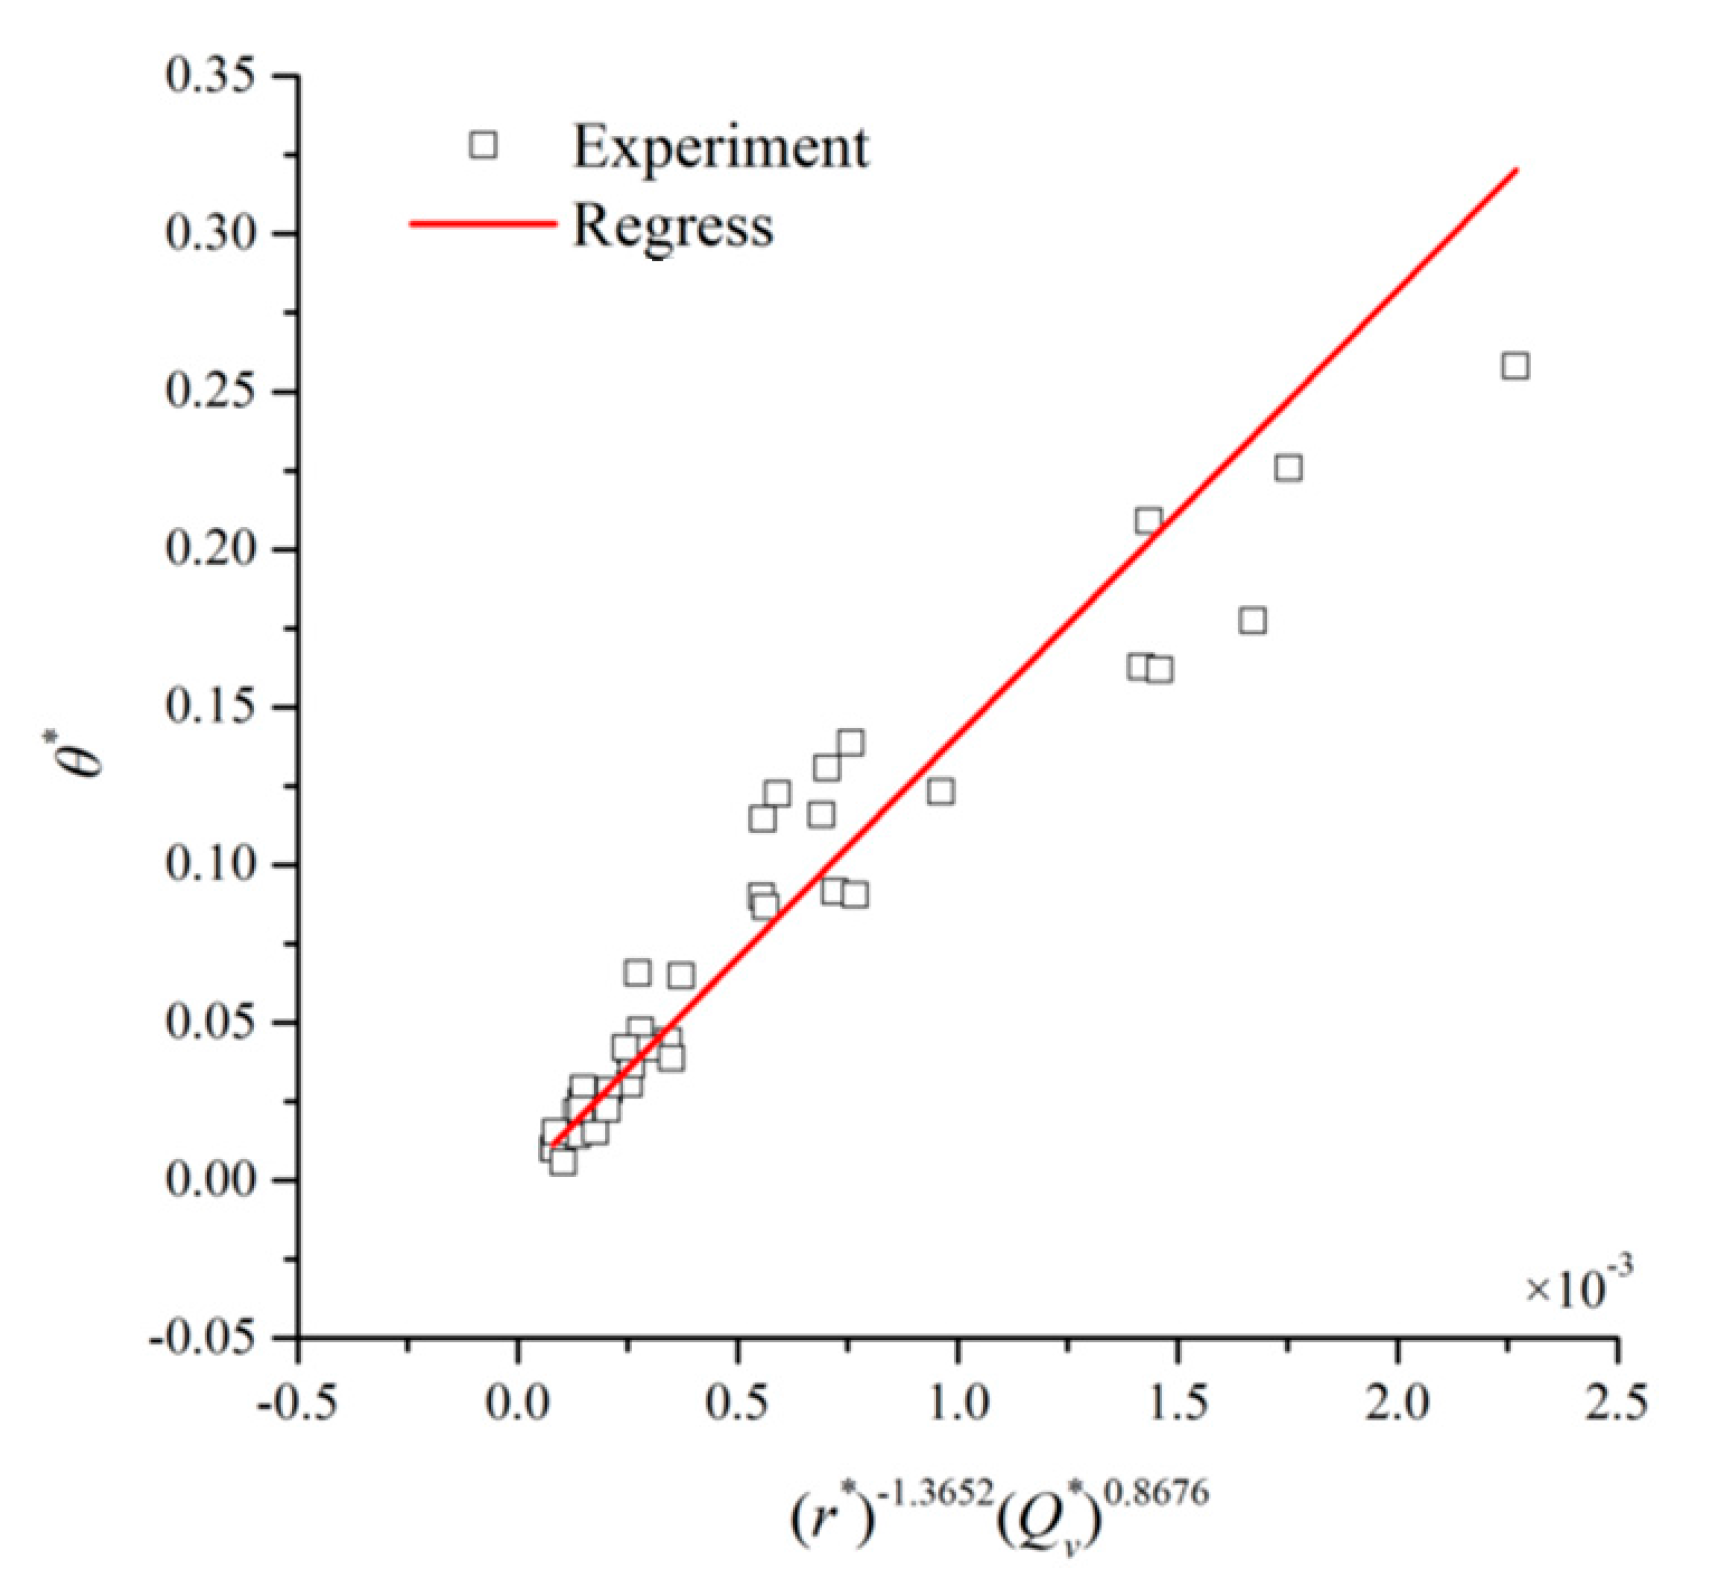
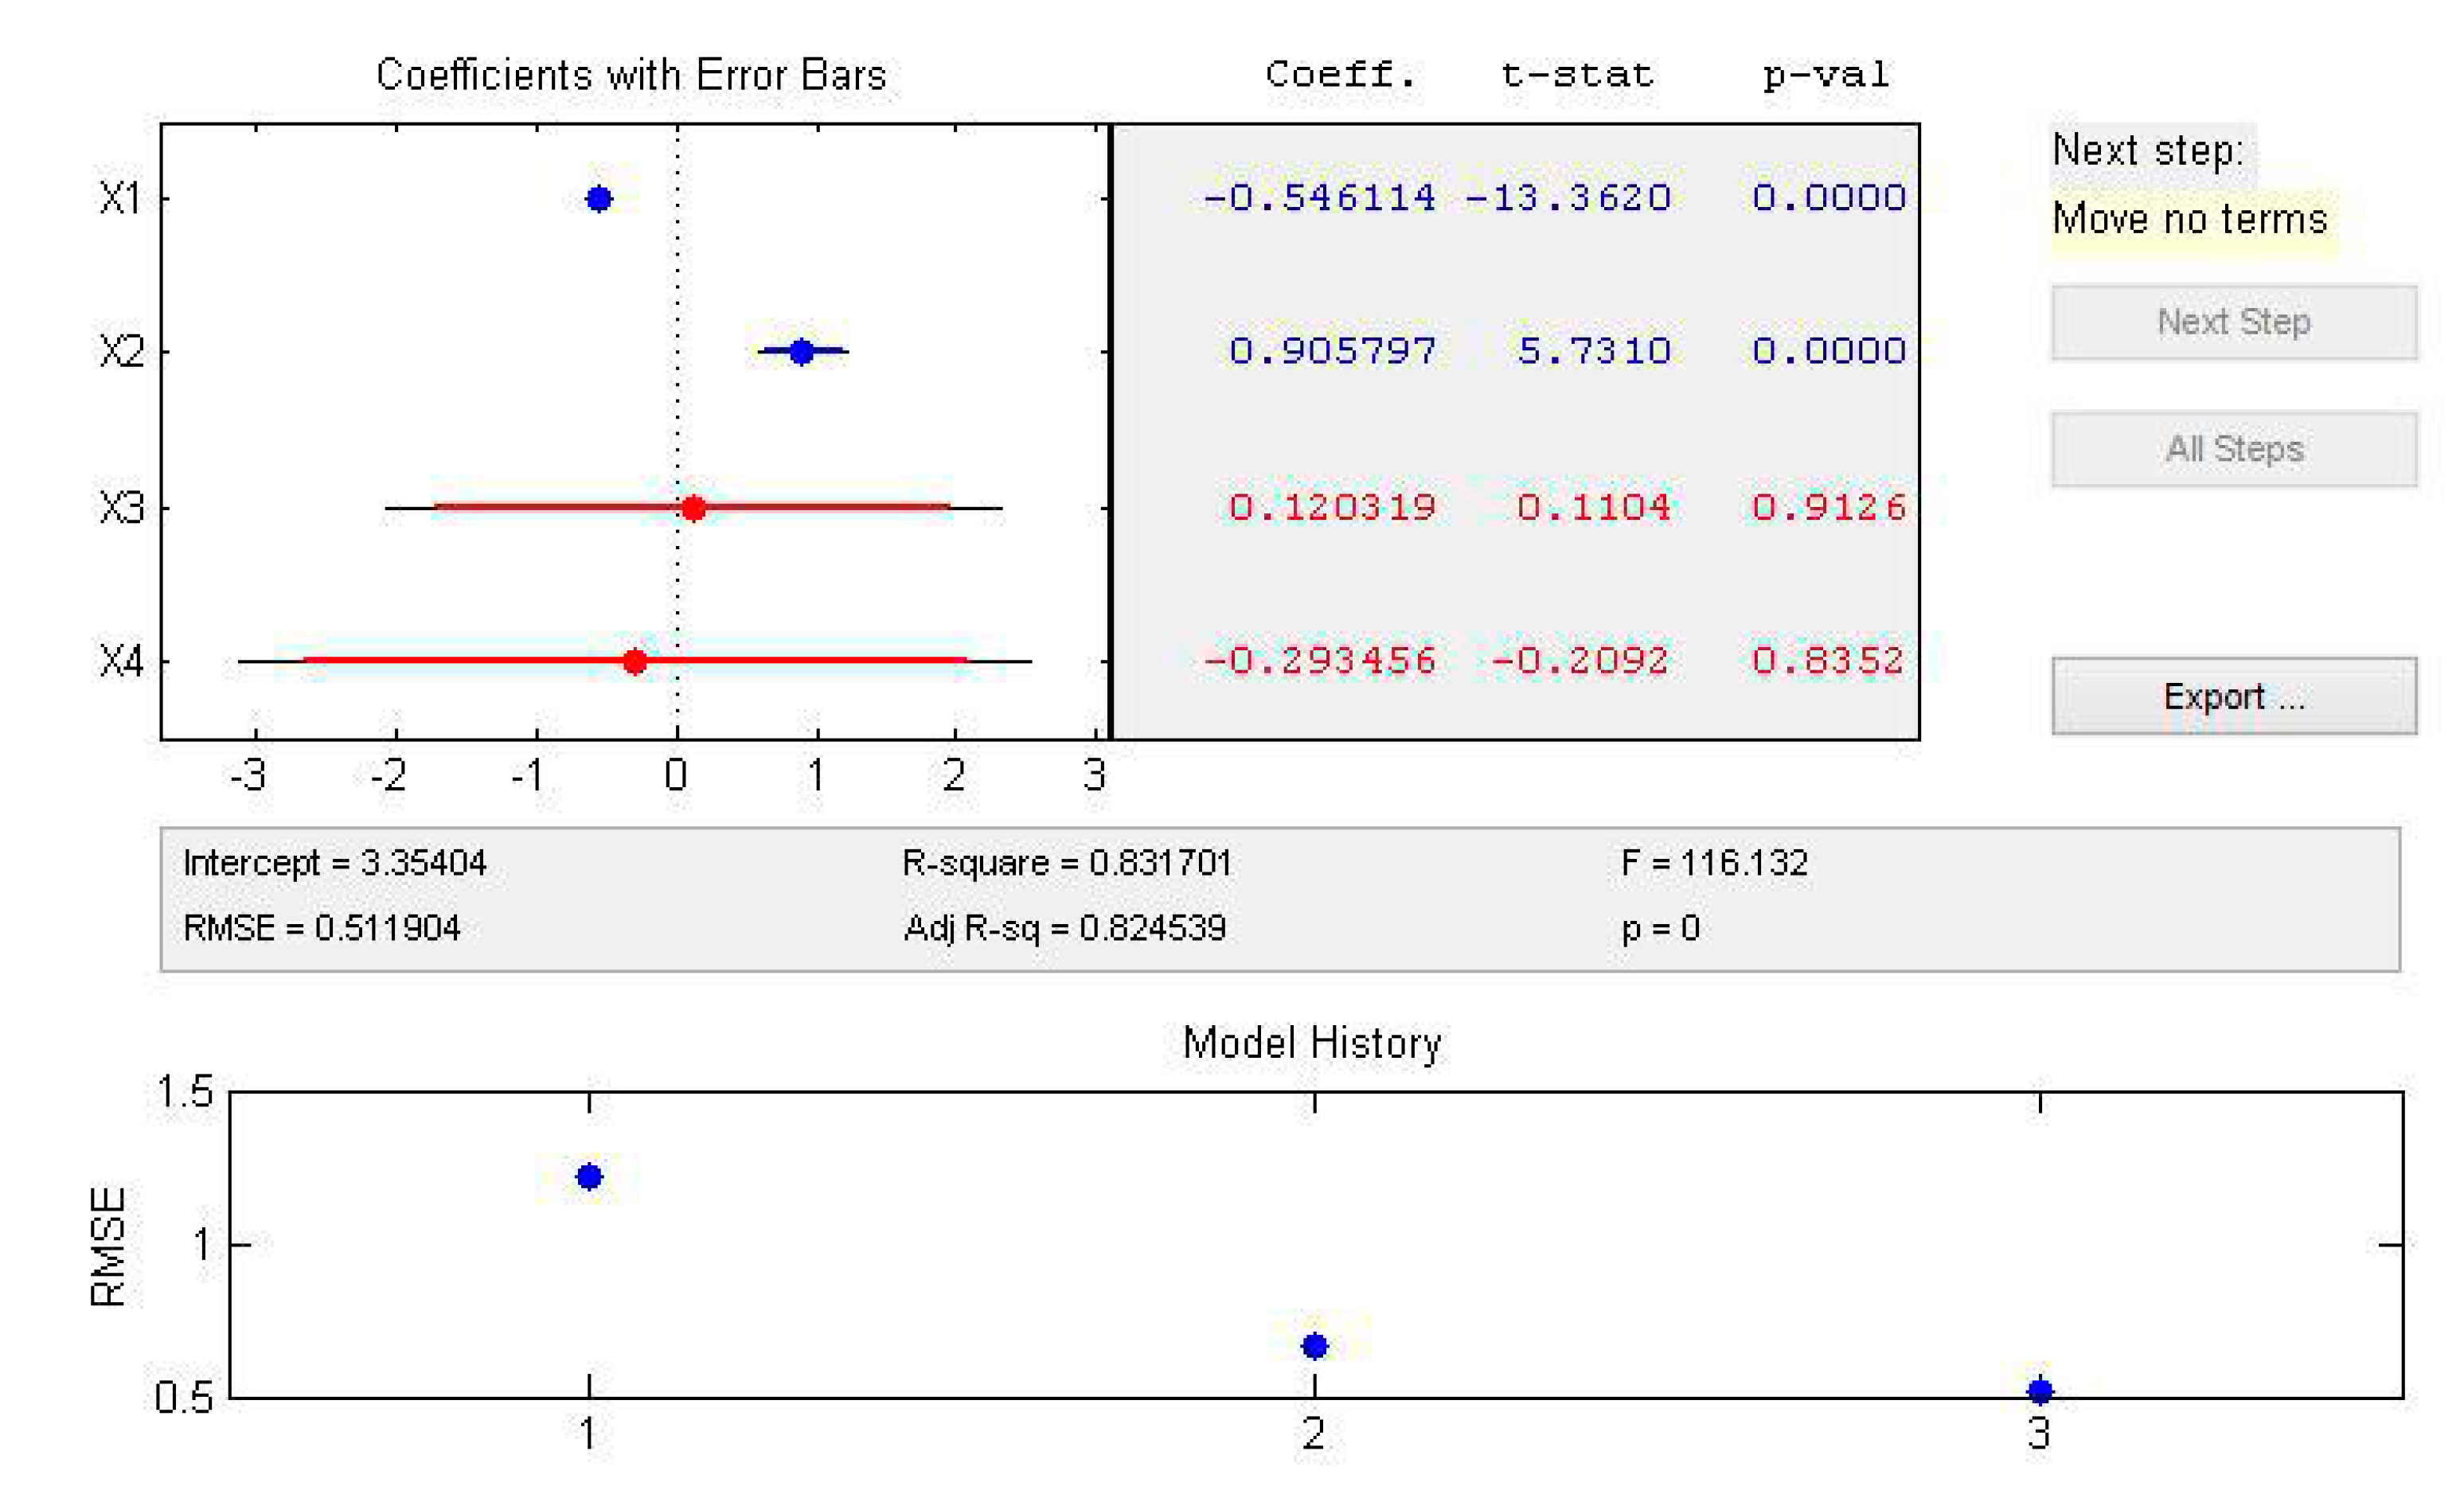
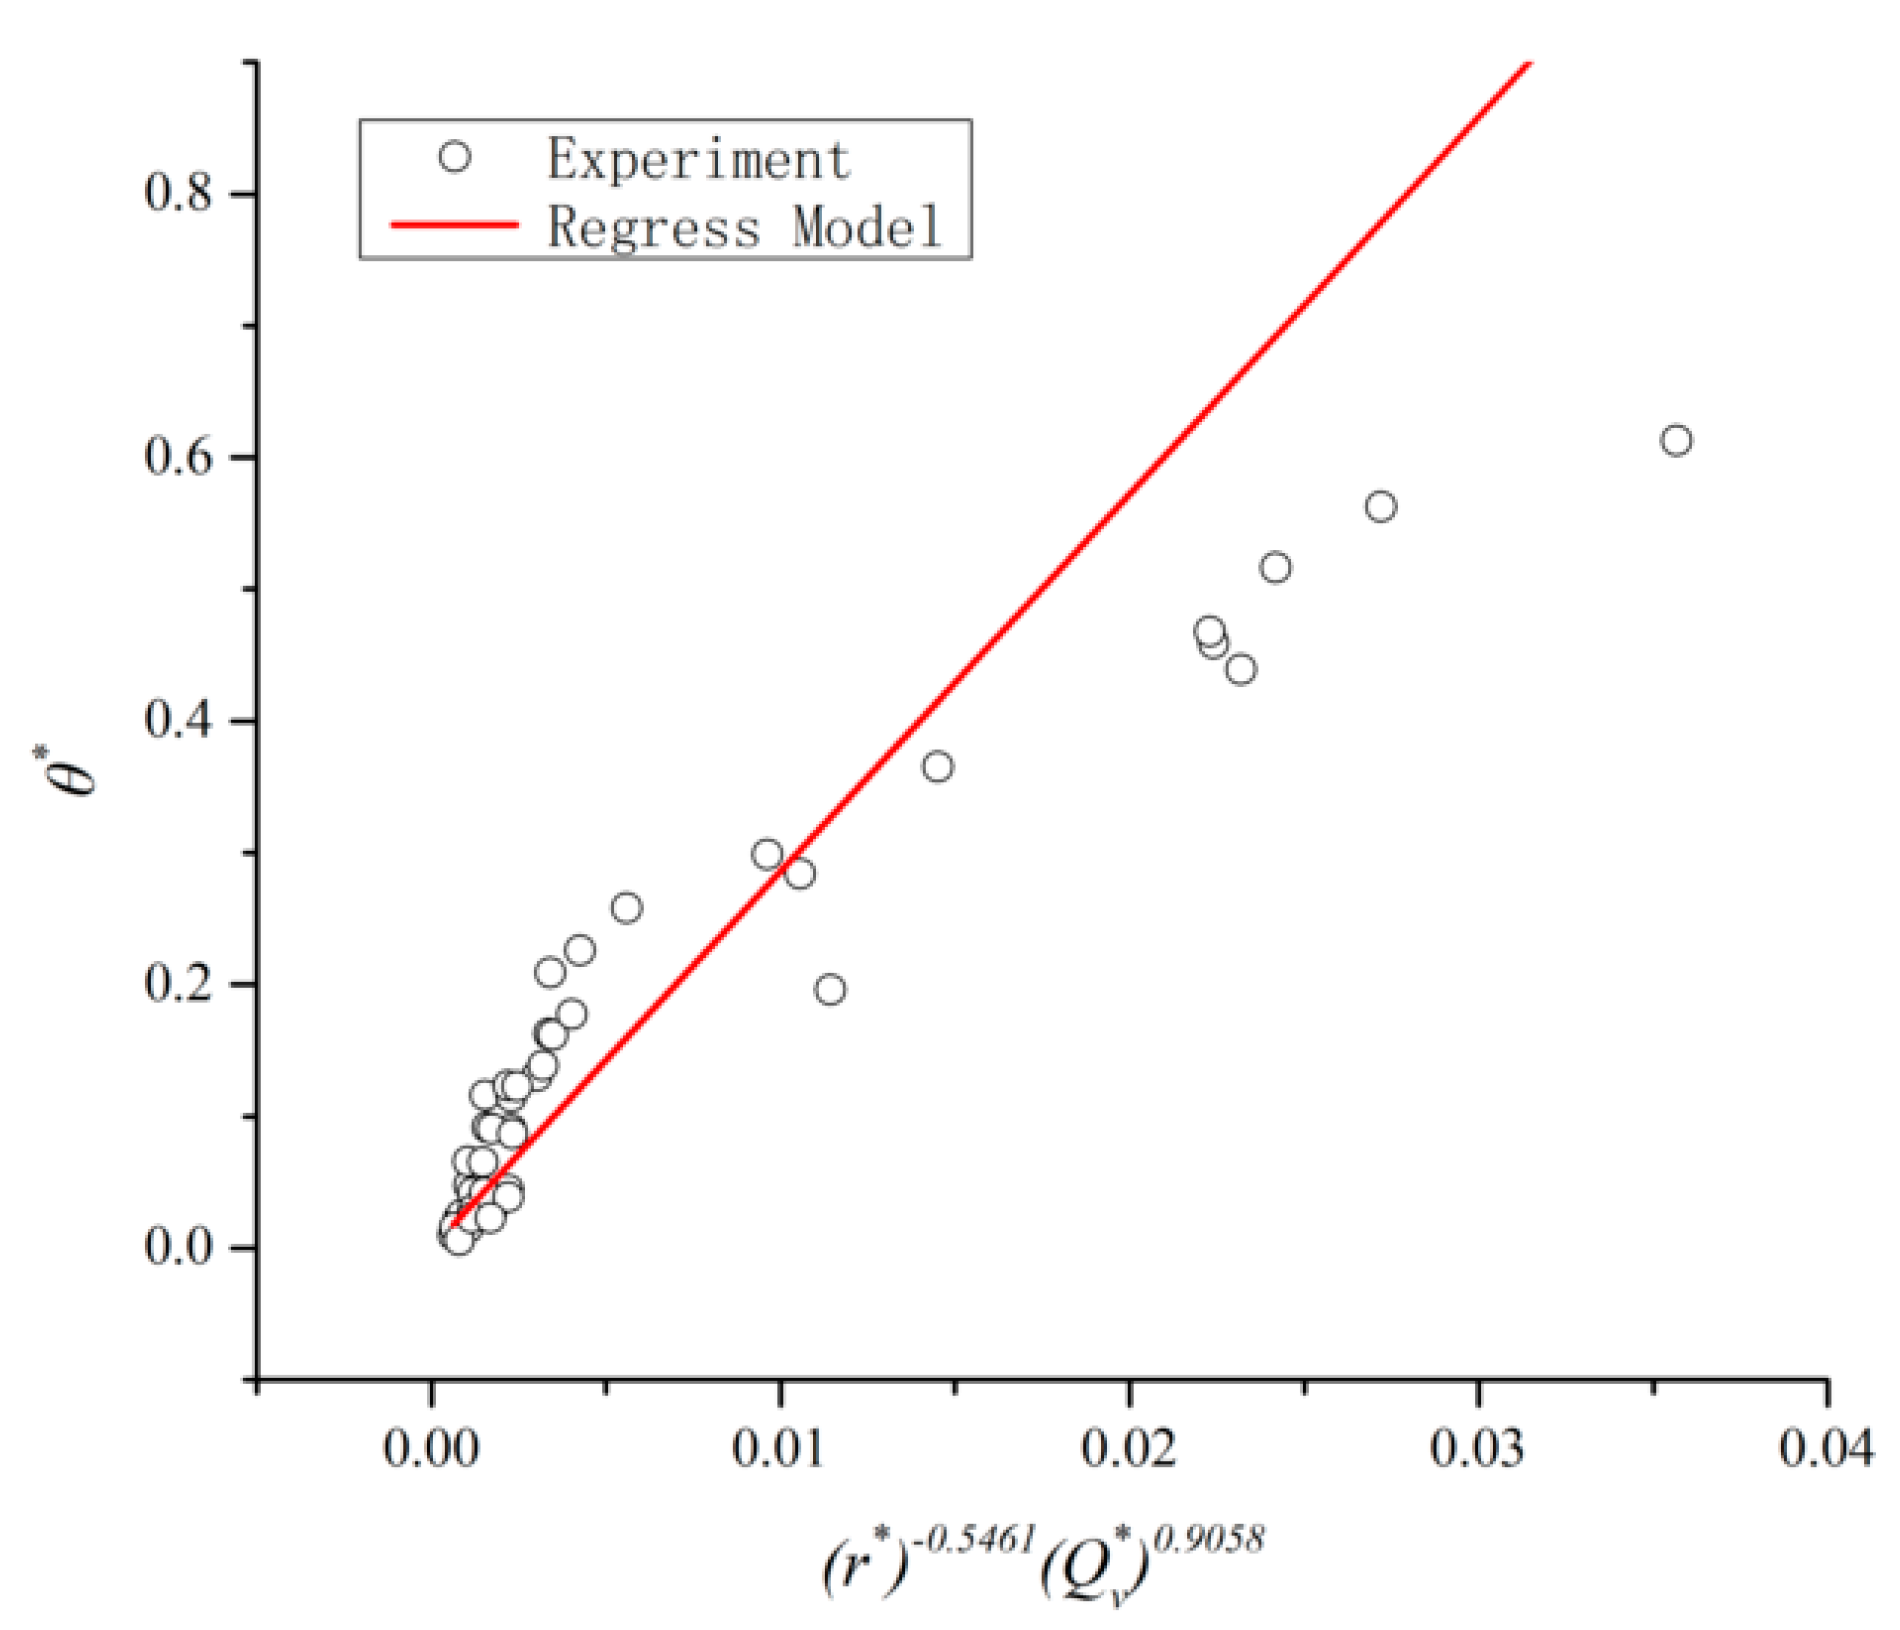
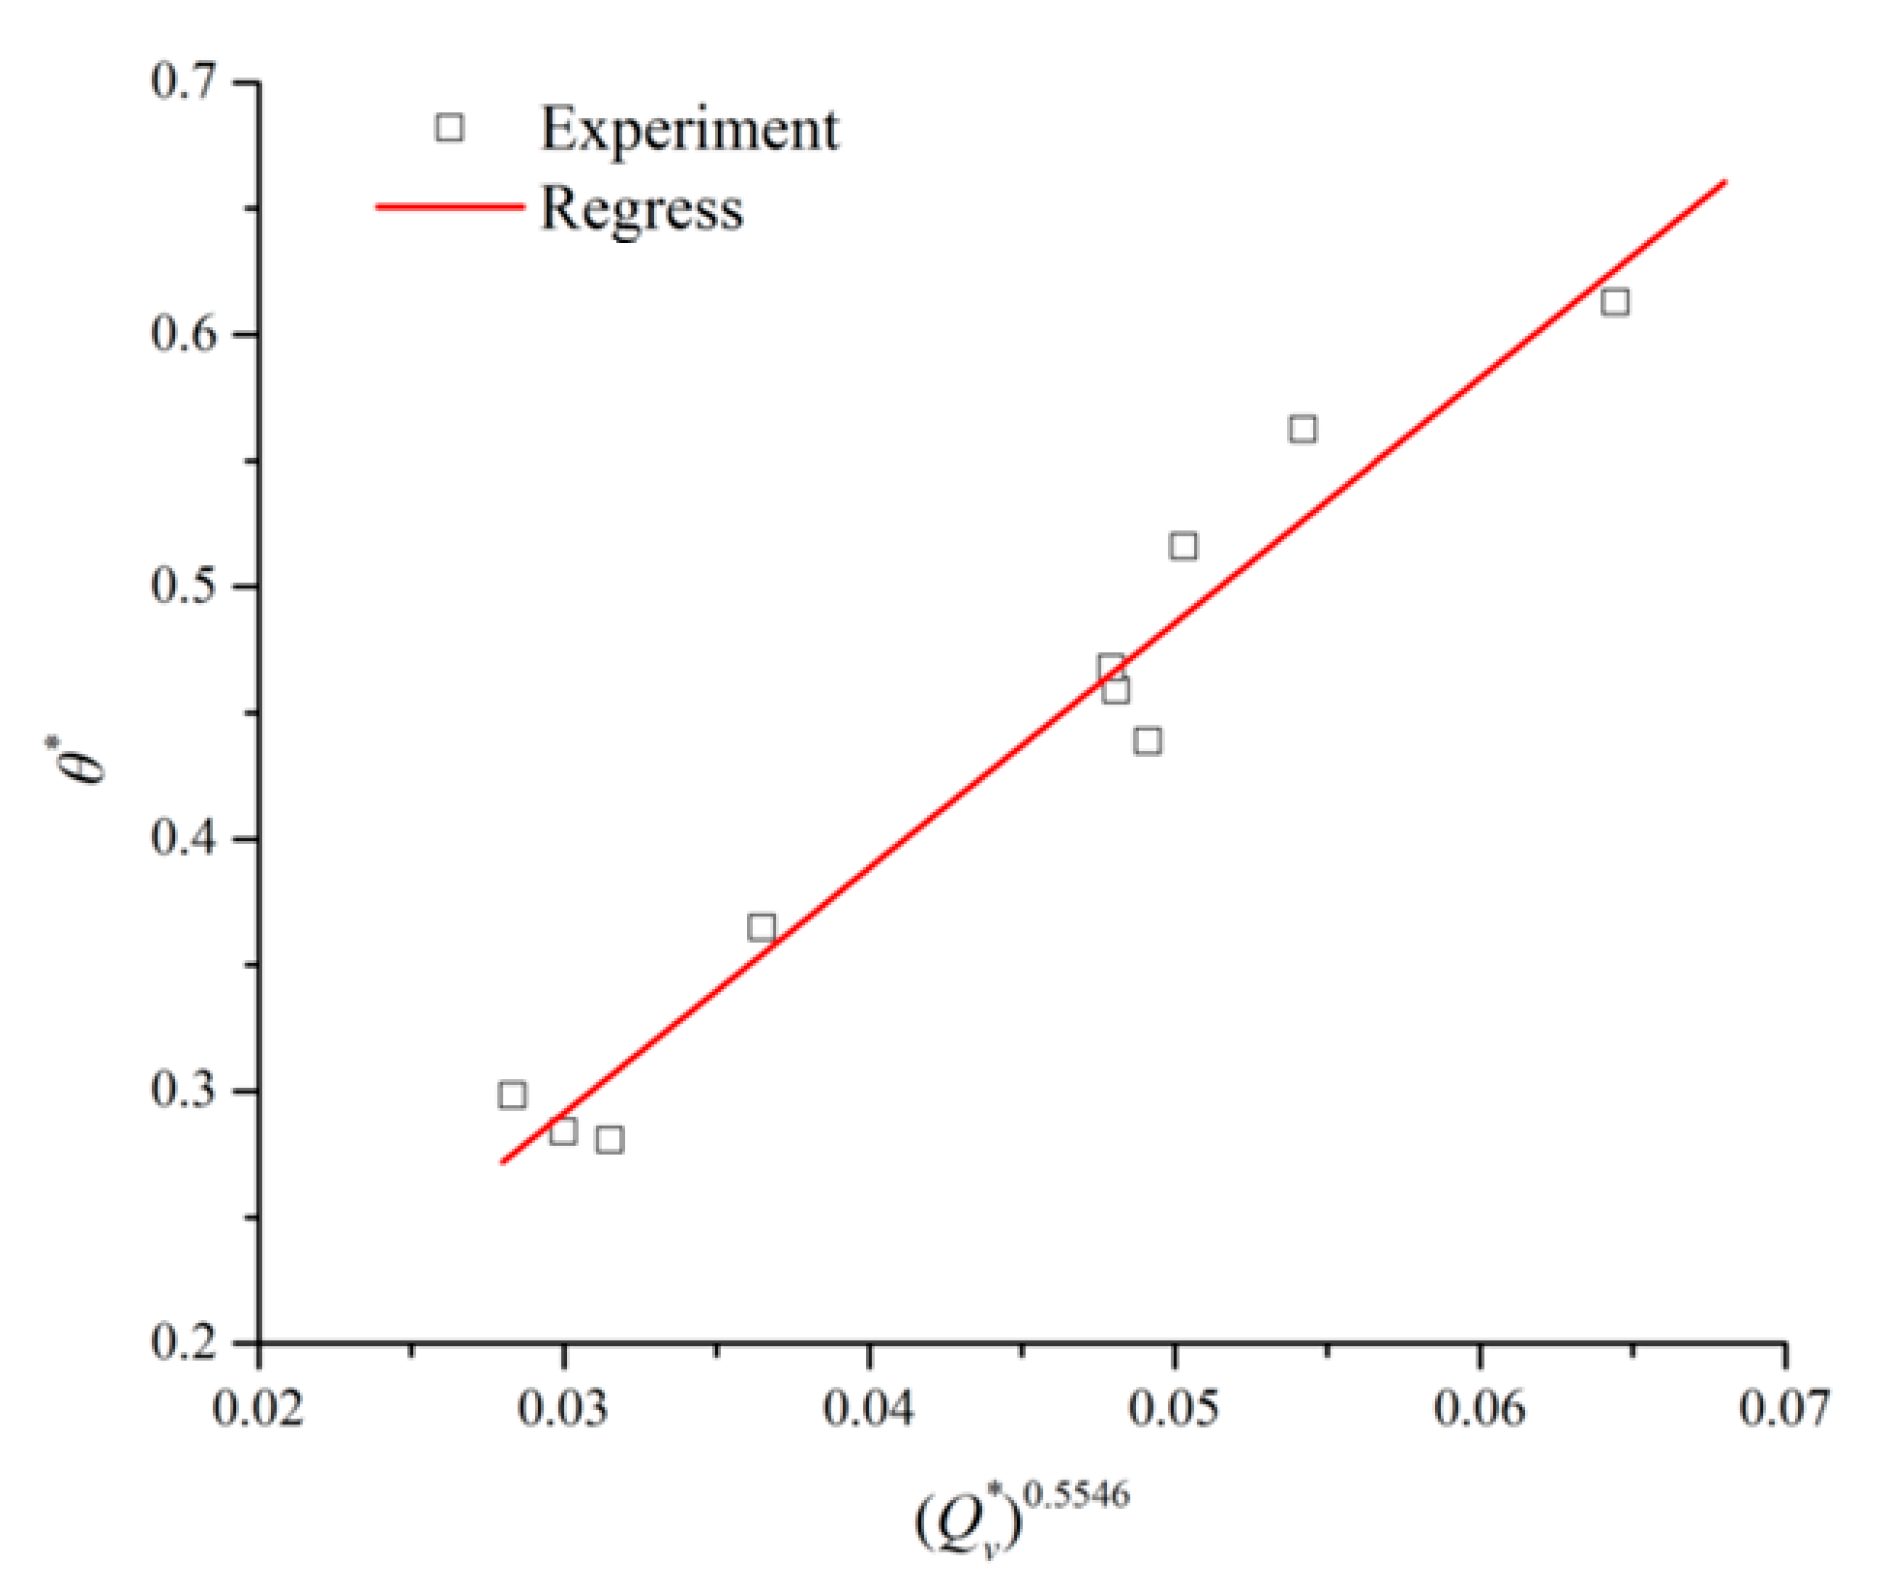
4.5. Model for the Prediction of Maximum Temperature in Corridor
| X1, X2 | X1, X3 | X1, X4 | X2, X3 | X2, X4 | X3, X4 | X1, X2, X3 | X1, X2, X4 | X2, X3, X4 | X1, X2, X3, X4 | |
|---|---|---|---|---|---|---|---|---|---|---|
| R-square | 0.83 | 0.78 | 0.8 | 0.2 | 0.7 | 0.71 | 0.83 | 0.83 | 0.7 | 0.83 |
| RMSE | 0.51 | 0.58 | 0.56 | 1.12 | 0.68 | 0.68 | 0.52 | 0.52 | 0.68 | 0.52 |

5. Conclusions
- (a)
- A virtual fire model was proposed to investigate the correlations between the maximum temperature increase under the corridor ceiling and the smoke temperature in the fire room, and based on the Buckingham’s theorem and dimensional analysis, we obtained four dimensionless numbers which affect the maximum smoke temperature under the corridor ceiling.
- (b)
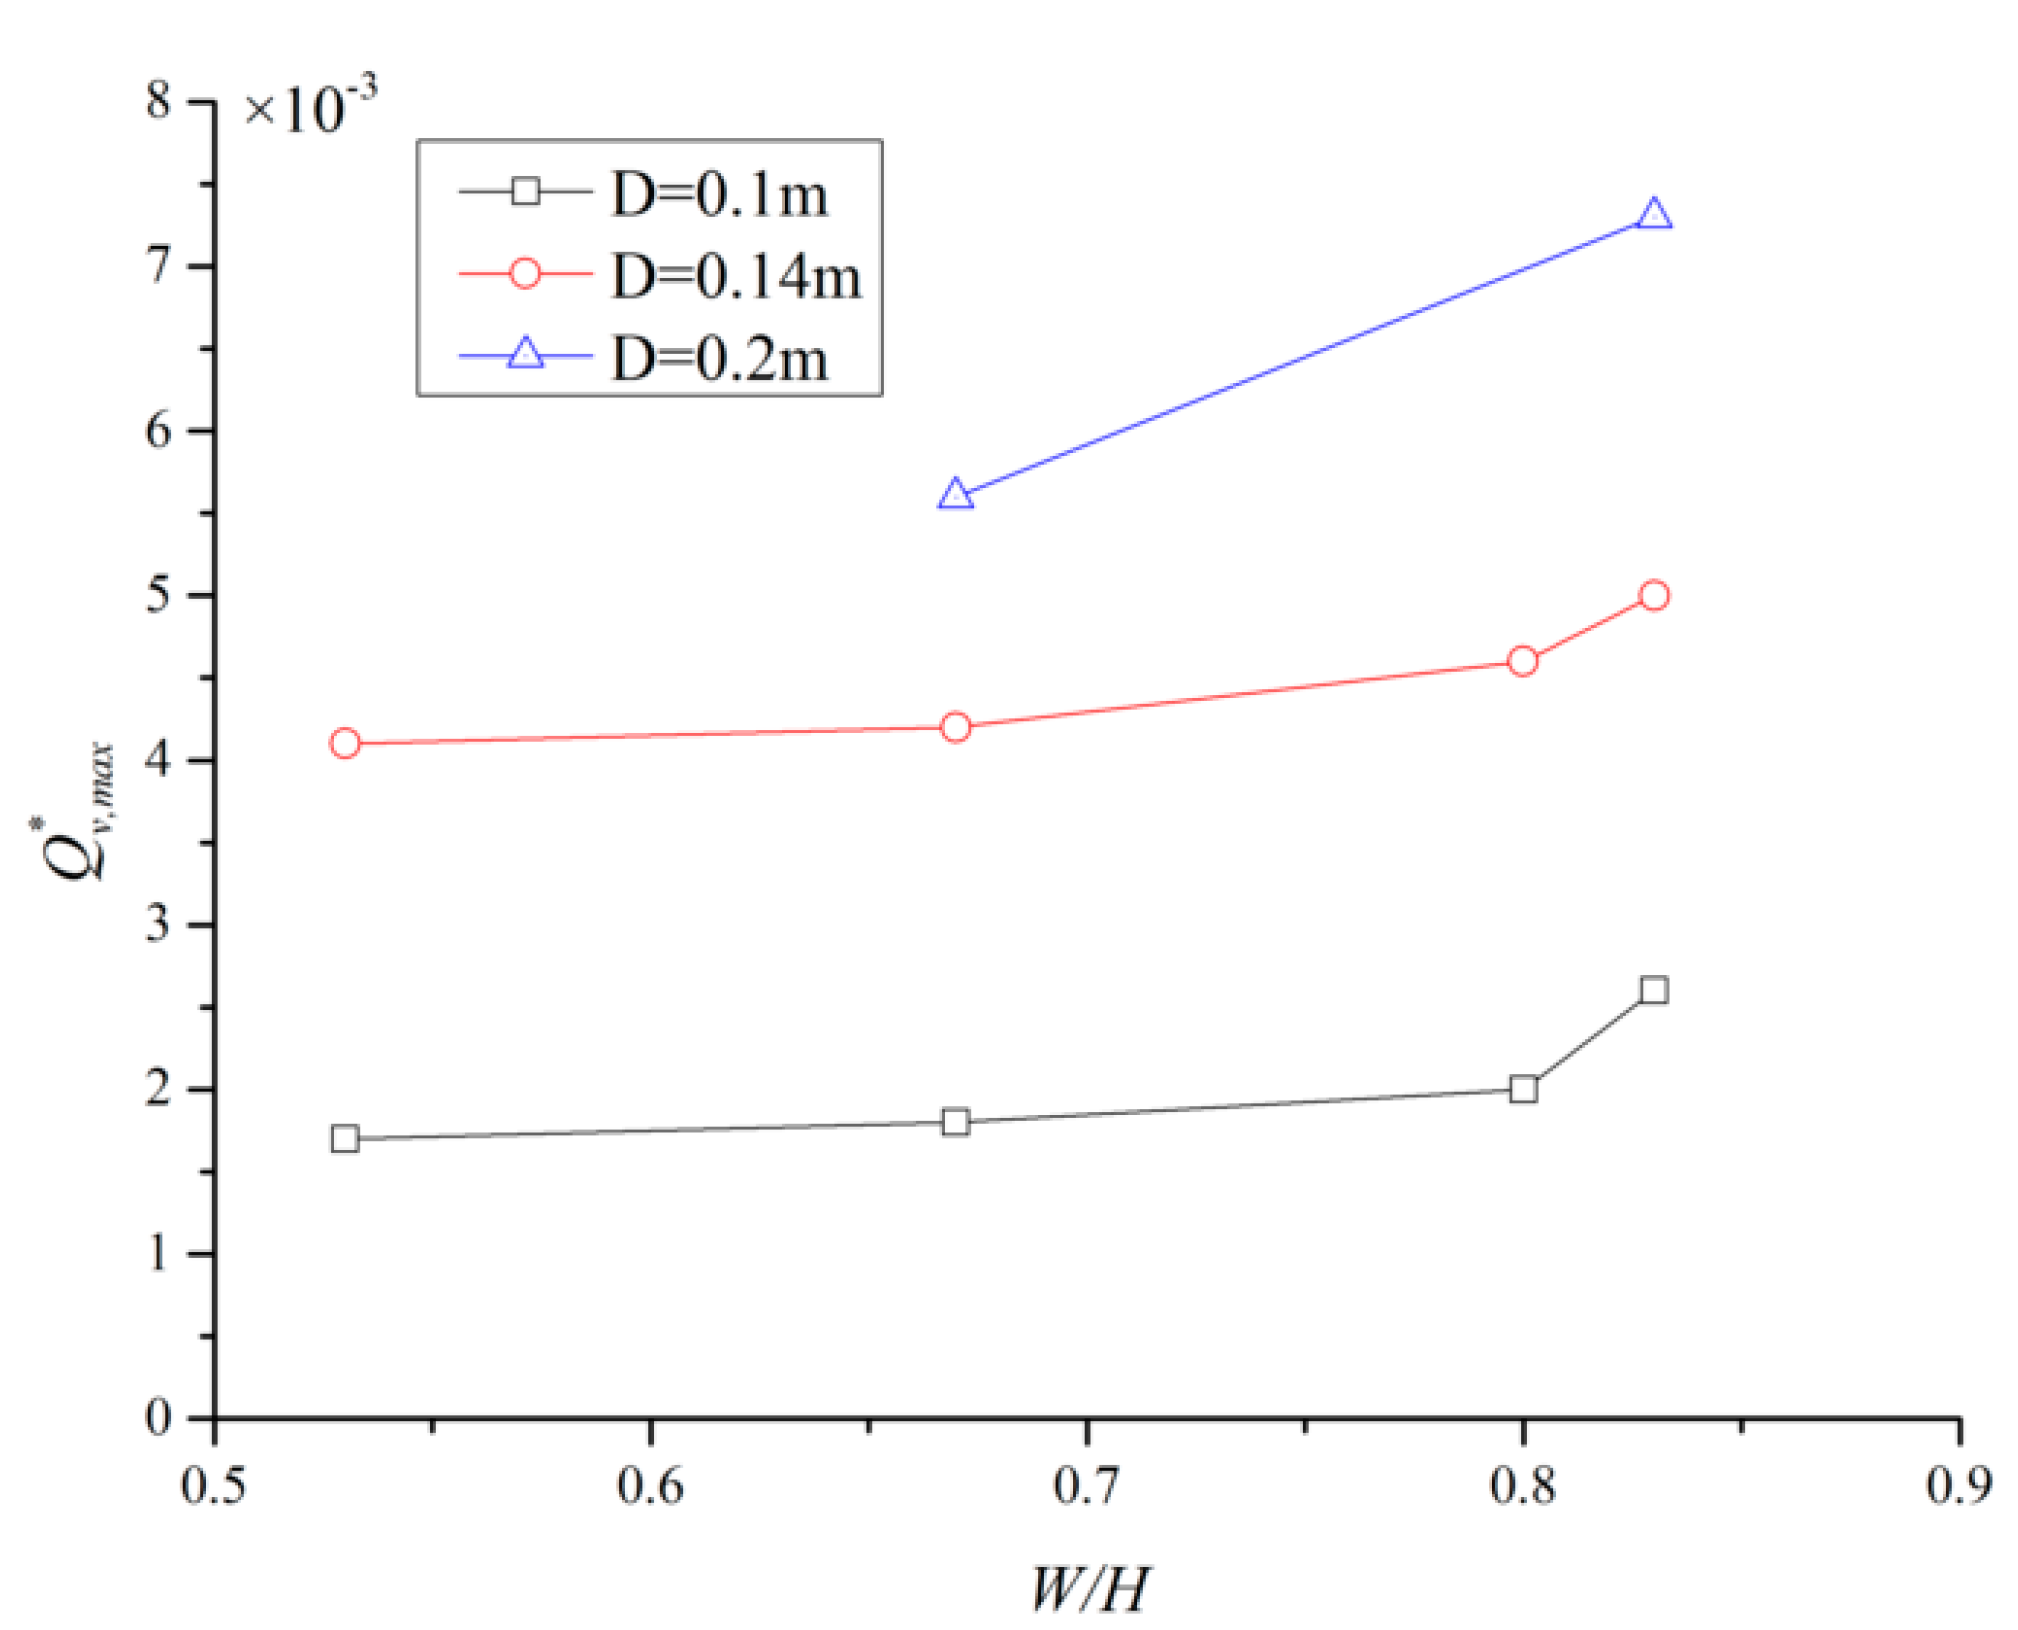
- Corridor height had a visible impact on the virtual fire HRR and the position of the virtual fire source. Inversely, the virtual fire HRR and the position of the virtual fire source were insignificantly affected due to the transformation of corridor width.
- (c)
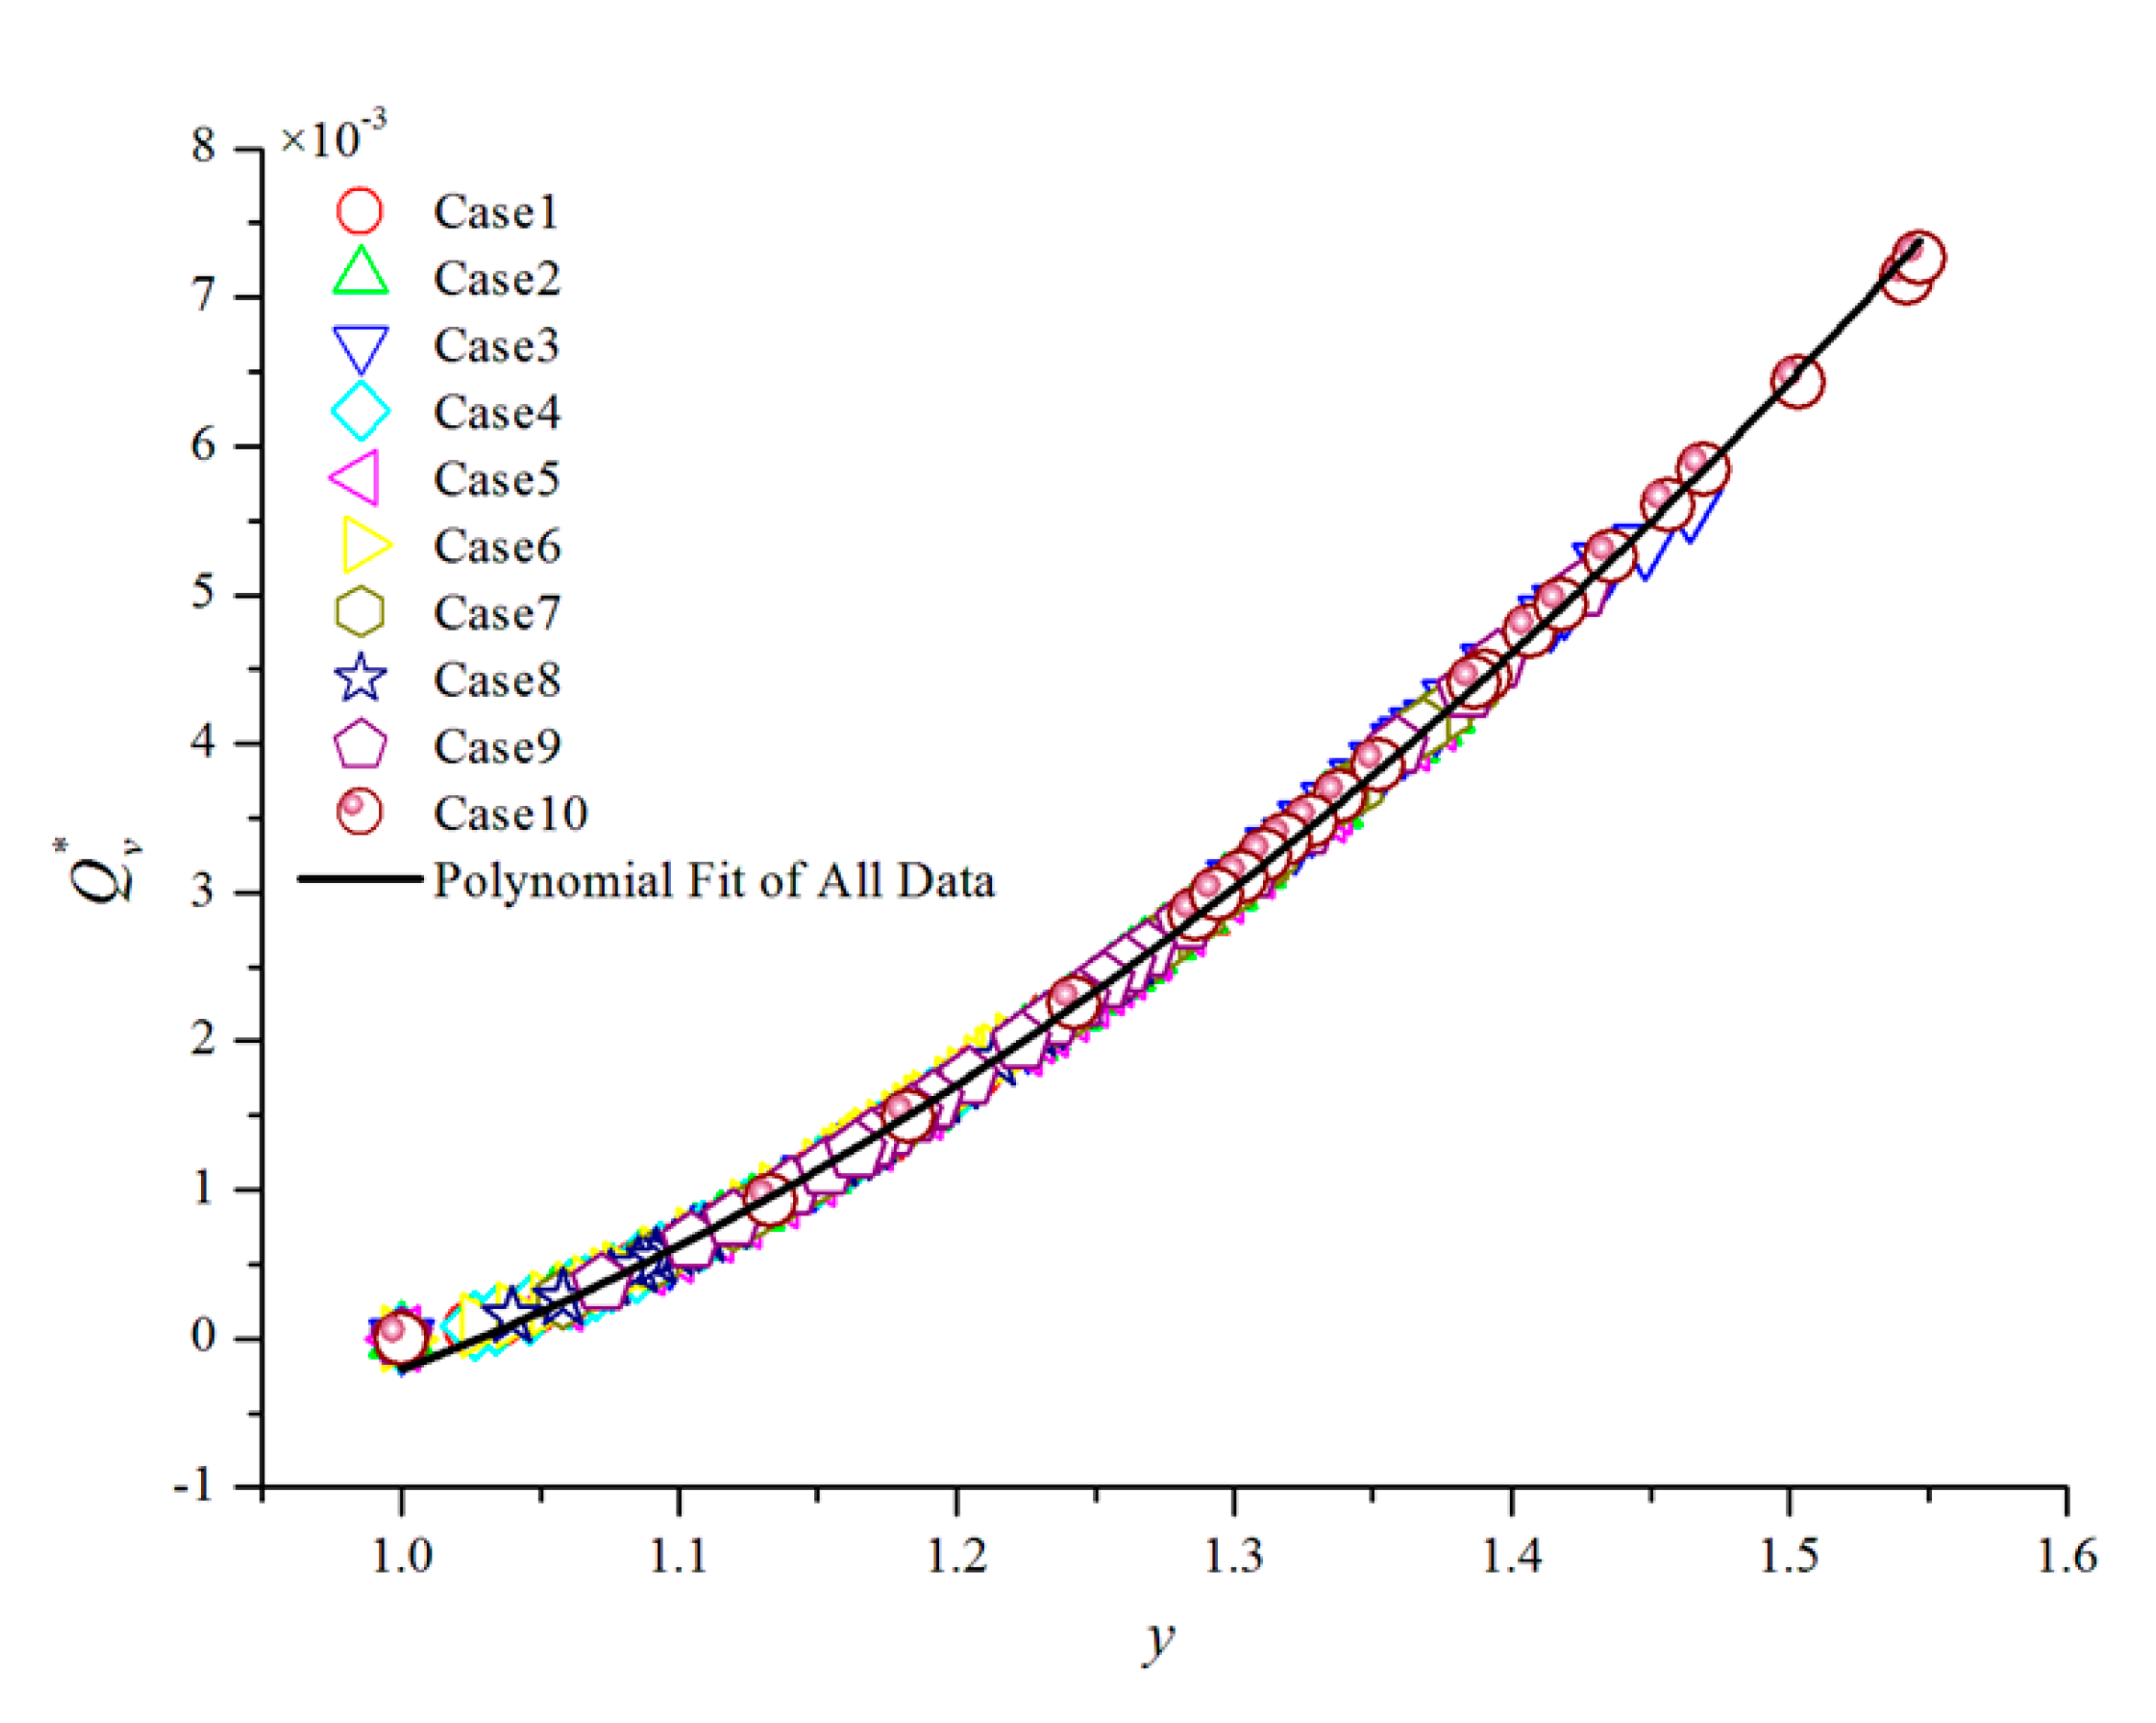
- Quadratic polynomial could be used to describe the relationship between the dimensionless virtual fire HRR and the dimensionless smoke temperature in the room. The dimensionless distance from the virtual fire source to corridor ceiling changed linearly with the dimensionless smoke temperature in the room.
- (d)
- The experimental results indicated that the dimensionless maximum temperature increase declined exponentially with distance. In the impingement area of the virtual fire, the virtual fire HRR could be substituted into the correlation provided by Alpert to predict the maximum temperate increase beneath the corridor ceiling, and the estimated results were in good agreement with the experimental results. In the non-impingement area of the virtual fire, when the virtual fire HRR was substituted into Alpert’s correlation, the predicted results were less than the experimental results because smoke was confined by the walls, and it conformed to the restriction of Alpert’s correlations. However, the experimental results changed linearly with the predicted results.
- (e)
- The dimensional analysis and multiple regression analysis of the experimental results indicated that the dimensionless viscosity and conduction exhibited an insignificant impact on the dimensionless maximum temperature increase in the corridor. The correlations between the dimensionless maximum temperature increase in the corridor and the dimensionless virtual fire HRR were obtained in the impingement and non-impingement areas of the virtual fire, respectively. In the impingement area of the virtual fire, the dimensionless virtual fire HRR was the only key parameter affecting the dimensionless maximum temperature; in the non-impingement area of the virtual fire, both the dimensionless virtual fire HRR and dimensionless distance were the key parameters affecting the dimensionless maximum temperature.
- (f)
- Based on the correlations between the dimensionless maximum temperature under the corridor ceiling and the virtual fire, by replacing the parameters of the virtual fire with the dimensionless smoke temperature in the room, the model was developed to provide the correlations between the dimensionless maximum temperature increase beneath the corridor ceiling and the dimensionless smoke temperature in the fire room.
Acknowledgments
Author Contributions
Conflicts of Interest
Nomenclature
| a, b, c, d, n, t, a1,b1, c1, b2, c2, a3, b3, c3, b4, c4 constant | |
| A | wall area of fire room, m2 |
| Ao | area of door, w × Ho, m2 |
| Cd | opening flow coefficient |
| cp | specific heat of gas, kJ·kg−1·k−1 |
| d | distance from virtual fire source to corridor ceiling, d = z + (H − Ho), m |
| d* | dimensionless virtual fire source position, defined by Equation (25) |
| D | pool diameter, m |
| g | gravity acceleration, m·s−2 |
| h | effective conduction heat transfer coefficient of room, kW·m−2·K−1 |
| h* | dimensionless effective conduction heat transfer coefficient of room,
|
| hv | effective conduction heat transfer coefficient of corridor, kW·m−2·K−1 |
dimensionless effective conduction heat transfer coefficient of corridor, defined by Equation (15) | |
| H | corridor height, m |
| ΔH | heat of combustion of fuel, kJ·kg−1 |
| HD | smoke height in room, m |
| HN | height of neutral plane, m |
| Ho | height of door, m |
| L | length scale |
gas mass flow rate, kg·s−1 | |
virtual fire plume mass flow rate at the height of z, kg·s−1 | |
| mf | mass loss rate of fire, kg·s−1 |
heat release rate of pool fire in room, kW | |
| Q* | dimensionless heat release rate of pool fire in room, |
heat release rate of virtual fire, defined by Equation (10), kW | |
dimensionless heat release rate of virtual fire, defined by Equation (14) | |
| r | longitudinal distance from virtual fire, m |
| r* | dimensionless longitudinal distance from virtual fire, defined by Equation (13) |
Reynolds number, defined by Equation (17) | |
| Tb | smoke temperature in corridor, K |
| ΔTg | the difference between virtual fire plume temperature at height of z and environment temperature, K |
| Tr | smoke layer temperature in room, K |
| ΔTr | the difference between smoke layer temperature in room and environment temperature, K |
| T∞ | environment temperature, K |
| w | width of door, m |
| W | corridor width, m |
| W* | dimensionless ratio of width to height of corridor, W* = W/H |
| X1, X2, X3, X4 | standard for the dimensionless number r*, , , respectively |
| y | ratio of room smoke layer temperature to environment temperature, y = Tr/T∞ |
| z | the distance from virtual fire source to door soffit, m |
| α | combustion efficiency |
| μ | dynamic viscosity, N·m·s−2 |
| μ20 | value of dynamic viscosity at 20 °C, N·m·s−2 |
| θ | maximum temperature increase in the corridor, θ = Tb,max − T∞, K |
| θAlpert | maximum temperature increase predicted by Alpert correlations, K |
| θ* | dimensionless maximum temperature increase in the corridor, θ* = θ/T∞ |
| ρr | density of smoke in room, kg·m−3 |
| ρ∞ | density of environment gas in room, kg·m−3 |
Subscripts
| f | full-scale |
| in | flow-in of room |
| m | model-scale |
| max | maximum |
| out | flow-out of room |
References
- Alarie, Y. Toxicity of fire smoke. Crit. Rev. Toxicol. 2002, 32, 259–289. [Google Scholar] [CrossRef] [PubMed]
- Huo, R.; Hu, Y.; Li, Y.Z. Introduction to Building Fire Safety Engineering; China Science and Technology University Press: Hefei, China, 2009; pp. 90–91. [Google Scholar]
- Leitner, A. The fire catastrophe in the Tauern Tunnel: Experience and conclusions for the Austrian Guidelines. Tunn. Undergr. Space Technol. 2001, 16, 217–223. [Google Scholar] [CrossRef]
- McCaffrey, B.J.; Quintiere, J.G.; Harkleroad, M.F. Estimating room temperatures and the like hood of flashover using fire testdata correlations. Fire Technol. 1981, 17, 98–119. [Google Scholar] [CrossRef]
- Sharma, P.; Quintiere, J.G. Compartment fire temperatures. J. Fire Prot. Eng. 2010, 20, 253–271. [Google Scholar] [CrossRef]
- Chen, A.P.; Francis, J.; Dong, X.L.; Chen, W.H. An experimental study of the rate of gas temperature rise in enclosure fires. Fire Saf. J. 2011, 46, 397–405. [Google Scholar] [CrossRef]
- Quintiere, J.; McCaffrey, B.J.; Kashiwagi, T. A scaling study of a corridor subject to a room fire. Combust. Sci. Technol. 1978, 18, 1–19. [Google Scholar] [CrossRef]
- Alpert, R.L. Calculation of response time of ceiling-mounted fire detectors. Fire Technol. 1972, 8, 181–195. [Google Scholar] [CrossRef]
- Kurioka, H.; Oka, Y.; Satoh, H.; Sugawa, O. Fire properties in near field of square fire source with longitudinal ventilation in tunnels. Fire Saf. J. 2003, 38, 319–340. [Google Scholar] [CrossRef]
- Hu, L.H.; Huo, R.; Wang, H.B.; Li, Y.Z.; Yang, R.X. Experimental studies on fire-induced buoyant smoke temperature distribution along tunnel ceiling. Build. Environ. 2007, 42, 3905–3915. [Google Scholar] [CrossRef]
- Hu, L.H.; Huo, R.; Li, Y.Z.; Wang, H.B.; Chow, W.K. Full-scale burning tests on studying smoke temperature and velocity along a corridor. Tunn. Undergr. Space Technol. 2005, 20, 223–229. [Google Scholar] [CrossRef]
- Hu, L.H.; Huo, R.; Peng, W.; Chow, W.K.; Yang, R.X. On the maximum smoke temperature under the ceiling in tunnel fires. Tunn. Undergr. Space Technol. 2006, 21, 650–655. [Google Scholar] [CrossRef]
- Ji, J.; Zhong, W.; Li, K.Y.; Shen, X.B.; Zhang, Y.; Huo, R. A simplified calculation method on maximum smoke temperature under the ceiling in subway station fires. Tunn. Undergr. Space Technol. 2011, 26, 490–496. [Google Scholar] [CrossRef]
- Ji, J.; Fan, C.G.; Zhong, W.; Shen, X.B.; Sun, J.H. Experimental investigation on influence of different transverse fire locations on maximum smoke temperature under the tunnel ceiling. Int. J. Heat Mass Transf. 2012, 55, 4817–4826. [Google Scholar] [CrossRef]
- Fan, C.G.; Ji, J.; Gao, Z.H.; Sun, J.H. Experimental study on transverse smoke temperature distribution in road tunnel fires. Tunn. Undergr. Space Technol. 2013, 37, 89–95. [Google Scholar] [CrossRef]
- Gao, Z.H.; Ji, J.; Fan, C.G.; Sun, J.H.; Zhu, J.P. Influence of sidewall restriction on the maximum ceiling gas temperature of buoyancy-driven thermal flow. Energy Build. 2014, 84, 13–20. [Google Scholar] [CrossRef]
- Johansson, N.; van Hees, P. A correlation for predicting smoke layer temperature in a room adjacent to a room involved in a pre-flashover fire. Fire Mater. 2014, 38, 182–193. [Google Scholar] [CrossRef]
- Gao, Z.H.; Ji, J.; Fan, C.G.; Sun, J.H. Experimental analysis of the influence of accumulated upper hot layer on the maximum ceiling gas temperature by a modified virtual source origin concept. Int. J. Heat Mass Transf. 2015, 84, 262–270. [Google Scholar] [CrossRef]
- Shigunov, V. A zone model for fire development in multiple connected compartments. Fire Saf. J. 2005, 40, 555–578. [Google Scholar] [CrossRef]
- Thomas, P.H. Modeling of compartment fires. Fire Saf. J. 1983, 5, 181–190. [Google Scholar] [CrossRef]
- Rockett, J.A. Fire induced gas flow in an enclosure. Combust. Sci. Technol. 1976, 12, 165–175. [Google Scholar] [CrossRef]
- Heskestad, G. Fire plumes, flame height, and air entrainment. In The SFPE Handbook of Fire Protection Engineering, 3rd ed.; National Fire Protection Association: Quincy, MA, USA, 2002; Section 2, Chapter 1. [Google Scholar]
- Zukoski, E.E. Properties of Fire Plumes. In Combustion Fundamentals of Fire; Cox, G., Ed.; Academic Press: London, UK, 1995. [Google Scholar]
- Steckler, K.D.; Quintiere, J.G.; Rinkinen, W.J. Flow induced by fire in a compartment. In Proceedings of the National Bureau of Standards, Symposium (International) on Combustion, Gaithersburg, MD, USA, 14–16 September 1982. NBSIR 82-2520.
- Thomas, P.H. Dimensional analysis: A magic art in fire research? Fire Saf. J. 2000, 34, 111–141. [Google Scholar] [CrossRef]
- Wang, L.; Quintiere, J.G. An analysis of compartment fire doorway flows. Fire Saf. J. 2009, 44, 718–731. [Google Scholar] [CrossRef]
- Buckingham, E. On physically similar systems: Illustrations of the use of dimensional equations. Phys. Rev. 1914, 4, 345–376. [Google Scholar] [CrossRef]
- Tanaka, T.; Yamada, S. Reduced scale experiments for convective heat transfer in the early stage of fires. Int. J. Eng. Perform. Based Fire Codes 1999, 3, 196–203. [Google Scholar]
- Zhao, X.B.; Zhou, X. Fluid Mechanics with Engineering Applications; Southeast University Press: Nanjing, China, 2008; p. 11. [Google Scholar]
- Karlsson, B.; Quintiere, J.G. Enclosure Fire Dynamics; CRC Press: Washington, DC, USA, 2000; pp. 54–60. [Google Scholar]
- Babrauskas, V. Heat release rate. In The SFPE Handbook of Fire Protection Engineering, 3rd ed.; National Fire Protection Association: Quincy, MA, USA, 2002; Section 3, Chapter 1. [Google Scholar]
- Pitts, W.M.; Braun, E.; Peacock, R.D.; Mitler, H.E.; Johnsson, E.L.; Reneke, P.A.; Blevins, L.G. Thermocouple measurement in a fire environment. In National Institute of Standards and Technology Internal Report; National Institute of Standards and Technology: Gaithersburg, MD, USA, 1999. [Google Scholar]
- Blevins, L.G. Behavior of bare and aspirated thermocouples in compartment fires. In Proceedings of the 33rd National Heat Transfer Conference, Albuquerque, NM, USA, 15–17 August 1999.
- Alpert, R.L. Ceiling jet flows. In The SFPE Handbook of Fire Protection Engineering, 3rd ed.; National Fire Protection Association: Quincy, MA, USA, 2002; Section 2, Chapter 2. [Google Scholar]
- Wooldridge, J.M. A note on computing R-squared and adjusted R-squared for trending and seasonal data. Econ. Lett. 1991, 36, 49–54. [Google Scholar] [CrossRef]
- Ying, Z.L.; Ingason, H. The maximum ceiling gas temperature in a large tunnel fire. Fire Saf. J. 2012, 48, 38–48. [Google Scholar]
© 2015 by the authors; licensee MDPI, Basel, Switzerland. This article is an open access article distributed under the terms and conditions of the Creative Commons Attribution license (http://creativecommons.org/licenses/by/4.0/).
Share and Cite
Xing, Z.; Mao, J.; Huang, Y.; Zhou, J.; Mao, W.; Deng, F. Scaled Experimental Study on Maximum Smoke Temperature along Corridors Subject to Room Fires. Sustainability 2015, 7, 11190-11212. https://doi.org/10.3390/su70811190
Xing Z, Mao J, Huang Y, Zhou J, Mao W, Deng F. Scaled Experimental Study on Maximum Smoke Temperature along Corridors Subject to Room Fires. Sustainability. 2015; 7(8):11190-11212. https://doi.org/10.3390/su70811190
Chicago/Turabian StyleXing, Zheli, Jinfeng Mao, Yuliang Huang, Jin Zhou, Wei Mao, and Feifan Deng. 2015. "Scaled Experimental Study on Maximum Smoke Temperature along Corridors Subject to Room Fires" Sustainability 7, no. 8: 11190-11212. https://doi.org/10.3390/su70811190
APA StyleXing, Z., Mao, J., Huang, Y., Zhou, J., Mao, W., & Deng, F. (2015). Scaled Experimental Study on Maximum Smoke Temperature along Corridors Subject to Room Fires. Sustainability, 7(8), 11190-11212. https://doi.org/10.3390/su70811190