1. Introduction
During the past few years, the urbanization process caused atmospheric changes, which led to higher temperatures in cities than those characterizing the surrounding non-urban areas.
The examination of such phenomenon started in the XIX century [
1] and lately it has caught the attention of the international scientific community, as showed by some studies carried out in different countries: Lodz (Poland) [
2], Athens (Greece) [
3], Beijing (China) [
4], Aveiro (Portugal) [
5].
This phenomenon, together with an increase in temperature in the cities, is the result of urban/rural energy budget differences [
6]. For what concerns the radiation balance, the differences between urban and rural areas are not that significant [
6,
7] and the larger nighttime radiative loss determined by the high emissivity [
8] compensates for the higher amount of energy input in the daytime in urban areas determined by a low albedo [
8]. The increase in temperature in urban areas is so connected to the type of materials used. For example, the vegetation tends to cover just a small part of the surface in cities, thus the evapotranspiration is highly reduced and urban areas convert their radiant energy into sensible heat rather than latent heat [
6]. The change of urban energy budget determined by a low albedo and the reduced evapotranspiration cause a higher urban energy input in the daytime [
8]. Such excess of energy is usually stored: the thermal properties (e.g., heat capacity, thermal conductivity) of the materials used in the cities and the complex and traditional urban morphology increase the heat flux stored in these areas [
9,
10,
11,
12,
13]. The surfaces start releasing the stored energy during the night [
8], slowing down the cooling process in the cities and determining a temperature difference between urban and rural areas.
Sky view factor values are also able to facilitate the sensible heat stored at lower layers: in fact, during the night a low sky view factor reduces the disposal of the longwave radiation in urban areas determining temperature differences between urban and rural areas that can be 3.3 times higher than those measured during the daytime [
14] where the energy budget is regulated by the incident solar radiation [
15].
The excess warmth of the urban atmosphere is then observed especially in the Urban Canopy Layer (UCL), extending from the surface to the mean buildings height [
6]. This phenomenon affects the human thermal comfort [
16,
17], which has been widely examined in indoor spaces as offices, schools and houses [
18,
19,
20,
21,
22,
23]. However, many recreational activities of considerable commercial value are conducted outdoors (e.g., sporting events, theme parks, cultural events,
etc…) and an increasing number of weather sensitive businesses in the service sector, such as restaurants and cafes, are taking advantage of outdoor environments [
24]. It should be also considered that outdoor thermal comfort is one of the main factors affecting the habitability of a space and the quantity and frequency of activities depend on the quality of the microclimatic conditions [
25]. This is why urban areas must be planned by implementing, where necessary, proper mitigation strategies. Some of these strategies, partially affecting each other, are: the use of high albedo surfaces [
26,
27,
28,
29,
30], evaporation from porous surfaces [
31,
32], evaporation from ground-level water surfaces [
33] and roof ponds [
34], vegetated surfaces [
35], rooftop gardens [
36,
37,
38,
39,
40], and trees [
27,
41].
This paper, through the examination of a case study concerning the Cloister of San Pietro in Vincoli (placed right inside the Faculty of Engineering of the Sapienza University of Rome), evaluates how some of the mitigation strategies previously mentioned affect the microclimate and the outdoor thermal comfort. Particular attention is given to the influence determined by the presence of high albedo materials (characterized by higher values of the reflectance in the region of infrared and lower values in the region of visible) and some vegetation: this is the reason why different configurations of the site were compared. The selected performance metric is then the comfort sensation of a pedestrian standing in the Cloister, whereas the outdoor thermal comfort is estimated through the PMV (Predicted Mean Vote). This index, developed by Fanger [
42], it is based on 1565 thermal comfort questionnaires distributed for the evaluation of the thermoigrometric qualities of indoor spaces and it was then adapted to outdoor spaces taking into account the presence of solar radiation [
43]. It takes into consideration the following environment variables: air temperature, mean radiant temperature, relative humidity, wind speed and some operative variables as clothing insulation and the metabolic rate.
2. Case Study
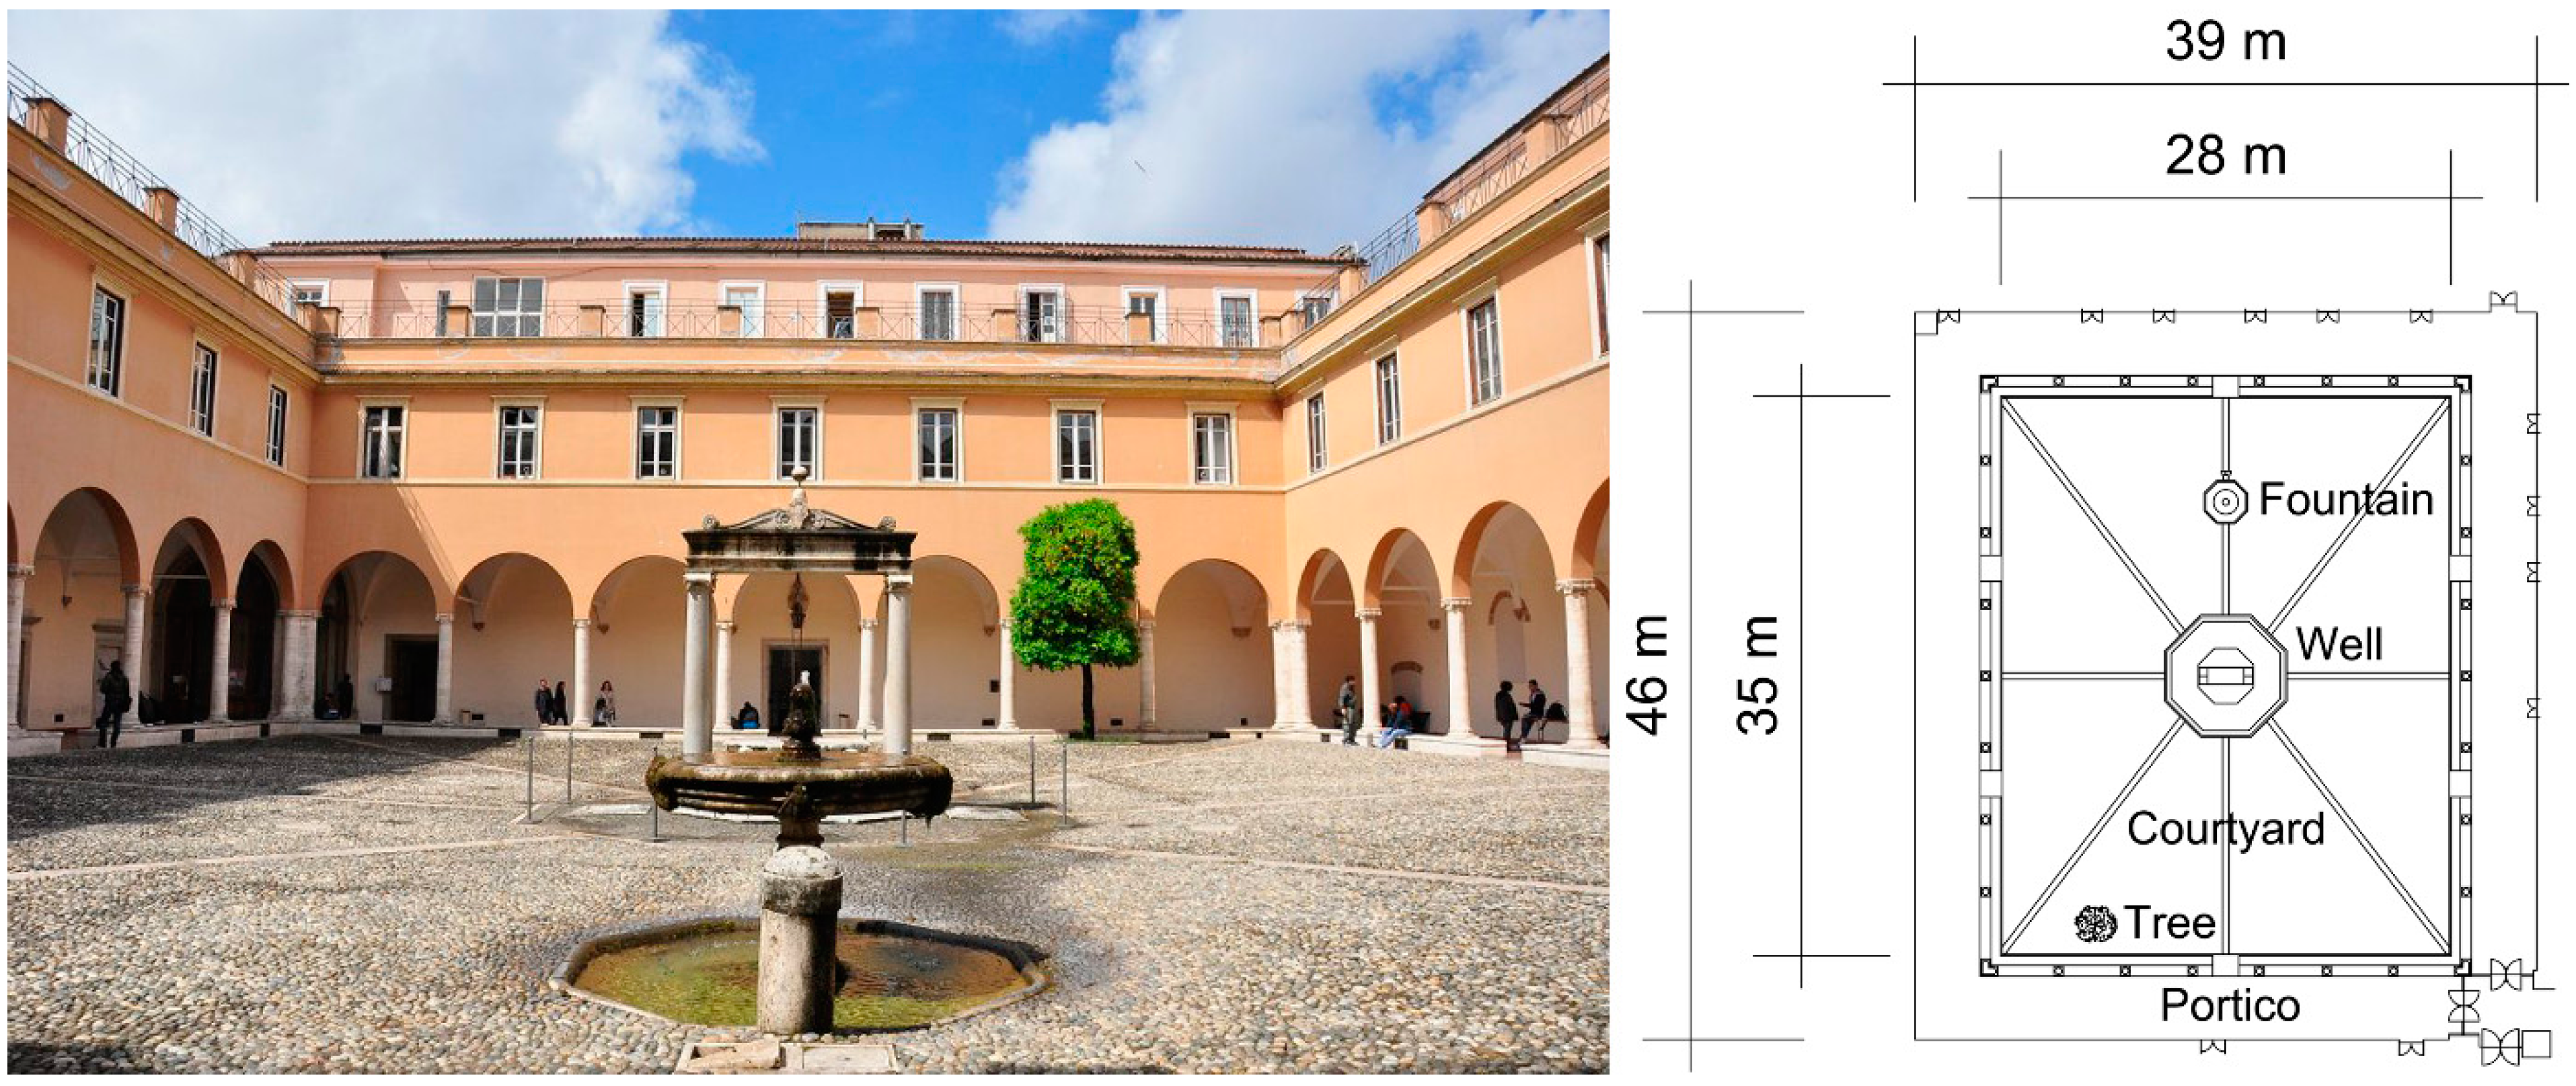
The case study of this paper focuses on the Cloister of San Pietro in Vincoli (
Figure 1), placed next to the basilica with the same name and right inside the Faculty of Engineering of the “Sapienza” University of Rome.
Figure 1.
Dimensions and present configuration of the Cloister of the Faculty of Engineering of the “Sapienza” University.
Figure 1.
Dimensions and present configuration of the Cloister of the Faculty of Engineering of the “Sapienza” University.
It is a Renaissance structure by Giuliano da Sangallo. The ground-floor has a rectangular portico whose sides present seven or eight arches supported by columns, while the centre of the yard is characterized by an octagonal well by Simone Mosca. On top of it there is a trestle formed by two pairs of columns supporting an architrave, which it is thought to be a work by Michelangelo Buonarroti. The yard, made of Lombard cobblestones, also presents a well and an orange tree while the portico paving is made of ceramic tiles.
For what concerns the city of Rome, it is characterized by a latitude of 41°55′N, a longitude of 12°29′E and a height of 20 m above the sea level [
44]. It is the most populated and the widest city of Italy respectively with 2,844,821 inhabitants and 1285.30 km
2.
It is characterized by the typical Mediterranean climate, mild and comforting in the spring and fall. Spring and autumn are then the rainiest seasons, especially in November and April. The summer is hot, humid and usually with infrequent precipitation, whereas the winter is rainy and rarely cold.
Table 1 shows the average values for each season of the most important meteorological variables [
45,
46,
47].
Table 1.
Average values for all seasons of the air temperature, relative humidity, wind speed and direction in Rome.
Table 1.
Average values for all seasons of the air temperature, relative humidity, wind speed and direction in Rome.
| | Summer (Jun–Aug) | Fall (Sep–Nov) | Winter (Dec–Feb) | Spring (Mar–May) |
|---|
| Air temperature [°C] | 23.3 | 17.1 | 8.9 | 13.8 |
| Relative humidity [%] | 76.0 | 77.3 | 79.3 | 78.0 |
| Wind speed [m/s] | 3.3 | 4.1 | 3.7 | 3.8 |
| Wind direction [N = 0 or 360, E = 90, S = 180, W = 270] | 146.1 | 134.5 | 125.2 | 157.4 |
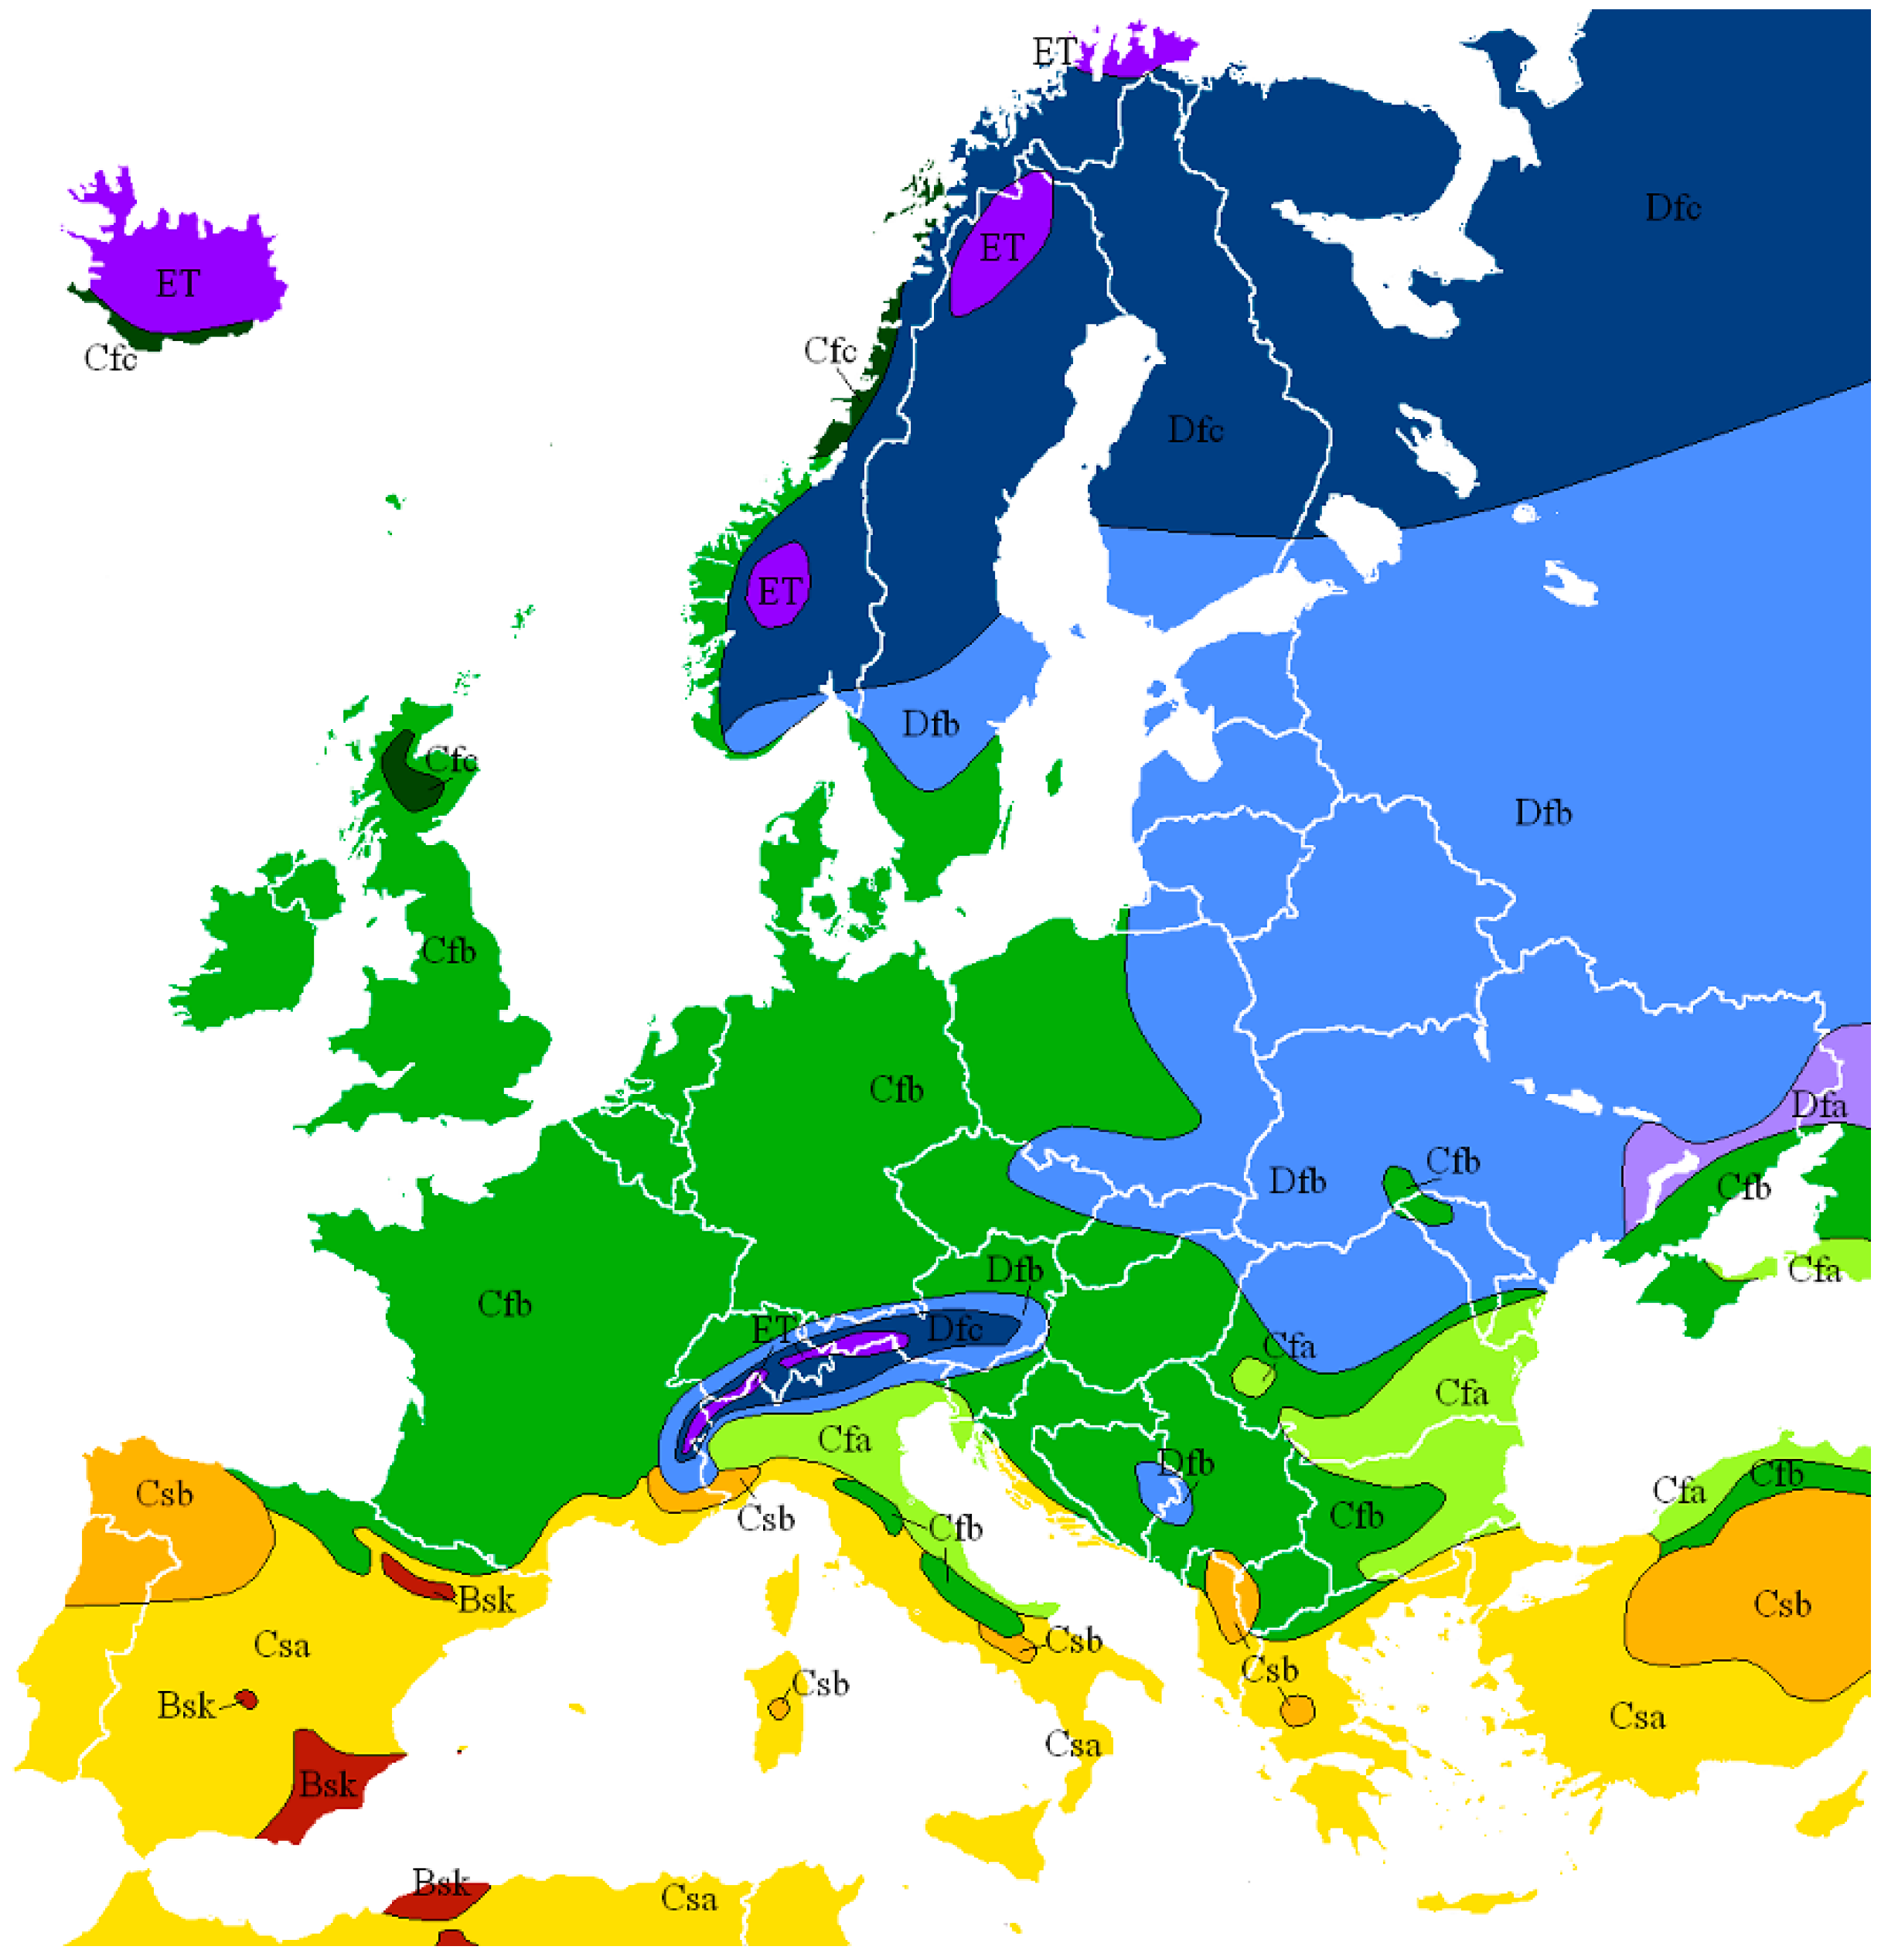
According to Köppen classification, this climate belongs to the Csa category [
48] (
Figure 2).
Figure 2.
Köppen climate classification.
Figure 2.
Köppen climate classification.
Table 2 shows the criteria defining, according to this classification, mild climates and therefore the Mediterranean climate as well.
Table 2.
Description of the symbols of Köppen climate classification and defining criteria (for C category, representing mild climates).
Table 2.
Description of the symbols of Köppen climate classification and defining criteria (for C category, representing mild climates).
| 1st | 2nd | 3rd | Description | Criteria |
|---|
| C | | | Mild | THOT > 10 and 0 < TCOLD < 18 |
| | s | | Dry summer | PSDRY < 40 and PSDRY < PWWET/3 |
| | w | | Dry winter | PWDRY < PSWET/10 |
| | f | | Without dry season | Not (Cs) or (Cw) |
| | | a | Hot summer | THOT ≥ 22 |
| | | b | Warm summer | Not (a) and TMON10 ≥ 4 |
| | | c | Cold summer | Not (a or b) and 1 ≤ TMON10 < 4 |
3. Other Configurations of the Site
In order to make an evaluation of how the urban context affects the thermal comfort in the Mediterranean area, the present configuration of the Cloister is compared to other four configurations.
The present configuration (conf. 1) is the one that has been characterizing the Cloister since the latest building restructuring: the basic surface of the yard is made of cobblestones, while the portico of ceramic tiles. For what concerns the vertical limits of the structure, they present painted lime plaster.
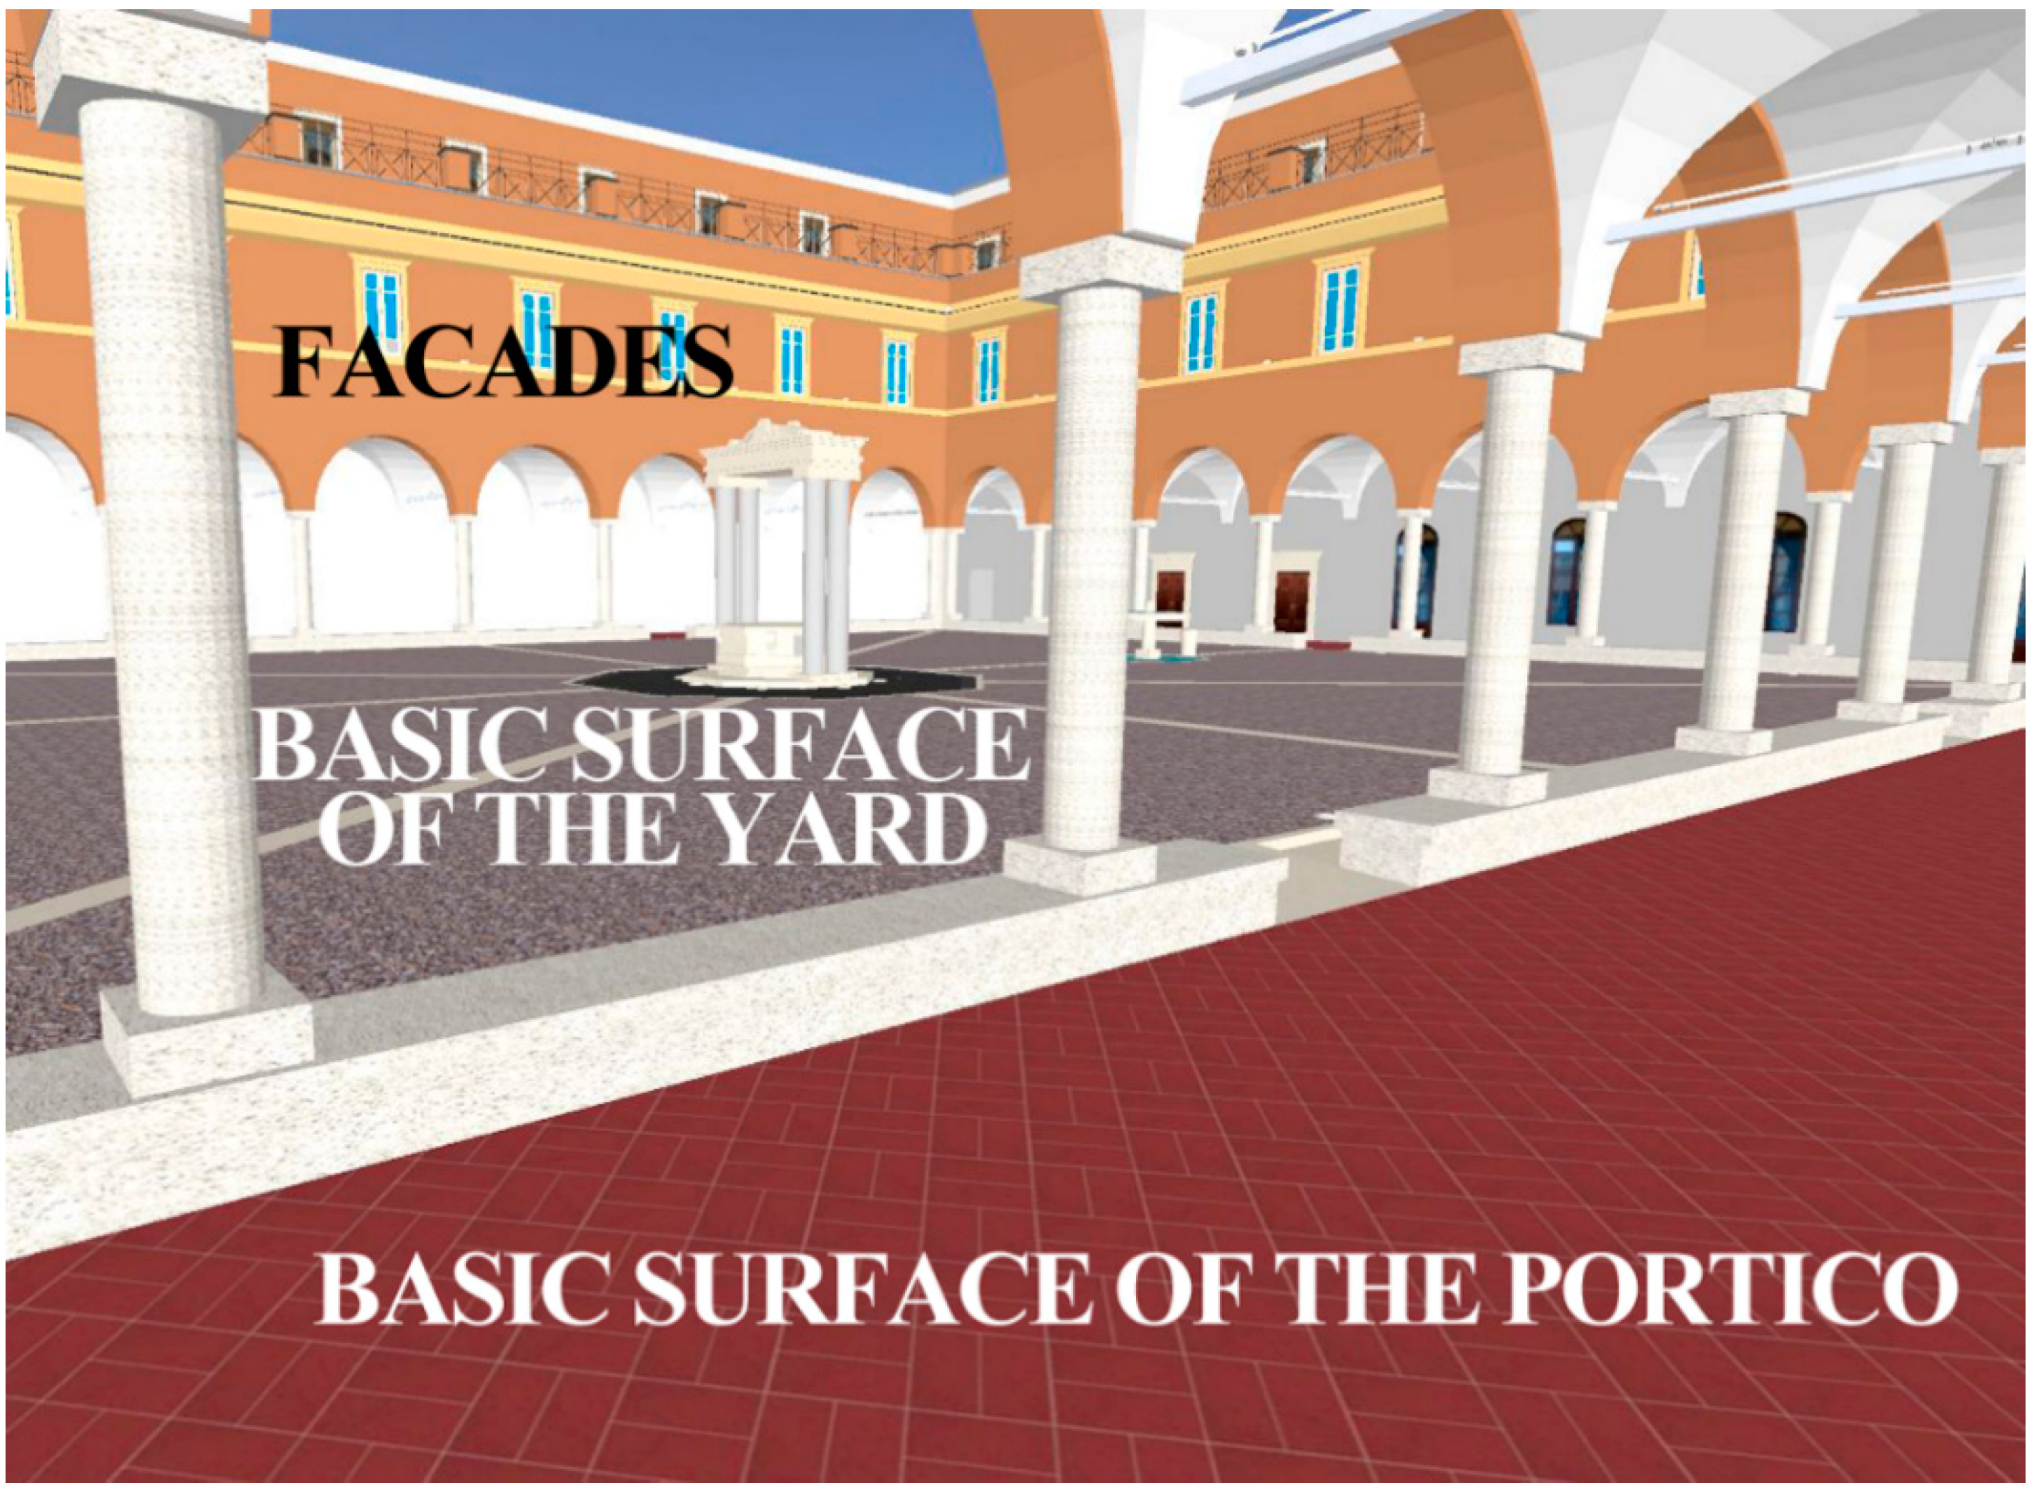
In order to evaluate how vegetation and a higher albedo coefficient affect human thermal sensations, four different configurations by changing the materials of the facades and of the basic surface of the yard have been designed. The surfaces are reported in
Figure 3.
Figure 3.
3D-model of the Cloisterand identification of the various surfaces.
Figure 3.
3D-model of the Cloisterand identification of the various surfaces.
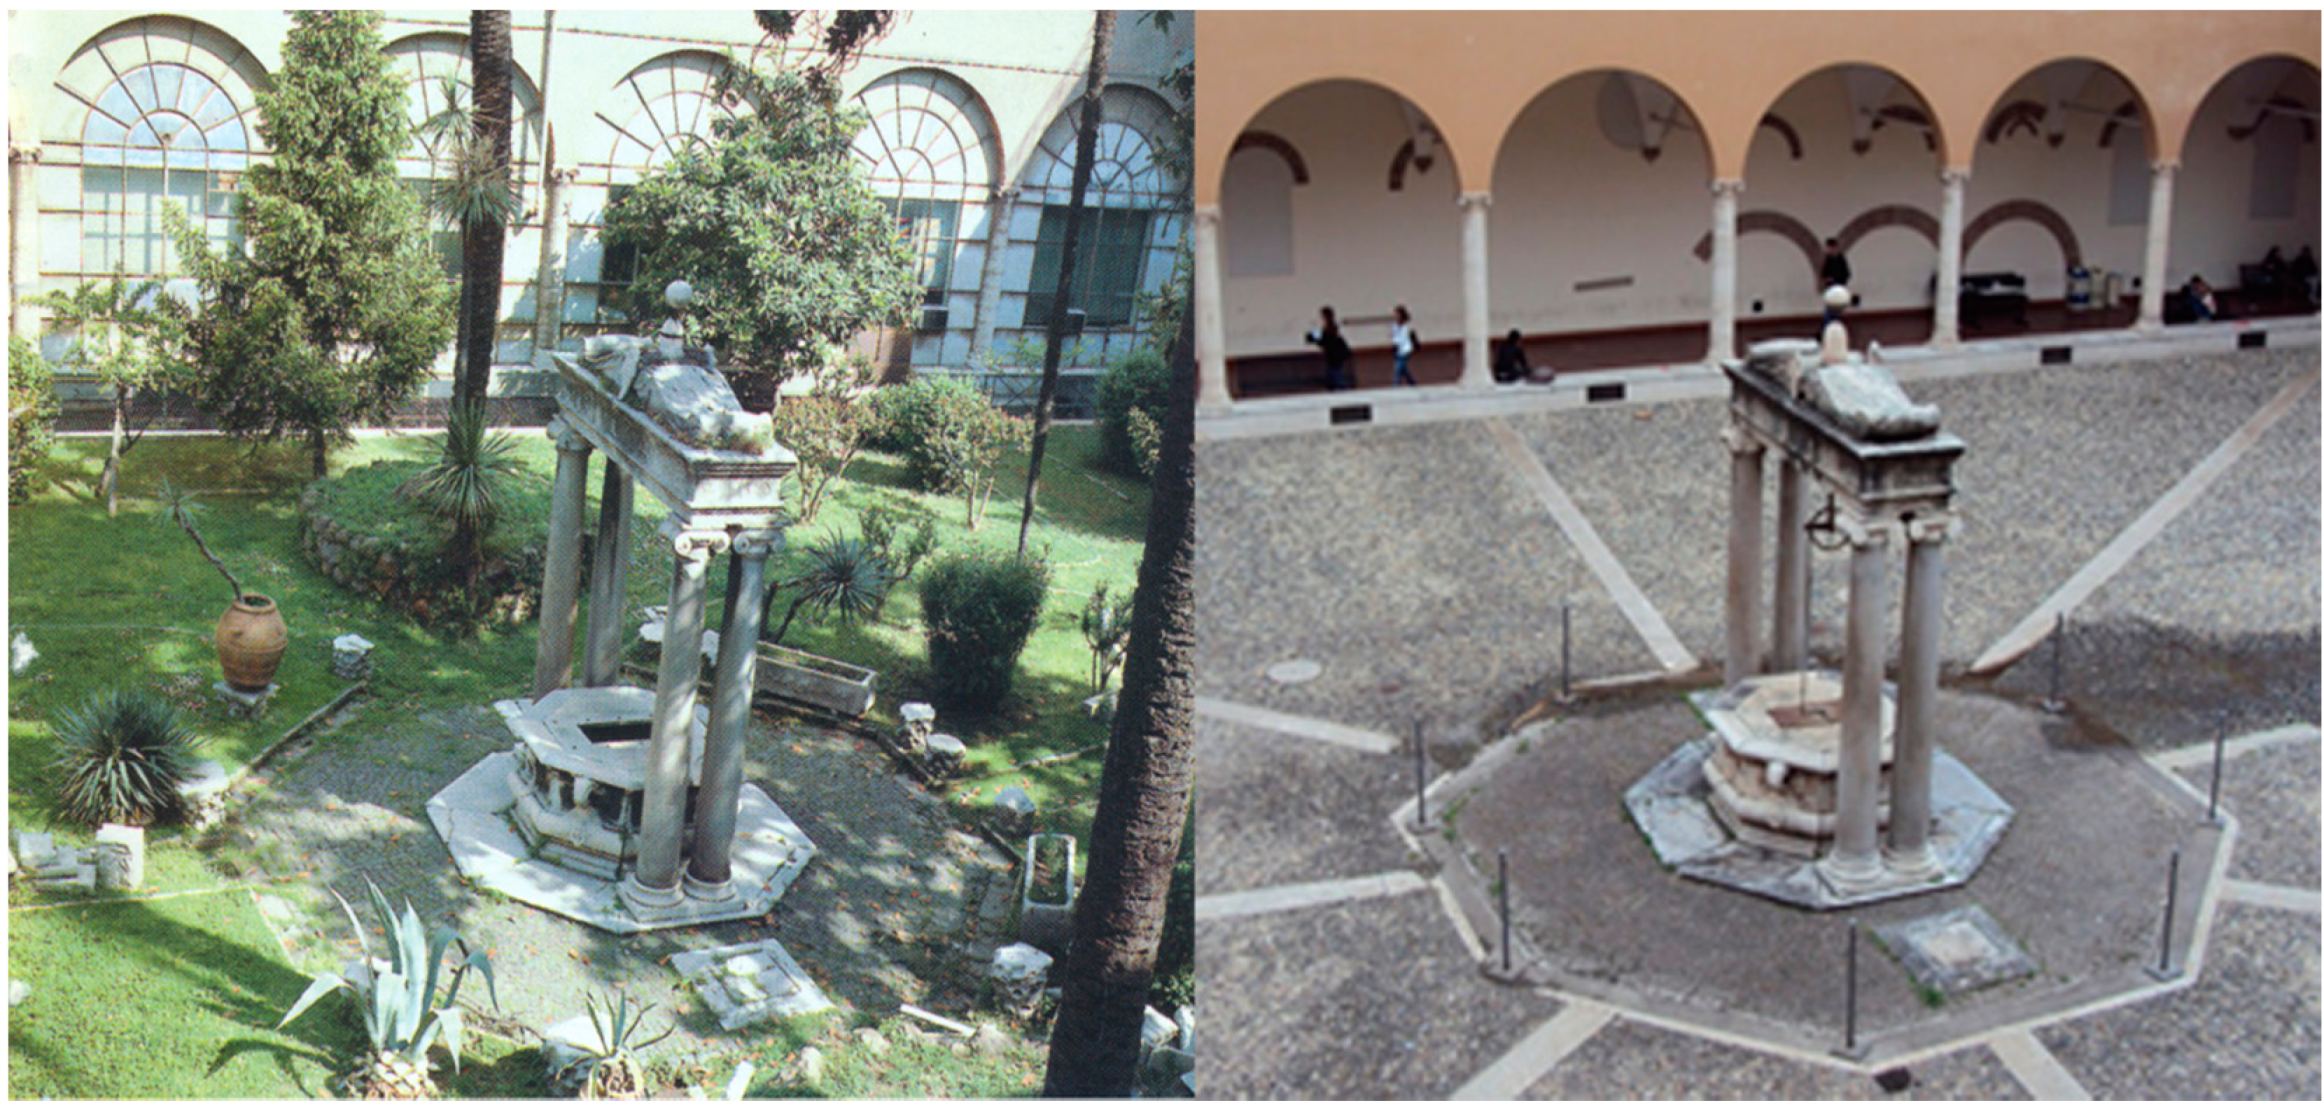
This is why a first alternative configuration (conf. 2) is characterized by the facades surrounding the Cloister without any changes, whereas it is assumed the presence of a lawn and some vegetation, such as plants and shrubs, in the yard. This was the configuration of the cloister before the last restoration (
Figure 4).
Figure 4.
Cloister: on the left conf. 2 with the garden (picture taken in the 90s), on the right conf. 1 with cobblestones (present days).
Figure 4.
Cloister: on the left conf. 2 with the garden (picture taken in the 90s), on the right conf. 1 with cobblestones (present days).
In the second alternative configuration (conf. 3), the albedo coefficient of the yard increases while the facades remain unchanged (as in conf. 1 and in conf. 2).
In the third alternative configuration (conf. 4), the structural solution presents a higher albedo coefficient characterizing the facades and the yard surface.
Finally, the fourth alternative configuration (conf. 5) combines both mitigation strategies: it is characterized by a lawn and some vegetation in the yard and, at the same time, the albedo coefficient of the facades increases.
Table 3 reports the planning choices of each configuration.
Table 3.
Planning choices of the five configurations examined.
Table 3.
Planning choices of the five configurations examined.
| | | Present Conf. | Alternative Confs. |
|---|
| | | Conf. 1 | Conf. 2 | Conf. 3 | Conf. 4 | Conf. 5 |
|---|
| Facades | Painted lime plaster | X | X | X | | |
| High albedo material | | | | X | X |
| Basic surface of the yard | Cobblestone | X | | | | |
| High albedo material | | | X | X | |
| Lawn and vegetation | | X | | | X |
| Basic surface of the portico | Ceramic tiles | X | X | X | X | X |
Configurations 2 and 5 also present, besides the lawn, 12 orange trees, two palms and six shrubs. In order to recognize the characteristics of each plant,
Table 4 reports: the height z
P, albedo coefficient α
F and the “Leaf Area Density” (LAD) [
49]. This is why each plant was assumed to be divided into 10 blocks, each with a height of 1/10 of the total height and for every block the “Leaf Area Density” was calculated through the following relationship [
49]:
Table 4.
Leaf Area Density values, height and albedo coefficient of the plants characterizing configurations 2 and 5.
Table 4.
Leaf Area Density values, height and albedo coefficient of the plants characterizing configurations 2 and 5.
| | Orange Tree | Palm Tree | Shrub | Grass |
|---|
| LAD 1 [z/zp = 0.1] | 0.000 | 0.000 | 0.100 | 0.300 |
| LAD 2 [z/zp = 0.2] | 0.000 | 0.000 | 0.150 | 0.300 |
| LAD 3 [z/zp = 0.3] | 0.000 | 0.000 | 0.300 | 0.300 |
| LAD 4 [z/zp = 0.4] | 0.070 | 0.000 | 0.400 | 0.300 |
| LAD 5 [z/zp = 0.5] | 0.275 | 0.000 | 0.650 | 0.300 |
| LAD 6 [z/zp = 0.6] | 0.500 | 0.000 | 0.700 | 0.300 |
| LAD 7 [z/zp = 0.7] | 1.060 | 0.120 | 0.850 | 0.300 |
| LAD 8 [z/zp = 0.8] | 1.000 | 1.100 | 0.750 | 0.300 |
| LAD 9 [z/zp = 0.9] | 0.850 | 1.300 | 0.550 | 0.300 |
| LAD 10 [z/zp = 1.0] | 0.000 | 0.000 | 0.000 | 0.000 |
| zp | 8.000 | 15.000 | 1.000 | 0.050 |
| αF | 0.200 | 0.200 | 0.200 | 0.200 |
Then,
Table 5 reports some thermophysical properties of the materials characterizing the limits surfaces of the structure in every configuration:
Table 5.
Thermophysical properties of the materials used for the limits surfaces of the Cloister.
Table 5.
Thermophysical properties of the materials used for the limits surfaces of the Cloister.
| | Painted Lime Plaster | High Albedo Material | Cobblestone | Ceramic Tiles |
|---|
| εS | 0.900 | 0.890 | 0.900 | 0.880 |
| αS | 0.270 | 0.660 | 0.400 | 0.370 |
In detail, the high albedo material coefficients were chosen according to previous research [
50] related to the development of innovative materials with the same spectral response of those used in historical centers in the visible region, but high reflectance in another solar spectrum range. In this way, it is possible to respect the architectural restrictions of the historical buildings.
4. The Software: ENVI-met
In order to evaluate how the different mitigation strategies affect the microclimate and outdoor thermal comfort, ENVI-met was the prediction software used [
51,
52]. It is a 3D prognostic microclimate model designed to simulate the interactions among buildings, surfaces, vegetation and air in an urban context. It relies on the fundamental laws of fluid dynamics and thermodynamics and it can be used with a typical resolution of 0.5–10 m in space and 1–10 s in time. The model can simulate:
- -
flow around and between buildings;
- -
exchange processes of heat and vapor at urban surfaces;
- -
turbulence;
- -
exchanges of energy and mass between vegetation and its surroundings.
The main input parameters of an ENVI-met simulation include: weather conditions, initial soil wetness and temperature profiles, structures and physical properties of urban surfaces, and plants. Several scientific studies certify its reliability [
53,
54]. The software is able to calculate the values of several meteorological and microclimatic variables (e.g., wind speed and direction, potential temperature, specific humidity, relative humidity, mean radiant temperature, direct, diffuse and reflected shortwave radiation, longwave radiation) and the PMV (Predicted Mean Vote); it also takes into consideration how evapotranspiration phenomena, determined by the presence of vegetation and permeable soils, affect this index thus ensuring a comparison, as in this paper, of different mitigation strategies.
5. The PMV
As previously mentioned, different mitigation strategies are compared thanks to the PMV (Predicted Mean Vote) [
42]. This is a thermal comfort index which at first was developed for indoor environments based on some tests (1,565 people were surveyed). Afterwards, it was modified and adapted to examine outdoor environments as well [
43].
The PMV predicts the mean value of the votes of a large group of persons and it is defined as follows [
55]:
where M is the metabolic rate and S is the storage deriving from the energy budget equation describing the heat exchange between the human body and the thermal environment. The equation is defined as follows:
where W is the physical work output; Q is the radiation budget, a function of mean radiant temperature T
MR and air velocity v; Q
H is the turbulent heat flux of sensible heat, a function of air temperature T
A and air velocity v; Q
L is the latent heat flow due to evaporation of moisture diffused through the skin, a function of air humidity e and velocity v; Q
SW is the latent heat flow from sweat evaporation; Q
RE is the respiratory heat flux (sensible and latent). Each term of Equation (3) is expressed in [W/m
2] and it is positive if it is representative of energy benefit to the body: this is why M is always positive while W, Q
L and Q
SW are always negative.
For what concerns the PMV scale it ranges between −4 (very cold) and +4 (very hot) where 0 is the thermal neutral (comfort) value. It should not be forgotten that the PMV is a function of the local climate and its values can exceed the interval (−4) ÷ (+4). The PMV is then a stationary value and this means that a person is supposed to be exposed for a long time to a certain climatic situation until the energy exchange processes with the human body will be stationary.
The use of this rational index is suggested by the German engineering guidelines VDI 3787 [
56], which were developed for outdoor environments, and by ISO 7730 [
57] and ASHRAE 55 [
58], which were designed for indoor environments. For these reasons, the PMV is one of the most widely used indexes to evaluate outdoor thermal comfort [
59]. Becker
et al. [
60] evaluated the correlation of observed and calculated thermal sensation values according to this index for four different locations in the area of Kibbutz Yotvata (Israel) and they found that the correlation coefficient ranged between 0.60 and 0.81 with an average of 0.70. Similar results were obtained by Bouden and Ghrab [
61]: they carried out a cross-sectional investigation in five different Tunisian cities finding a correlation coefficient of about 0.71. Differently, the results of a study conducted by Cheng
et al. [
62] in Hong Kong show that PMV generally overestimates the thermal sensation towards the warmer end of the scale in summer and vice versa in winter. Thorsson
et al. [
63] reached similar conclusions in the city of Göteborg (Sweden): they compared thermal sensations assessed by the PMV and thermal sensations obtained through interviews finding that the PMV curve was skewed towards the warm zone. Another study was carried by Mahmoud [
64] in Egypt and it examined nine zones representing various spaces inside an urban park located in Cairo: even if this study used the PET (Physiological Equivalent Temperature) [
65], the authors highlighted how, for one of these zones, the calculated PMV was not significantly different from the mean thermal sensation vote obtained from subjective questionnaires. Finally, Oertel
et al. [
66] carried out a study in Glasgow (UK) and they found a satisfactory similarity between the PMV and the actual thermal sensation votes derived from outdoor surveys.
6. Simulations
The ENVI-met software performed some simulations to compare different mitigation strategies. This is the reason why it was developed a 3D model of the Cloister of San Pietro in Vincoli together with a mesh of (27 × 30) horizontal cells and 29 vertical cells; the horizontal spacing is of 2 m, while the vertical one is of 0.5 m where 0 m ≤ z ≤ 3 m; differently for higher heights, the vertical spacing is calculated through the following relationship:
where s represents the extension factor equal to 20%.
For what concerns the simulations, as demonstrated in other works, the choice of the input parameters is very important. For this reason, every simulation was performed with a 2 s time step. The simulations presented then a variation in the structural solution of the vertical and horizontal limits of the site examined (
Table 3,
Table 4 and
Table 5), whereas the environmental and meteorological input parameters and the settings for the PMV estimation were the same (
Table 6).
Table 6.
Input parameters for the ENVI-met simulations.
Table 6.
Input parameters for the ENVI-met simulations.
| Main Data |
| Wind speed in 10 m above ground [m/s] | 9.16 |
| Wind direction [N = 0 or 360, E = 90, S = 180, W = 270] | 146.1 |
| Roughness length Z0 at reference point [m] | 1 |
| Initial temperature atmosphere [K] | 302 |
| Specific humidity in 2500 m [g water/kg air] | 7 |
| Relative humidity in 2 m [%] | 35 |
| Building Properties |
| Inside temperature [K] | 299 |
| Heat transmission walls [W/m²K] | 1.25 |
| Heat transmission roofs [W/m²K] | 1.54 |
| Albedo walls [ad] | 0.27/0.66 * |
| Albedo roofs [ad] | 0.22 |
| Settings for Soil |
| Initial temperature upper layer (0–20 cm) [K] | 292 |
| Initial temperature middle layer (20–50 cm) [K] | 291 |
| Initial temperature deep layer (below 50 cm) [K] | 289 |
| Relative humidity upper layer (0–20 cm) [%] | 50 |
| Relative humidity middle layer (20–50 cm) [%] | 60 |
| Relative humidity deep layer (below 50 cm) [%] | 60 |
| Clouds |
| Fraction of low clouds [x/8] | 0 |
| Fraction of medium clouds [x/8] | 0 |
| Fraction of high clouds [x/8] | 0 |
| Settings for PMV-Calculation |
| Walking speed [m/s] | 0.0 |
| Metabolic rate [W/m2] | 70 |
| Mechanical factor | 0.0 |
| Thermal resistance of clothing [clo] | 0.35 |
Table 6 reports the main data inserted into the software to reproduce a typical summer day. The wind speed, in 10 m above the ground level, was estimated through Equation (5) [
67]:
In this case study, where an urban area is examined and giving v as the value reported in
Table 1, R is 0.36 [
67] and therefore v
10 is 9.16.
For what concerns the wind direction the value was of 146.1, representing the direction where it presents the highest frequency during the summer (
Table 1); on the other hand the choice of the roughness length Z
0 depends on the position of the site examined in the urban area.
Then, it is important to specify that the initial temperature of the atmosphere is expressed in potential temperature, referable to the absolute temperature through Equation (6):
where:
- -
θ is the potential temperature [K];
- -
TA is the air temperature [K];
- -
P1 is the pressure whose value is used to calculate TA [hPa];
- -
K = 0.286.
Deciding which building properties to select depends on the direct observation of the site [
68,
69,
70,
71,
72], while the inside temperature of indoor spaces is set to 299 K [
73].
Instead, the settings for the soil were inserted based on those values that can be measured in a typical Mediterranean area during the summer [
74] while the cloud cover was set to 0/8 for low, medium and high altitude to reproduce a day characterized by a cloudless sky and high values of direct shortwave radiation.
On the other hand, to make an estimation of the PMV, it was taken into consideration the thermal sensation of a person standing in the site (with a metabolic rate M of 70 W/m2 and with a mechanical factor η of 0.0), whereas the clothing thermal resistance was assumed to be of 0.35 clo (1 clo = 0.155 m2K/W). Such value represents the thermal resistance of a typical summer clothing and this choice, as the one concerning the activity performed by the person (serving as a sample), depends on a direct observation of the people attending the site examined.
7. Results and Discussions
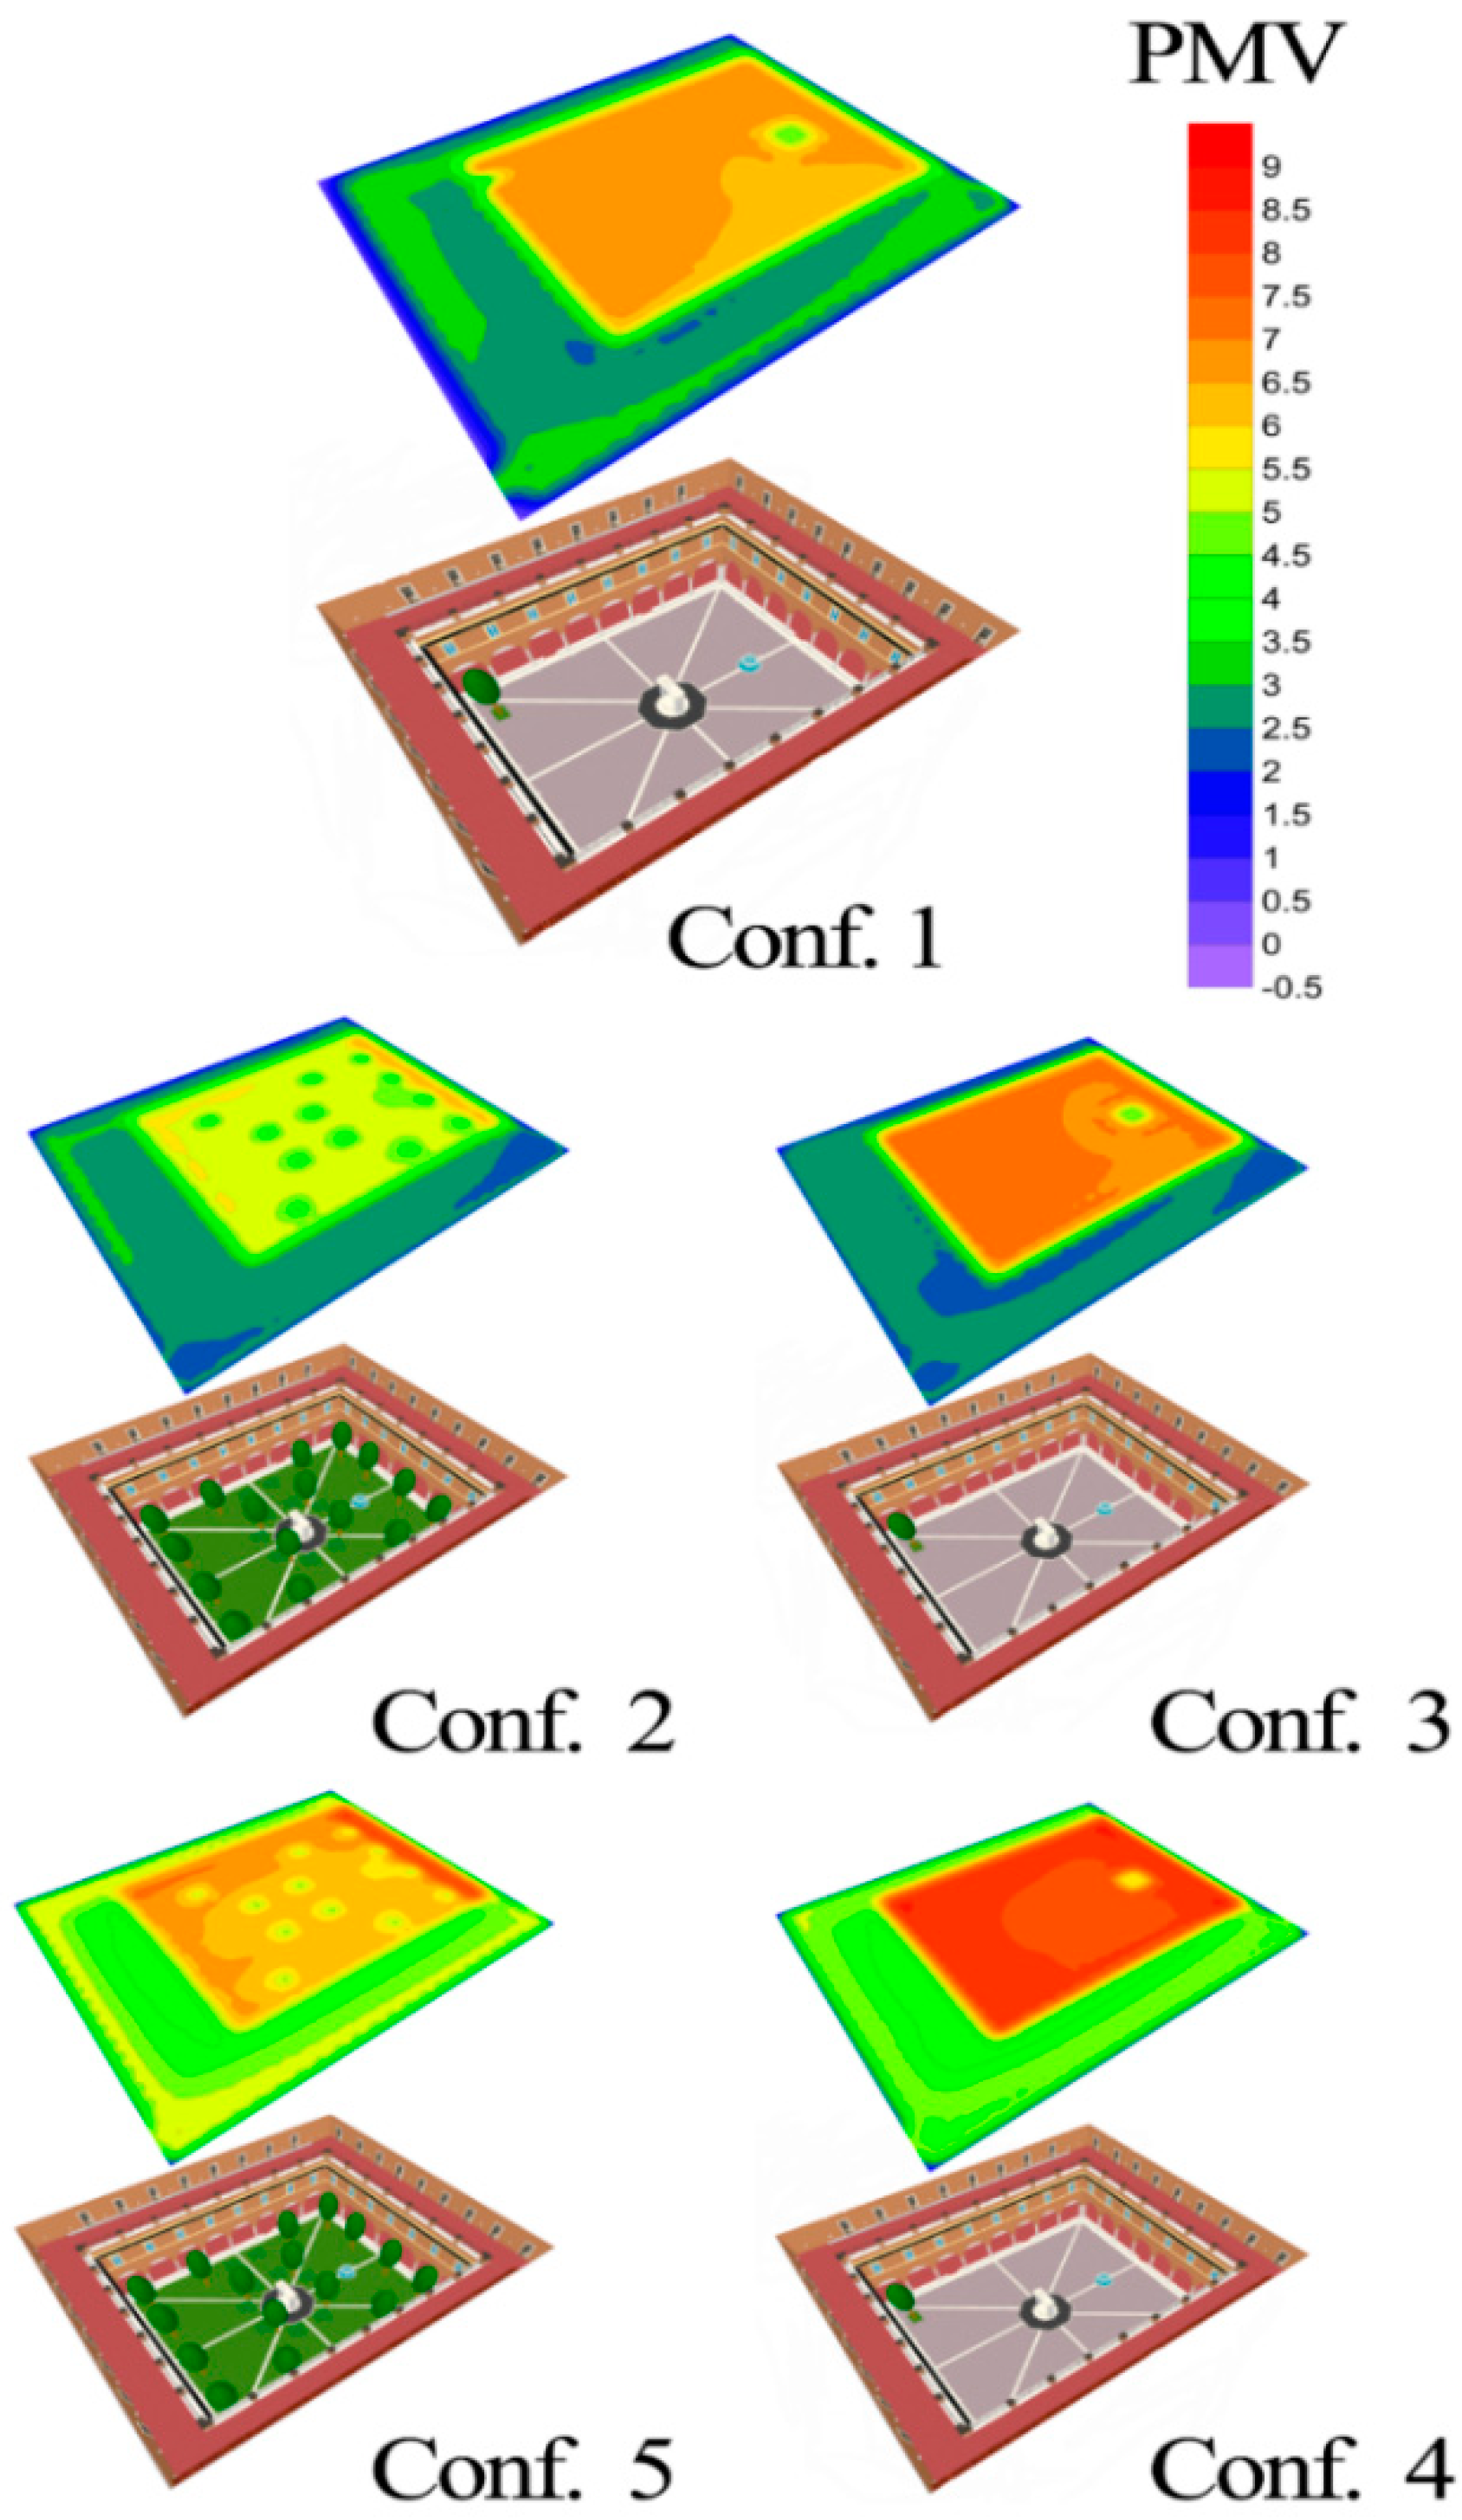
The results provided by the simulations gave the possibility to compare, in terms of the PMV, the effectiveness of the different mitigation strategies (
Figure 5). This is why the PMV is evaluated at the height of 1.1 m on the ground level, representing the height of the human body centre of gravity of people standing [
75]. Afterwards, the case study focused on a typical summer day because the Mediterranean climate presents higher thermal stresses affecting people during the summer (the hottest summer month reports an average temperature higher than 22 °C [
48]).
Figure 5.
PMV maps of the different configurations.
Figure 5.
PMV maps of the different configurations.
Table 7 reports, considering each configuration and PMV ranges of a single unit, the corresponding m
2 of the Cloister surface and the mean PMV.
Table 7.
PMV analysis of each configuration.
Table 7.
PMV analysis of each configuration.
| PMV range | Conf. 1 [m2] | Conf. 2 [m2] | Conf. 3 [m2] | Conf. 4 [m2] | Conf. 5 [m2] |
|---|
| 0–1 | 19.3 | 0.0 | 0.0 | 0.0 | 0.0 |
| 1–2 | 131.6 | 23.1 | 29.4 | 8.2 | 0.0 |
| 2–3 | 408.1 | 687.6 | 690.3 | 72.2 | 15.5 |
| 3–4 | 307.6 | 187.9 | 72.6 | 95.5 | 133.1 |
| 4–5 | 76.8 | 236.6 | 88.1 | 641.7 | 381.9 |
| 5–6 | 110.9 | 644.3 | 104.5 | 97.5 | 491.4 |
| 6–7 | 745.7 | 20.5 | 293.9 | 81.8 | 709.8 |
| 7–8 | 0.0 | 0.0 | 521.2 | 387.3 | 68.3 |
| 8–9 | 0.0 | 0.0 | 0.0 | 415.8 | 0.0 |
| Mean value | 4.5 | 4.0 | 4.9 | 6.1 | 5.6 |
While examining the results, it was possible to note how the best solution is configuration 2. In this configuration, the hypothetical intervention is restricted to the basic surface of the yard where it is assumed the presence of lawn and vegetation. The mean PMV is 4.0 and there are no sections of the surface belonging to categories 7–8 and 8–9; a wide part of the surface belongs to categories 2–3 (687.6 m2).
Even in configuration 1 (the present one, which presents painted lime plaster on the facades and cobblestones on the Cloister yard), there are no sections in the Cloister belonging to category 7–8 and 8–9; what happens though is that a considerable part (745.7 m2) belongs to category 6–7 and, in this way, the PMV value becomes 4.5.
Configuration 4 is then the worst: it is characterized by an increase of the albedo coefficient on both the facades and the yard floor. This determines a mean PMV of 6.1 due to a high contribution of categories 7–8 and 8–9 respectively of 387.3 m2 and 415.8 m2.
The same situation is reported in configuration 5 with the exertion of high albedo materials on the walls causing a deterioration of the outdoor thermal comfort, only in part mitigated by the lawn. The mean PMV is of 5.6 and this value is affected by the 709.8 m2 (category 6–7) and 491.4 m2 (category 5–6).
The exertion of a high albedo material just for the yard determines a less significant deterioration: in fact configuration 3 presents a mean PMV of 4.9. In this case it is possible to note the 690.3 m2 of category 2–3 and 521.2 m2 of category 7–8.
Examining the results reported in
Table 7 and observing
Figure 4, it is possible to see how there is an improvement of the thermohygrometric conditions thanks to the presence of some vegetation while the exertion of high albedo materials (in urban contexts particularly enclosed as the one studied) determines a deterioration of the microclimate.
This is due to the ability of the plants to screen solar radiation (the trees characterizing configurations 2 and 5 during the summer present a coefficient of transmissivity of 2%–5%) and to have the leaf surface temperature really close to the one of the air, that is 20–35 °C lower than the surface temperature of several urban materials commonly used (asphalt, concrete,
etc.). Then, it should be considered that the temperature measured through the globe thermometer under a big tree is 15–20 °C lower than the temperature measured through the globe thermometer in the same place under direct solar radiation [
76,
77]. A further improvement of the microclimate in configuration 2 is determined by the presence of shrubs (preventing the reflected radiation from reaching people) and a lawn (presenting a low level reflection and a high thermal capacity provoking cooling and humidification processes thanks to evapotranspiration phenomena, hence a decrease in air temperature).
On the other hand, configurations with a higher albedo coefficient lead to a deterioration of the outdoor thermal comfort due to an increase in the reflected radiation which in turn determines a sensible heat storage in the lower layers. This is determined by the multiple reflections being established, because of the low sky view factor of the surfaces characterized by a higher albedo, between the limits of the site examined, leading to an increase in the mean radiant temperature. From this point of view and with reference to the actual configuration of the site (configuration 1), it should be kept in mind that the exertion of a high albedo material on the basic surface of the yard (configuration 3) determines a reduction of the air temperature of about 0.3 °C but at the same time an increase of the mean radiant temperature of about 7 °C [
78]. Differently, those configurations characterized by a higher albedo coefficient of the facades show an increase of air temperature and mean radiant temperature, for instance in configuration 4 equal to 1.5 °C and about 20 °C, respectively [
78].
For what concerns the fountain, from the analysis of
Figure 4 it is possible to notice how it determines a very localized improvement of the outdoor thermal comfort. This improvement, for those standing in the surrounding area, is due to the reduction of the Bowen ratio (defined as the ratio between the sensible and latent heat flux) and to a decrease in the mean radiant temperature.
Finally, it is interesting to analyze the influence of the wind:
Figure 4 reports a decrease of the PMV value right in the area of the portico placed between the two entrances where this variable reaches the highest values and the convective heat transfer increases.
8. Conclusions
This paper compared, through simulations performed thanks to the ENVI-met software, different microclimatic mitigation strategies in an urban context to evaluate their effect on the outdoor thermal comfort in a particular enclosed structural configuration. The case study was carried out in the Cloister of San Pietro in Vincoli with an area of 1,800 m2, situated inside the Faculty of Engineering of the Sapienza University of Rome, during a typical summer day. For what concerns the PMV, the present configuration of the site was compared to another four configurations characterized by different solutions for both the vertical and horizontal limits of the structure. Particular attention was given to the influence of the vegetation and to the use of high albedo materials.
The use of this kind of materials in particular enclosed urban contexts causes a microclimatic deterioration, hence higher thermal stresses. This increase is inversely proportional to the sky view factor of the surfaces with a high albedo.
In the case study, a higher albedo on the yard surface determines an increase of the mean PMV of about 0.4 units in respect to the present configuration; whereas if the facades are also made of a high albedo material, the mean PMV is 1.6 units higher.
The microclimatic deterioration, caused by a higher albedo on the facades, can be in part mitigated by the presence of lawn and vegetation: the evapotranspiration phenomena and the capacity of the plants to diminish the incident and reflected direct shortwave radiation reduces the increase of the mean PMV to about a single unit.
Finally, the presence of lawn, trees and shrubs leads to an improvement of the outdoor thermal comfort if the facades do not change: in this case, the magnitude of the multiple reflections inside the structure decreases and the reduction of the mean PMV is about 0.5 units.


 ,
, 


