Article

From Water-Constrained to Water-Driven Sustainable Development—A Case of Water Policy Impact Evaluation

Graduate School of Global Environmental Studies, Sophia University, 7-1, Kioicho, Chiyoda-ku, Tokyo 102-8554, Japan
Sustainability 2015, 7(7), 8950-8964; https://doi.org/10.3390/su7078950
Submission received: 6 May 2015 / Revised: 1 July 2015 / Accepted: 2 July 2015 / Published: 9 July 2015
(This article belongs to the Section Environmental Sustainability and Applications)

Abstract

:
A water allocation policy that aimed to balance water demand with water availability to ensure sustainability was implemented in an arid region of China over ten years ago. This policy’s success was assessed across three dimensions: society, the environment, and the economy. While the assessment was not intended to be comprehensive, it highlighted the best outcomes of the policy intervention while revealing some hidden issues. It was found that although the policy was successful in placing a ceiling on water use in the middle reaches of the Heihe River, the Water User Association, one of the main actors in water policy implementation, was under-recognized, even though it functioned well. Moreover, the economic structural adjustment at the macro level had not led to any significant reduction in water use, the reasons for which were explored.

1. Introduction

Water is the lifeblood of human society. It binds us together, creating deep, complex interdependencies between society, the economy, and natural ecosystems. Due to population and economic growth, the competing demand for water resources has been increasing, especially in developing countries. Moreover, mounting evidence of the significant effect of human activities on the environment in general led to the emergence of sustainability concept as a central aim for societal development in the early 1970s, and the concept has been gaining increasing recognition and wide use both academically and politically in recent decades. Balancing water demand with water availability to ensure sustainability has become the engine for societal and economic development, but it also presents one of the most significant challenges for the 21st century, which is unprecedented in scope, and requires a fundamental shift in political and societal consciousness and in action. It calls for innovative visions and new approaches for shaping an evolving new reality. We must pursue a dream in which every U.S. dollar invested in water infrastructure returns tens of U.S. dollars in addition to social and environmental benefits. Therefore, water management is not a mere sectoral issue but is a key to regional, national, and global sustainability.
While links between increasing water scarcity and environmental consequences have been somewhat established, links between water scarcity, economic growth, and societal development are much less clear. Thus far, studies investigating the relationship between water use and the economy at regional or national levels are still limited and model-oriented. For instance, Rock [1] found that per capita water withdrawals and consumptive use both followed the environmental Kuznets curve. Goklany [2] presented an assessment of water use showing that per capita agricultural water withdrawals in the United States seemed to fit an inverted U shape. However, Gleick [3] found no clear relationship between national water withdrawals per capita and per capita income. On the other hand, coupled hydrologic-economic models have been developed and used to study general acquisition and allocation problems related to water [4,5]. The computable general equilibrium (CGE) model has been employed to calculate the economic effect of reallocating surface water from irrigated agriculture to recreational use [6], and to analyze the effect of water price increases on water conservation [7], and to evaluate the effect of industrial transformation on water consumption [8].
An important advantage of modeling studies is their ability to integrate essential hydrologic, economic, and institutional components of a river basin and to explore both the hydrologic and economic consequences of various policy options. However, these models provide results for various scenarios without quantifying or assessing the uncertainties pertaining to the model predictions. There are at least three types of uncertainty. One is due to the model assumptions, which simplify physical processes such as temporal variability, the second is uncertainty in future water management scenarios, and the third is associated with the values taken into the model parameters.
Such mixed and inconclusive results with regard to the link between economy and water use and model uncertainties can be viewed as a reflection of the complex issues between water use and economic development, implying that more case studies should be conducted to evaluate the effectiveness of water management policies from various angles. These results could then be used to support further model development so new insights can be considered when assessing sustainability and developing further strategies.
The research question addressed in the present study is whether it is possible to turn a water-constrained region into a water-driven sustainable society through appropriate water policy intervention. Using a case study from Northwest China, the present study aims to provide evidence that better water resources management can serve as an engine toward sustainability, although the engine performance might be different for different aspects of sustainability. The present study enriches the sustainability literature by investigating what really happened after the policy implementation, which not only contributes a better understanding of the water policy function in regional sustainable development but also provides a benchmark test that can be used to better develop integrated hydrologic–economic models.

2. Description of Study Site

The present study focuses on the Zhangye Basin (or Zhangye City) in the middle reaches of the Heihe River, which is the second largest inland river in China. Its main stream, which is 821 km long, originates in the Qilian Mountains in Qinghai Province, flows through the Zhangye Basin, which is part of the ancient Silk Road, and ends up in the Inner Mongolia Autonomous Region. Zhangye Basin covers an 1.08 × 10⁴ km2 area extending from 38°30′N to 39°50′N and 99°10′E to 100°52′E. Along the main stream, the middle reaches of the Heihe River starts in the Yingluo Gorge and ends in the Zhengyi Gorge (Figure 1). The region is characterized by a dry continental climate with a mean annual precipitation less than 200 mm and an annual potential evaporation 2000 mm or more. The renewable water resource per capita in the Zhangye Basin is 1250 m3/year, just 5% of the world average.
Figure 1. Watershed of the Heihe River.
Sustainability 07 08950 g001
Since the middle of the 1960s, land use in the Zhangye Basin has changed remarkably. The grassland and forest areas have significantly decreased while farmlands have increased. By 2000, the ratio of arable land to the total area in the Zhangye Basin was approximately 20%, with 75% of the farmland expansion being through a conversion from grassland. In addition, 40.6 km2 of wetland was reclaimed for agricultural use from the middle of the 1980s through 2000 [6].
However, because the population also increased at the same time, the arable land per person has decreased steadily since the middle of the 1960s. Currently, the total population of the basin is 1.3 million, of which 60% are farmers.
The large-scale agricultural activity in the Zhangye Basin has led to an excessive consumption of water. The surface water consumption in the 1980s was about twice as high as that in the 1970s, with this trend continuing into the 1990s. The overuse of water in the middle reaches of the Heihe River led to a very low discharge in the lower river basin, resulting in more than 30 tributaries and terminal lakes drying up. Such hydrological changes have caused a marked degradation in the environment, such as secondary salinization and land desertification across the entire river basin, especially in the lower basin, where the area of natural riparian vegetation has massively decreased [9].
In the year 2000, a water allocation policy to divide available water between the middle and lower reaches of the Heihe River was made by the central government of China, which mandates 0.95 × 10⁹ m3 of water be diverted downstream when the annual runoff at the entrance of the middle reaches is not less than 1.58 × 10⁹ m3. Due to this water allocation policy, the water resources per capita in the Zhangye Basin were reduced to 1190 m3/year, just 59% of the China’s national average.
To forge a new balance between reduced water availability and water demand for the local economy and livelihood, the Ministry of Water Resources (MWR) of China initiated a pilot project in the Zhangye City in 2002, namely, Building Water-Saving Society. The project, the first project of its type in China, consisted mainly of three aspects: construction of water-loss-preventing irrigation channel system, installation of meters for charging irrigation water use, and a water use rights (WUR) system with tradable water quotas, which is aimed to reallocate water more reasonably and efficiently and raise water use efficiency through water quotas trading [10].
A large number of studies have been undertaken for the Heihe River basin, ranging from water balance analysis [11], groundwater study [12,13], public participation [14], landscape evolution [15], land use change [16], chemical fertilizer use [17], and sustainability study as well [18].
The present study is intended to further assess the impacts of the water allocation policy and water-saving measures on regional sustainability by answering key questions: what parts of the policy work, what parts do not work, and the reasons why they do or do not work.

3. Methods

Policy evaluation seeks to determine whether the policy produced the intended outcomes and effect. Because the goal of water allocation in an arid region is to achieve regional sustainability, sustainability assessment for a target region can be viewed as a water policy impact evaluation if it is conducted in a water-centered manner. Wording differently, sustainability framework was employed for water policy evaluation.
A sustainability assessment aims to steer societies in a more sustainable direction by providing tools that can be used to either predict the effect of various initiatives on the sustainability of society or measure progress towards a more sustainable state. Various methods and techniques for sustainability assessment have been used, with the use of indicators increasingly receiving more attention in recent years and a large number of indicators being proposed. In general, sustainability indicators can be classified into three major types according to the World Bank [19]: (i) individual indicator sets, which cover a wide range of concerns with a large number of indicators; (ii) thematic indicators, which evaluate sustainable development policies for specific issues with a small set of indicators; and (iii) systemic indicators, which use one aggregated or composite indicator to deal with a complex problem. However, indicator selection must be scientifically sound, technically robust, easily understood, practically calculable in terms of data availability, measurable, and capable of being regularly updated. In reality, the use of a large number of indicators or aggregated indictors for sustainability assessment is often data-intensive, which renders it impracticable in many cases in developing countries.
In essence, sustainability is characterized by three pillars: the environment, the economy, and society. Even a well-planned environmental conservation effort is doomed to fail if it does not respect the economic and social pillars of sustainability. From an economic perspective, businesses must make profits to create jobs and provide goods and services to the populations they serve. Therefore, trade-offs are often required. A good example is the control of CO2 emissions. Instead of simply limiting emissions, world leaders have promoted a reduction in emissions by providing incentives for businesses, which allows industrialized nations to meet emissions standards while aiding developing nations financially. Following the three pillars framework, this study evaluated the policy’s effect on sustainability in three dimensions: society, the environment, and the economy. In the societal dimension, the assessment focused on legal foundation development and public participation by collecting information from the local water management authority and by conducting an independent field survey. In the environmental dimension, attention was given to wetland restoration in the Zhangye Basin and downstream environmental recovery efforts based on a literature review. In the economic dimension, emphasis was placed on economic structural adjustment in relation to water use. Indicators such as water productivity and total water use per year were employed in the analysis. Data were mainly obtained from Zhangye City statistical yearbooks and Zhangye Water Resources Bulletins, which are compiled by the National Bureau of Statistics of China and the Hydrology and Water Resources Bureau of Gansu Province, respectively. Statistical data released by governments are usually considered trustworthy. However, the quality of Chinese official statistics has repeatedly been questioned by researchers [20,21]. On the other hand, a study by Lequiller and Blades [22] indicated that the Chinese official data can serve as “a reliable guide” to the level and growth pattern of GDP. Curtis and Mark [23] found that the official Chinese macro data appear consistent with economic theory. Marton [24] pointed out that China’s demographic, social, and economic statistics are abundant and fairly reliable by developing country standards. In light of these findings, the use of statistical data released by China’s national and regional statistical authorities is justifiable. The present study also utilized data and information available in the literature. Because some valuable data and information are only available in Chinese literature, citing them is unavoidable and may be considered part of the process of cross-language information dissemination. The philosophy is that better understanding water policy impacts in China and sharing it with the rest of the world is too important to wait until high-quality information in English become available. It should also be noted that this evaluation was not intended to be comprehensive but instead sought to identify advancement and any serious problems remaining among the three dimensions. By highlighting advancements and uncovering hidden issues, such an assessment could be useful for policy makers in deciding next steps.

4. Results and Discussion

4.1. Effects on Society

To coordinate the water allocation, the Heihe River Basin Administrative Bureau (HRBAB) was set up in January 2000 to serve as the main agency for integrated water resource management across the Heihe River Basin and to be responsible for the implementation, operation, and maintenance of large-scale water projects. A water-saving leadership office was also set up in Zhangye City; this office is responsible for planning and implementing various water-saving measures in its jurisdiction.
Since 2002, Zhangye City has established over 20 water-related regulations and guidelines, such as water-saving management regulations, agricultural water trading guidelines, industrial sector water-saving guidelines, water consumption rations for industry, and agricultural and ecosystem water use guidelines. These form the legal foundation for water-saving society construction.
A cornerstone in improving water management in the region was the introduction of a WUR system. Under this system, every farm household is given a water quota depending on the size of the irrigated farmland according to the water consumption ratio stipulated by the water management bureau in Zhangye City. Before 2000, water conflicts over water use occurred almost every year and even resulted in deaths and severe injuries. Since the establishment of the WUR, the number of water conflicts has reduced by more than 70% according to the water-saving leadership office.
Effective public participation is a key factor in the successful implementation of the Building a Water-Saving Society project. The revision of the “Water Law” in China in 2002 provided the public with an institutional guarantee in terms of participation in water resource management. Driven by this law, the Water User Association (WUA) system was established in the Zhangye Basin in 2002 to ensure public participation for better water resource management. Currently, the region has 768 WUAs, which are responsible for arranging water allocations to its member households. Through the WUAs, households apply for and obtain water tickets from the irrigation district offices according to the amount of water a household is entitled to in a particular year. Households can trade their water tickets with other households provided the price charged does not exceed a pre-determined ceiling. With such public involvement, irrigation water volume, irrigation duration, and irrigation areas for all users become transparent.
In the Liushuzhai village, the establishment of water user rights and the operation of the WUA led to water conservation of 750 m3/ha, with a corresponding cost savings of 75 RMB/ha. In the Pengzhuan village, the total water trade volume was 10,000 m3/year, which not only provided irrigation to all the farms in the village but also resulted in water saving of 100,000 m3 and a cost reduction of 10,000 RMB according to information provided by the Zhangye Water Management Bureau.
The Zhangye City government also invested in irrigation channel linings and promoted the use of advanced irrigation techniques, such as sprinklers and drip irrigation. By lining the channels with concrete, water delivery efficiency increased from 50%–70% to 80%–95% [25].
Following all the measures mentioned above, irrigation water use per unit area decreased by 15% and productivity per cubic meter of water increased by 14% compared with the amounts in 2000, according to Zhangye City statistics.
According to the Zhangye Agricultural Bureau, water-saving irrigation techniques, such as sprinklers and drip irrigation, have now been applied to over 10,000 ha of farmlands in the Zhangye Basin, resulting in saving 1.69 × 10⁸ m3 of water per year.
In August 2014, a household survey was conducted to investigate the level of recognition of the WUA by farmers. For crosschecking, two teams independently conducted the survey at the same time in eight villages located in four irrigation districts (one groundwater irrigation district and three surface-water irrigation districts). The most basic question asked by the two teams was “Do you know the WUA?” Team 1 interviewed 72 households; of those, 68 said they had never heard of the WUA. Team 2 interviewed 83 households. In the surface-water irrigated districts, 25% of the interviewees were aware of the WUA, whereas in the groundwater irrigated areas, 0% of the interviewees knew of such an organization. Nevertheless, in the groundwater irrigated areas, farmers actively participated in water resource management by paying water fees, attending various meetings on irrigation and water-related issues organized by the village or their group, and following the irrigation schedule determined at these meetings. When the farmers were asked where they got their water quotas, those who did not know of the WUA answered that these were given by the village committee or the irrigation water supply office under the water management bureau.
It is common for WUAs to be non-governmental, non-profit organizations. Membership in the WUA is based on contracts and/or agreements between the members and the WUA. However, we found that the representatives and executives of the WUAs we interviewed were either village committee heads or village cadres. Therefore, the WUAs in Zhangye City may be viewed as non-governmental, non-profit organizations with Chinese characteristics. This mixed form of operations may be the reason for the low awareness of the WUA; the village head or cadre is a government position, while the WUA representative is not. Under the current political and cultural environment in China, a person would prefer to use the authority of the village head to forge consensus rather than negotiate with farmers as a WUA representative. As a result, farmers developed the impression that water allocation was determined through the village committee. The underlying issues are a lack of legal development to empower the WUA and a lack of training programs to train farmers to become WUA leaders.
Despite these problems with the WUA in the region, 100% of the interviewees in the surface-water irrigated areas and 92% in the groundwater-irrigated area answered “Yes” when asked if their water use needs were being met by the current water supply management. Another finding worth further investigation is that only 15% of the interviewees knew Zhangye City was a pilot city for building a water-saving society.
True public participation requires the involvement of all stakeholders for decision-making. In the case of Zhangye City, industries, urban residents and private businesses are also concerned parties in water resources utilization and management. However, the current WUA framework is rural-focused and farmer-centered without involving business sector and urban communities although business development and lifestyle change in urban areas will definitely affect water availability in this region. Therefore, what should be pursued for better public participation for water resources management in Zhangye City is to improve the level of farmer’s participation from informing to partnership and to involve other stakeholders at the same time. The vision is to develop a new WUA, transcending the boundaries between rural and urban, agriculture and industry, and public and private.

4.2. Effect on Environment

4.2.1. Wetland Conservation in the Middle Reaches

Over the past several decades, the wetlands in the Zhangye Basin have become seriously degraded due to agricultural development, population growth, effluent discharge from households and industries, and overexploitation of groundwater. In the 1990s, 1300 ha of wetland were reclaimed for farming. The northern suburban reed wetland of Zhangye City shrunk from 597 ha to 522 ha. The mean height of the reeds decreased from 4 m to 2–3 m, and the density decreased by 20%. The diameter of the reeds was 4% thinner [26]. The total wetland area had reduced by 40% before the new wetland protection policy was implemented.
As part of the integrated water resources management following the water allocation, Zhangye City emphasized wetland restoration and conservation. In 2006, the Zhangye Municipal Government approved the Zhangye Heihe River Basin Wetland Management Regulation. This regulation stipulated that wetland reclamation and the conversion of the water body to farmland be strictly prohibited within the designated wetland area. Furthermore, through a comprehensive conservation plan, the city obtained the approval from the central government to establish the Heihe Wetland National Nature Reserve, which consists of a core zone, a buffer zone, and an experimental zone. Within the core zone, 170 ha of cultivated farmland were converted back to wetland. With the new policy taking effect, the total wetland area in the Zhangye Basin had increased by 8.4% in 2010 compared to 2005, and the total biomass increased by 28.9% [27]. Currently, the total wetland area is 251,348 ha, which accounts for 6% of the land surface in Zhangye City.

4.2.2. Recovery of Downstream Environment

As water consumption in the middle reaches increased, the ecosystem downstream became seriously degraded. The vegetation area decreased from 6.0 × 10⁴ ha in the 1930s to 2.67 in the 1990s. From 1992 to 2000, the oasis area downstream decreased at an annual rate of 6.7%. The predominant natural vegetation in the oasis includes P. euphratica, T. ramosissima, H. ammodendron, and S. alopecuroides. These species play an important role in maintaining the ecosystem function in this arid area because of their tolerance to severe drought, high salinity, and alkalinity in soils. Vegetation degradation was mainly related to the reduced recharging of riparian groundwater, a decreased groundwater table, and increased salinity in the groundwater system. After the water allocation was implemented, the groundwater table fluctuated significantly in most of the study area with spatial heterogeneity. Generally, the groundwater table rose by 0.5 m in the upper part and 1.5 m in the lower part of the downstream reaches [28,29].
As the groundwater table recovered due to water diversion, vegetation deterioration in the lower reaches ceased, and the mean growing season (the previous November–October) fractional vegetation cover (the fraction of soil that is covered by vegetation) increased from 3.4% in 2000 to 4.5% in 2012 [30,31]. The most remarkable environmental improvement in the lower reaches was the revival of one of the terminal lakes, East Juyanhai, which dried up in 1992 but now has a surface area of more than 40 km2 [32].
Up to the beginning of the 1960s the Aral Sea in the middle of the Kyzylkum Desert was the fourth largest inland lake on earth. Today, much of it dried up due to poor water resources management. Many approaches to solve the Aral Sea problem have been proposed by various groups, individuals, or agencies [33], but it remains a devastated water body. Compared to the Aral Sea, the recovery of the East Juyanhai is a great story of policy success and may serve as a model to inspire environmental restoration activities for lakes suffering from drying-up.
In economics, externalities are defined as third-party (or spill-over) effects arising from the production and/or consumption of goods and services for which no appropriate compensation is paid. Following this concept, the expansion of agricultural activities in the middle reaches created negative externalities not only in the middle reaches but also downstream. Although the water allocation policy now internalizes the externality downstream, the question of whether the middle reaches should compensate the downstream reaches for the environmental degradation and pay for the cost of restoration remains unexplored.
What the policy did not influence directly upon is chemical fertilizer use. According to previous studies, the total amount of nitrogen fertilizers applied on corn fields in the Zhangye Basin was more than 450 kg/ha/year in recent years [34]. A study by Yang and Liu [35] showed that 32.4% of the groundwater well samples in Zhangye had nitrate–nitrogen concentrations exceeding the allowed value set by the WHO. Besides, due to water scarcity, some villages have been using wastewater for irrigation. Owing to the overuse of fertilizer and insufficiently-treated wastewater, seed corns and various vegetables grown in the region were found to contain excessive nitrate [36].

4.2.3. Impact on Economy

Before the water allocation implementation, the GDP generated per m3 of water in Zhangye City was 2.81 RMB, lower than the national average, and the water consumption for 10,000 RMB GDP was four times the national average. This low water productivity was mainly due to the economic structure. Considering that agricultural water use accounts for 90% of the total water consumption in Zhangye City, the water productivity for wheat, maize, and beans was less than the national average; therefore, optimizing the economic structure from a water productivity perspective was an extremely important step toward regional sustainability. It was believed by the local government that the structural shift from the primary sector-dominated to the second or tertiary sector-dominated economy would result in significant water savings and the water allocation policy can serve as a driver for the optimization. Since 2000, Zhangye City has pursued economic structural adjustment through two initiatives: adjusting the crop structure by replacing crops that have high water use with crops that are less water demanding and adjusting the primary, secondary, and tertiary sector ratios.
As an important step in implementing the WUR, the local government promoted planting water efficient crops and prohibited rice production because of its high water demand. Today, the dominant crop in the Zhangye Basin has shifted from wheat–maize intercropping to seed corn, which accounts for over 25% of the total planting area in the basin. As far as income per hectare is concerned, intercropping is better than seed corn. However, water consumption for intercropping is about 40% higher than that of seed corn, which was the reason for the shift. Nevertheless, in terms of water consumption, wheat is about 30% less demanding than seed corn in the Zhangye Basin [37,38], but it was not promoted as a water-saving measure because of its lower yield and market value compared to seed corn. This factor indicates that the strategy employed in building a water-saving society was to not only maximize water conservation but also strike a balance between water conservation and helping farmers improve their profitability.
With the implementation of the two initiatives, the ratio of grain to cash crops changed from 67:33 in 2001 to 44:55 in 2007, and the water productivity or GDP generated per m3 of water increased to 8.9 RMB in 2013.
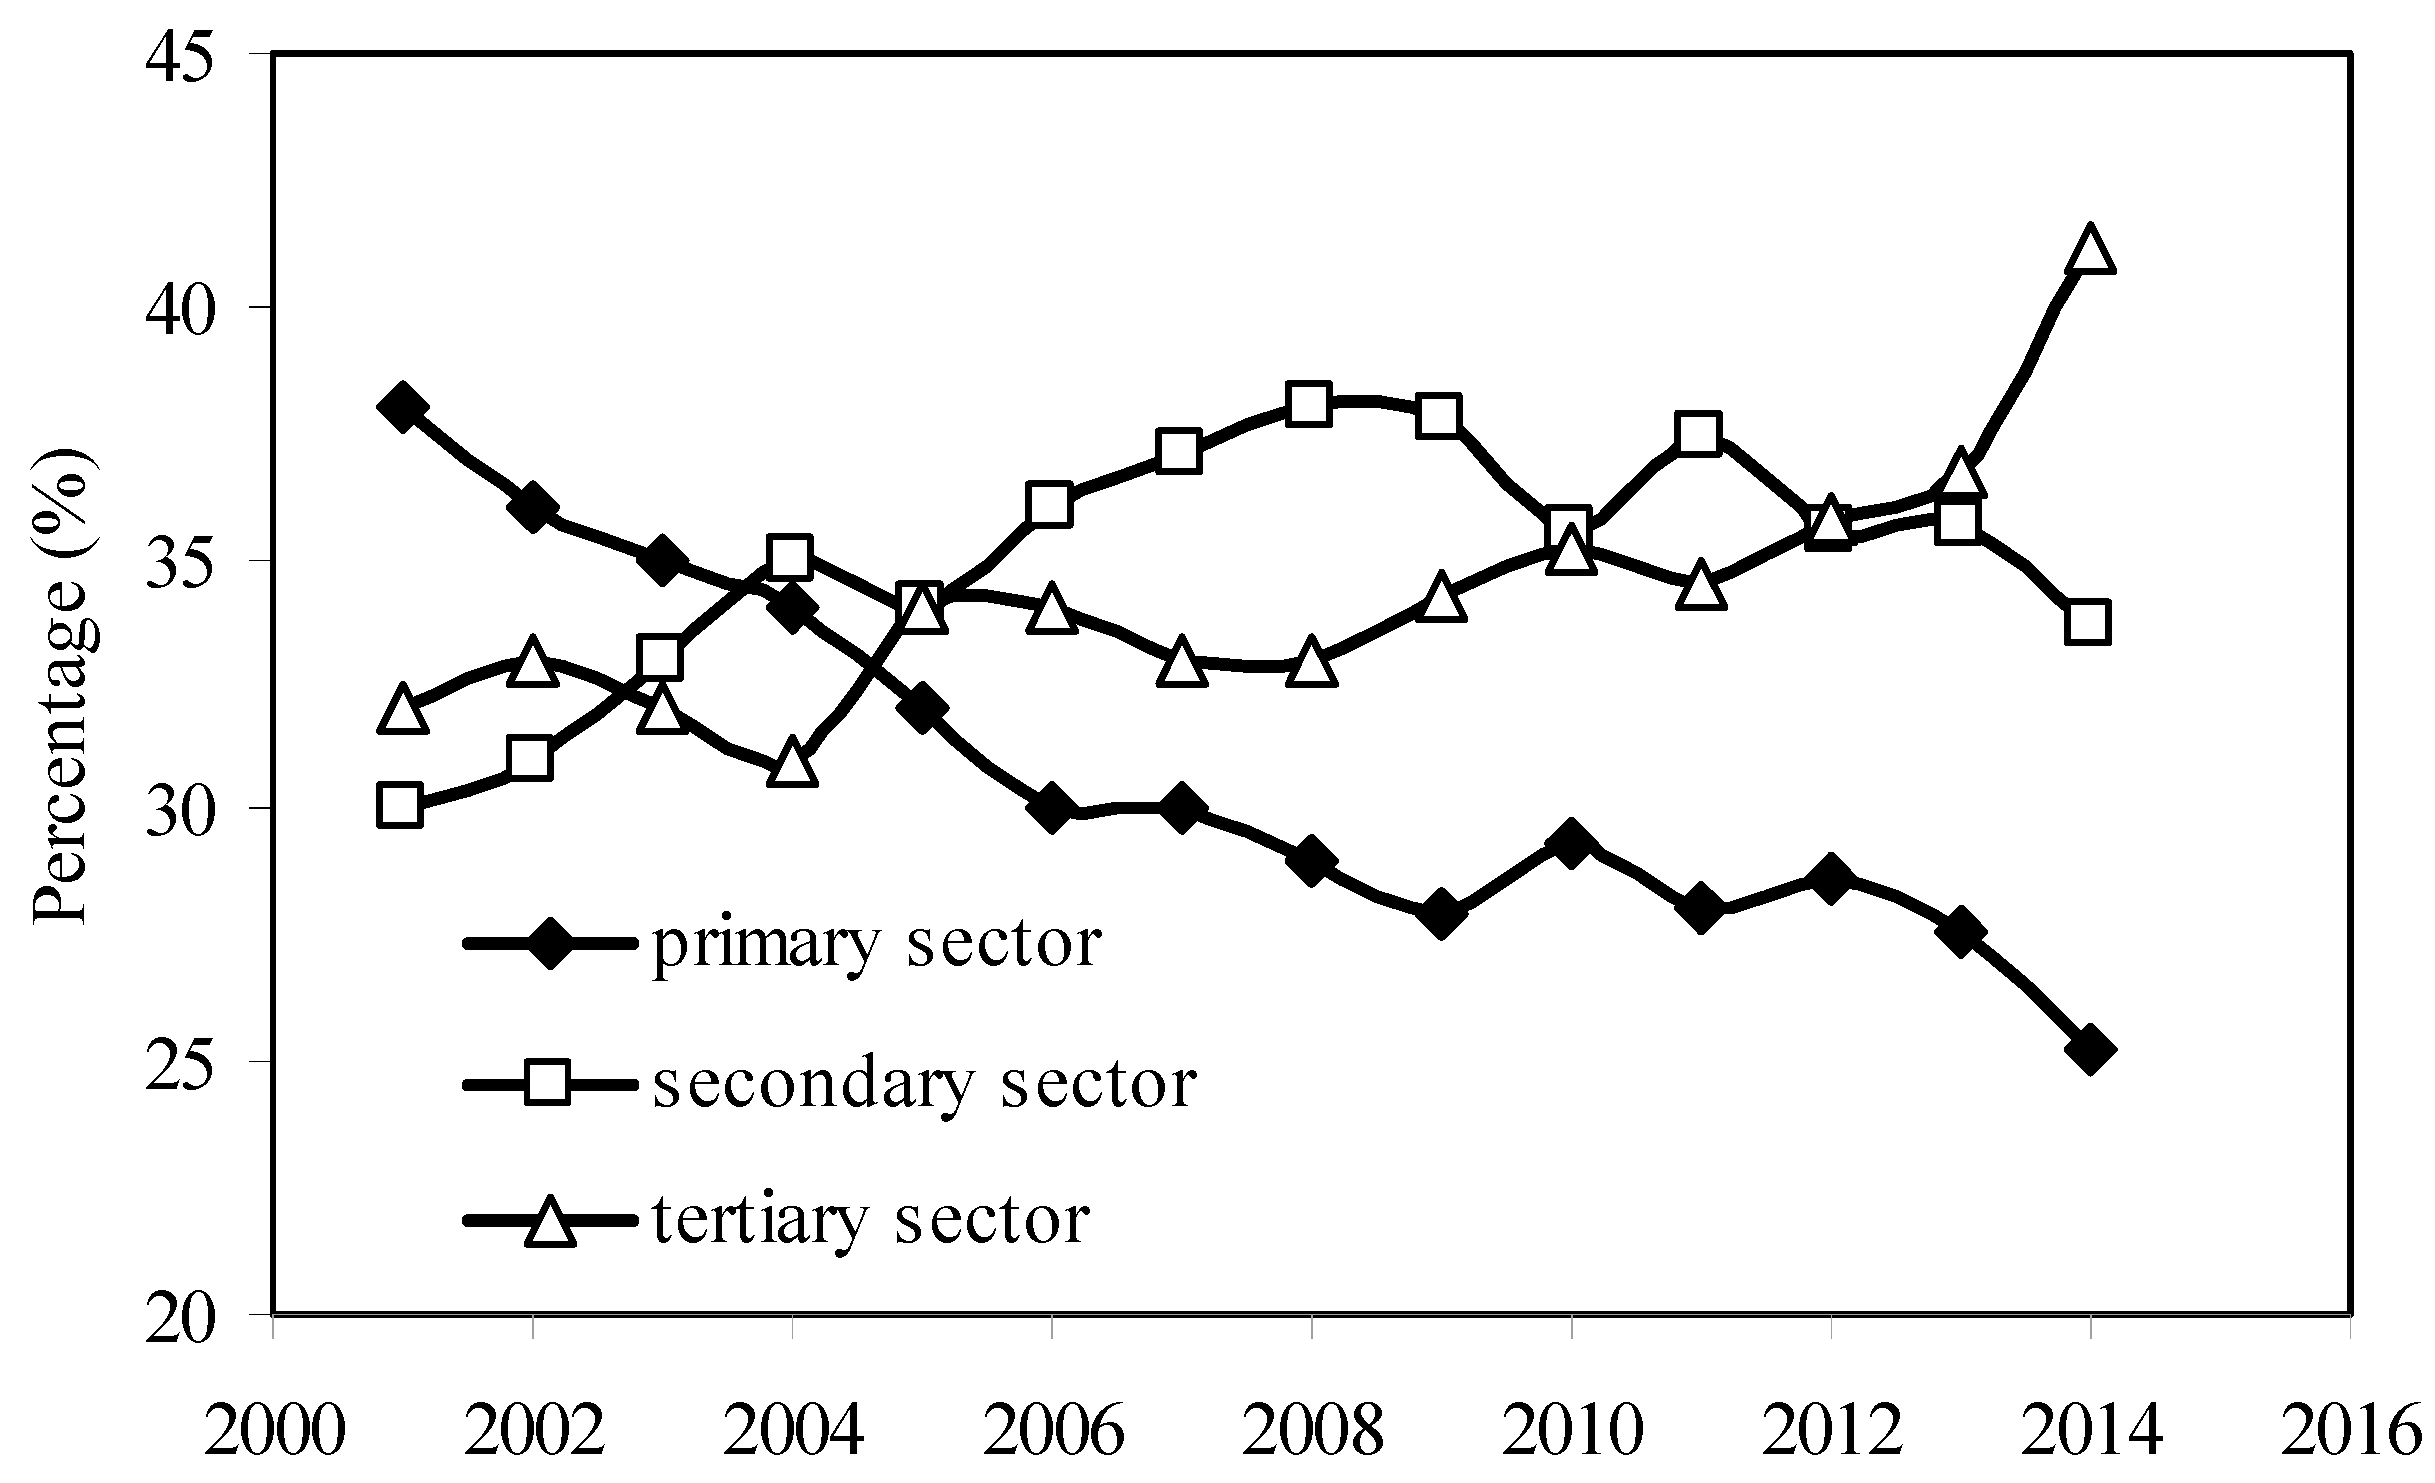
Figure 2 shows the changes in the economic structure in terms of GDP from 2001 to 2014. The tertiary sector has expanded from 32% to 41%, while the share of the primary sector has decreased from 38% to 25%.
Figure 2. Changes of sectoral shares in term of GDP.
Sustainability 07 08950 g002
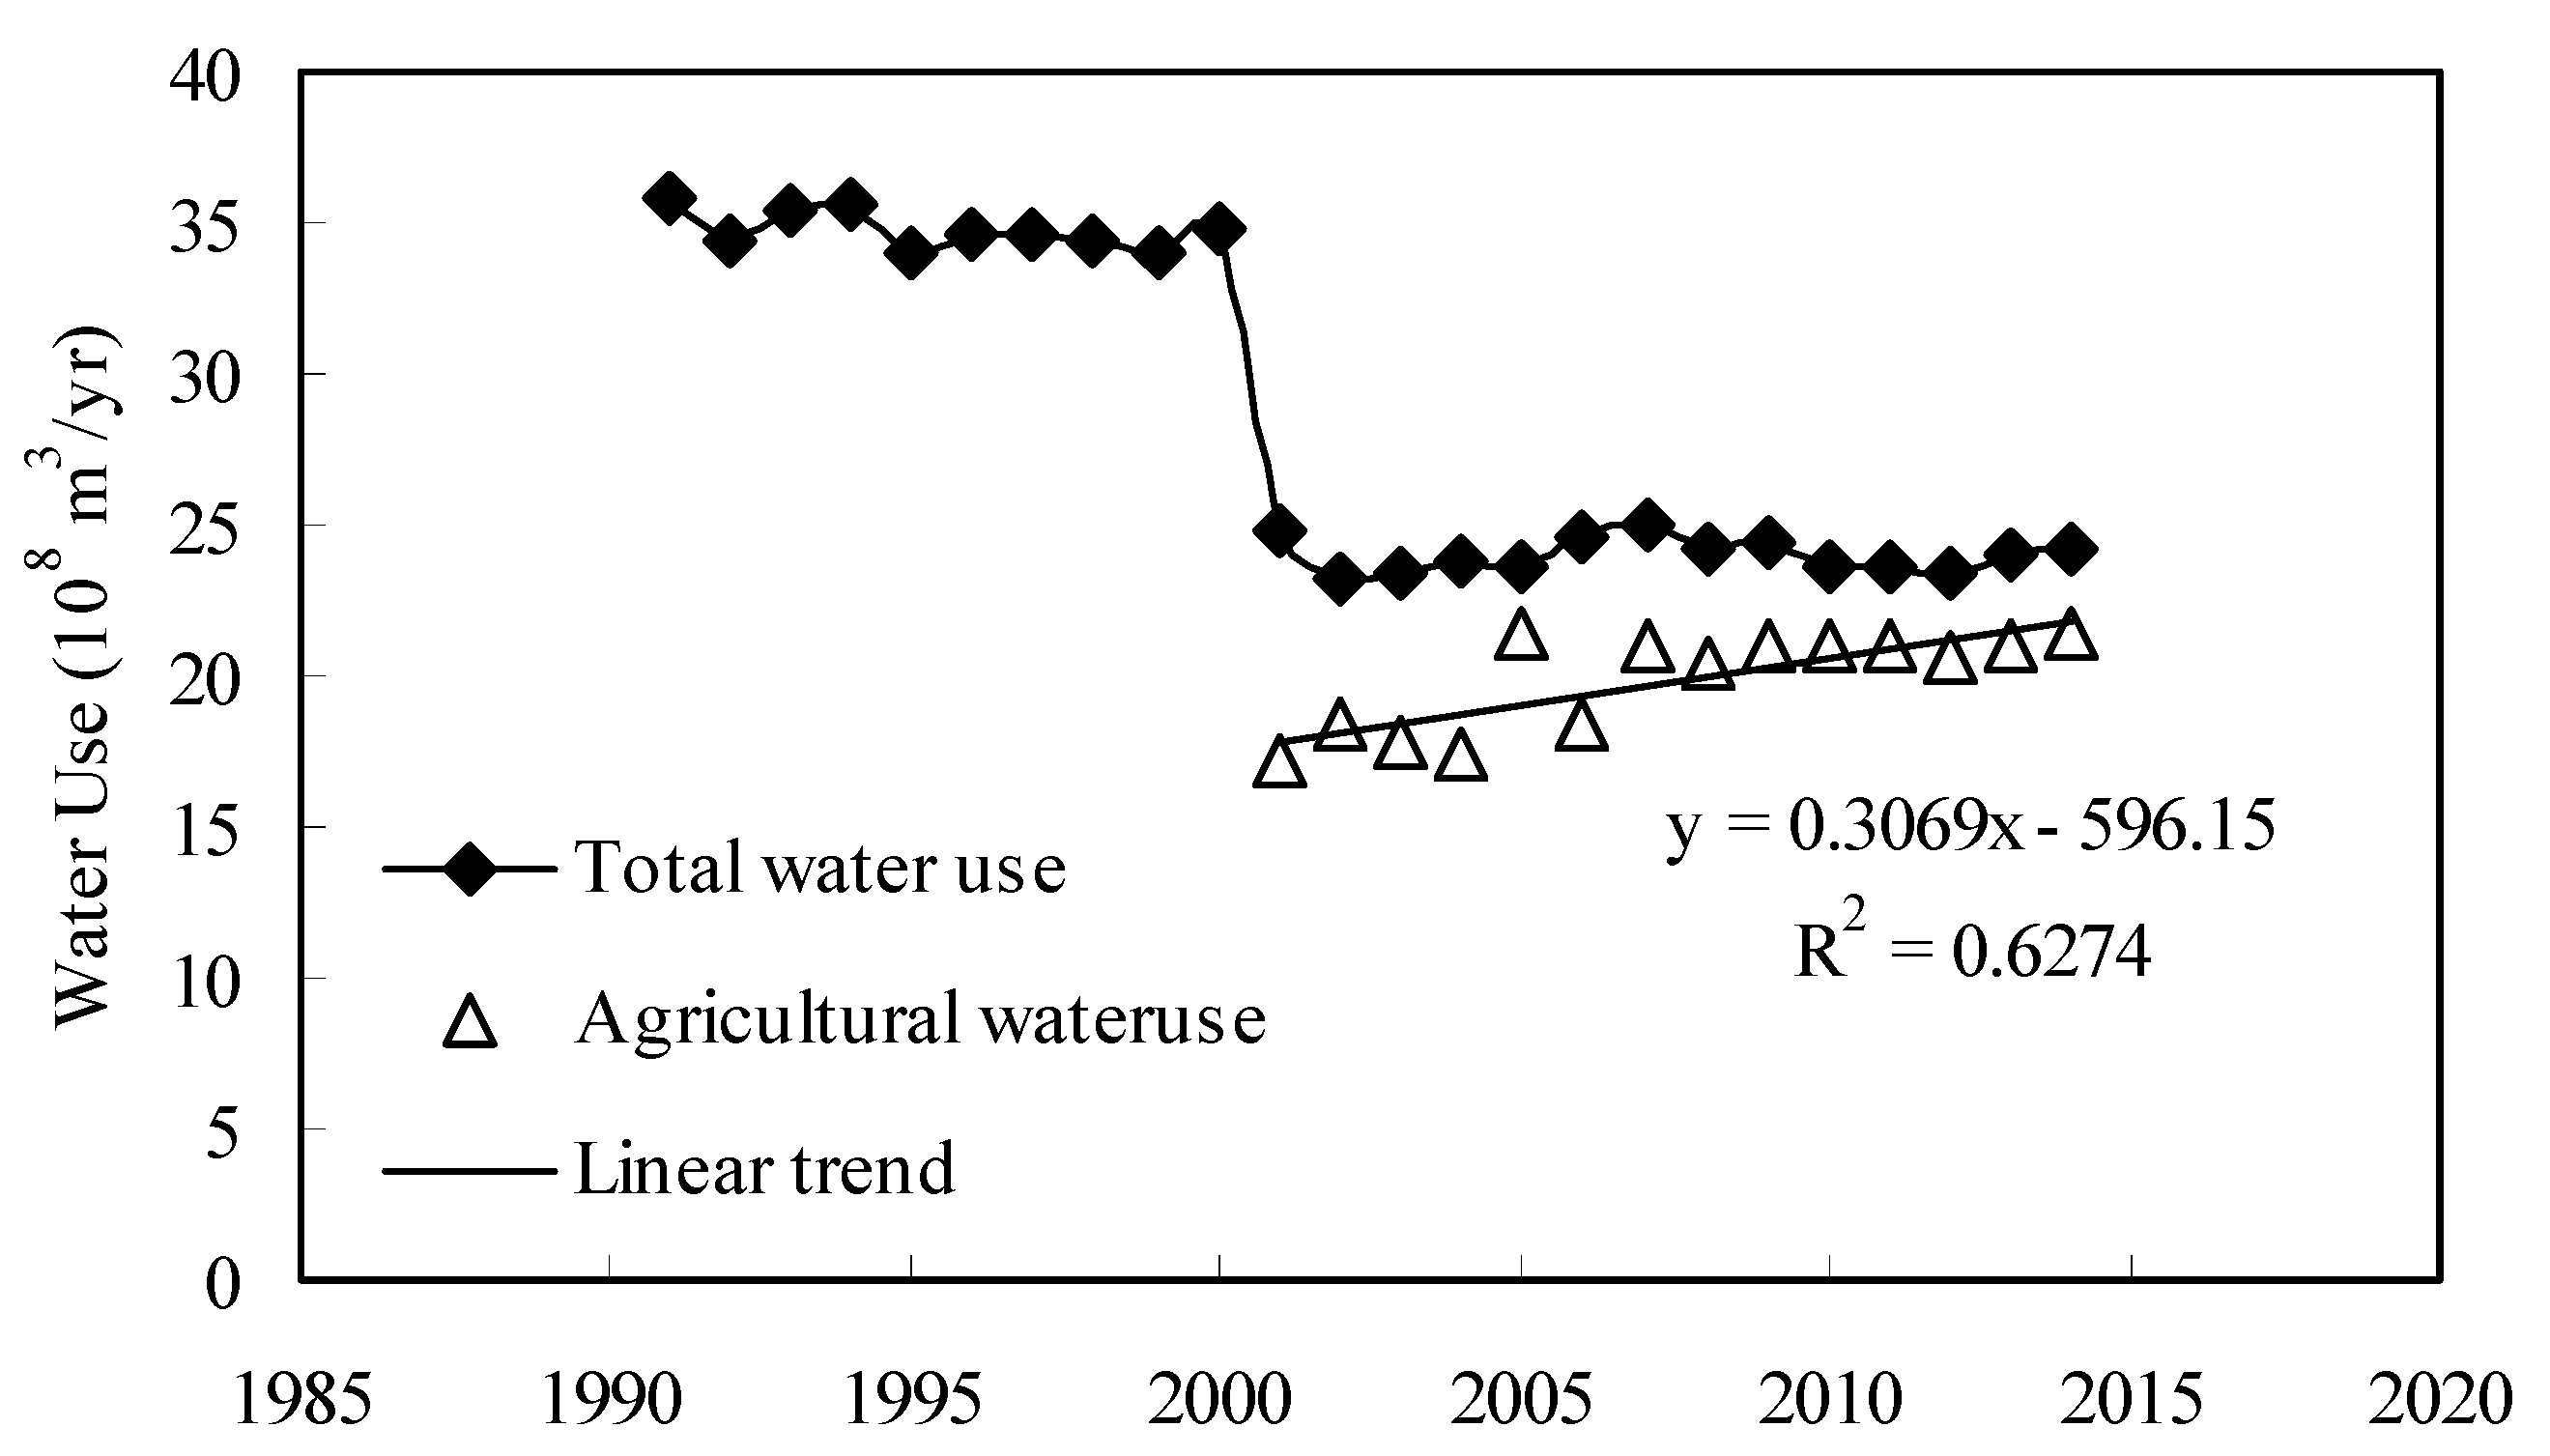
Figure 3 shows the variations in the annual total water use in Zhangye City from 1991 to 2014. It is clear that a large reduction in water use occurred before and after the policy intervention. The application of the Mann–Kendall test to the water-use dataset confirmed a statistically significant reduction, which is due to the water allocation policy. To see how the total water use was affected by the economic structural adjustment, a correlation analysis was conducted using data from 2001. The analysis indicated that the ratio of the primary sector to the secondary and tertiary sectors was not correlated with variations in water use from 2001 to 2014, implying that the economic structural adjustment did not lead to further reductions in water use in Zhangye City. Furthermore, a change-point analysis, which is an effective and powerful statistical tool for detecting mean shifts in a time series [39], was employed to discover any subtle turning points in water use since 2001. The change-point analysis detected no turning points in water use since 2001. Examining details of water uses showed that agricultural water use had an increasing trend (Figure 3). The change-point analysis detected a turning point for agricultural water use in 2005 with a confidence level of 95%. A further probe into this matter found that agricultural land expansion did not end with the water allocation policy.
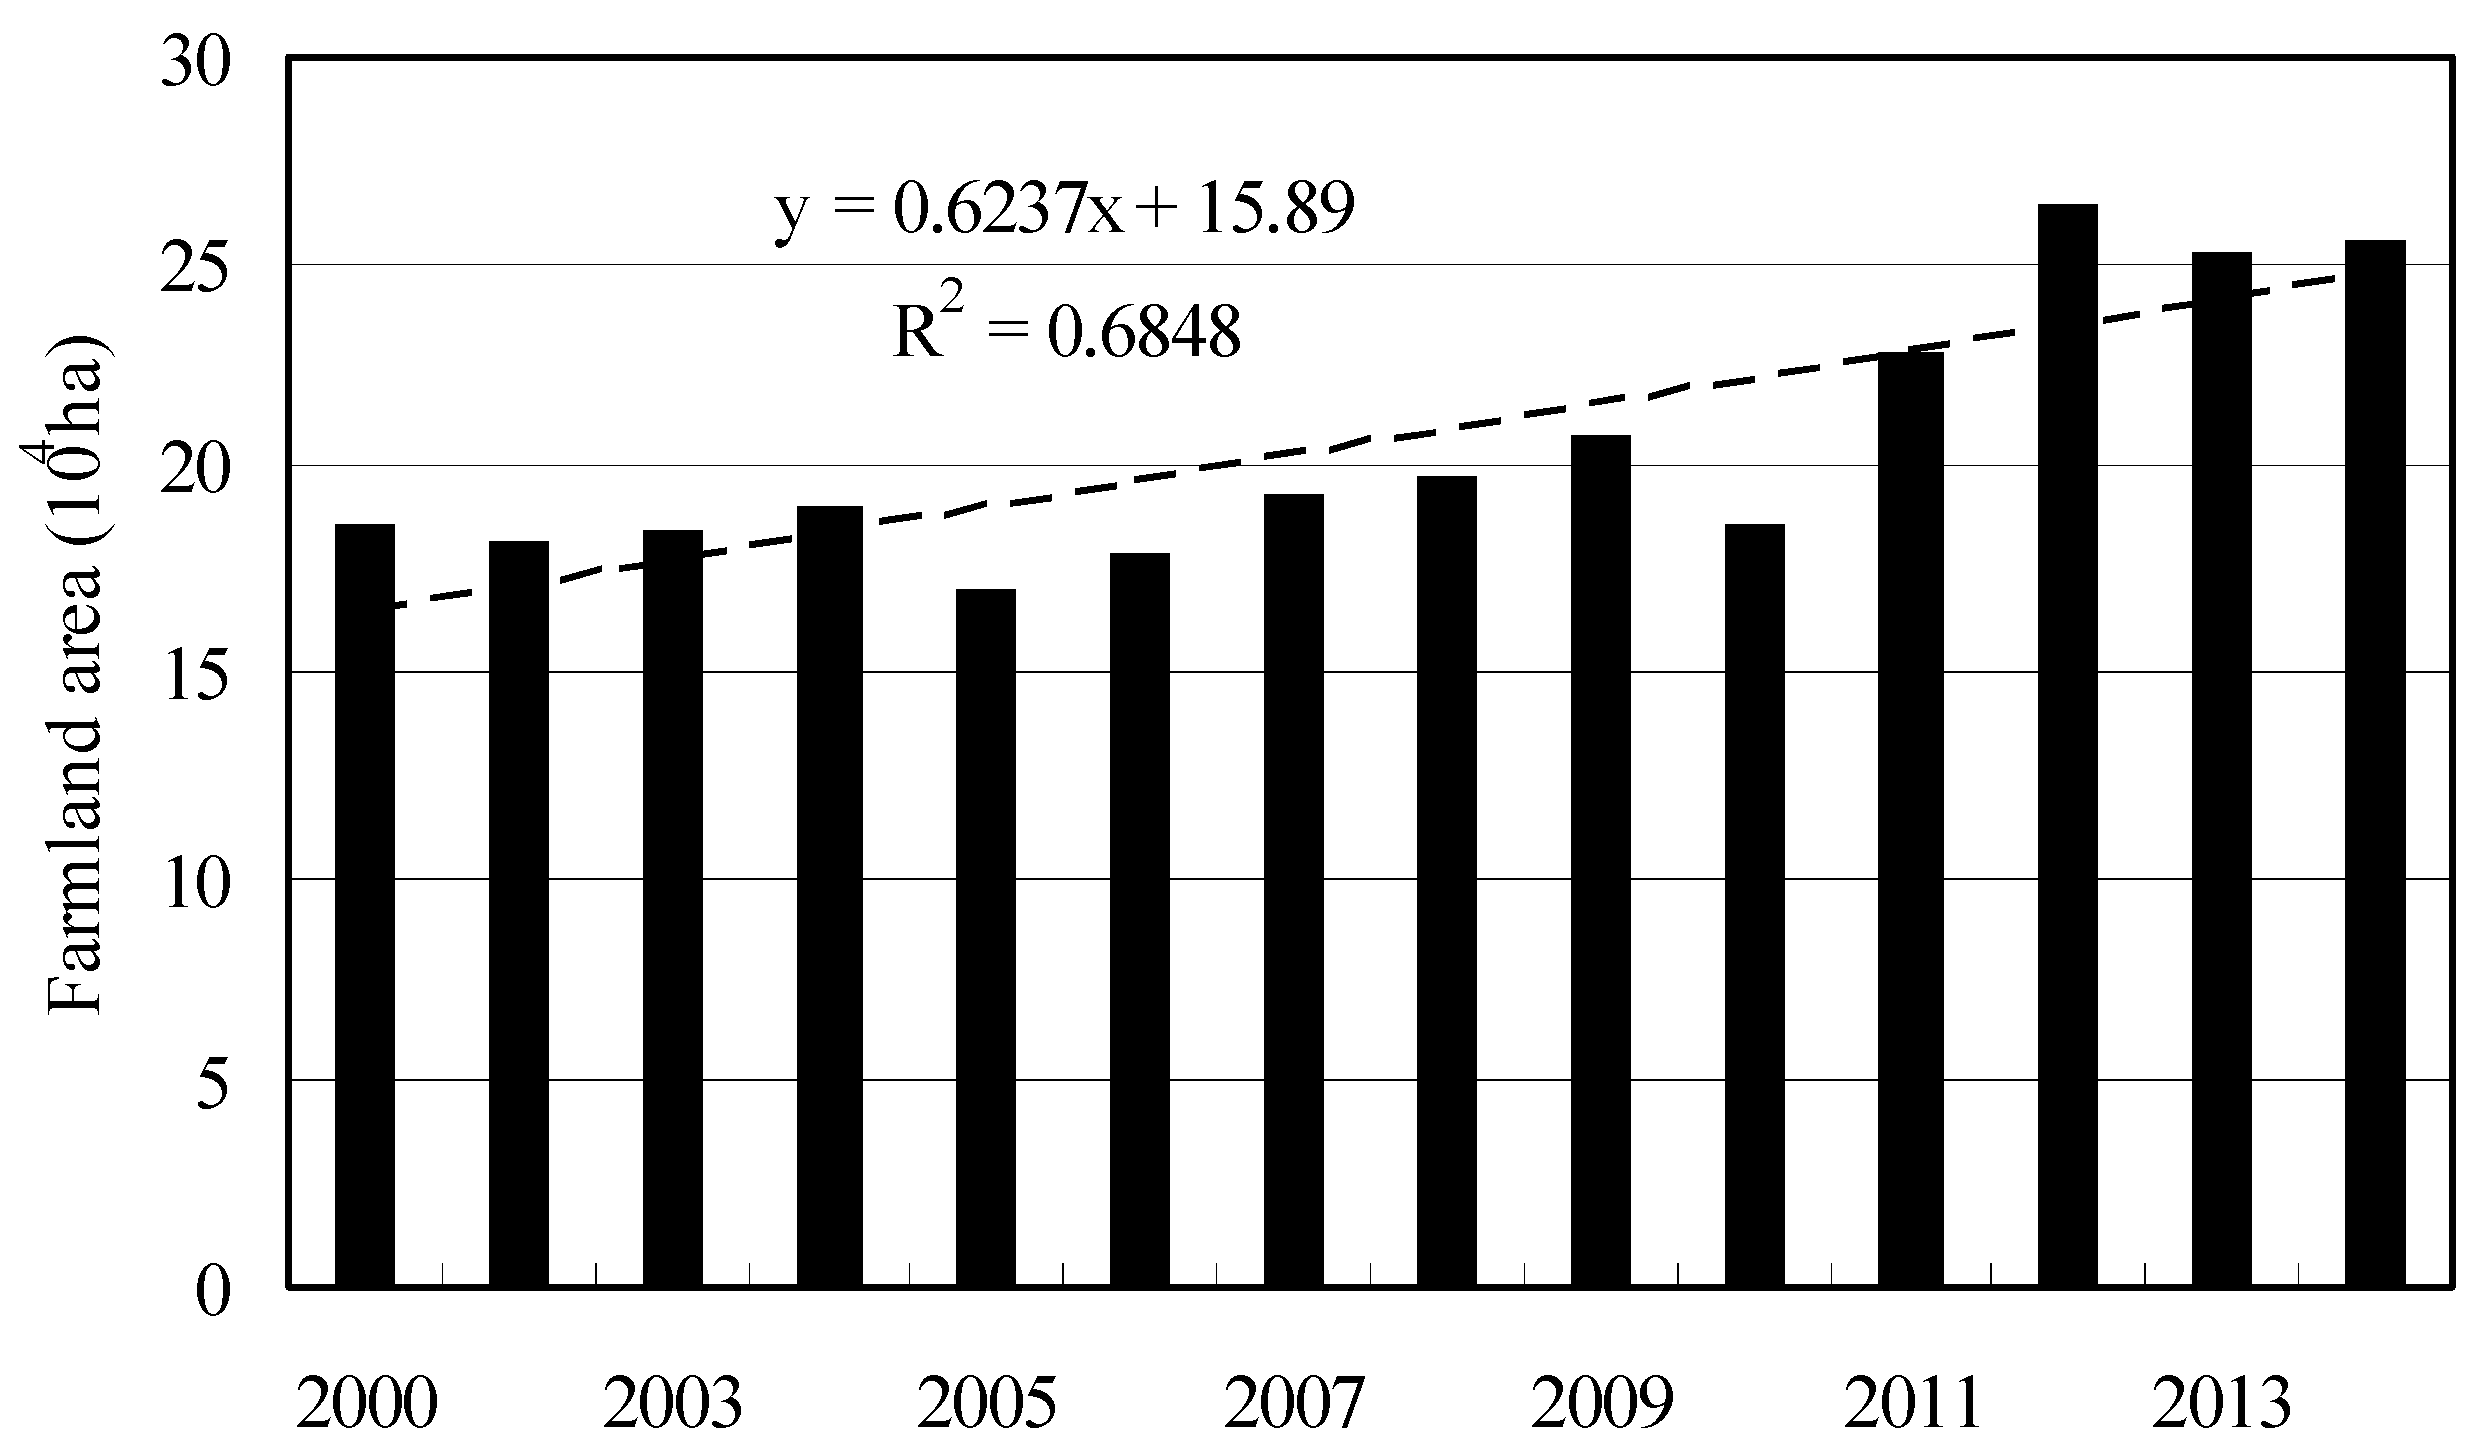
As shown in Figure 4, the total crop area increased from 18.67 × 10⁴ ha in 2000 to 25.94 × 10⁴ ha in 2014. This was in violation of the principle of prohibiting more farmland development, which was set up as part of the water saving society-building process in Zhangye City. Despite the violation, whether it led to a decrease in water use efficiency in the agricultural sector should be examined. Although the change in annual agricultural water use from 2001 to 2014 has an increasing trend, as seen in 
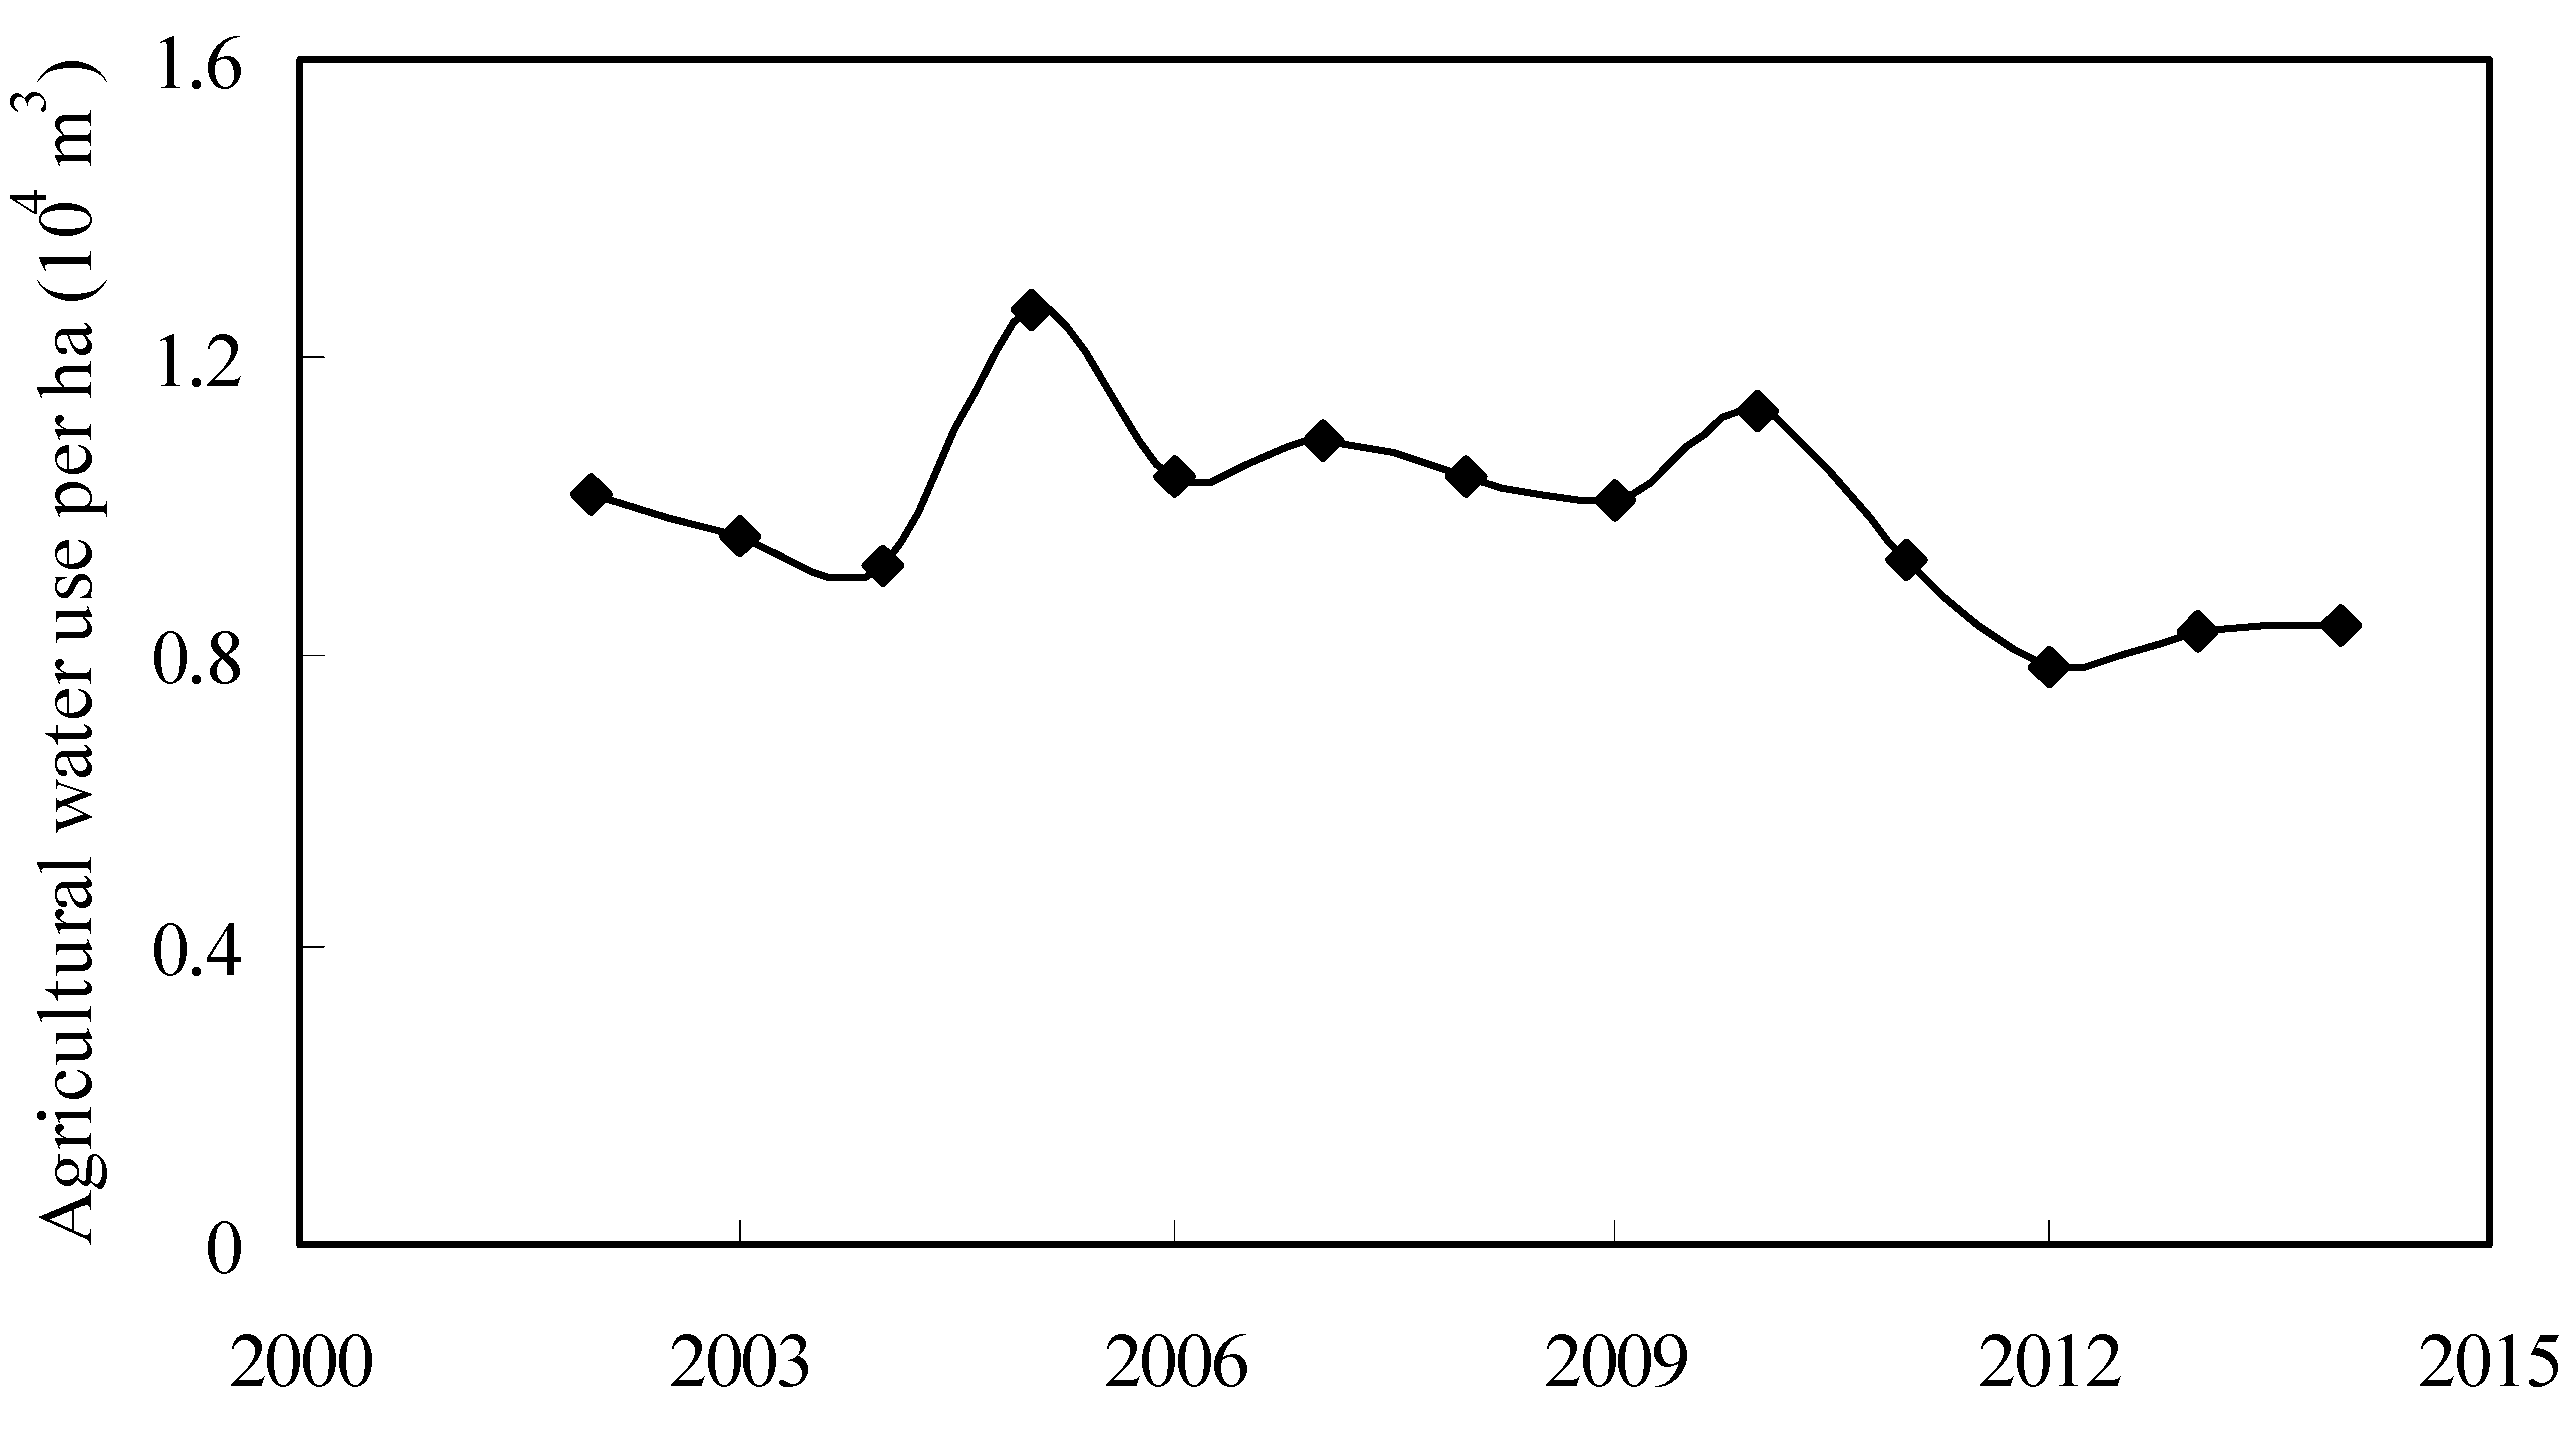
Figure 3, when divided by the total cultivation area, the agricultural water use per unit farmland appears not to have increased, as depicted in Figure 5. Indeed, the application change-point analysis on the data revealed a turning point in 2010, after which time the agricultural water use per unit area decreased. Considering that the GDP per m3 of water increased from 2.8 RMB in 2000 to 8.9 RMB in 2013, it may be asserted that the current situation shows a good balance between water conservation and economic development.
Figure 3. Changes of total and agricultural water uses in Zhangye City.
Sustainability 07 08950 g003
Figure 4. Arable land change in Zhangye City since 2000.
Sustainability 07 08950 g004
Figure 5. Variation of agricultural water use per unit cultivated land.
Sustainability 07 08950 g005
Simulations by Wu [8], who used the CGE approach for Zhangye City, showed a considerable water-saving benefit from industrial transformation when the output value of secondary and tertiary industries increases and the contribution of the planting sector to the total output value decreases. The present study demonstrated that the model prediction has not yet been realized. This serves as evidence that more actual data-based case studies should be conducted.

4.2.4. A New Dimension

On 28 March 2015, China’s top economic planning agency, the National Development and Reform Commission, and the Ministries of Foreign Affairs and Commerce, jointly released a new action plan outlining key details of Beijing’s “One Belt, One Road” initiative. Initially planned as a network of regional infrastructure projects, this latest release indicates that the scope of the “Belt and Road” initiative has expanded to become a centerpiece of both China’s foreign policy and domestic economic strategy. This initiative will include financial integration, trade liberalization, and people-to-people connectivity across the Asian continent. Since the “Belt” will run through Zhangye City, it could provide great economic stimulus to the city, which would lead to significant economic structural shift, possibly affecting water resources management in many ways. Therefore, the sustainability of Zhangye City will largely depend on the sustainability of the “One Belt, One Road” policy and the prosperity of a much larger region in the long term.

5. Conclusions

The effect of a water allocation policy was assessed across three dimensions: society, the environment, and the economy. The successes and remaining problems across these dimensions were highlighted, and the findings are summarized below.
In the societal dimension, the success was that the legal system for building a water-saving society was well established leading to the implementation of an efficient WUR system. The remaining problem is that public participation remains at the information-giving level. The WUA, which is considered the main driver for public participation in water resource management, was under-recognized by the local people. Moreover, that the current framework of WUA needs to be expanded to involve all stakeholders was pointed out.
In the environmental dimension, the most remarkable successes were the internalization of the externalities to the downstream and the restoration of the wetlands in the middle reaches.
In the economic dimension, pursuing for high water productivity served as a driver for economic structural optimization. However, despite the economic structure being well adjusted to reduce water use in theory, no significant reduction in total water use per year was seen in Zhangye City. The amount of water used by agriculture per year increased, although the agricultural sector’s economic share in the local economy significantly decreased. Nevertheless, water consumption per hectare of cultivated farmland showed a decreasing trend.
Finally, a new dimension was pointed out linking a new national strategy to the regional sustainability. Under such an overarching policy and extensive spatial scale, there will be many potential opportunities and pitfalls for the region. It will be a big challenge to both researchers and practitioners.

Acknowledgments

This work was supported by the Flagship Research Fund of Sophia University. Thanks should be given to Sophia University graduate students Olga Tyunina, Woohyun Sophia Choi, Wu Peixuan, Li Chenyu, and Gao Nan for their contributions to the fieldwork in Zhangye City. We would also like to thank Li Xin, Ma Minguo and Wang Jian from the Chinese Academy of Sciences for their generous support. We also appreciate the anonymous reviewers for their professional comments, which improved the manuscript.

Conflicts of Interest

The author declares no conflict of interest.

References

  1. Rock, M.T. Freshwater use, freshwater scarcity, and socioeconomic development. J. Environ. Dev. 1998, 7, 278–301. [Google Scholar] [CrossRef]
  2. Goklany, I.M. Comparing 20th Century Trends in U.S. and Global Agricultural Water and Land Use. Water Int. 2002, 27, 321–329. [Google Scholar] [CrossRef]
  3. Gleick, P. Water Use. Annu. Rev. Environ. Resour. 2003, 28, 275–314. [Google Scholar] [CrossRef]
  4. Rosegrant, M.W.; Ringler, C.; McKinney, D.C.; Cai, X.; Keller, A.; Donoso, G. Integrated economic-hydrologic water modelling at the basin scale: The Maipo River Basin. Agric. Econ. 2000, 24, 33–46. [Google Scholar]
  5. Heinz, I.; Pulido-Velazquez, M.; Lund, J.R.; Andreu, J. Hydro-economic Modeling in River Basin Management: Implications and Applications for the European Water Framework Directive. Water Resour. Manag. 2007, 21, 1103–1125. [Google Scholar] [CrossRef]
  6. Zhou, S.; Huang, Y.; Yu, B.; Wang, G. Effects of human activities on the eco-environment in the middle Heihe River Basin based on an extended environmental Kuznets curve model. Ecol. Eng. 2015, 76, 14–26. [Google Scholar] [CrossRef]
  7. Alejandro, C.M.; Hewings, G.J.D. Water price and water sectoral reallocation in Andalusia. A computable general equilibrium approach. Environ. Econ. 2011, 2, 17–27. [Google Scholar]
  8. Wu, F.; Zhan, J.; Zhang, Q.; Sun, Z.; Wang, Z. Evaluating Impacts of Industrial Transformation on Water Consumption in the Heihe River Basin of Northwest China. Sustainability 2014, 6, 8283–8296. [Google Scholar] [CrossRef]
  9. Fen, Q.; Chen, G.D.; Endo, K.N. Towards sustainable development of the environmentally degraded River Heihe basin, China. Hydrol. Sci. J. 2001, 46, 647–658. [Google Scholar]
  10. Zhang, J.; Zhang, F.; Zhang, L.; Wang, W. Transaction costs in water markets in the Heihe River Basin in northwest China. Int. J. Water Resour. Dev. 2009, 25, 95–105. [Google Scholar] [CrossRef]
  11. Ji, X.; Kang, E.; Chen, R.; Zhao, W.; Xiao, S.; Jin, B. Analysis of Water Resources Supply and Demand and Security of Water Resources Development in Irrigation Regions of the Middle Reaches of the Heihe River Basin, Northwest China. Agric. Sci. China 2006, 5, 130–140. [Google Scholar] [CrossRef]
  12. Tian, W.; Li, X.; Cheng, G.D.; Wang, X.S.; Hu, B.X. Coupling a groundwater model with a land surface model to improve water and energy cycle simulation. Hydrol. Earth Syst. Sci. 2012, 16, 4707–4723. [Google Scholar] [CrossRef]
  13. Qin, D.; Qian, Y.; Han, L.; Wang, Z.; Li, C.; Zhao, Z. Assessing impact of irrigation water on groundwater recharge and quality in arid environment using CFCs, tritium and stable isotopes, in the Zhangye Basin, Northwest China. J. Hydrol. 2011, 405, 194–208. [Google Scholar] [CrossRef]
  14. Zhang, L.; Heerink, N.; Dries, L.; Shi, X. Water users associations and irrigation water productivity in northern China. Ecol. Econ. 2013, 95, 128–136. [Google Scholar] [CrossRef]
  15. Lu, L.; Li, X.; Cheng, G.D. Landscape evolution in the middle Heihe River Basin of north-west China during the last decade. J. Arid Environ. 2003, 53, 395–408. [Google Scholar] [CrossRef]
  16. Qi, S.; Luo, F. Land-use change and its environmental impact in the Heihe River Basin, arid northwestern China. Environ. Geol. 2006, 50, 535–540. [Google Scholar] [CrossRef]
  17. Huang, G.W. Validation of Late Season Cornstalk Nitrate Test under Different Natural and Social Environments for Better Fertilizer Management in China. Orient. J. Chem. 2013, 29, 1381–1389. [Google Scholar] [CrossRef]
  18. Chen, G.D.; Li, X.; Zhao, W.; Xu, Z.; Feng, Q.; Xiao, S.; Xiao, H. Integrated study of the water-ecosystem-economy in the Heihe River Basin. Natl. Sci. Rev. 2014, 1, 413–428. [Google Scholar] [CrossRef]
  19. World Bank. Expanding the Measure of Wealth: Indicators of Environmentally Sustainable Development; World Bank: Washington, DC, USA, 1997. [Google Scholar]
  20. Rawski, T.G.; Xiao, W. Round table on Chinese economic statistics introduction. China Econ. Rev. 2001, 12, 298–302. [Google Scholar] [CrossRef]
  21. Holz, C. Fast, Clear and Accurate: How reliable are Chinese output and economic growth statistics. China Q. 2003, 173, 122–163. [Google Scholar] [CrossRef]
  22. Lequiller, F.; Blades, D. China’s National Accounts, Understanding National Accounts; OECD: Paris, France, 2007; pp. 365–382. [Google Scholar]
  23. Curtis, C.C.; Mark, N. Business Cycles, Consumption and Risk-Sharing: How Different Is China? NBER Working Paper No. 16154; National Bureau of Economic Research: Cambridge, MA, USA, 2010; Available online: http://www.nber.org/papers/w16154 (accessed on 1 May 2015).
  24. Marton, A.M. China’s Spatial Development: Restless landscapes in the Lower Yangzi Delta; Routledge: London, UK, 2000. [Google Scholar]
  25. Ge, Y.; Li, X.; Tian, W.; Zhang, Y.; Wang, W.; Hu, X. The impacts of water delivery on artificial hydrological circulation system of the middle reaches of the Heihe River Basin. Adv. Earth Sci. 2014, 29, 285–294. (In Chinese) [Google Scholar]
  26. Chen, L.; Meng, H.; Liu, J. Wetland protection in the Zhanye City: Problems and countermeasures. Gansu Sci. Technol. 2013, 29, 1–3. (In Chinese) [Google Scholar]
  27. Zhang, H.; Meng, H.; Liu, X.; Zhao, W.; Wang, X. Vegetation characteristics and ecological restoration technology of typical degradation wetlands in the middle of Heihe River Basin, Zhangye City of Gansu Province. Wetl. Sci. 2012, 10, 194–199. (In Chinese) [Google Scholar]
  28. Jiang, X.; Liu, C. The response of vegetation to water transport in the lower reaches of the Heihe River. Acta Geogr. Sin. 2009, 64, 791–797. [Google Scholar]
  29. Wang, Y.; Qi, F.; Si, J.; Su, Y.; Chang, Z.; Xi, H. The changes of vegetation cover in Ejina Oasis based on water resources redistribution in Heihe River. Environ. Earth Sci. 2011, 64, 1965–1973. [Google Scholar]
  30. Wang, P.; Yu, J.; Zhang, Y.; Fu, G.; Min, L.; Ao, F. Impacts of environmental flow controls on the water table and groundwater chemistry in the Ejina Delta, northwestern China. Environ. Earth Sci. 2011, 64, 15–24. [Google Scholar] [CrossRef]
  31. Wang, Y.; Roderick, M.L.; Shen, Y.; Sun, F. Attribution of satellite observed vegetation trends in a hyper-arid region of the Heihe River Basin, Central Asia. Hydrol. Earth Syst. Sci. Discuss. 2014, 11, 1529–1554. [Google Scholar] [CrossRef]
  32. Chang, Y.; Bao, D.; Bao, Y. Satellite monitoring of the ecological environment recovery effect in the Heihe River downstream region for the last 11 Years. Procedia Environ. Sci. 2011, 10, 2385–2392. [Google Scholar] [CrossRef]
  33. Glantz, M.H.; Rubinstein, A.Z.; Zonn, I. Tragedy in the Aral Sea basin: Looking back to plan ahead? Glob. Environ. Chang. 1993, 3, 174–198. [Google Scholar] [CrossRef]
  34. Su, Y.Z.; Zhang, Z.H.; Yang, R. Amount of irrigation and nitrogen application for maize grown on sandy farmland in the marginal oasis in the middle of Heihe River Basin. Acta Agron. Sin. 2007, 33, 2007–2015. [Google Scholar]
  35. Yang, R.; Liu, W. Nitrate contamination of groundwater in an agroecosystem in Zhangye Oasis, Northwest China. Environ. Earth Sci. 2010, 61, 123–129. [Google Scholar] [CrossRef]
  36. Huang, G.W. Would use of contaminated water for irrigation lead to more accumulation of nitrate in crops? Environ. Pollut. 2013, 2, 1–9. [Google Scholar] [CrossRef]
  37. Shi, M.; Wang, L.; Wang, X. A study on changes and driving factors of agricultural water supply and demand in Zhangye after water reallocation of the Heihe River. Resources. Sci. 2011, 33, 1489–1497. [Google Scholar]
  38. Liu, S. Water productivity per cubic meter of water in Zhangye City. Water Sav. Irrig. 2013, 17, 29–30. (In Chinese) [Google Scholar]
  39. Huang, G.W. Does a Kuznets Curve Apply to Flood Fatality?—A Holistic Study for China and Japan. Nat. Hazards 2014, 71, 2029–2042. [Google Scholar] [CrossRef]

