Article

The Hydro-Economic Interdependency of Cities: Virtual Water Connections of the Phoenix, Arizona Metropolitan Area

by
Richard R. Rushforth
and
Benjamin L. Ruddell
*,†
Fulton Schools of Engineering, Arizona State University, Tempe, AZ 85281, USA
*
Author to whom correspondence should be addressed.
These authors contributed equally to this work.
Sustainability 2015, 7(7), 8522-8547; https://doi.org/10.3390/su7078522
Submission received: 24 March 2015 / Revised: 24 June 2015 / Accepted: 24 June 2015 / Published: 30 June 2015
(This article belongs to the Special Issue Water Footprints and Sustainable Water Allocation)

Abstract

:
Water footprinting has revealed hydro-economic interdependencies between distant global geographies via trade, especially of agricultural and manufactured goods. However, for metropolitan areas, trade not only entails commodity flows at many scales from intra-municipal to global, but also substantial intra-metropolitan flows of the skilled labor that is essential to a city’s high-value economy. Virtual water flows between municipalities are directly relevant for municipal water supply policy and infrastructure investment because they quantify the hydro-economic dependency between neighboring municipalities. These municipalities share a physical water supply and also place demands on their neighbors’ water supplies by outsourcing labor and commodity production outside the municipal and water supply system boundary to the metropolitan area. Metropolitan area communities span dense urban cores to fringe agricultural towns, spanning a wide range of the US hydro-economy. This study quantifies water footprints and virtual water flows of the complete economy of the Phoenix Metropolitan Area’s municipalities. A novel approach utilized journey to work data to estimate virtual water flows embedded in labor. Commodities dominate virtual water flows at all scales of analysis, however labor is shown to be important for intra-metropolitan virtual water flows. This is the first detailed water footprint analysis of Phoenix, an important city in a water-scarce region. This study establishes a hydro-economic typology for communities to define several niche roles and decision making points of view. This study’s findings can be used to classify communities with respect to their relative roles, and to benchmark future improvements in water sustainability for all types of communities. More importantly, these findings motivate cooperative approaches to intra-metropolitan water supply policy that recognize the hydro-economic interdependence of these municipalities and their shared interest in ensuring a sustainable and resilient hydro-economy for all members of the metropolitan area.

1. Introduction

Cities are hotspots of global environmental change and economic consumption [1,2]. Groups of co-located cities form metropolitan areas contain varying types of land uses that range from preserved natural lands; to rural and agricultural land uses; to highly urbanized forms, which are major hubs in the world city network [3,4,5]. Distinct land uses in metropolitan areas develop as a response to competitive pressures and market forces [6] that shape the regional economy and the available niches for economic production and value creation [7]. As economic growth within metropolitan areas occurs, cities cooperate via trade, creating positive feedback loops that result in sub-regional growth and the formation of large, polynucleated conurbations [8]. Taken as an aggregate unit, large metropolitan areas are networked economies that share local resources in order to create a competitive advantage and a valuable economic niche within regional, national and global economies.
Resource flows within metropolitan areas rely on multiple independently managed, yet interconnected infrastructure systems such as electric power, telecommunications, transportation, water supply, law, banking and emergency services, and “locally” sourced agriculture [9,10]. However, because individual municipalities may manage only parts of shared infrastructure systems there is a mismatch between the hydro-economic system’s boundaries and governance boundaries. For water resources in particular, many entities (municipalities, major self-supplied industries, and electric power utilities) may share an aquifer, water conveyance system, or watershed, thus necessitating the creation of regional water policies and plans to govern shared water resources [11,12,13]. While water management plans result in coordination and cooperation between stakeholders, in the absence of such regional plans, competition for water may yield winners and losers with more powerful and wealthy entities securing water rights and infrastructure for economic development, leaving the losers with water supply problems and constraints. Engineering, game theory, policy, and economic research have examined this problem from the perspective of managing the physical water resources and infrastructure and designing incentives for mutually beneficial cooperation [14,15]. However, this type of examination only reveals reliance on rival and frequently non-excludable [16,17] physical water resources, which are inputs to a city’s urban metabolism [18].
While direct water sharing agreements and water policies reflect formal long-term legal and political agreements, virtual water flows reflect short-term voluntary economic conditions, such as competitive and locational advantages. Both the long-term legal agreements about “real” physical water resources, and the short-term trade agreements that imply virtual water cooperation and virtual water transfers, have hydro-economic impacts on these communities such as added or avoided water infrastructure, investment, and operating costs, or economic opportunities. These virtual water dependencies become directly relevant in metropolitan areas where physical water supplies are scarce and constrain economic growth. In this case, access to locally-sourced virtual water joins access to physical water as a strategically important consideration for hydro-economic sustainability and resilience.
Virtual water is an indirect urban metabolism component that results from the consumption (input) and production (output) of goods and services and, at the metropolitan area scale, labor flows [19]. Virtual water inflows are partially a result of population-dependent food and services consumption by the residential (R) sector while industrial and commercial (IC) consumption is related to the number of establishments of a particular industry and the size and composition of the labor force that works in each industry [20]. By contrast, IC and R virtual water outflows are related to economic size, structure, workforce population, and commuting patterns. Such factors create distinct cities that are an assemblage of IC, bedroom, and agricultural land uses that are served by one or several potable and non-potable water supply systems. Therefore, some municipalities are net virtual water importers that indirectly augment water supplies through intra-metropolitan trade and others are net exports that indirectly augment their neighbor’s water supply, which is highly relevant to urban planning and water supply policies when two municipal entities are rivals for access to shared physical water resources and have strong intra-metropolitan economic ties.
In this study, virtual water flows were estimated for the Phoenix metropolitan area (PMA) at three scales. Previous city-level studies have focused on virtual water inflows arising from economic consumption by residents and at the national and global scales [21,22,23,24,25], but local and national virtual water outflows resulting from economic production are equally important, and furthermore are directly proportionate to a city’s need to invest in water supply infrastructure and water rights. Virtual water flow (1) into and (2) out of the PMA was calculated using a commodity flow approach and (3) intra-metropolitan area virtual water flows were calculated using commodity and labor flows. Both goods-producing and service economies are utilized to estimate the water footprint of PMA municipalities (Figure 1). The addition of intra-metropolitan flows and of the urban labor market are contributions by this paper to the virtual water literature, and forms the basis for estimation of sub-municipal industrial, commercial, and residential footprints. The methods and data employed also allow us to identify regional and national virtual water flows for the PMA and its constituent municipalities. This paper is the first paper to comprehensively analyze water footprints and virtual water flows within a municipality in metropolitan area, intra-metropolitan area flows, and national scale flows simultaneously, thus contributing novel methods to the virtual water literature.
This paper documents urban water footprint balances for the Phoenix Metropolitan Area. In addition, this paper addressees several fundamental urban water footprint [26] and teleconnection questions at the most relevant scales spanning the national to the local scale [27,28]. At the national scale, we wish to understand which locations within the United States depend on the PMA’s water resources and, conversely, on what water resources the PMA relies. Does the PMA primarily rely on in-state, regional, or national sources? We wish to understand which commodities are responsible for the bulk of the virtual water inflows and outflows from the metropolitan area. We wish to understand intra-PMA virtual water dependencies, and distinguish between commodity and labor trade. How circular are the virtual water flows within the PMA and within each municipality, and what fraction of the total urban water footprint does the intra-metropolitan virtual water flow represent? We wish to understand which municipalities are net importers and exporters of virtual water from their immediate neighbors, and develop a typology for the hydro-economic role of each community within the hydro-economy. Finally, in order to inform cooperation at the municipal scale on water supply and infrastructure policy, we contextualize virtual water flows with respect to the size of each municipality’s physical water supply infrastructure; in other words, we relate the virtual water flow to the urban water metabolism. This will demonstrate how much larger (or smaller) each municipality’s physical infrastructure and water right would need to be if not for intra-metropolitan virtual water connections with trading partners that share the local physical water supply.

2. Calculating Virtual Water Flows for the Phoenix Metropolitan Area
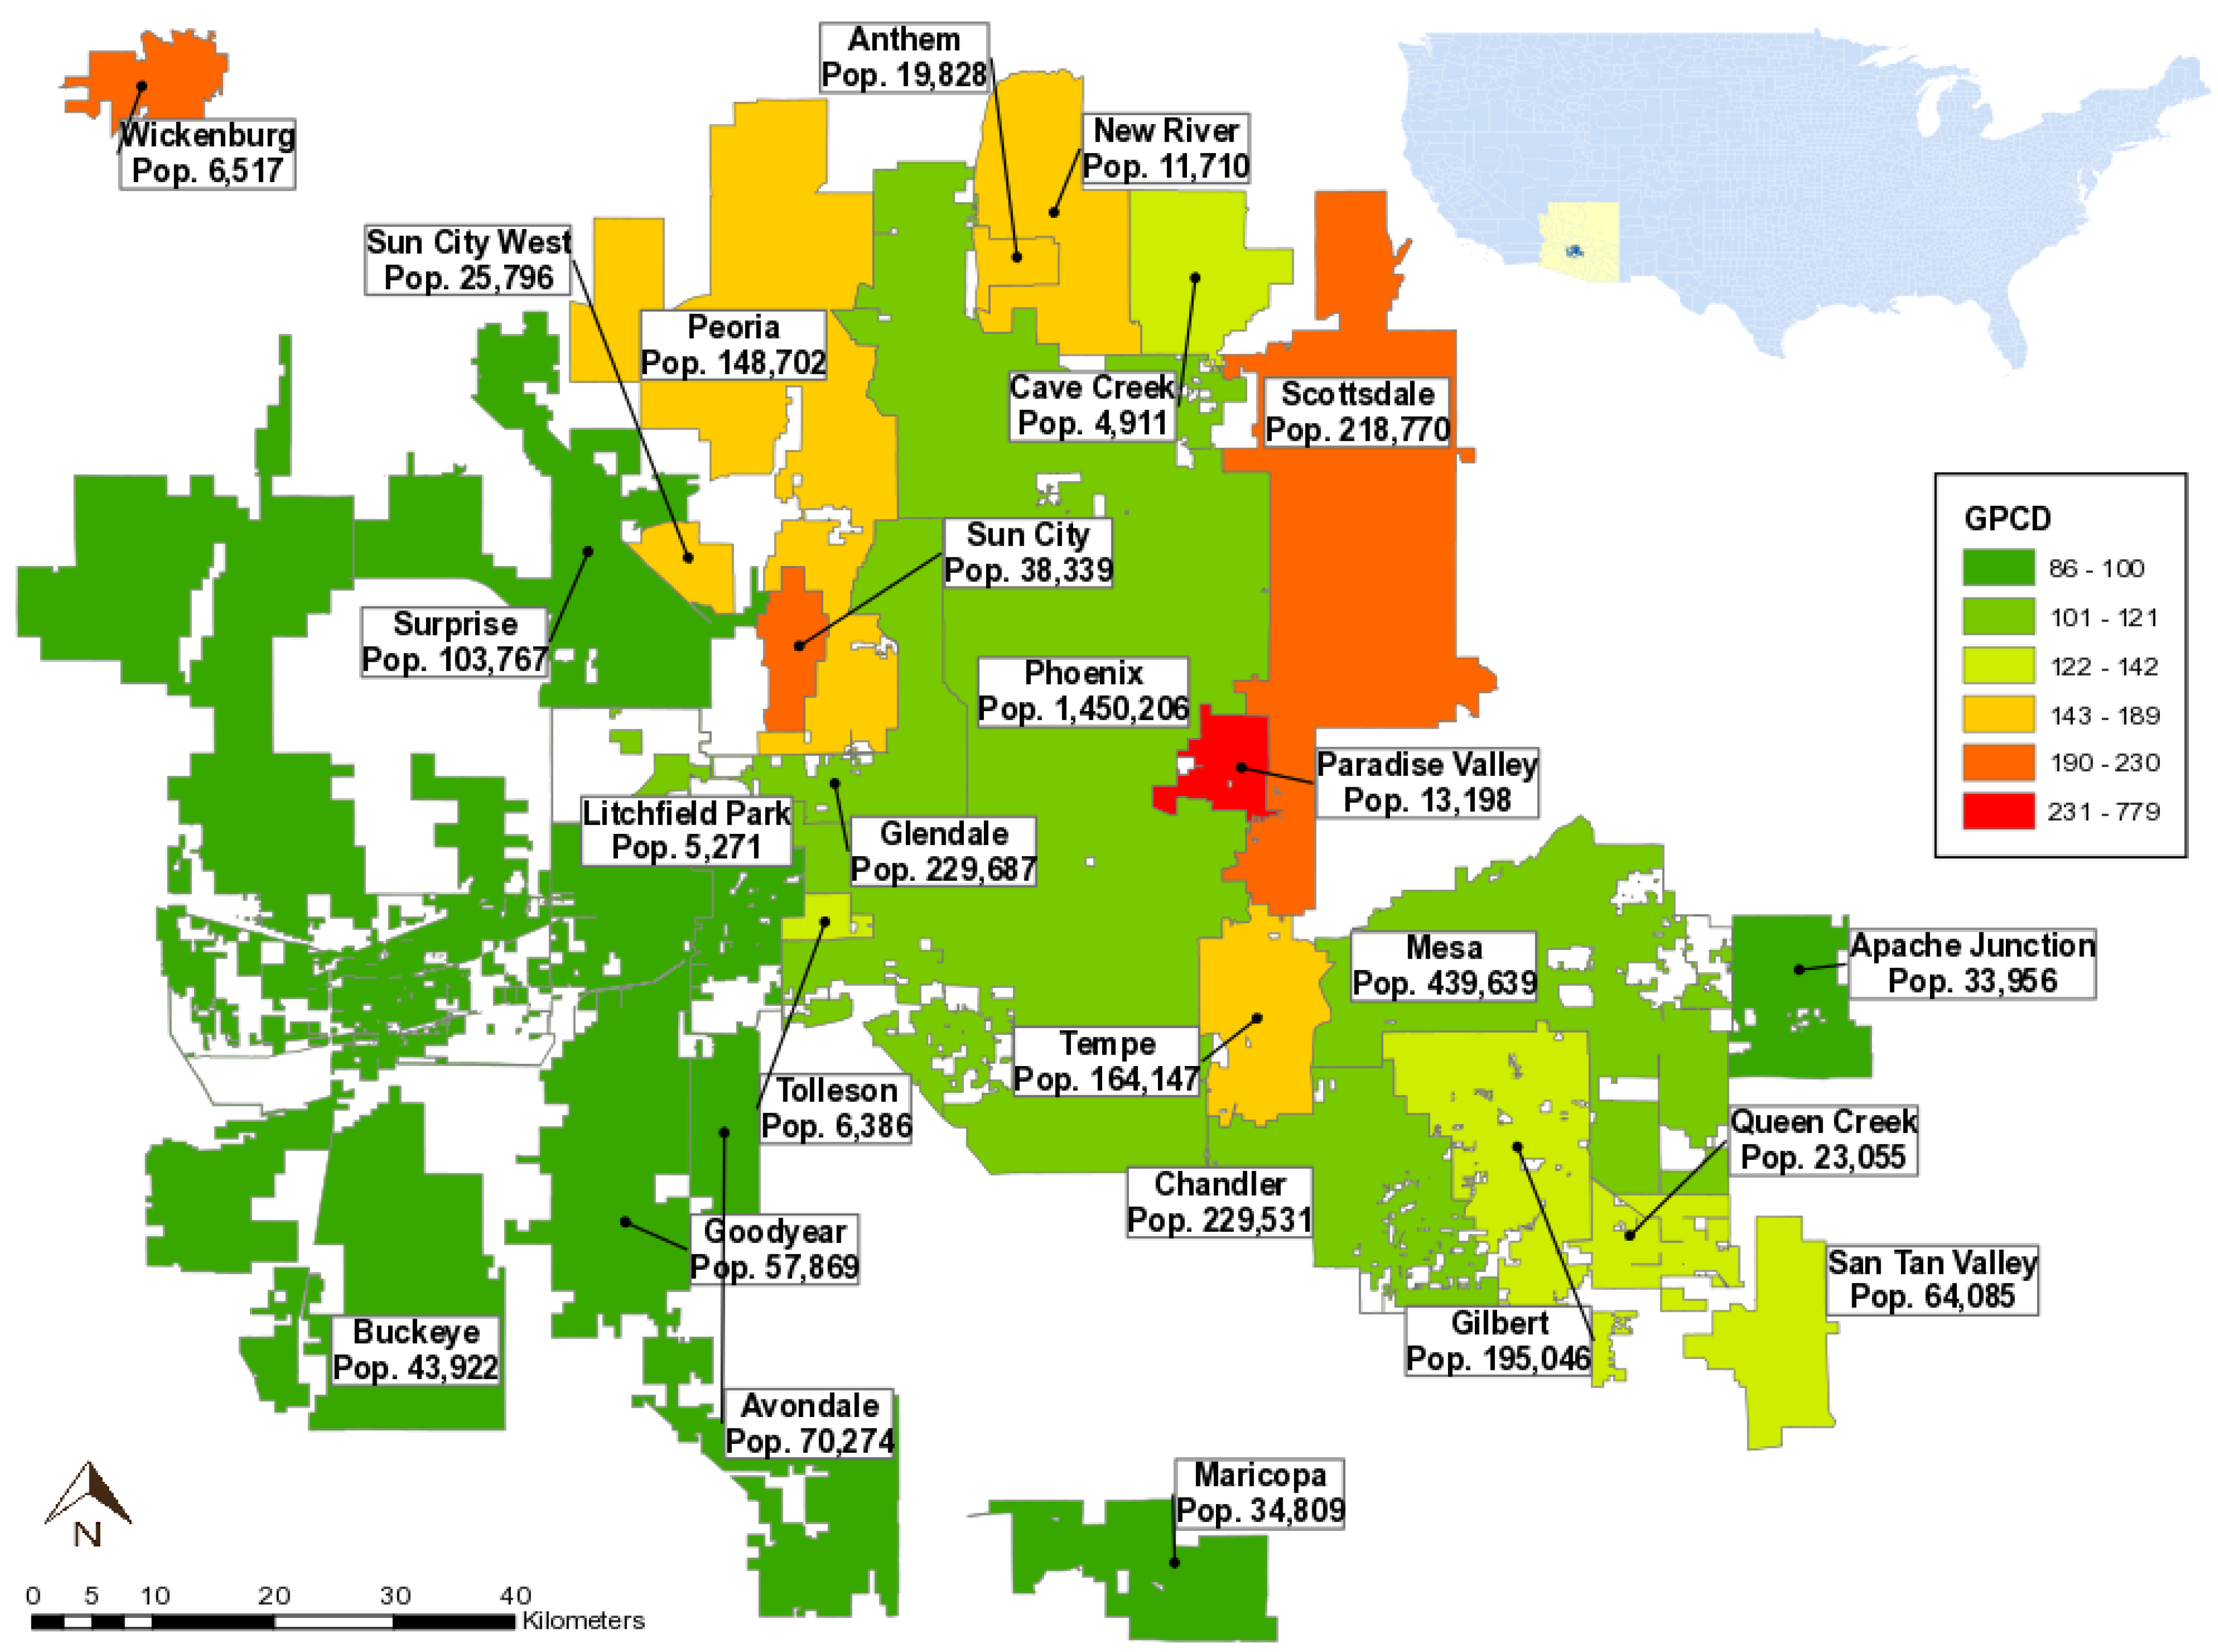
2.1. Study Area

The PMA was used for this study because it is as a major metropolitan area with substantial water infrastructure and water rights challenges [29]. It is located in Central Arizona and has a population of 4.19 million people [30]. Due to the availability of utility-level water data, the study area was constrained to 25 municipalities (For this paper, municipality is used to refer to a city and its management area and the term city is used to refer to a non-specific urban area) located in the conurbation surrounding the core municipality of Phoenix, which have a combined population of 3.69 million people (Figure 1). The urban “core” cities in the PMA are Phoenix, Mesa, Scottsdale and Tempe [31]. Although Phoenix is the central municipality, it is a suburban, low-density municipality that developed after World War II in the automotive era.
Due to the large population of the PMA and the local arid climate, the physical availability of water supplies and legal assurance of water rights are tight constraints on economic and residential growth. This problem is more acute for newer suburban municipalities that lack historic water rights, but also a challenge for older central municipalities with large aggregate water demand. Agricultural lands that surround the PMA face development pressures from expanding suburban municipalities. The major physical water resources for the PMA are the Colorado River via the Central Arizona Project (CAP); the Salt and Verde rivers, via the Salt River Project (SRP); and substantial, but nonrenewable groundwater underlying the PMA. The core PMA municipalities have greater access to surface water (the CAP and SRP systems), while smaller municipalities on the outskirts of the PMA are more dependent on groundwater [32], although residential water consumption trends [33] are postively correlated with income [34,35,36]. Scarce water resources coupled with precipitous growth has placed strains on the water supply system and created competition between PMA municipalities and economic sectors (industrial/commercial, residential, utilities, etc.) to secure water resources for future growth, making the PMA a suitable geography for hydro-economic studies.

2.2. Virtual Water Flow Calculation for Commodities at Municipal, County, and National Scales

Virtual water inflows and outflows were derived from commodity flows into and out of the PMA from the Freight Analysis Framework version 3 (FAF3) database, which divides the United States into 123 domestic freight zones, referred to in this paper as FAF zones [37]. The database contains data on the FAF zone of origin (O) and destination (D) for 43 commodities. Commodities (C) are a more detailed categorization according to the Standard Classification of Transported Goods (SCTG), each of which fits underneath a water use category (i) corresponding to the United States Geological Survey (USGS) water use categories [38,39]. First, commodity production was summed by economic supercategory i and origin FAF zone O to arrive at total commodity production C for the FAF zone.
Figure 1. The map above shows the population of the PMA municipalities included in the system boundaries along with residential delivers in gallons per capita day (GPCD) for each municipality. Residential water consumption in the PMA is positively correlated with income. The inset in the upper right-hand corner shows the position of the PMA in Arizona within the United States.
Sustainability 07 08522 g001
C i , O = C , O C i , C , O D   [tons]
Next, the commodity production data per FAF origin zone was disaggregated to the county-level using production and attraction criteria for each commodity (Equation (2)). In this notation, we use k to denote an individual county, which is a portion of a corresponding FAF zone. Production and attraction criteria vary by commodity according to the factor inputs necessary for production [40]. Raw water use data at the county scale is aggregated to yield FAF zone water use data, or is disaggregated to municipalities using regional shares (RS) of employment [41], agriculture acreage estimates from the number of agricultural operations [42], and population [33] for each municipality within the county. A similar process is used to disaggregate economic data at the FAF zone scale to counties and municipalities. RS factors were checked so that k R S O , k = 1 to ensure that mass is conserved. Disaggregation transforms the 123 FAF zones into 3,143 US counties, and then to 24 municipalities surrounding the city of Phoenix. The production of commodity category C within supercategory i by county k is apportioned relative to the county’s fraction of the FAF zone’s production of all commodities in supercategory i.
C i , k = C i , O ×   R S i , O , k   [tons]
To determine the average per ton blue water content for each economic sector at the county-level, sector-level water consumption was divided by the result of Equation (2).
B W C i , k =   U i , k / C i , k   [ m 3 / ton ]
Since each B W C i , k value is a county associated with its FAF zone, we can divide the county-level blue water content by the R S i , O k factor and sum by each FAF origin to arrive at the average per ton blue water content of commodity production at the FAF zone scale.
B W C i , O =   O B W C i , k / R S i , O , k   [ m 3 / ton ]
After calculating the average blue water content of commodity production within each economic sector in each FAF zone, the virtual water flow between FAF zone origin and destinations are calculated from the original origin-destination commodity flow data.
V W i , O D = C i , C , O D   ×   B W C i , O   [ m 3 ]
These virtual water flows can be disaggregated to the more detailed commodity level C, from the more highly aggregated USGS water use database categories i. Alternatively, for virtual water flows associated with another type of good or service such as labor L, that subscript is substituted for C.
V W C , O D = V W i , O D   ×   ( C i , C , O D / i , O C i , C , O D )   [ m 3 ]
FAF zone destinations were disaggregated to the county-level using each county’s relative proportion of the destination FAF zone’s population p ( R S p , D , k ) or the relative proportion of the origin FAF zone’s commodity outflow in category C ( R S C , D , k ). Again, RS factors were checked so that D R S D , k = 1   to ensure that mass is conserved.
V W C , k D = V W C , O D ×   R S C , O , k   [ m 3 ]
V W C , O k   = V W C , O D   ×   R S p , D , k   [ m 3 ]
The virtual water flow from one county k to another county l is disaggregated from FAF zone commodity flows.
V W C , k l = V W C , k D ×   R S p , D , k   [ m 3 ]
The flow between one municipality m and a FAF zone is an intermediary calculation required before computing flows between counties and municipalities.x
V W C , m D = V W C , O D   × R S C , O , m   [ m 3 ]
V W C , O m = V W C , O D   × R S p , D , m   [ m 3 ]
The virtual water flow between one municipality m and a county k is a portion of the flow between the municipality and that county’s FAF zone O.
V W C , m k = V W C , m O   × R S p , O , k   [ m 3 ]
V W C , k m = V W C , O m   × R S C , O , m   [ m 3 ]
The outflow (or equally inflow) from one municipality m to another n within a FAF zone O is similar. Equation (14) also accommodates circular flows of commodities within a municipality.
V W C , m n = V W C , m O   × R S p , O , n   [ m 3 ]
This derivation yields origin-destination virtual water flows between FAF zones, counties, municipalities, and combinations of these scales by commodity category, from the source data concerning commodity trade and water use in each economic zone.
Notably, when this algorithm is applied all geographies within the FAF3 database, total virtual flows are constrained by USGS water withdrawal data [43], ensuring that virtual water is not over allocated beyond actual withdrawals. This is methodologically important because it highlights the large differences in per capita water footprint that are a function of geography and climate. This method therefore yields a footprint that is accurate for both comparative benchmarking and also absolute hydrological and economic measurement purposes. Although there are many potential production and attraction factors [44,45,46,47], this paper uses the regional shares of employment, agriculture, and livestock counts as production factors and population as an attraction factor.

2.3. Virtual Water Flow Calculation for Labor at Intra-Metropolitan Scales

Intra-metropolitan area virtual water flows from the movement of labor were calculated on the basis of residential (per municipality, excluding industrial/commercial) GPCD. This method divides the population of each municipality into three groups: a non-workforce population and two types of workforce population, workers that live and work in the same municipality and workers that commute to other cities for employment. Virtual water flows from the movement of labor were used as a proxy for understanding the virtual water flows of the service economy because 71% of PMA employment is in the service sector [48].
Within the study area, a worker living in one municipality could hypothetically work in any of the other 24 PMA municipalities. However, in actuality, the number of possible cities to which a worker could commute is constrained by time, distance, and the presence of jobs. Using these assumptions, and actual commute distance, travel time, journey to work statistics, and commuting flows between each municipality in the PMA, labor flows were estimated using a network-based commuting flow model using the distance between cities as a deterrence to commuting (Supplementary Information, Table S1, Figure S1) [33,41,48,49,50,51]. If cities shared borders, the commuting distance was assumed to be negligible. The flow of workers between PMA municipalities was constrained by daytime population change data, ensuring that estimated commuting flows followed observed data. Commuting flow results are presented in the Supplemental Information (Table S2, Figure S2). We recognize that there are a multitude of methods to estimate commuting flows and the approach taken in this paper could be substantiated or improved with real, observed commuting data from regional transit authorities.
After, the mobile population and commute destinations were determined for each municipality, intra-metropolitan and intra-municipal virtual water flows were calculated using municipality-specific residential GPCD (Figure 1) [52,53,54,55,56,57,58,59,60,61,62,63,64,65,66,67,68,69,70,71,72,73,74] and the commuting population between each PMA municipality, including inflows ( V L , n m ), outflows ( V L , m n ), and circular flows V L , m m .

2.4. Disaggregation by Scale and Boundary of a Municipality’s Water Footprint

Using the commodity (2.2) and labor (2.3) approaches to calculating virtual water flows, a net water footprint was calculated for each PMA municipality and for the metropolitan area using the Embedded Resources Accounting (ERA) framework [16,17]. Used in this context, ERA is a minor variation on the standard Water Footprint Assessment (WFA) [75] notation that accounts for a hierarchy of nested boundary conditions by disaggregating the internal water footprint term to reveal internal virtual water flows between entities inside a boundary. Multiple boundary conditions allow us to distinguish between the portion of the virtual water flow and water footprint accruing to different scales and locations; in this case (1) within a municipality (intra-municipal), (2) within the metropolitan area but outside the municipality (intra-metropolitan), and (3) within the nation but outside the metropolitan area (inter-metropolitan). In this study, we neglect international virtual water flows because they are small compared with intra/inter-metropolitan flows, but the calculation of these flows is straightforward using the methods presented. Of particular importance is a methodological distinction between intra-metropolitan or intra-municipal trade in virtual water, versus that derived from more distant water resources. This is because intra-metropolitan virtual water trade represents a virtual reallocation between municipalities of a single shared physical water stock. This distinction also enables us to develop a general hydro-economic typology for communities within the system.
The general equation takes into consideration direct water consumption (U), as well as virtual water inflows (VIn) and outflows (VOut) to arrive at scale-disaggregated net water footprint (E) for a municipality (subscript m). In WFA notation, E = W F c o n s ,   n a t and U =   W F a r e a ,   n a t . Virtual water is disaggregated into two types of virtual water flows: commodity (subscript C) and also labor flows (subscript L); there are multiple types of commodities but a single type of labor. U is the sum of all “blue” fresh water use within the municipal boundary, regardless of the geographical origin or mode of conveyance of that water; local and external direct water use Ul and Ux are combined into a single term U. In this case there are three data sources and dominant water consumption categories, including potable deliveries to municipal Industrial and Commercial (IC) customers (UIC), potable deliveries to municipal Residential (R) customers (UR) and groundwater-supplied or canal-supplied deliveries to irrigated agriculture (Ufarm). U is also known as the urban water metabolism. We assumed a consumptive use coefficient of 100% because there is relatively little water recycling in this metropolitan area or elsewhere in the United States, so U is equal to total withdrawals for the purposes of this paper. This assumption causes a small overestimation in U and V. Virtual water inflows (VIn) are defined as the volume of water consumed outside the municipal boundary in the production of goods and services consumed inside the municipal boundary. Notably, virtual water inflows include circular flows within the municipality and therefore overlap partially with direct water consumption by the municipality. Outflows are defined as the volume of water used to produce within the municipality goods and services that are consumed outside the municipal boundary. Equation (15) shows the general ERA equation for a municipal water footprint.
E m =   U m + V I n , m V O u t , m   [ m 3 ]
The direct water consumption of a municipality Um is the sum of its water consuming processes.
U m =   U R + U I C + U f a r m   [ m 3 ]
Virtual water inflows happen at three scales: intra-municipal, intra-metropolitan, and inter-metropolitan with other counties or metropolitan areas, in this case limited to those within the U.S. The commodity component of inflows and outflows is summed across all commodity categories all three scales, but the labor component is of a single type and is negligible at the intra-metropolitan scale.
V I n , m = n , C V C , n m + n V L , n m + k , C V C , k m   [ m 3 ]
Equation (18) gives the virtual water outflows from the municipality to all three scales.
V O u t , m = n , C V C , m k + n V L , m n + k , C V C , m k   [ m 3 ]
The net virtual water balances (VWB) for the PMA and each municipality is the net of inflows and outflows.
V W B m = V I n , m V O u t m   [ m 3 ]
Circular virtual water flows (CF) are the volume of water used to produce a product or service that is consumed by another entity within the same boundary. In WFA notation, this is the internal water footprint of an area. The existence of a circular flow implies the existence of multiple entities within the boundary below the minimum scale of the water footprint analysis. The circular flow is not like WFA standard virtual water, because it does not cross a municipal boundary. This is an extension of the circular economy concept [76]. The volume of circular virtual water flow for a municipality is the difference between direct water use and virtual water outflows.
C F m = V I n , m m = V O u t , m m = U m V O u t , m   [ m 3 ]
The circular virtual water flows can be expressed as a ratio of virtual water outflows (exports) or inflows (imports) to all trading partners, in this case counties k. Labor and other categories follow this example.
C F C , m e x p o r t = V C , m m / k V C , m k   [ m 3 ]
C F C , m i m p o r t = V C , m m / k V C , k m   [ m 3 ]
The metropolitan area’s (Subscript a) water footprint components are determined using a simple summation over the member municipalities’ components m. An exception to this generality is the metropolitan area’s circular flow, because it must account for an additional scale. The metropolitan area’s circular virtual water flow is the sum of intra-municipal and intra-metropolitan virtual water flows for all member municipalities.
C F a = m C F m + m , n V O u t , m n   [ m 3 ]
Circular flows are implicitly included in the calculation of V I n , m and V O u t , m and do not need to be included in calculating because they are equal and opposite flows that canceled out in the calculation of the net water footprint ( E m ) and virtual water balance of a municipality ( V W B m ).

3. Results and Discussion

The PMA is a net importer of virtual water from the United States, or k , C V C , k a > k , C V C , a k . Virtual water imports from and exports to the rest of the world are negligible in relative terms. PMA virtual water inflows, including circular flows ( V I n ,   a ) totaled 4125 Mm3 and virtual water outflows, including circular flows ( V O u t ,   a ) totaled 2,584 Mm3 (Table S3). The total virtual water flows associated with labor were 359 Mm3. Phoenix and Scottsdale, core PMA municipalities, had the largest net virtual water inflows associated with labor, while Surprise and other suburban “bedroom” municipalities, had the largest net virtual water outflows associated with labor. On average, 36% of virtual water inflows embedded in the labor market resulted from intra-metropolitan area flows; the remaining 64% resulted from circular virtual water flows within each municipality. Small “edge” municipalities tended to have higher relative intra-metropolitan virtual water flows and large, “core” municipalities had relatively higher levels of circular flows.

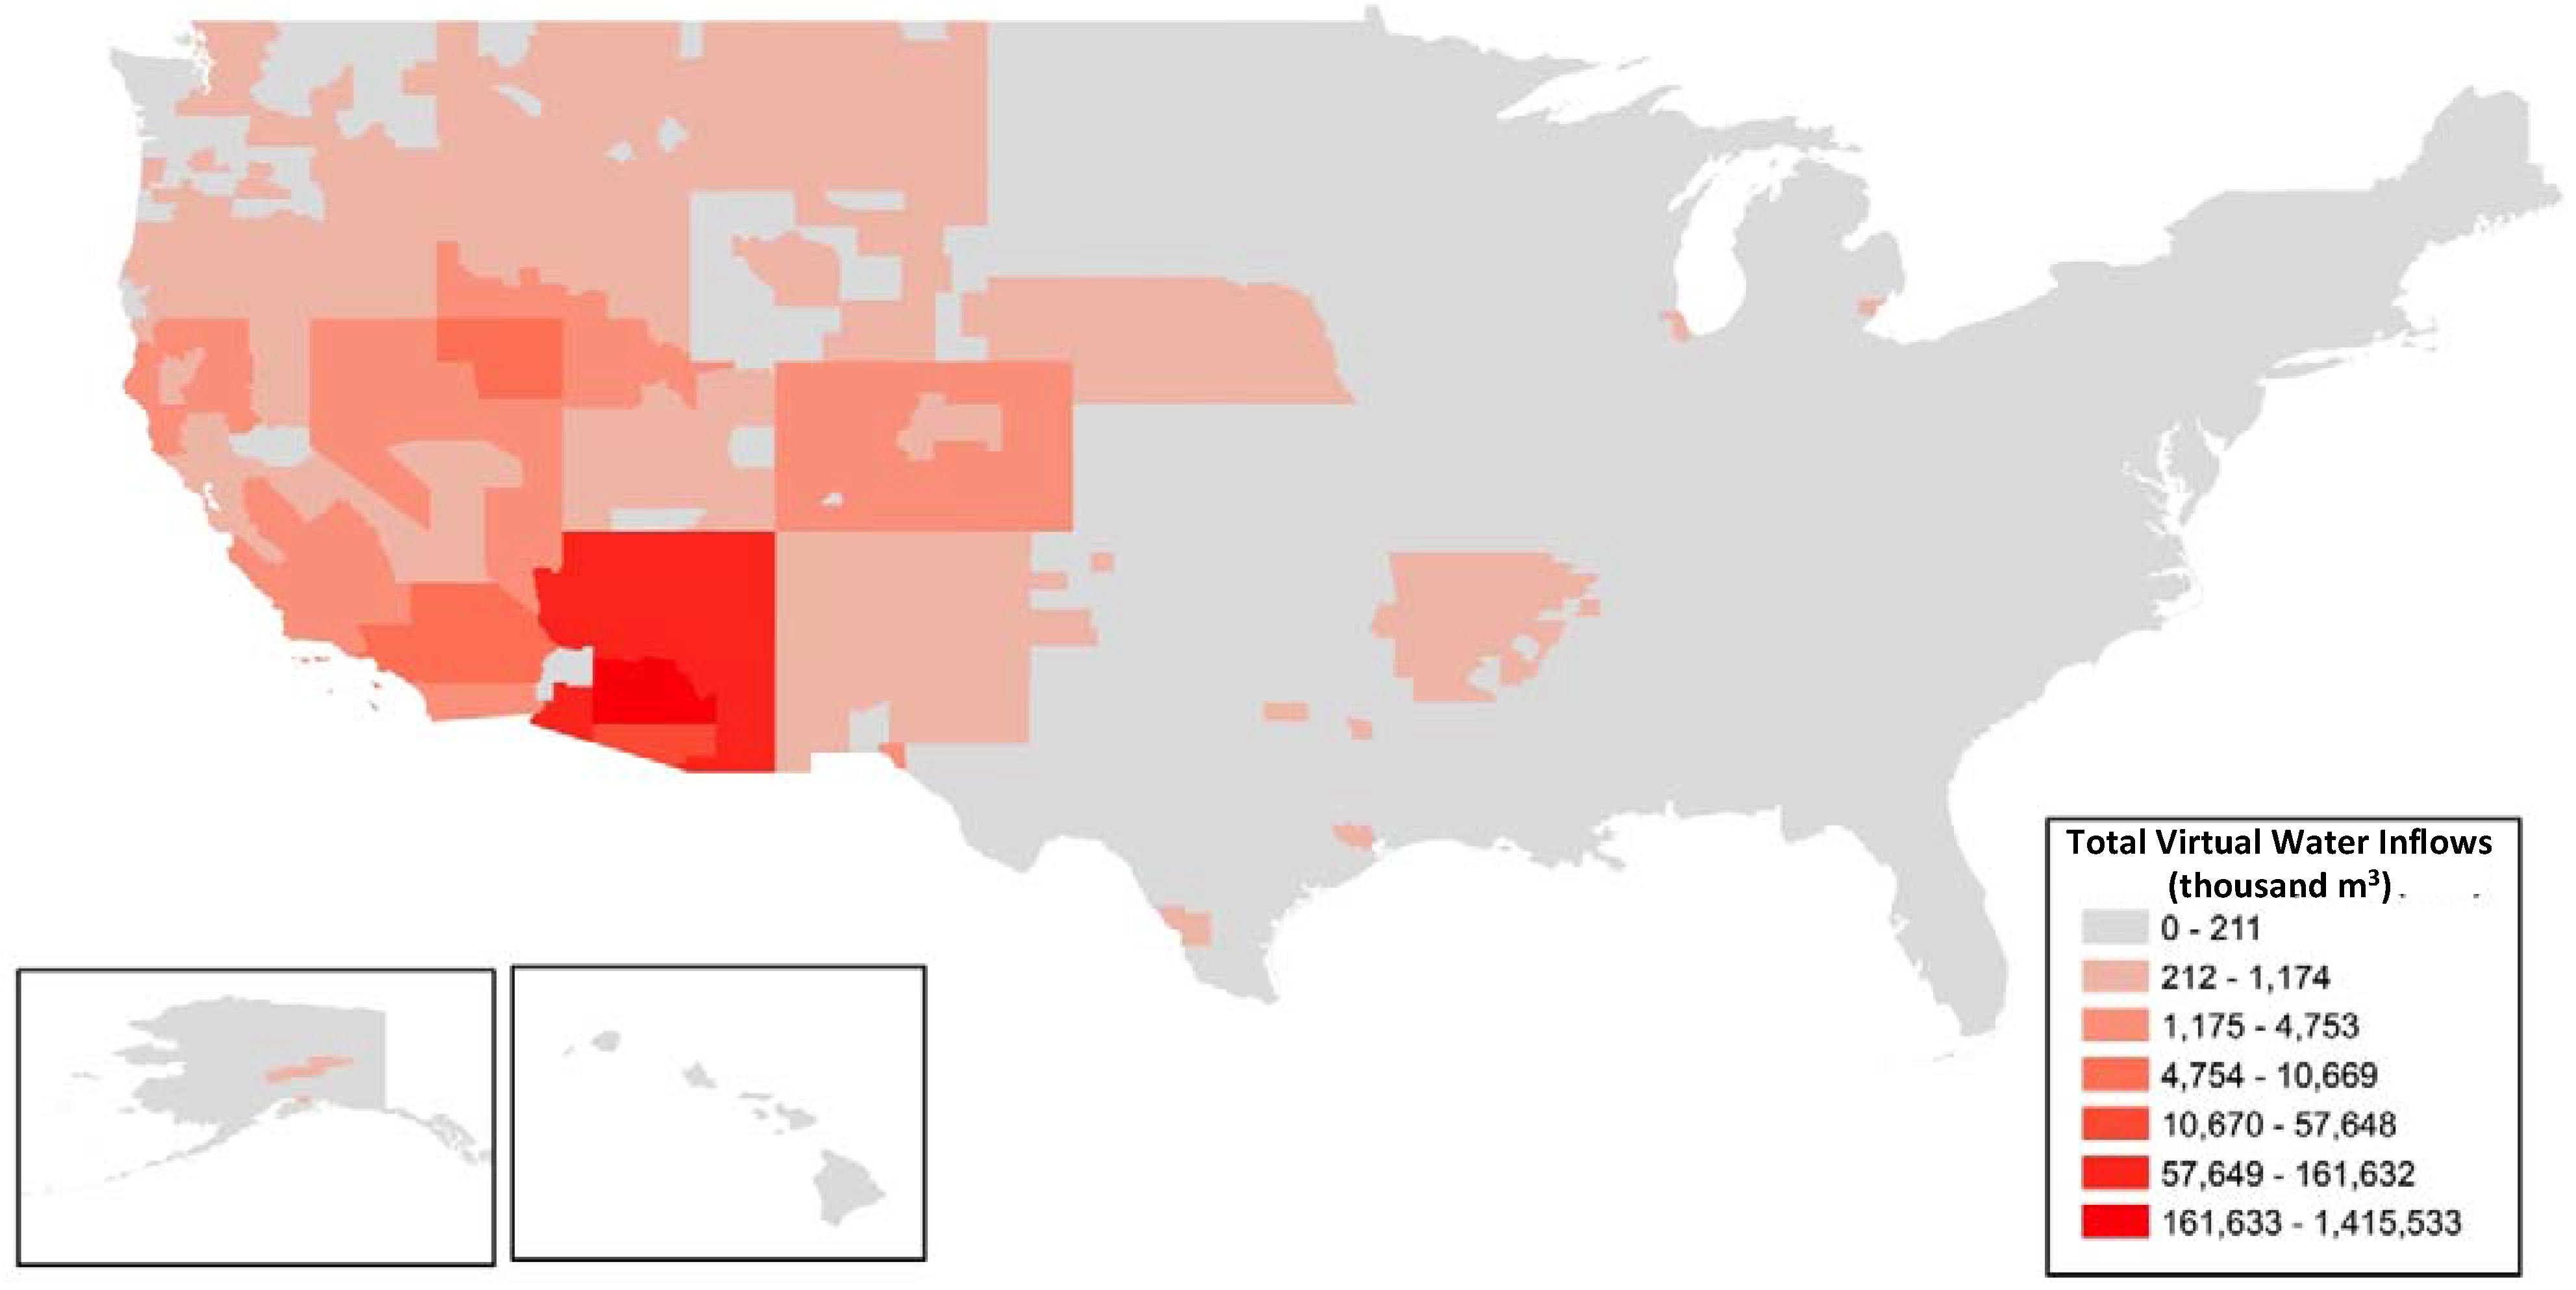
3.1. Virtual Water Inflows from the Nation and the Metropolitan Area

Virtual water inflows were dominated by agricultural goods—processed foods, milled grain, animal feed, cereal grains. These results echo numerous virtual water studies that have identified the large role that food plays in the global virtual water trade network [21,23,24,25,77]. Virtual water related to the consumption of industrial goods, machinery and electronics also result in large virtual water inflows. Though the magnitude of virtual water inflows vary by municipality population, virtual water flows associated with the trade of commodities averages 1133 m3 per capita for each PMA municipality due to using population as an attraction factor. Please refer to Tables S4 and S5 in the Supplemental Information for virtual water flows associated with commodities with in the PMA and for virtual water flows by commodity.
Agricultural commodities originating from the western half of the United States are a large component of PMA virtual water inflows (Figure 2). In this region, irrigation is predominantly blue water, unlike the eastern half of the United States where rainfall is more abundant and provides a greater proportion, if not all, of crop water demand. The PMA’s water footprint is more “blue” and less “green” than average for the US.
Previous virtual water studies have reported a per capita blue water footprint of the United States of 239 m3 per person [77], which is smaller than the 1133 m3 per capita blue water footprint calculated for the PMA. The deviation from previous work is because PMA relies heavily on “blue” surface water and groundwater abstractions, rather than “green” water virtual water supplies. The high level of circular virtual water flow within the PMA underscores this finding: 30% of a municipality’s imported virtual water originates in the PMA, and much of the rest originates within the State (Arizona) and river basin (Colorado) where the PMA is located. Indirect or virtual water dependencies are concentrated within the same local hydrology and physical water supply upon which the PMA directly depends for its water supply, rather than being spatially distributed to hydrologically diversified regions. This large circular virtual water trade within the PMA and large dependency within the Southwestern US region and Colorado River Basin amplifies the community’s hydro-economic exposure to scarcity and disruption of the local water resources [16,17].
Figure 2. Virtual water inflows ( V C , k P M A ) into the PMA are skewed to the dry (South) Western United States. Agricultural products dominate the virtual water inflow, especially from states such as Nebraska, Arkansas, and California. While the PMA does not tend to import from distant rural areas, and imports little from eastern US metros, the PMA does trade with metropolitan areas across the United States.
Sustainability 07 08522 g002

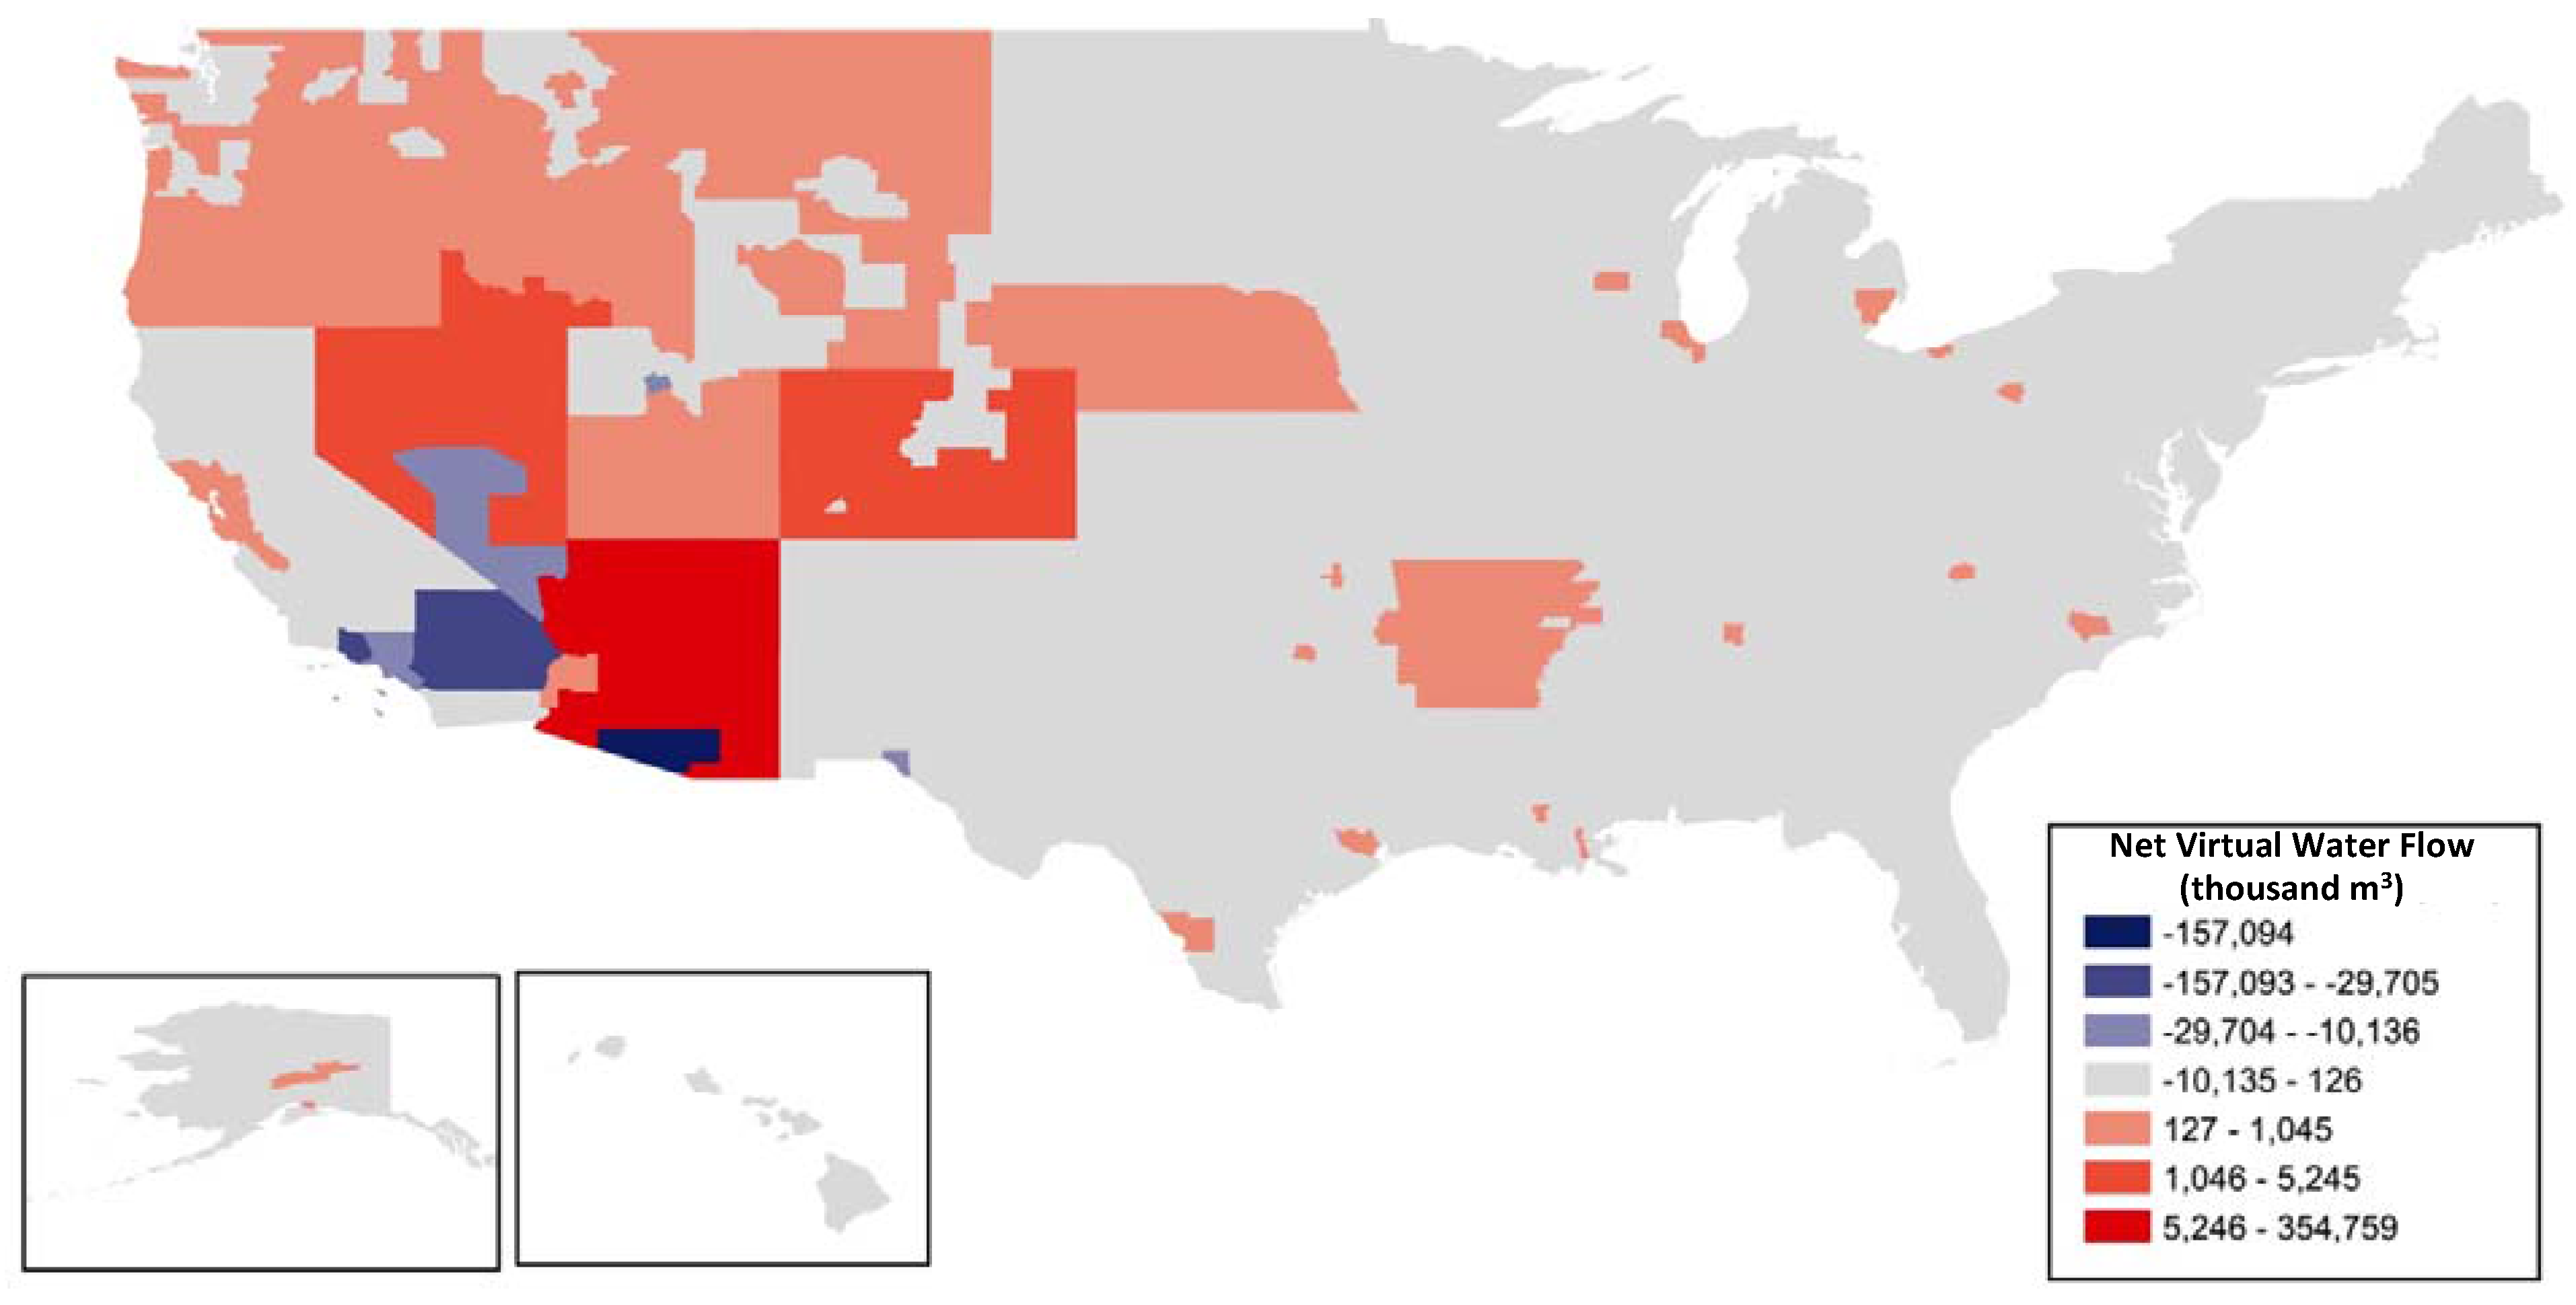
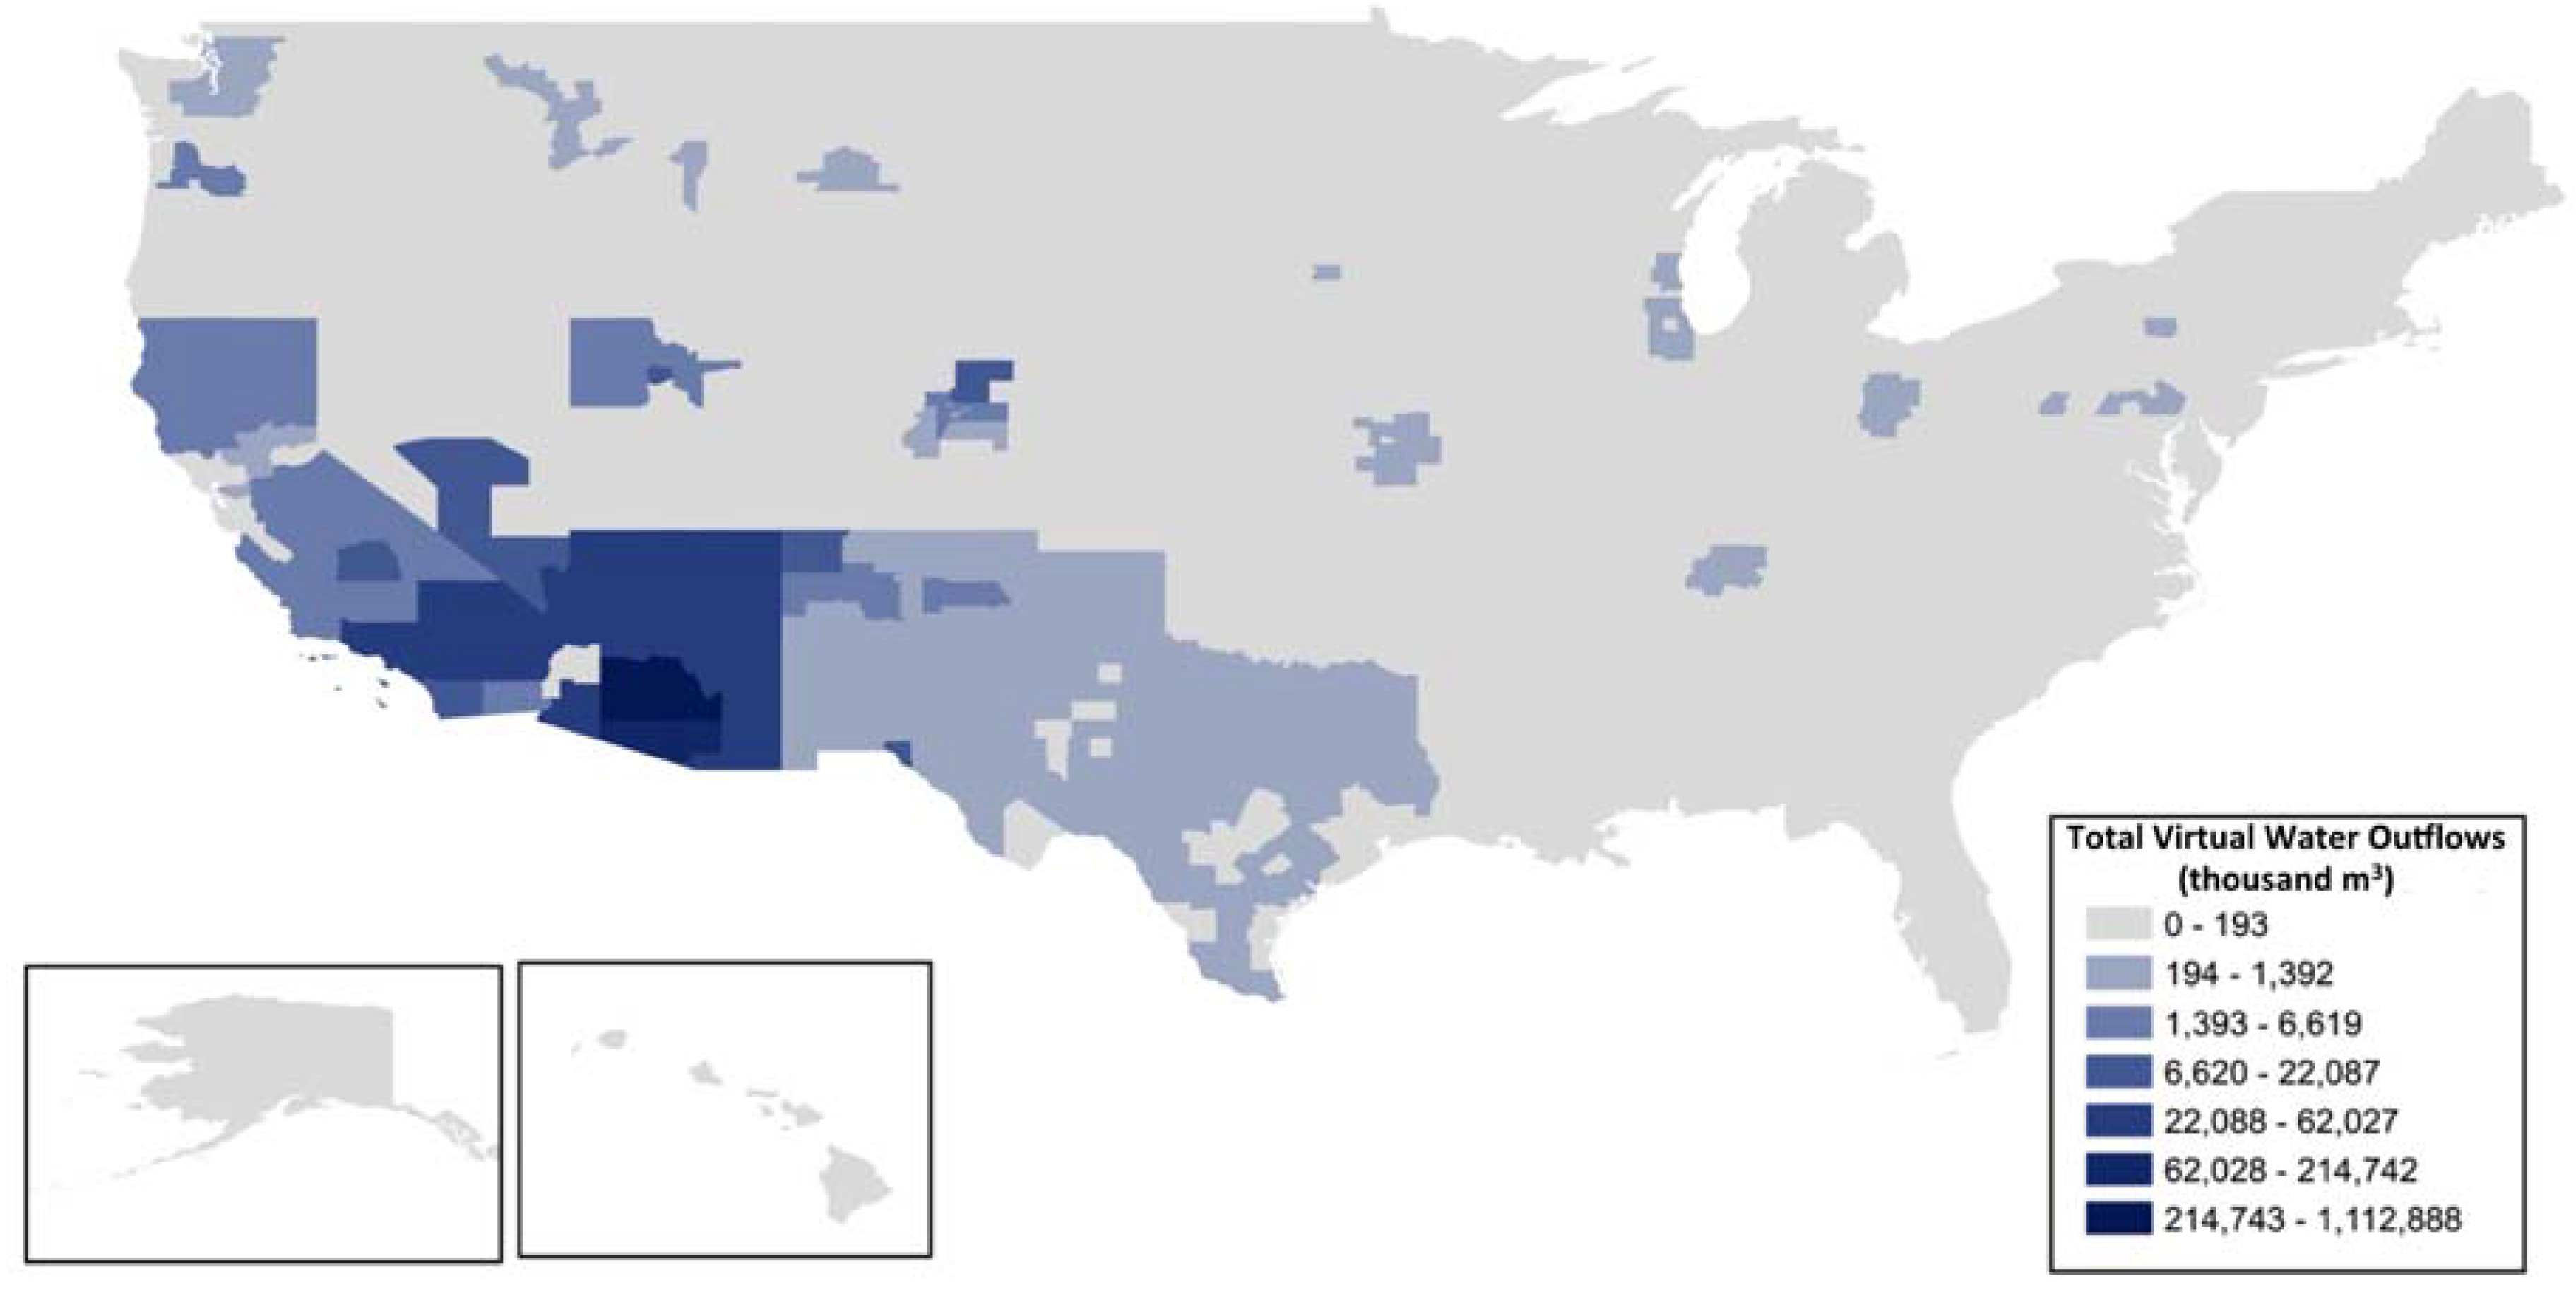
3.2. Virtual Water Outflows to the Nation and the Metropolitan Area

Virtual water outflows per capita for the PMA follow a rough rank-order relationship from edge municipalities with high fractions of agricultural land (Buckeye) to residential/retirement communities (Sun City and Sun City West); ranging from 11,841 m3 per capita in Buckeye to 3.0 m3 per capita in Sun City West, which have the highest and lowest fractions of agricultural land use by area in the PMA. Virtual water outflows from the PMA to the rest of the United States are heavily weighted to the Southwest region, especially Arizona (Table 1), and all major national metropolitan areas (Figure 3), suggesting that the PMA is hydro-economically a regional city. Most of the Southwest is indirectly utilizing central Arizona water through economic interactions with the PMA. Nearly half of virtual water production ( C F C , P M A e x p o r t = 48 % )   by the PMA’s municipalities remains within the PMA. Comparing Figure 2 with Figure 3, virtual water outflows are more biased than inflows toward major national metropolitan area trading partners. However, both virtual water inflows and outflows are dominated by local trading partners: the PMA (first), Arizona (second) and Southern California (third) [78].
Table 1. Virtual water exports from the PMA to Arizona (Commodities only, not labor).
Virtual Water Outflow DestinationVirtual Water Outflows (VC,Out) (Thousand m3)% Total Virtual Water Export
Tucson AZ MSA132,5795%
Remainder of Arizona309,35112%
Phoenix AZ MSA *1,237,40448%
Total Virtual Water Export to AZ 1,679,33465%
Total Virtual Water Export2,583,530100%
* Includes Maricopa and Pinal County
Figure 3. Virtual water outlfows ( V C , P M A k ) from the PMA are more concentrated in Arizona and regional neighbors, Las Vegas, California, New Mexico and Texas. Outflows are strongly correlated with the transportation route of the Interstate 10 highway and associated railways, which connects the PMA to markets in California, New Mexico and Texas. Virtual water outflows to areas outside of the Southwest United States are associated with other metropolitan areas, notably Salt Lake City, El Paso, Albuquerque, Denver, Boise, Seattle Portland, Kansas City, Milwaukee, Chicago, Columbus, Memphis, and Washington DC.
Sustainability 07 08522 g003

3.3. The Net Water Footprint of Commodities Consumed in the Metropolitan Area

Core cities are net virtual water importers from both their intra-PMA neighbors and from outside the PMA. Edge, agricultural communities within the PMA are net exporters of virtual water to both core PMA municipalities and to the rest of the United States. These results corroborate the results of numerous water footprint and urban metabolism studies that found cities to be consumers of resources drawn from beyond local natural resource availability [23]. However, disaggregating the national virtual water flows associated with commodities for the PMA reveals that many metropolitan areas and rural areas are net exporters to the PMA while other metropolitan areas and rural area are net importers from the PMA, which is a more nuanced view of sub-national virtual water flows associated with a regional scale virtual water trade network (Figure 4).
Figure 4. Net virtual water inflows for the PMA ( V W B P M A ) are shown above. While virtual water inflows greater than outflows (Vin > VOut), when disaggregated to the county-level it is evident that the PMA is both a net importer and exporter depending on trading partner. The PMA is a net exporter of virtual water to regional metropolitan areas (LA, Las Vegas, Tucson, El Paso, and Salt Lake City) and imports from the remainder of the country.
Sustainability 07 08522 g004

3.4. Virtual Water Flows Associated with Labor

Intra-municipal circular labor flows account for 64% of the virtual water of the labor market; the remaining 36% resulted from circular virtual water flows within each municipality. Agricultural edge municipalities and bedroom municipalities had high outflows of virtual water associated with labor, and core municipalities have high virtual water inflows associated with labor (Table S6 in the Supplementary Information). Approximately half of the virtual water flows of labor within the PMA were associated with inflows, outflows, and intra-municipal flows within the municipality of Phoenix; the remaining fraction of virtual water flows was suburban-to-suburban labor flows. These results echo previous studies on the changing patterns of metropolitan area commuting from purely suburban to central city commuting patterns to more decentralized and poly-nucleated commuting patterns around the metropolitan area [19]. Larger municipalities have a higher percentage of circular flows.

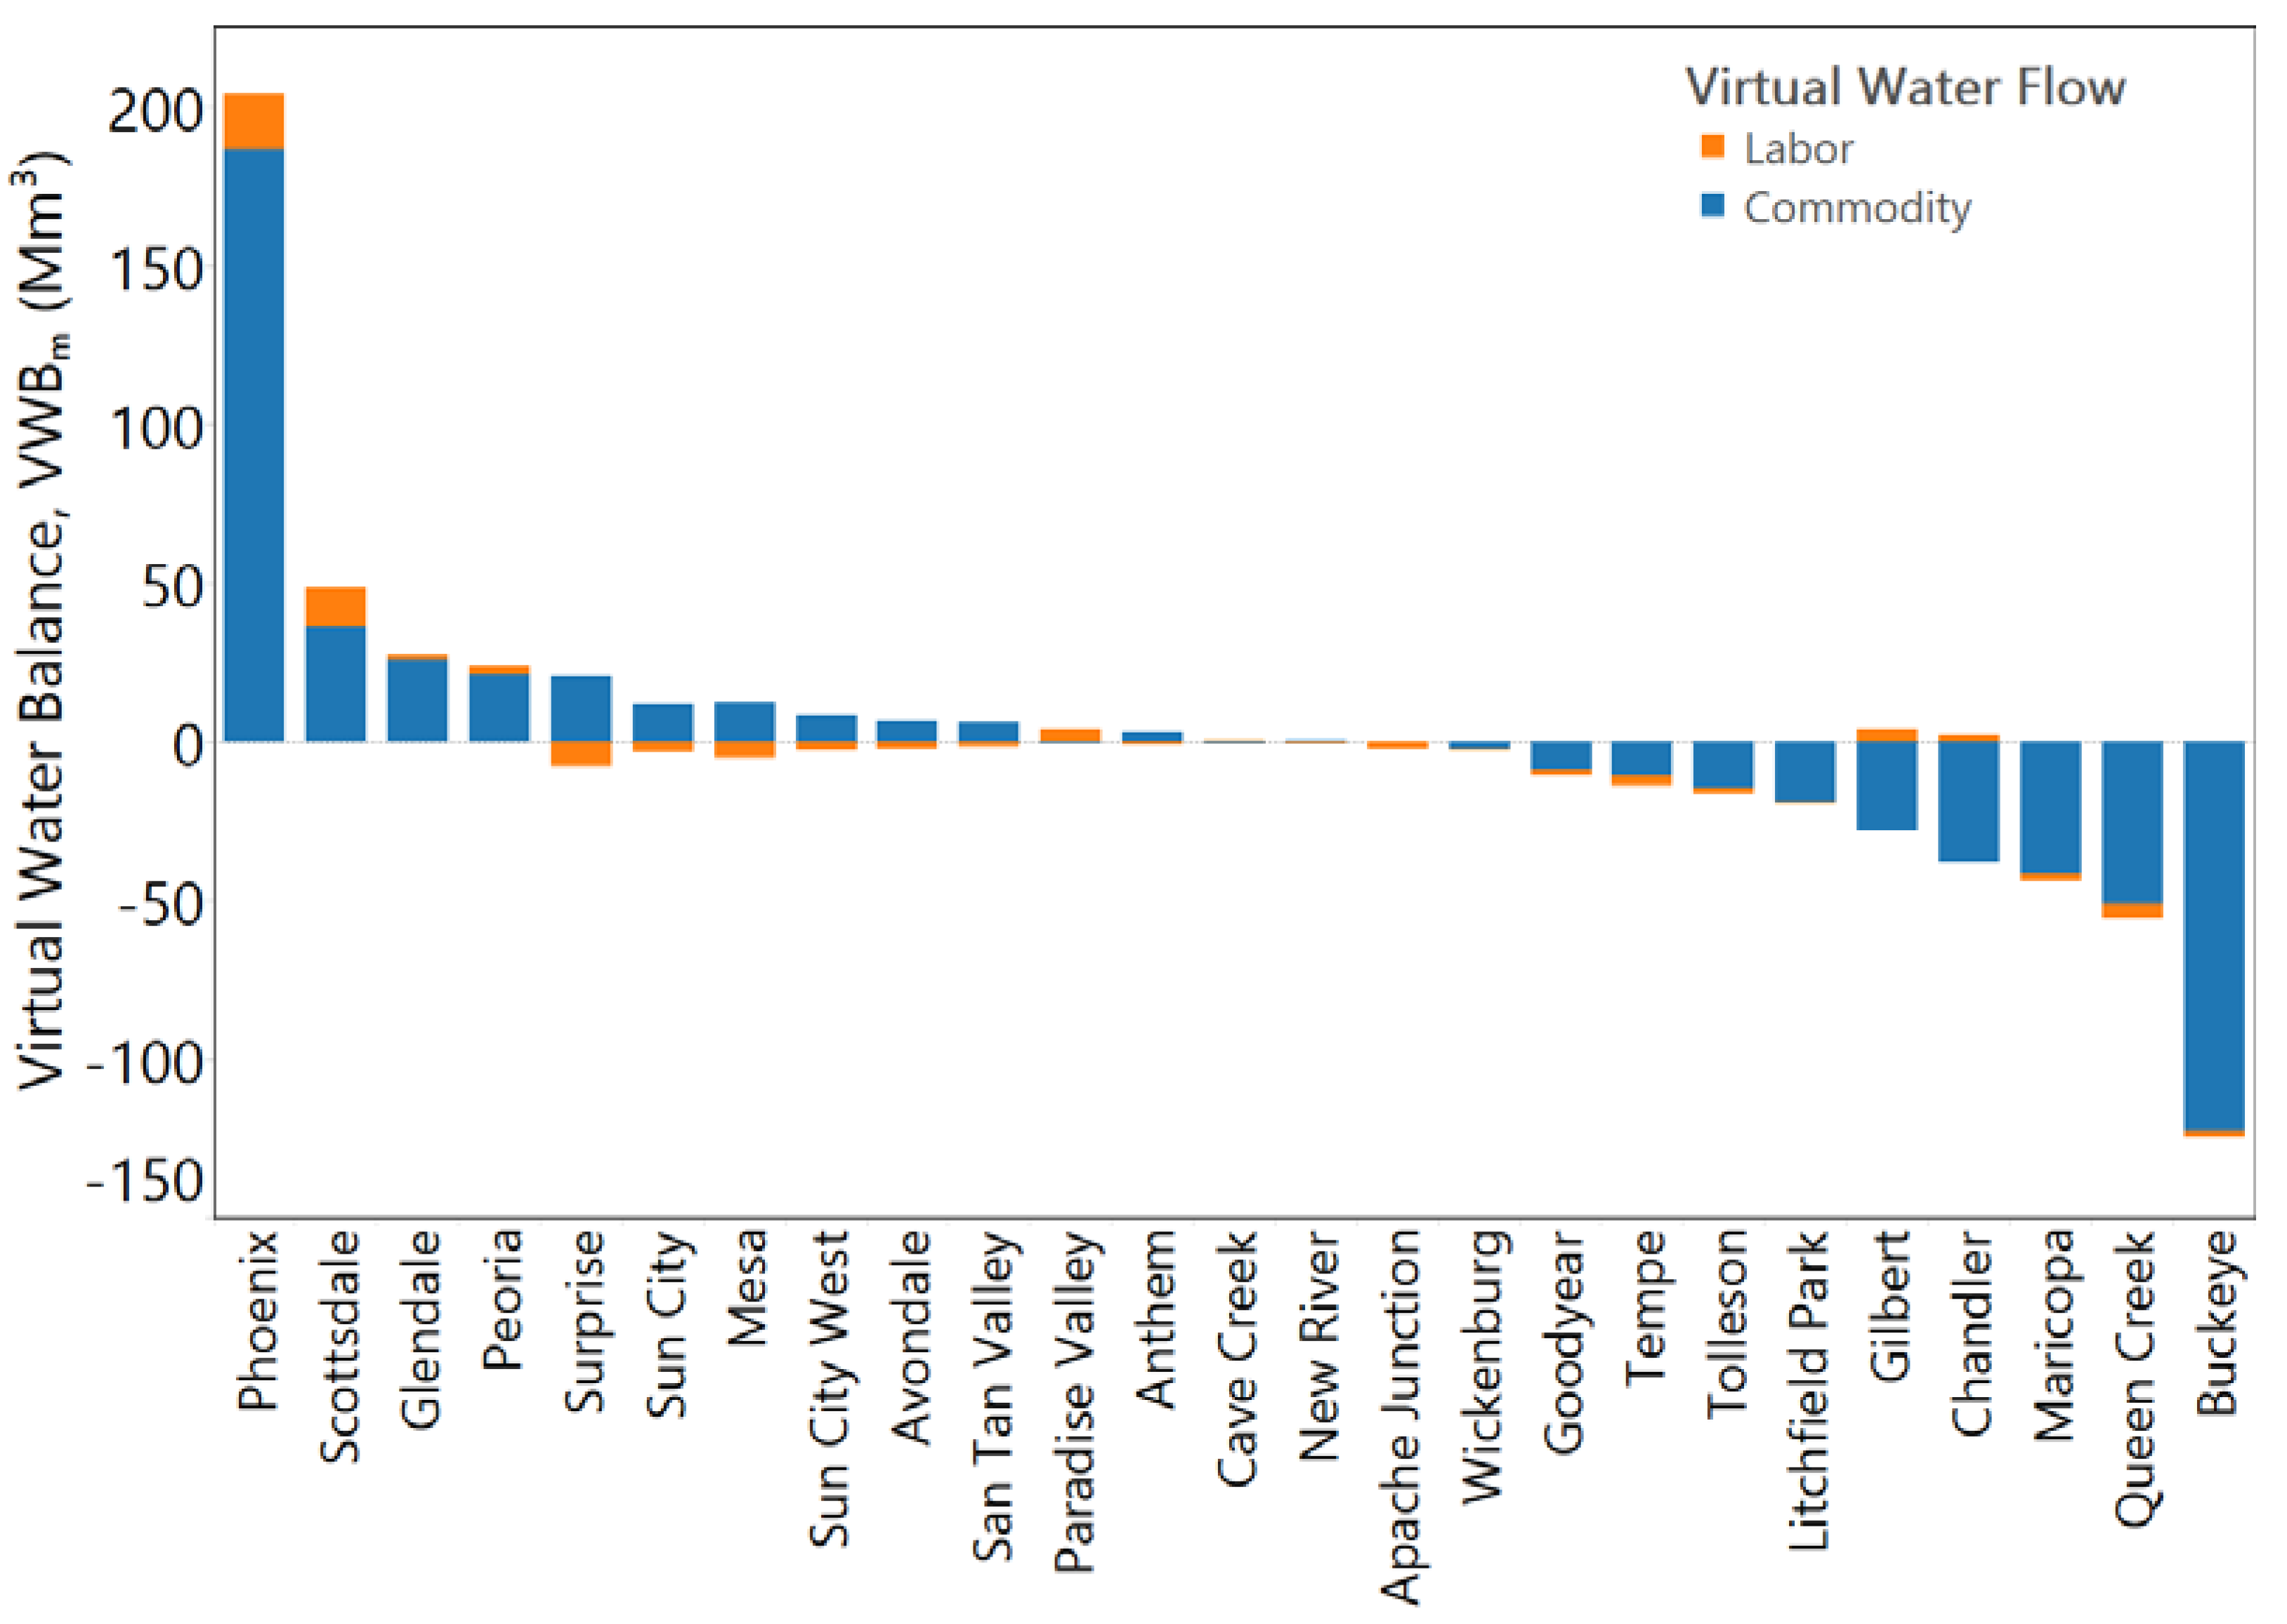
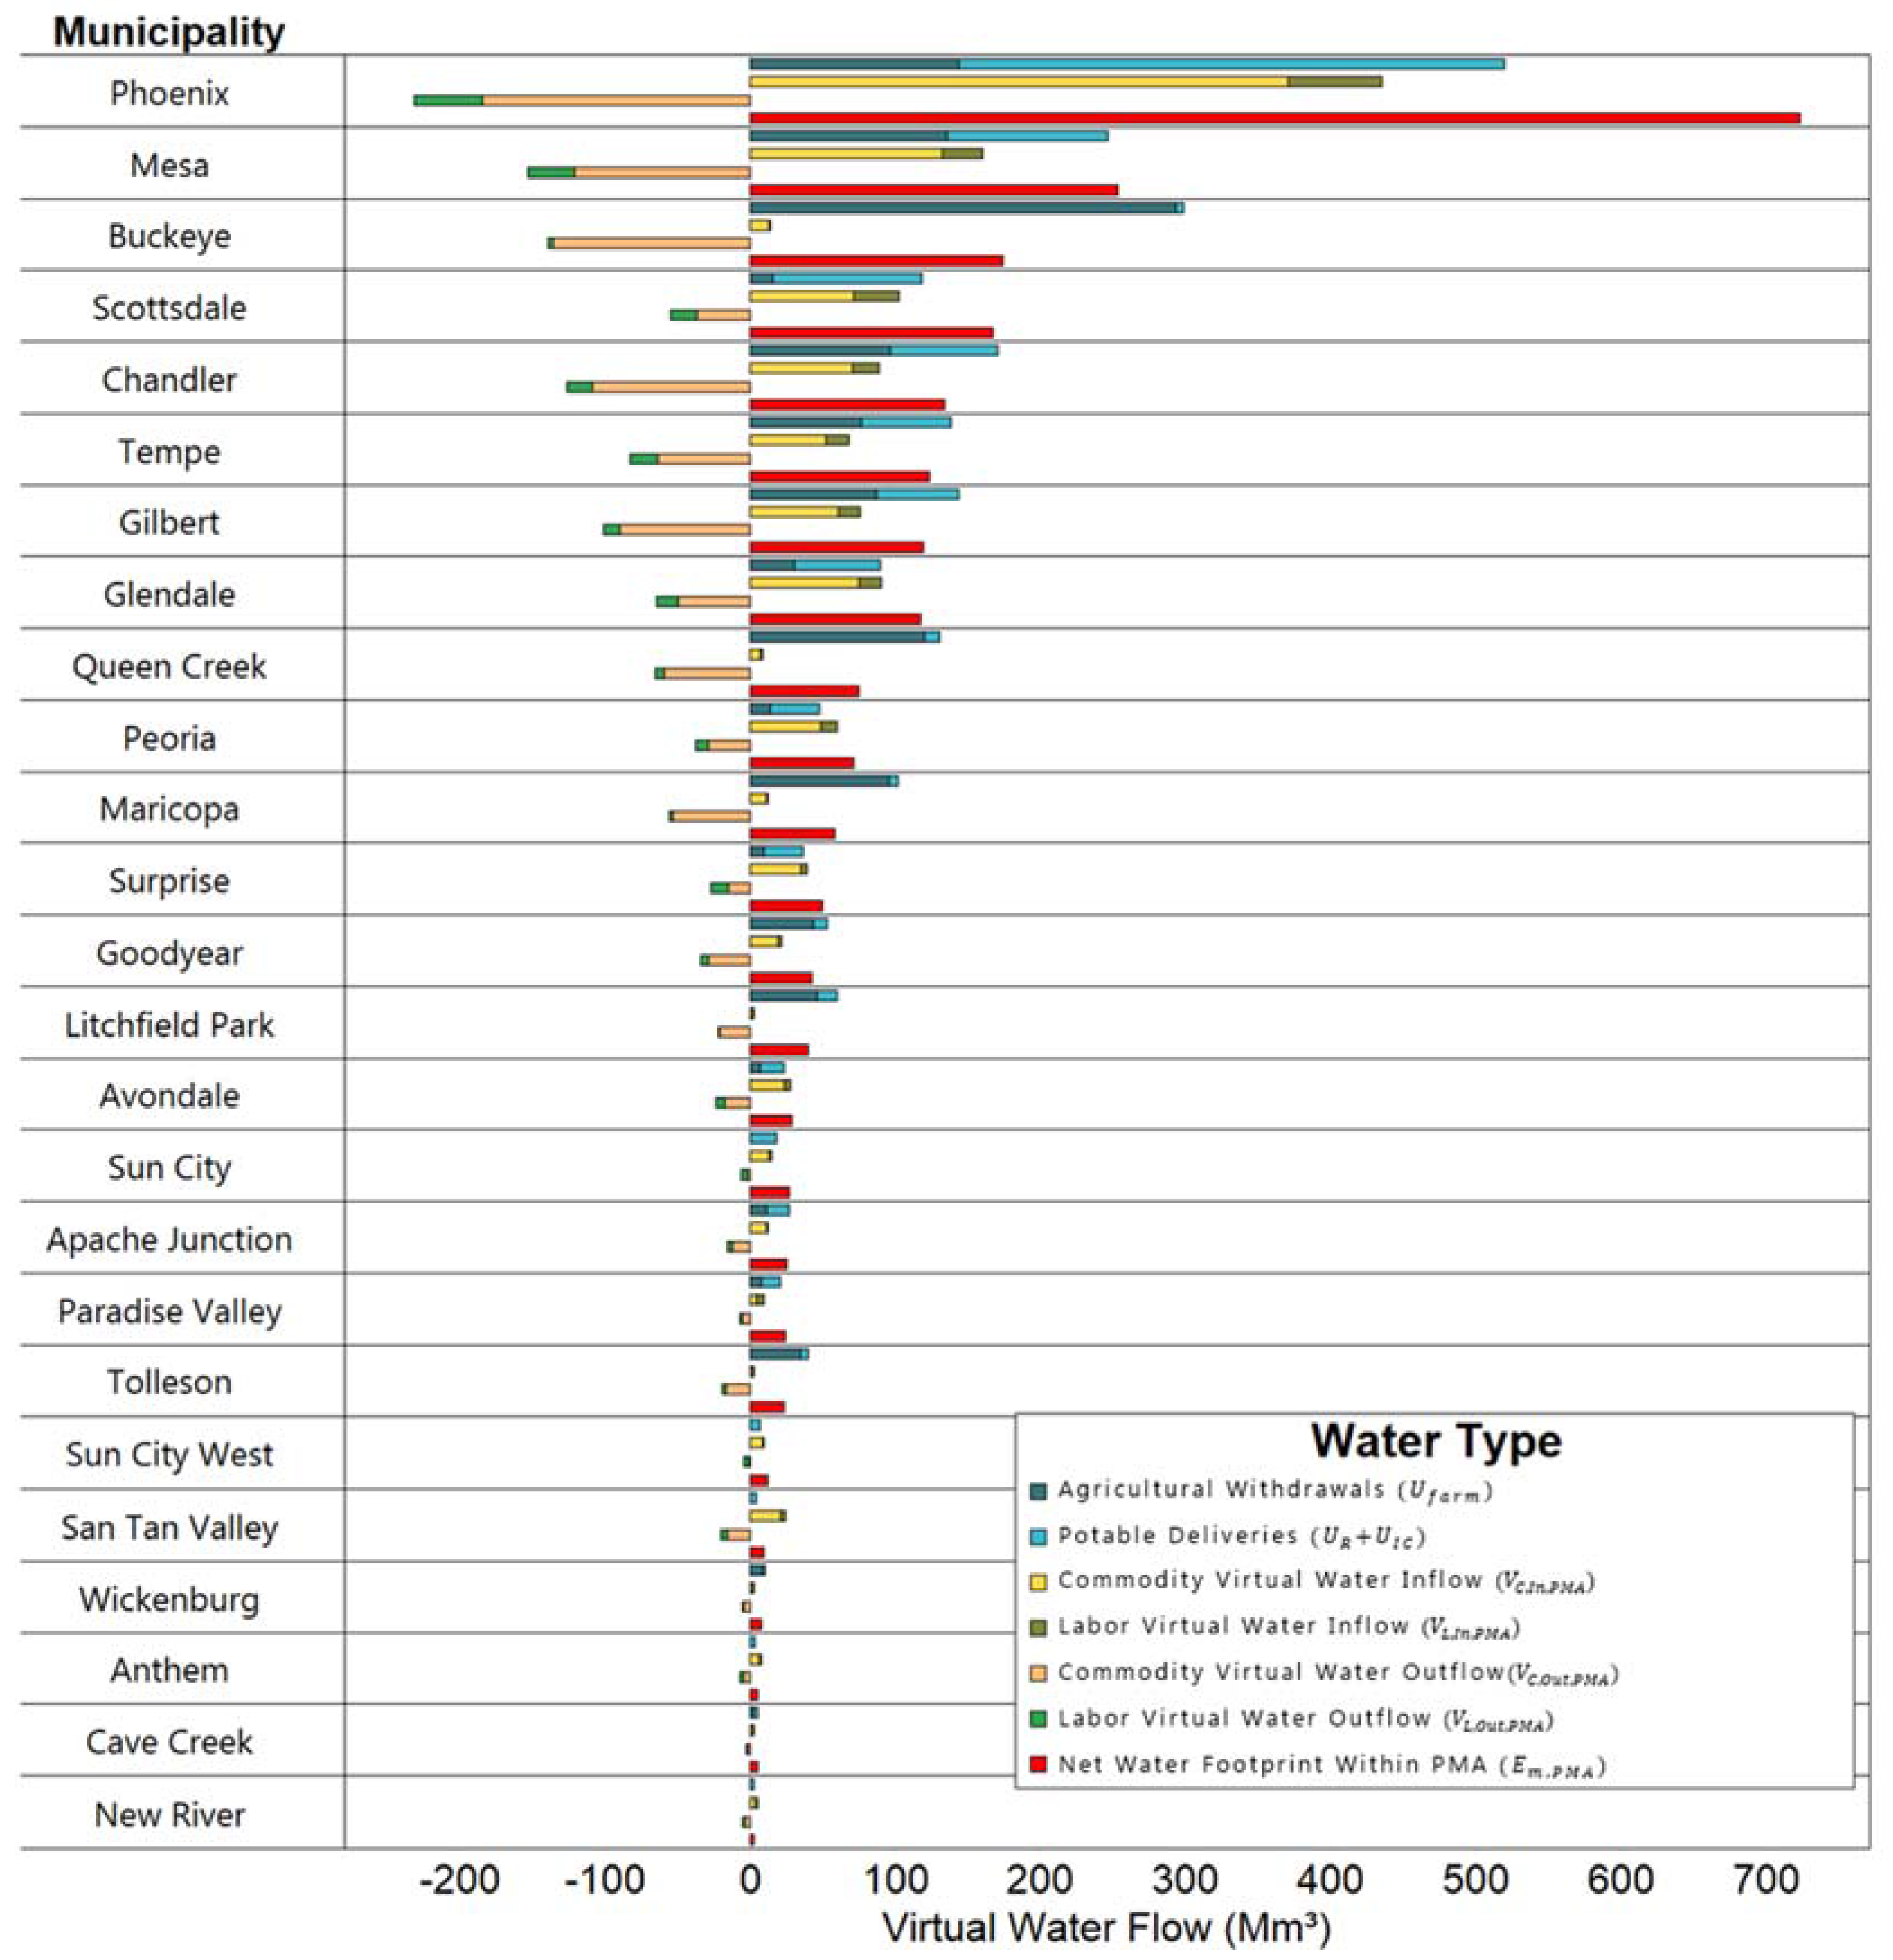
3.5. Intra-Metropolitan Net Water Footprints

If all of a metropolitan area’s municipalities share a common physical water resource, the net flows of virtual water within the metropolitan area are conceptually interchangeable with a proportionate physical reallocation of shared local water resources. The high degree of intra-PMA virtual water flows further underscores the role of shared physical water resources and local-scale virtual water dependencies within the PMA. These virtual water flows create hydro-economic interactions between independently managed municipal potable water infrastructures, and also the self-supplied and mostly agricultural water infrastructures in the area. The relative magnitude of the virtual reallocation of water is approximately estimated by the comparison between the direct water withdrawals (U) and the intra-metropolitan net water footprint of each municipality (EPMA) (Figure 5). Core municipalities have a larger share of the area’s shared physical water resources when virtual water flows within the metropolitan area are considered; the opposite is true for edge and bedroom municipalities. This affects per-capita water footprints, increasing them for core municipalities and decreasing them for edge municipalities (see Table S7 for the adjusted per-capita water footprints). Core municipalities depend disproportionately on their metropolitan area neighbors’ water supplies, as opposed to more distant trading partners’ water supplies. Figure 5 may also be understood as a downscaling to individual communities and economic sectors of the county-level aggregated virtual water flows and water footprints presented in Section 3.1, Section 3.2, and Section 3.3.
Figure 5. Components of the Intra-PMA Net Water Footprint of each municipality (a = PMA). Municipalities have different roles in the metropolitan economy; Core municipalities tend to have virtual water inflows that are greater than outflows and also than potable system deliveries; Bedroom municipalities have greater outflows of virtual water associated with labor than corresponding inflows. The net water footprint within the metropolitan area gives the complete impact of a municipality on the metropolitan area’s shared physical water resources, including indirect impacts via trade with metropolitan neighbors.
Sustainability 07 08522 g005

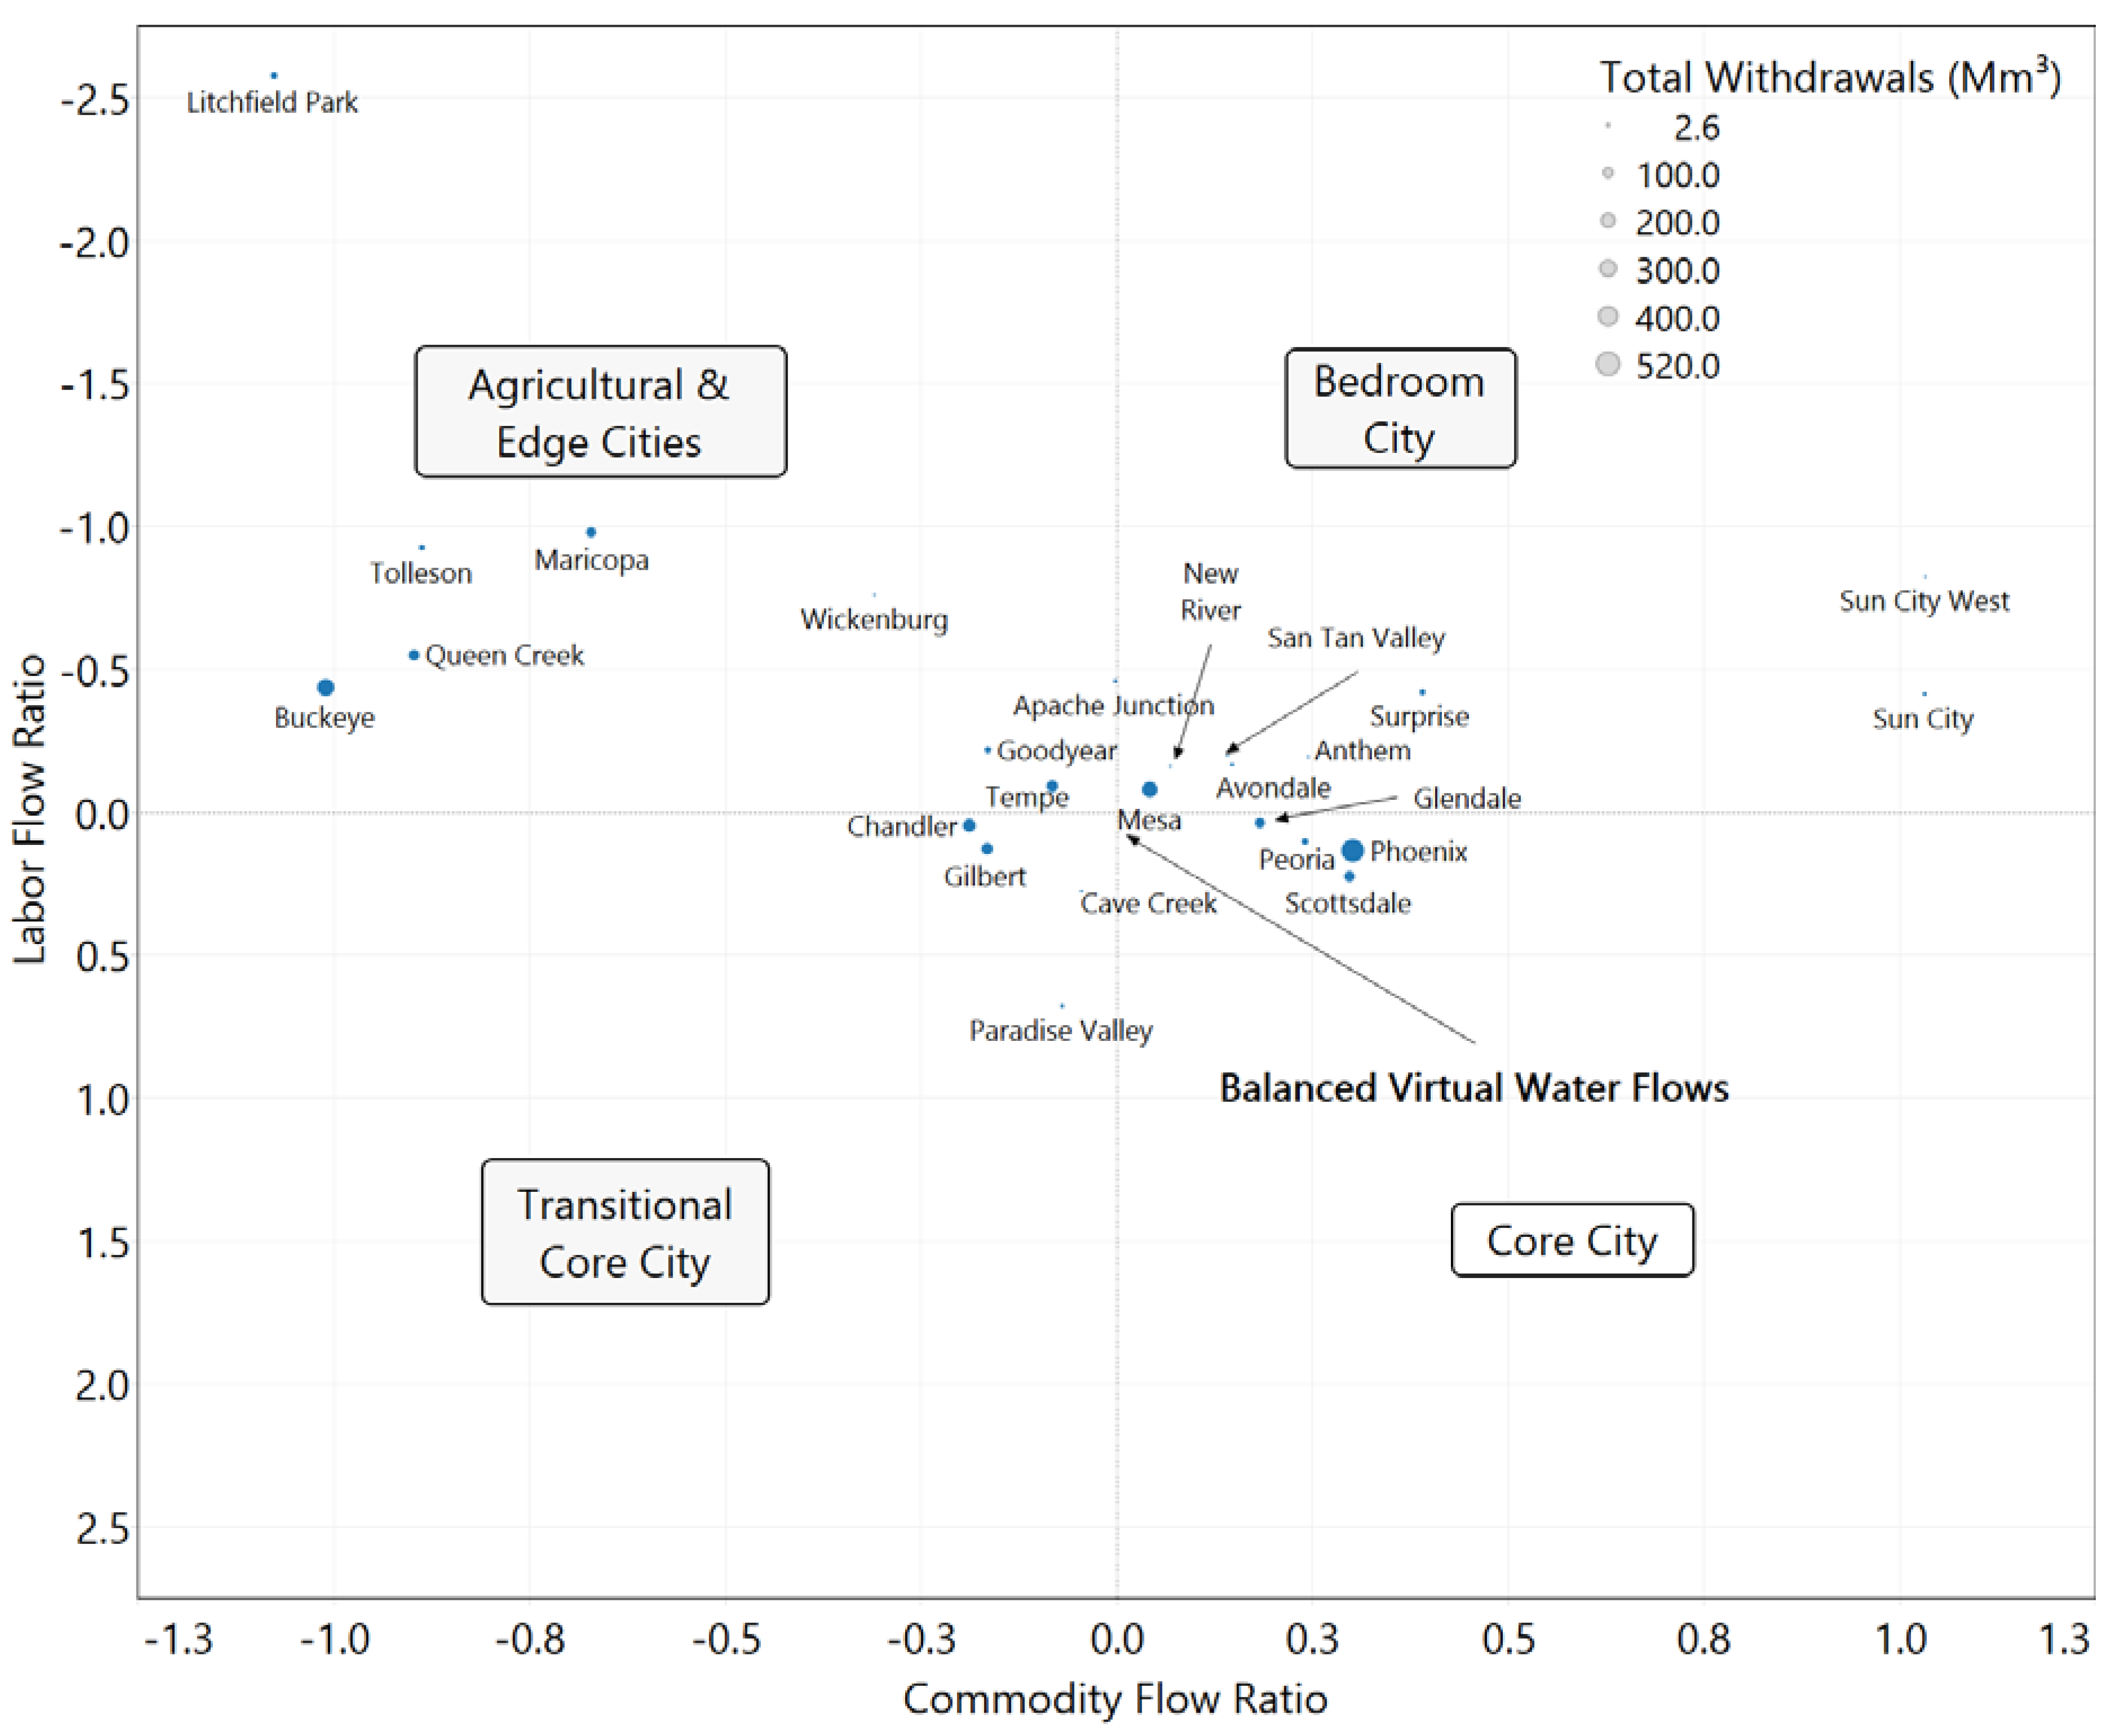
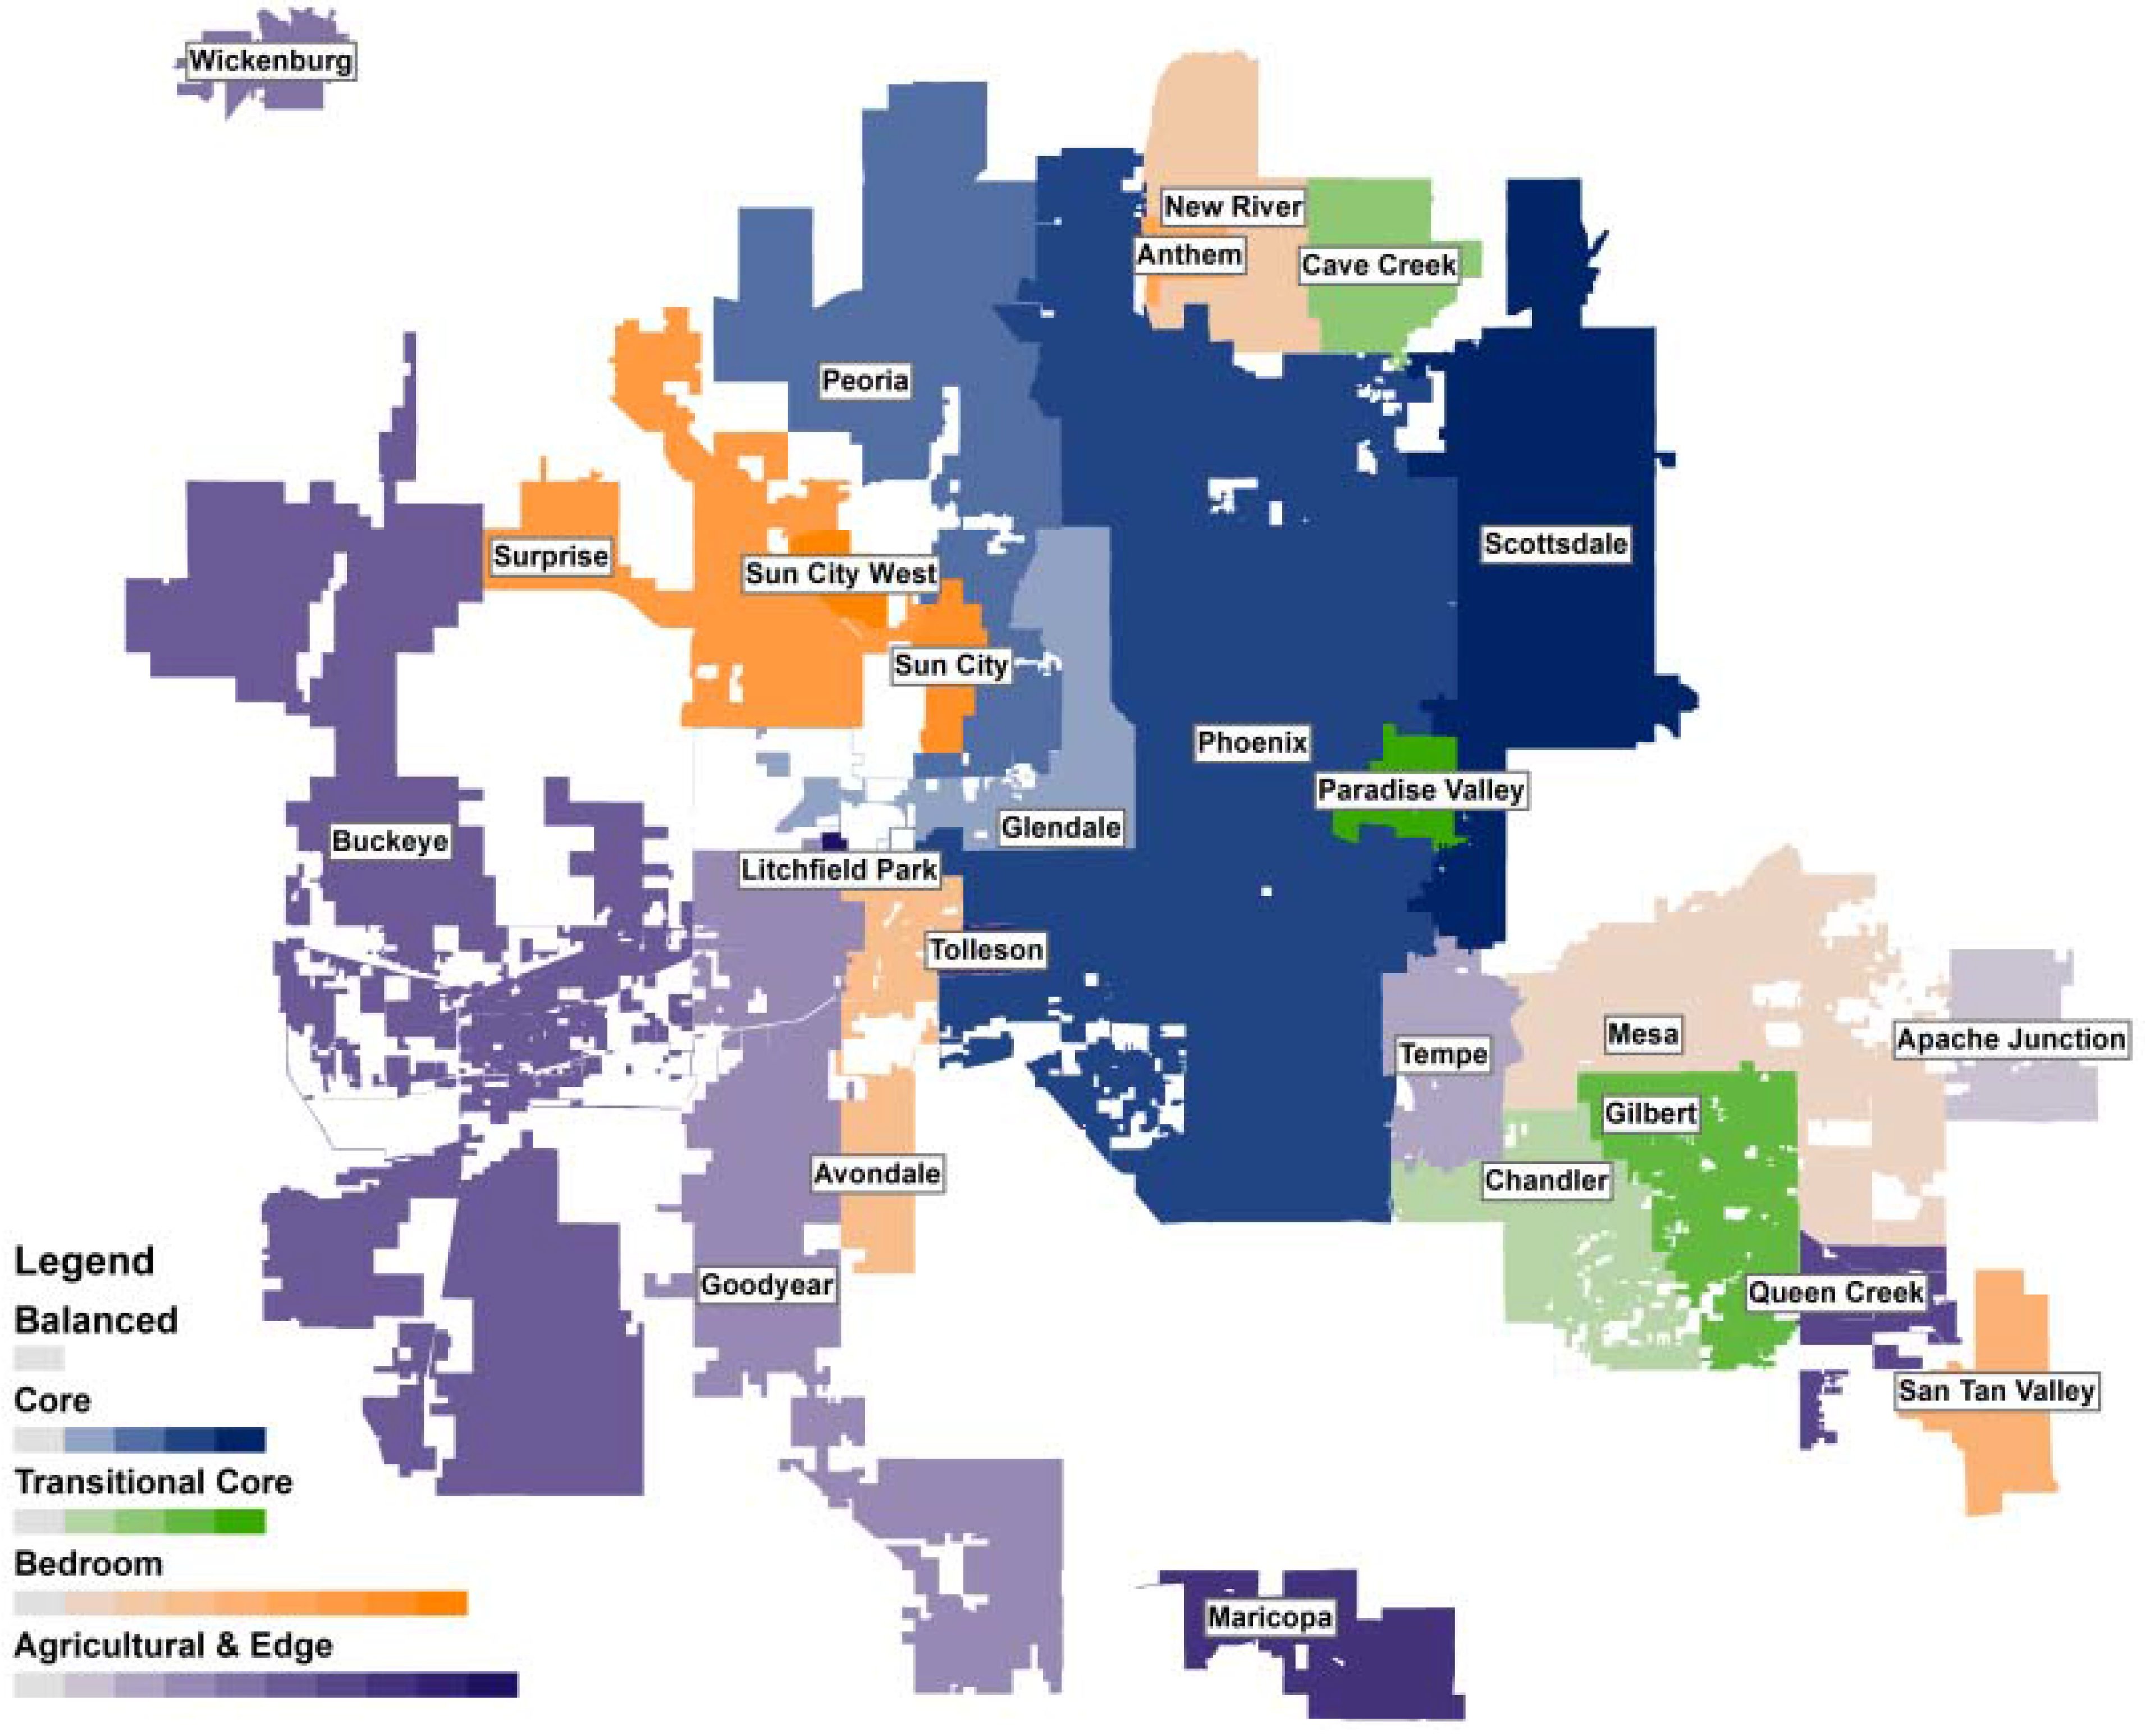
3.6. A Hydro-Economic Typology for Communities

The intra-metropolitan scale net virtual water balance ( V W B m ) is particularly important because it reveals how trade between neighboring municipalities affects the demand placed by each municipality on the shared physical water resource stock. Core municipalities are net importers of virtual water from the PMA in both labor and commodity trading categories, whereas agricultural or edge municipalities are net exporters in both categories (Figure 6). Many municipalities are net importers in one category and net exporters in the other. This example provides the basis for a general typology describing their relative roles.
Figure 6. The core municipalities, chiefly Phoenix and Scottsdale, are net virtual water importers with respect to commodities and labor. Surrounding municipalities support the core municipalities via the virtual water outflows in the form of labor (commuting) and commodities. A large fraction of the net commodity inflows and outflows is due to the virtual water associated with agricultural commodities, which fall outside of municipal water supply systems.
Sustainability 07 08522 g006
A generalized hydro-economic typology can be created based on the relative role of each community within the system boundary. Within the PMA, these roles have been simplified into the net trade in virtual water in the categories of commodities and labor. We use a Labor Flow Ratio (LFR), defined as L F R = l o g ( n , C V C , n m / n , C V C , m n ) , and a Commodity Flow Ratio (CFR), defined as C F R = l o g ( n V L , n m / n V L , m n ) . There are at least four qualitatively different hydro-economic types of communities (Figure 8): (1) “core” communities which are high-value economic centers and job centers that are dependent on their neighbors for net virtual water inflows in both labor and commodities; (2) suburban “bedroom” communities that are net virtual water exporters to core municipalities via labor flows but net virtual water importers of commodities because of their relatively large residential populations [79]; (3) “edge” communities that are net virtual water exporters, especially of agricultural commodities but also of other commodities and labor; and (4) “transitional core” communities, which have become job centers and are therefore net importers of virtual water in labor, but are still net exporters of commodities, possibly due to economic specialization in an area such as manufacturing, or due to significant remaining agricultural activity. A “balanced” community is near the origin of the plot and is not a significant virtual water importer or exporter. This balance might be because the community has equal parts of each of the four types described above, or because the community is so small that it trades very little. Recall that the result in Figure 7 and Figure 8 excludes virtual water flows across the municipal area’s system boundary, so the typology is relative the chosen boundary. From a different point of view and using a more global boundary condition, all urban communities of substantial size are likely to be core-type communities.
Figure 7. A two-dimensional hydro-economic typology for communities based on net virtual water flow ratios in the labor and commodity sectors of the economy. The PMA’s leading municipalities, Phoenix and Scottsdale, typify the “core” community, and heavily agricultural communities such as Queen Creek and Buckeye typify the “edge” community. Chandler and Gilbert are “transitional core” communities that are developing to resemble Scottsdale but are currently part agricultural. Tempe and Mesa are “balanced” hydro-economies. This typology is based only on intra-metropolitan virtual water flows, and describes the relative hydro-economic role of each municipality within the metropolitan area.
Sustainability 07 08522 g007
Figure 8. Mapping of the typology presented in Figure 7; PMA cities are mapped and shaded according to their city typology. Color intensity is proportional to a municipality’s Euclidean distance from the origin, or balanced virtual water flows, and ranked within each typology.
Sustainability 07 08522 g008

4. Conclusions

4.1. Summary

This study has successfully quantified the Phoenix Metropolitan Area’s (PMA) water footprint balances at multiple scales, in a spatially explicit fashion. 30% of the PMA’s virtual water inflows are sourced “circularly” from within the PMA, and the majority of the rest is sourced within the State of Arizona, and to a lesser extent Southern California and other parts of the Lower Colorado River Basin. There is therefore a very strong indirect dependency of the PMA on the relatively scarce water resources of the Southwestern US and especially the Lower Colorado River Basin and local Phoenix-area surface and groundwater supplies. This indirect dependency measured by its virtual water inflow is larger than the PMA’s direct water consumption (or urban water metabolism). The PMA’s per-capita water footprint is several times higher than the US national average, due to an increased reliance on water-intensive irrigated agriculture in the semi-arid Southwest. Therefore, water shortage in the Colorado River Basin has the potential to impact the PMA not only through stress and potential shortage of physical supplies but also indirectly through stress on virtual water supplies throughout the basin.
Forty-eight percent of the PMA’s virtual water production remains within the PMA ( C F C , m / ( m n ) = 48%). The other 52% of virtual water outflows has a locational bias toward national metropolitan areas, especially those within the southwestern United States including Southern California. The PMA still contains a prominent agricultural sector, which is responsible for much of the virtual water outflows. Even though this is a metropolitan area of more than four million people with relatively little agricultural land remaining inside the area, irrigated agriculture and agricultural water supplies, not potable supplies, are still the largest component of the PMA hydro-economy.
For these municipalities’ urban water footprints, the metropolitan area scale contains the highest fraction of virtual water flows, followed by the State scale, the regional scale, and the national scale, in descending order and with the flows dominated by the metropolitan scale and the State scale. Indirect water dependency is concentrated in the same physical location as the direct water supply, so the PMA’s hydro-economy’s exposure and risk associated with the southern Arizona water supply is enhanced rather than mitigated by the highly circular structure of the hydro economy. The indirect water supply chain of the PMA is concentrated in locations that are hydrologically, politically, and legally coincident with the direct water supplies of Central Arizona.
There is a large and mobile skilled labor supply that commutes between PMA municipalities, evidenced by the 22% of the PMA’s potable water deliveries mobilized through inter-municipal labor flows within the PMA. While this is less than the virtual water trade in commodities, both commodities and labor are significant contributors to the intra-metropolitan scale virtual water flows. There is a substantial difference between the patterns of virtual water trade sourced from potable urban water supplies versus agricultural and other self-supplied water users, and the two should be treated separately in this type of analysis. The PMA’s municipalities are net virtual water importers from the entire nation, importing more virtual water than they export. However, within the PMA, communities take on different net virtual water flow balances with respect to commodity and labor flows. These differences yield four types of communities: “core”, “transitional core”, “bedroom”, and “agricultural edge”. Core communities such as Phoenix and Scottsdale are net virtual water importers in both commodities and labor, and are the most dependent on their neighbors’ water supplies. The net intra-metropolitan scale water footprint and the per-capita water consumption of core communities are larger than the direct water consumption alone indicates. Core communities are the net dependents and net beneficiaries of a hydro-economy that locates disproportionate water resource demands at the urban edge. The opposite is true for agricultural edge communities, such as Buckeye and Queen Creek, which hydro-economically subsidize the water demands of core communities. Transitional core and bedroom communities lie between core and edge communities on a spectrum.

4.2. Broader Implications

The high likelihood of drought in the Southwest [80] poses challenges to both the PMA economy, the water resources system at multiple scales, and regional water resource management [81]. Each municipality within the PMA can plan for drought and long-term water scarcity, but the economic effectiveness of drought planning is manifest primarily at the scale of the metropolitan area and State of Arizona, not the individual municipality, due to the high degree of intra-metropolitan and regional virtual water circularity revealed by our analysis. The impacts of water rationing, curtailment of water supply, or the failure of water infrastructure within one municipality will cascade throughout the metropolitan area’s hydro-economy, affecting the nearest and strongest neighbors first. Core communities tend to have strong economic and water rights positions, and are much more insulated from the effects of drought than the bedroom and edge communities on which they are hydro-economically dependent. This high degree of hydro-economic dependency of core communities on their hydro-economically weaker bedroom communities may be a serious blind spot in the water resource sustainability and resilience strategies of the prominent core municipalities throughout the world.
One strategy for municipalities to enhance hydro-economic sustainability and resilience is to pursue public/private policies of a more spatially and hydrologically diversified indirect water supply chain, and one sourced to less drought-prone and less water-stressed geographies. This strategy adds an indirect supply chain component that complements the traditional approach to urban water supply policy that emphasizes water efficiency and multiple redundant physical water sources. Another strategy is for core municipalities to more actively cooperate with bedroom and edge municipalities on issues of water rights, water infrastructure investment, and water allocation policy to ensure that the entire metropolitan area is hydro-economically secure. This paper shows that from a hydro-economic perspective, the 25 municipalities of the PMA function as an interdependent whole. In view of likely drought, it might benefit the municipalities to pursue infrastructure and policy that recognizes this fact.
Each type of community is likely to have a distinct point of view with respect to cooperative water policy, and may follow its interests in choosing to acknowledge or discount the indirect component of the intra-metropolitan water footprint. Core communities benefit the most from positive externalities and a lower apparent water footprint by neglecting the indirect dependency, and are less likely to see that cooperation with other communities on water infrastructure investment is in their best interest. Edge communities have the strongest interest in adopting a complete water footprint balance because they are important providers of water-derived goods and services and have a net water footprint that is lower than is at first apparent. However, because edge communities are the most vulnerable to disruptions in water supply due to their junior water rights, limited economic and political power, and their relatively water-intensive economies, and because core communities depend on them, there is a shared interest in using this information to guide cooperative water policy and investment.
Intra-metropolitan scale virtual water flows are fundamentally different from international virtual water flows in that they are usually direct substitutes for physical water flows [82], in that the water involved could be physically reallocated to the other side of a municipal boundary if a different physical water infrastructure or water allocation were in place. The PMA’s municipalities are dependent on shared physical water resources—the Colorado River, the Salt and Verde Rivers, and groundwater—that are divided among the municipalities by codified legal water rights. Intra-metropolitan virtual water flows occur at hydrologically co-located scales, but the metropolitan region’s physical water infrastructure and legal rights to water divide the physical water resource into multiple separate stocks. These multiple water stocks can suffer from different levels of stress, scarcity, or disruption that are created by differences in investment and water rights, rather than hydrological differences. These differences between municipalities’ water stress, scarcity, and disruption risks are the direct result of water policy, law, and investment, and can therefore be solved by the same means.
Virtual water embedded in the labor market is unique because, unlike commodities, skilled labor tends to be relatively expensive and also a specific factor input (that is, an input without substitutes) associated with a metropolitan area’s domain of specialization as a “cluster” of expertise and leadership in the service and high value manufacturing sectors of the global economy [83]. Virtual water in labor is the key linkage between the Industrial and Commercial (IC) and Residential (R) segments of the across municipal water supply across municipalities. Commodities tend to be less expensive per unit of virtual water (e.g., a lower value intensity), and are more mobile, and can therefore be more readily outsourced to hydrologically diverse and distant suppliers that are not direct rivals for the city’s direct local physical water resource. Cities can much more easily outsource their water-intensive agricultural commodity supply chain than the skilled labor underlying a city’s economic competitive advantages in the global economy. Owing to this dynamic, it is predictable that intra-metropolitan virtual water embedded in labor will tend to become more strategically important and impactful on water supply planning relative to agricultural commodities as cities grow. Therefore, in a future of water scarcity, bedroom communities will likely have an enhanced future strategic role and value within the metropolitan area’s hydro-economy, and agricultural type edge communities likely have a diminished role if municipalities in the metropolitan area pursue agricultural to urban water transfers are used as a policy to free up local water supplies. However, while the relative importance of city types will likely change over time, the sustainability of the PMA relies upon the coordination of water policies amongst municipality types because virtual water outsourcing at the intra-metropolitan area scale is a direct substitute for physical water allocation.
Local water scarcity holds the potential to fundamentally restructure the local labor market and the greater, national commodity flow network. For example, drought in the US Southwest may increase the distance some commodities travel between their origin and destination in order access virtual water outside of the Colorado River Basin, increasing transportation fuel consumption (which will increase the greenhouse gas intensity of domestic freight, and other negative externalities that arise from freight movements, e.g., NOx, SOx, and PM2.5 emissions), creating potential long-term, unintended negative externalities. Therefore, while drought is a local phenomenon, the full impact of water stress, restructuring the labor and commodity network, will emerge at the national-level, with impacts propagating through a hydro-economic network where metropolitan areas are the most critical hubs.
We have shown that municipalities and their potable water supply systems are highly interdependent via hydro-economic connections, and that information about urban water footprints and virtual water flows within a metropolitan area can be used to directly inform municipal water supply policy and infrastructure investment. While the purview of a municipal water manager is within the boundary of the municipality’s potable water distribution system [17], economic development relies upon the strength of the region and thus the water management of all metropolitan area municipalities. A well-managed, sustainable, and resilient water supply system and water resources portfolio not only benefits the individual municipality, but also the entire metropolitan area.

Supplementary Files

Supplementary File 1

Acknowledgments

The authors acknowledge funding from the U.S. National Science Foundation via the Central Arizona-Phoenix Long-Term Ecological Research (CAP-LTER, CAP3) grant BCS-1026865, and the Global Sustainability Solutions Services at the Rob and Melani Walton Sustainability Solutions Services Initiatives. The authors acknowledge data from the National Water Economy Database (NWED) of the United States, and collaborative support from the National Water Economy Project (NWEP). The authors acknowledge helpful input from Doug Toy of the City of Chandler, Arizona. The views expressed are those of the authors, and not the funding agencies or acknowledged collaborators.

Author Contributions

Both authors contributed equally to this manuscript.

Conflicts of Interest

The authors declare no conflict of interest.

References

  1. Grimm, N.B.; Faeth, S.H.; Golubiewski, N.E.; Redman, C.L.; Wu, J.; Bai, X.; Briggs, J.M. Global Change and the Ecology of Cities. Science 2008, 319, 756–760. [Google Scholar] [CrossRef] [PubMed]
  2. Glaeser, E.L.; Kolko, J.; Saiz, A. Consumer City. J. Econ. Geogr. 2001, 1, 27–50. [Google Scholar] [CrossRef]
  3. Beaverstock, J.V.; Smith, R.G.; Taylor, P.J. World-City Network: A New Metageography? Annals Assoc. Am. Geogr. 2000, 90, 123–134. [Google Scholar] [CrossRef]
  4. Sassen, S. Cities in a World Economy; Sage Publications: Thousand Oaks, CA, USA, 2011. [Google Scholar]
  5. Sassen, S. The Global City: New York, London, Tokyo; Princeton University Press: Princeton, NJ, USA, 1991. [Google Scholar]
  6. Lo, C.; Yang, X. Drivers of Land-Use/Land-Cover Changes and Dynamic Modeling for the Atlanta, Georgia Metropolitan Area. Photogramm. Eng. Remote Sens. 2002, 68, 1073–1082. [Google Scholar]
  7. Mills, E.S. An Aggregative Model of Resource Allocation in a Metropolitan Area. Am. Econ. Rev. 1967, 57, 197–210. [Google Scholar]
  8. Batty, M. Polynucleated Urban Landscapes. Urban Stud. 2001, 38, 635–655. [Google Scholar] [CrossRef]
  9. Rinaldi, S.M.; Peerenboom, J.P.; Kelly, T.K. Identifying, Understanding, and Analyzing Critical Infrastructure Interdependencies. Control Syst. IEEE 2001, 21, 11–25. [Google Scholar] [CrossRef]
  10. Pederson, P.; Dudenhoeffer, D.; Hartley, S.; Permann, M. Critical Infrastructure Interdependency Modeling: A Survey of US and International Research. Available online: www5vip.inl.gov/technicalpublications/Documents/3489532.pdf (accessed on 26 June 2015).
  11. Roberts, M.J. River Basin Authorities: A National Solution to Water Pollution. Harv. Law Rev. 1970, 83, 1527–1556. [Google Scholar] [CrossRef]
  12. Davis, M.D. Integrated Water Resource Management and Water Sharing. J. Water Resour. Plan. Manag. 2007, 133, 427–445. [Google Scholar] [CrossRef]
  13. Giordano, M.A.; Wolf, A.T. Natural Resources Forum. In Sharing Waters: Post-Rio International Water Management; John Wiley & Sons: Hoboken, NJ, USA, 2003; pp. 163–171. [Google Scholar]
  14. Herman, J.D.; Zeff, H.B.; Reed, P.M.; Characklis, G.W. Beyond Optimality: Multistakeholder Robustness Tradeoffs for Regional Water Portfolio Planning under Deep Uncertainty. Water Resour. Res. 2014, 50, 7692–7713. [Google Scholar] [CrossRef]
  15. Kasprzyk, J.R.; Reed, P.M.; Kirsch, B.R.; Characklis, G.W. Managing Population and Drought Risks Using Many-Objective Water Portfolio Planning under Uncertainty. Water Resour. Res. 2009, 45, W12401. [Google Scholar] [CrossRef]
  16. Ruddell, B.L.; Adams, E.A.; Rushforth, R.; Tidwell, V.C. Embedded Resource Accounting for Coupled Natural-Human Systems: An Application to Water Resource Impacts of the Western US Electrical Energy Trade. Water Resour. Res. 2014, 50, 7957–7972. [Google Scholar] [CrossRef]
  17. Rushforth, R.R.; Adams, E.A.; Ruddell, B.L. Generalizing Ecological, Water and Carbon Footprint Methods and Their Worldview Assumptions Using Embedded Resource Accounting. Water Resour. Ind. 2013, 1, 77–90. [Google Scholar] [CrossRef]
  18. Kennedy, C.A.; Stewart, I.; Facchini, A.; Cersosimo, I.; Mele, R.; Chen, B.; Uda, M.; Kansal, A.; Chiu, A.; Kim, K.-G.; et al. Energy and Material Flows of Megacities. Proc. Natl. Acad. Sci. USA 2015, 112, 5985–5990. [Google Scholar] [CrossRef] [PubMed]
  19. Baum-Snow, N. Changes in Transportation Infrastructure and Commuting Patterns in US Metropolitan Areas, 1960–2000. Am. Econ. Rev. 2010, 100, 378–382. [Google Scholar] [CrossRef] [PubMed]
  20. Opie, K.; Rowinski, J.; Spasovic, L.N. Commodity-Specific Disaggregation of 2002 Freight Analysis Framework Data to County Level in New Jersey. Transp. Res. Record 2009, 2121, 128–134. [Google Scholar] [CrossRef]
  21. Hoff, H.; Döll, P.; Fader, M.; Gerten, D.; Hauser, S.; Siebert, S. Water Footprints of Cities—Indicators for Sustainable Consumption and Production. Hydrol. Earth Syst. Sci. 2014, 18, 213–226. [Google Scholar] [CrossRef]
  22. Jenerette, G.D.; Wu, W.; Goldsmith, S.; Marussich, W.A.; Roach, W.J. Contrasting Water Footprints of Cities in China and the United States. Ecol. Econ. 2006, 57, 346–358. [Google Scholar] [CrossRef]
  23. Vanham, D.; Bidoglio, G. The Water Footprint of Milan. Water Sci. Technol. 2014, 69, 789–795. [Google Scholar] [CrossRef] [PubMed]
  24. Dalin, C.; Konar, M.; Hanasaki, N.; Rinaldo, A.; Rodriguez-Iturbe, I. Evolution of the Global Virtual Water Trade Network. Proc. Natl. Acad. Sci. USA 2012, 109, 5989–5994. [Google Scholar] [CrossRef] [PubMed]
  25. Suweis, S.; Konar, M.; Dalin, C.; Hanasaki, N.; Rinaldo, A.; Rodriguez-Iturbe, I. Structure and Controls of the Global Virtual Water Trade Network. Geophys. Res. Lett. 2011. [Google Scholar] [CrossRef]
  26. Patterson, W.; Rushforth, R.; Ruddell, B.L.; Ikechukwu, C.; Gironás, J.; Konar, M.; Mijic, A.; Mejia, A. Water Footprint of Cities: A Review and Suggestions for Future Research. Sustainability 2015, in press. [Google Scholar]
  27. Liu, J.; Mooney, H.; Hull, V.; Davis, S.J.; Gaskell, J.; Hertel, T.; Lubchenco, J.; Seto, K.C.; Gleick, P.; Kremen, C. Systems Integration for Global Sustainability. Science 2015, 347. [Google Scholar] [CrossRef] [PubMed]
  28. Seto, K.C.; Reenberg, A.; Boone, C.G.; Fragkias, M.; Haase, D.; Langanke, T.; Marcotullio, P.; Munroe, D.K.; Olah, B.; Simon, D. Urban Land Teleconnections and Sustainability. Proc. Natl. Acad. Sci. USA 2012, 109, 7687–7692. [Google Scholar] [CrossRef] [PubMed]
  29. White, D.D.; Withycombe Keeler, L.; Wiek, A.; Larson, K.L. Envisioning the Future of Water Governance: A Survey of Central Arizona Water Decision Makers. Environ. Prac. 2015, 17, 25–35. [Google Scholar] [CrossRef]
  30. U.S. Census Bureau Population Division. Table 1. Annual Estimates of the Population of Metropolitan and Micropolitan Statistical Areas: 1 April 2010 to 1 July 2011 (CBSA-EST2011-01). Avaiable online: https://www.census.gov/popest/data/metro/totals/2011/ (accessed on 2 December 2014).
  31. Zients, J. Omb Bulletin No. 13–01: Revised Delineations of Metropolitan Statistical Areas, Micropolitan Statistical Areas, and Combined Statistical Areas, and Guidance on Uses of the Delineations of These Areas; Office of Management and Budget: Washington, DC, USA, 2013. [Google Scholar]
  32. Sampson, D.A.; Escobar, V.; Tschudi, M.K.; Lant, T.; Gober, P. A Provider-Based Water Planning and Management Model—Watersim 4.0—for the Phoenix Metropolitan Area. J. Environ. Manag. 2011, 92, 2596–2610. [Google Scholar] [CrossRef] [PubMed]
  33. U.S. Census Buearu. 2010 Census of Population and Housing, Population and Housing Unit Counts, Cph-2–1, United States Summary. U.S.; Government Printing Office: Washington, DC, USA, 2012. [Google Scholar]
  34. Harlan, S.L.; Yabiku, S.T.; Larsen, L.; Brazel, A.J. Household Water Consumption in an Arid City: Affluence, Affordance, and Attitudes. Soc. Nat. Resour. 2009, 22, 691–709. [Google Scholar] [CrossRef]
  35. Ouyang, Y.; Wentz, E.A.; Ruddell, B.L.; Harlan, S.L. A Multi-Scale Analysis of Single-Family Residential Water Use in the Phoenix Metropolitan Area. JAWRA 2014, 50, 448–467. [Google Scholar] [CrossRef]
  36. Tian, G.; Ouyang, Y.; Quan, Q.; Wu, J. Simulating Spatiotemporal Dynamics of Urbanization with Multi-Agent Systems—A Case Study of the Phoenix Metropolitan Region, USA. Ecol. Model. 2011, 222, 1129–1138. [Google Scholar] [CrossRef]
  37. Southworth, F.; Davidson, D.; Hwang, H.; Peterson, B.E.; Chin, S. The Freight Analysis Framework, Version 3: Overview of the FAF3 National Freight Flow Tables. Available online: http://www.faf.ornl.gov/fafweb/Data/FAF3ODCMOverview.pdf (accessed on 2 December 2014).
  38. U.S. Census Buearu. 2007 Commodity Flow Survey Standard Classification of Transported Goods (Sctg), Sctg Commodity Codes, Cfs-1200. Available online: https://www.census.gov/svsd/www/cfsdat/cfs071200.pdf (accessed on 2 December 2014).
  39. Dang, Q.; Lin, X.; Konar, M. Agricultural Virtual Water Flows within the United States. Water Resour. Res. 2015, 51, 973–986. [Google Scholar] [CrossRef]
  40. Mahmoudifard, S.M.; Ko, S.; Mohammadian, K. Assessing Sustainable Freight Policies. Available online: https://www.census.gov/svsd/www/cfsdat/cfs071200.pdf (accessed on 26 June 2014).
  41. U.S. Census Buearu. American Community Survey, 2010, 2008–2012 American Community Survey 5-Year Estimates, Table DP-03; Generated by Richard Rushforth. Using American Factfinder. Avaiable online: http://factfinder2.census.gov (accessed on 2 December 2014).
  42. USDA NASS. 2007 Census of Agriculture, Quick Stats. Avaiable online: http://quickstats.nass.usda.gov/ (accessed on 2 December 2014).
  43. Kenny, J.F.; Barber, N.L.; Hutson, S.S.; Linsey, K.S.; Lovelace, J.K.; Maupin, M.A. Estimated Use of Water in the United States in 2005. Available online: http://www.pubs.usgs.gov/circ/1344/pdf/c1344.pdf (accessed on 3 September 2014).
  44. Viswanathan, K.; Beagan, D.; Mysore, V.; Srinivasan, N. Disaggregating Freight Analysis Framework Version 2 Data for Florida: Methodology and Results. Transp. Res. Record 2008, 2049, 167–175. [Google Scholar] [CrossRef]
  45. Bujanda, A.; Villa, J.; Williams, J. Development of Statewide Freight Flows Assignment Using the Freight Analysis Framework (FAF 3). J. Behav. Econ. Finan. Entrep. Account. Transp. 2014, 2, 47–57. [Google Scholar]
  46. Harris, G.A.; Anderson, M.D.; Farrington, P.A.; Schoening, N.C.; Swain, J.J.; Sharma, N.S. Developing Freight Analysis Zones at a State Level: A Cluster Analysis Approach. J. Transp. Res. Forum 2012, 49, 59–68. [Google Scholar] [CrossRef]
  47. De Jong, G.; Gunn, H.; Walker, W. National and International Freight Transport Models: An Overview and Ideas for Future Development. Trans. Rev. 2004, 24, 103–124. [Google Scholar]
  48. U.S. Census Bureau. Workforce Indicators Data. Longitudinal-Employer Household Dynamics Program. x . Avaiable online: http://qwiexplorer.ces.census.gov (accessed on 2 December 2014).
  49. U.S. Census Bureau, 2006–2010 American Community Survey 5-Year Estimates. Avaiable online: https://www.census.gov/hhes/commuting/data/acs2006_2010.html (accessed on 2 December 2014).
  50. Thorsen, I.; Gitlesen, J.P. Empirical Evaluation of Alternative Model Specifications to Predict Commuting Flows. J. Reg. Sci. 1998, 38, 273–292. [Google Scholar] [CrossRef]
  51. Maricopa County Air Quality Department. Trip Reduction Program Annual Report 2010; Maricopa County Air Quality Department: Phoenix, AZ, USA, 2011. [Google Scholar]
  52. Arizona Department of Water Resources. Notification of 2009 Gallons Per Capita Per Day (Gpcd) and Lost and Unaccounted (L&U) for Water Percentages. (Report Nunber: 56-002025.0000); Arizona Department of Water Resources: Phoenix, AZ, USA, 2011. [Google Scholar]
  53. Arizona Department of Water Resources. Notification of 2009 Gallons Per Capita Per Day (Gpcd) and Lost and Unaccounted (L&U) for Water Percentages. (Report Number: 56-002019.0000); Arizona Department of Water Resources: Phoenix, AZ, USA, 2011. [Google Scholar]
  54. Arizona Department of Water Resources. Notification of 2009 Gallons Per Capita Per Day (Gpcd) and Lost and Unaccounted (L&U) for Water Percentages. (Report Number: 56-002021.0000); Arizona Department of Water Resources: Phoenix, AZ, USA, 2011. [Google Scholar]
  55. Arizona Department of Water Resources. Notification of 2009 Gallons Per Capita Per Day (Gpcd) and Lost and Unaccounted (L&U) for Water Percentages. (Report Number: 56-002006.0000); Arizona Department of Water Resources: Phoenix, AZ, USA, 2011. [Google Scholar]
  56. Arizona Department of Water Resources. Notification of 2009 Gallons Per Capita Per Day (Gpcd) and Lost and Unaccounted (L&U) for Water Percentages. (Report Number: 56-002008.0000); Arizona Department of Water Resources: Phoenix, AZ, USA, 2011. [Google Scholar]
  57. Arizona Department of Water Resources. Notification of 2009 Gallons Per Capita Per Day (Gpcd) and Lost and Unaccounted (L&U) for Water Percentages. (Report Number: 56-002009.0000); Arizona Department of Water Resources: Phoenix, AZ, USA, 2011. [Google Scholar]
  58. Arizona Department of Water Resources. Notification of 2009 Gallons Per Capita Per Day (Gpcd) and Lost and Unaccounted (L&U) for Water Percentages. (Report Number: 56–002017.0000); Arizona Department of Water Resources: Phoenix, AZ, USA, 2011. [Google Scholar]
  59. Arizona Department of Water Resources. Notification of 2009 Gallons Per Capita Per Day (Gpcd) and Lost and Unaccounted (L&U) for Water Percentages. (Report Number: 56–002018.0000); Arizona Department of Water Resources: Phoenix, AZ, USA, 2011. [Google Scholar]
  60. Arizona Department of Water Resources. Notification of 2009 Gallons Per Capita Per Day (Gpcd) and Lost and Unaccounted (L&U) for Water Percentages. (Report Number: 56–001355.0000); Arizona Department of Water Resources: Phoenix, AZ, USA, 2011. [Google Scholar]
  61. Arizona Department of Water Resources. Notification of 2009 Gallons Per Capita Per Day (Gpcd) and Lost and Unaccounted (L&U) for Water Percentages. (Report Number: 56–002023.0000); Arizona Department of Water Resources: Phoenix, AZ, USA, 2011. [Google Scholar]
  62. Arizona Department of Water Resources. Notification of 2009 Gallons Per Capita Per Day (Gpcd) and Lost and Unaccounted (L&U) for Water Percentages. (Report Number: 56–0022254.0000); Arizona Department of Water Resources: Phoenix, AZ, USA, 2011. [Google Scholar]
  63. Arizona Department of Water Resources. Notification of 2009 Gallons Per Capita Per Day (Gpcd) and Lost and Unaccounted (L&U) for Water Percentages. (Report Number: 56–002027.0000); Arizona Department of Water Resources: Phoenix, AZ, USA, 2011. [Google Scholar]
  64. Arizona Department of Water Resources. Notification of 2009 Gallons Per Capita Per Day (Gpcd) and Lost and Unaccounted (L&U) for Water Percentages. (Report Number: 56–002029.0000); Arizona Department of Water Resources: Phoenix, AZ, USA, 2011. [Google Scholar]
  65. Arizona Department of Water Resources. Notification of 2009 Gallons Per Capita Per Day (Gpcd) and Lost and Unaccounted (L&U) for Water Percentages. (Report Number: 56–002030.0000); Arizona Department of Water Resources: Phoenix, AZ, USA, 2011. [Google Scholar]
  66. Arizona Department of Water Resources. Notification of 2009 Gallons Per Capita Per Day (Gpcd) and Lost and Unaccounted (L&U) for Water Percentages. (Report Number: 56–002032.0000); Arizona Department of Water Resources: Phoenix, AZ, USA, 2011. [Google Scholar]
  67. Arizona Department of Water Resources. Notification of 2009 Gallons Per Capita Per Day (Gpcd) and Lost and Unaccounted (L&U) for Water Percentages. (Report Number: 56–002020.0000); Arizona Department of Water Resources: Phoenix, AZ, USA, 2011. [Google Scholar]
  68. Arizona Department of Water Resources. Notification of 2009 Gallons Per Capita Per Day (Gpcd) and Lost and Unaccounted (L&U) for Water Percentages. (Report Number: 56–002037.0000); Arizona Department of Water Resources: Phoenix, AZ, USA, 2011. [Google Scholar]
  69. Arizona Department of Water Resources. Notification of 2009 Gallons Per Capita Per Day (Gpcd) and Lost and Unaccounted (L&U) for Water Percentages. (Report Number: 56–002038.0000); Arizona Department of Water Resources: Phoenix, AZ, USA, 2011. [Google Scholar]
  70. Arizona Department of Water Resources. Notification of 2009 Gallons Per Capita Per Day (Gpcd) and Lost and Unaccounted (L&U) for Water Percentages. (Report Number: 56–002039.0000); Arizona Department of Water Resources: Phoenix, AZ, USA, 2011. [Google Scholar]
  71. Arizona Department of Water Resources. Notification of 2009 Gallons Per Capita Per Day (Gpcd) and Lost and Unaccounted (L&U) for Water Percentages. (Report Number: 56–002344.0000); Arizona Department of Water Resources: Phoenix, AZ, USA, 2011. [Google Scholar]
  72. Arizona Department of Water Resources. Notification of 2009 Gallons Per Capita Per Day (Gpcd) and Lost and Unaccounted (L&U) for Water Percentages. (Report Number: 56–002043.0000); Arizona Department of Water Resources: Phoenix, AZ, USA, 2011. [Google Scholar]
  73. Arizona Department of Water Resources. Notification of 2009 Gallons Per Capita Per Day (Gpcd) and Lost and Unaccounted (L&U) for Water Percentages. (Report Number: 56–002044.0000); Arizona Department of Water Resources: Phoenix, AZ, USA, 2011. [Google Scholar]
  74. Town of Wickenburg. Town of Wickenburg, Arizona Comprehensive Annual Financial Report for the Year Ended 30 June 2012; Town of Wickenburg: Wickenburg, AZ, USA, 2012. Available online: http://gfoa.net/cafr/COA2012/WickenburgAZ.pdf (accessed on 2 December 2014).
  75. Aldaya, M.M.; Chapagain, A.K.; Hoekstra, A.Y.; Mekonnen, M.M. The Water Footprint Assessment Manual: Setting the Global Standard; Routledge: London, UK, 2012. [Google Scholar]
  76. Haas, W.; Krausmann, F.; Wiedenhofer, D.; Heinz, M. How Circular Is the Global Economy?: An Assessment of Material Flows, Waste Production, and Recycling in the European Union and the World in 2005. J. Ind. Ecol. 2015. [Google Scholar] [CrossRef]
  77. Mekonnen, M.M.; Hoekstra, A.Y. National Water Footprint Accounts: The Green, Blue and Grey Water Footprint of Production and Consumption, Volume 1: Main Report; UNESCO-IHE Institute for Water Eduation: Delft, The Netherlands, 2011. Available online: http://www.doc.utwente.nl/76913/1/Report50-NationalWaterFootprints-Vol1.pdf (accessed on 2 December 2014).
  78. Reimer, J.J. On the Economics of Virtual Water Trade. Ecol. Econ. 2012, 75, 135–139. [Google Scholar] [CrossRef] [Green Version]
  79. Kenessey, Z. The Primary, Secondary, Tertiary and Quaternary Sectors of the Economy. Rev. Income Wealth 1987, 33, 359–385. [Google Scholar] [CrossRef]
  80. Cook, B.I.; Ault, T.R.; Smerdon, J.E. Unprecedented 21st Century Drought Risk in the American Southwest and Central Plains. Sci. Adv. 2015, 1, e1400082. [Google Scholar] [CrossRef]
  81. Gober, P.; Kirkwood, C.W. Vulnerability Assessment of Climate-Induced Water Shortage in Phoenix. Proc. Natl. Acad. Sci. 2010, 107, 21295–21299. [Google Scholar] [CrossRef] [PubMed]
  82. Merrett, S. Virtual Water and the Kyoto Consensus. Water Int. 2003, 28, 540–542. [Google Scholar] [CrossRef]
  83. Samuelson, P.A. An Exact Hume-Ricardo-Marshall Model of International Trade. J. Int. Econ. 1971, 1, 1–18. [Google Scholar] [CrossRef]

