Article

Changing Patterns of Global Agri-Food Trade and the Economic Efficiency of Virtual Water Flows

Division of Bioeconomics, Department of Earth and Environmental Sciences, University of Leuven, Celestijnenlaan 300e, 3001 Heverlee, Belgium
*
Author to whom correspondence should be addressed.
Sustainability 2015, 7(5), 5542-5563; https://doi.org/10.3390/su7055542
Submission received: 25 February 2015 / Revised: 29 April 2015 / Accepted: 4 May 2015 / Published: 7 May 2015
(This article belongs to the Special Issue Water Footprints and Sustainable Water Allocation)

Abstract

:
International agri-food trade has expanded rapidly during the past decades and changed considerably in structure with important implications, especially for developing economies. One of the main environmental concerns regarding international trade is the exploitation and redistribution of water resources. In this paper, we use the virtual water approach for analyzing the relationship between global agri-food trade, its structure and virtual water flows in the period of 1986–2011. Specifically, for five regions and the world, we calculate growth rates of interregional trade values and virtual water volumes, the contribution of different product groups to trade and the economic water efficiency of imports and exports. Our findings show that, over time, trade values have generally increased more rapidly than virtual water volumes. In Africa and Southern America, virtual water outflows have roughly quadrupled since 1986. In all regions, staples and industrial products account for the largest share in virtual water trade. The recent shift towards high-value exports is beneficial for low-income countries from a regional economic water efficiency perspective due to high trade values and low associated virtual water volumes. Economic water efficiency of trade has increased in all regions since 2000 and the return to virtual water outflows is especially high in Europe.

1. Introduction

International trade in agricultural and food products has increased sharply during the past decades, mainly due to increased trade liberalization, population growth, urbanization and changing diets [1]. Between 1985 and 2011, the total value of agricultural exports has tripled in real terms, from around 250 billion USD to more than 750 billion USD, measured in constant 1990 prices [2]. Whereas European countries still account for the largest share of world food exports, other regions are increasingly included in global trade, and especially agri-food exports from low- and middle-income countries in Africa, Asia and South America are expanding rapidly. The sharp expansion of agri-food trade coincides with important changes in the structure of trade [3]. Globally, high-value food products (including fruits, vegetables, and products from animal origin) are gaining importance in total agri-food trade; their share in total agri-food export value increased from 32% in 1980 to 41% in 2010 [2]. At the same time, the importance of staple food products such as cereals and of traditional tropical commodities such as coffee and cocoa in overall food trade has decreased. The structure of agri-food exports changed most dramatically in low- and middle-income economies where high-value products replaced tropical commodities as the main agri-food export category [3,4,5,6]. The expansion of agri-food trade and the changing trade pattern have important implications, especially for developing countries [7,8,9].
Studies mainly point to positive welfare implications for developing economies. It has been argued that globalization in general and participation in international trade in particular lead to economic growth and poverty reduction in developing countries [10]. Trade in high-value food products has been argued to be particularly promising for fostering agricultural growth and rural development in low-income countries because of high revenues (relative to lower-value staple food and raw commodity exports) and labor-intensive production systems [4,9]. Most of the evidence on the beneficial effects of high-value trade comes from micro-economic studies. Recent empirical research has documented that the participation of smallholder farmers, in particular in high-value export chains, increases household and farm income [11,12]; reduces risk and income variability [13]; increases farm productivity [14]; spurs technology adoption and improves product quality [15]; and alleviates poverty and food insecurity [16,17].
Others have expressed concerns about expanding and changing global agri-food trade, especially about the increasing dependency of low-income countries, mainly from Africa, on imports of staple food products [18]. This might pose a threat to food security in these countries, especially in light of the 2008 food price spikes and the increased price volatility in food markets. In addition, increased reliance on staple food imports diverts investments away from domestic food sectors, which jeopardizes the much needed upgrading and modernization of staple and domestic food supply chains in developing countries [8,19,20,21,22].
In addition, there are various environmental concerns related to expanding and changing global agri-food trade. The most widely discussed environmental issue in this respect is carbon emissions [23,24]. The production and transportation of food are important components of global carbon emissions which gave rise to studies quantifying the carbon footprint of traded products, including food [25,26,27]. Research results indicate that, on a global level, food consumption accounts for 20% of greenhouse gas emissions [26], that the largest share of this comes from agricultural production and not from transportation of food products [27], and that emissions are increasingly transferred from developing to developed countries through trade [25]. A second environmental issue is the link between agri-food exports and the use of agro-chemicals. Some studies claim that increasing agricultural exports lead to increased use of pesticides and chemicals and thereby to adverse environmental effects [28,29]. Others have argued that export-oriented agri-food production is not necessarily more pesticide intensive than agri-food production for domestic markets, and that the comparison between higher-value pest-susceptible export crops and lower-value pest-resistant staple crops is not straightforward [30]. A third important environmental issue is the relation between agri-food trade and the exploitation of water resources, which is the subject of this paper. Agricultural production is intensive in water, accounting for around 70% of global freshwater withdrawals [31], and it has been estimated that 15% of the world’s agricultural water use is for export products [32]. Hence, agri-food trade has important consequences for the global redistribution of water. A number of studies have quantified hypothetical water flows between trading nations using the virtual water (VW) concept that has been introduced by Allan in studies on the possibility to relive water scarcity in the Middle East through cereal imports [33,34]. The notion of VW is based on the total volume of water that is consumed during the whole production process of a product and it has been estimated that there is an average VW flow of 1625 km3/year due to international trade [35]. Seventy-eight percent of this volume is related to trade in agricultural products [35]. Studies have analyzed the quantities and efficiency of VW trade on a global scale, mostly focusing on a specific year or using average trade volumes [36,37,38]. These show that international agricultural trade saves huge amounts of water due to trade flows from water-efficient to water-inefficient regions [37] and that the main contribution to these savings comes from trade in wheat and maize [38]. Dalin et al. [39] assess global VW flows over time and conclude that water savings due to international trade have increased. Carr et al. [40] assess the contribution of different commodity types to annual VW trade and find that the overall product composition remained relatively stable while total VW volumes have increased. Konar and Caylor [41] focus on staple food trade in Africa, finding a positive correlation between VW imports and human development. However, water use efficiency (i.e., the physical output produced per unit of water input) of staple crop exports from African countries does not increase with exports, contrary to global trends. Duarte, Pinilla and Serrano [42] show for the case of Spain that globalization has led to sharp increases in VW flows mainly due to increasing trade volumes and to a lesser extent due to a change towards more water-intensive products.
The aim of this paper is to examine the relationship between the changing composition of global agri-food trade, VW water flows and VW trade efficiency. We distinguish interregional agri-food trade patterns and VW flows for five world regions (Africa, Asia, Europe, Northern America and Southern America) and for four major product categories (animal products, high-value products, industrial products and staples) for the period of 1986 until 2011. This time span was chosen based on data availability but coincides with the period of major global trade increases and changes in trade patterns. We assess growth rates of trade values and related VW flows, the product composition of trade and the economic water efficiency of food imports and exports, i.e., the the money spent (earned) per unit of VW imported (exported). An innovative contribution of the paper is the comparison of trade values and VW flows, and the deduction and comparison across regions of the efficiency of VW flows. The analysis allows us to draw conclusions on the impact of expanding and changing global agri-food trade on global water resources and to derive which regions trade water most efficiently. The article is organized as follows. In the next section, the research results are presented. We first show interregional trade values and related VW flows for each of the five regions and the world in order to place the results further into context. This is followed by the annual growth rates of trade values and VW flows, and the product composition of trade. Finally, the annual economic water efficiency of interregional imports and exports is presented. Section 3 discusses the results. The methodology applied and the construction of the database are presented in detail in Section 4. Section 5 concludes.

2. Results

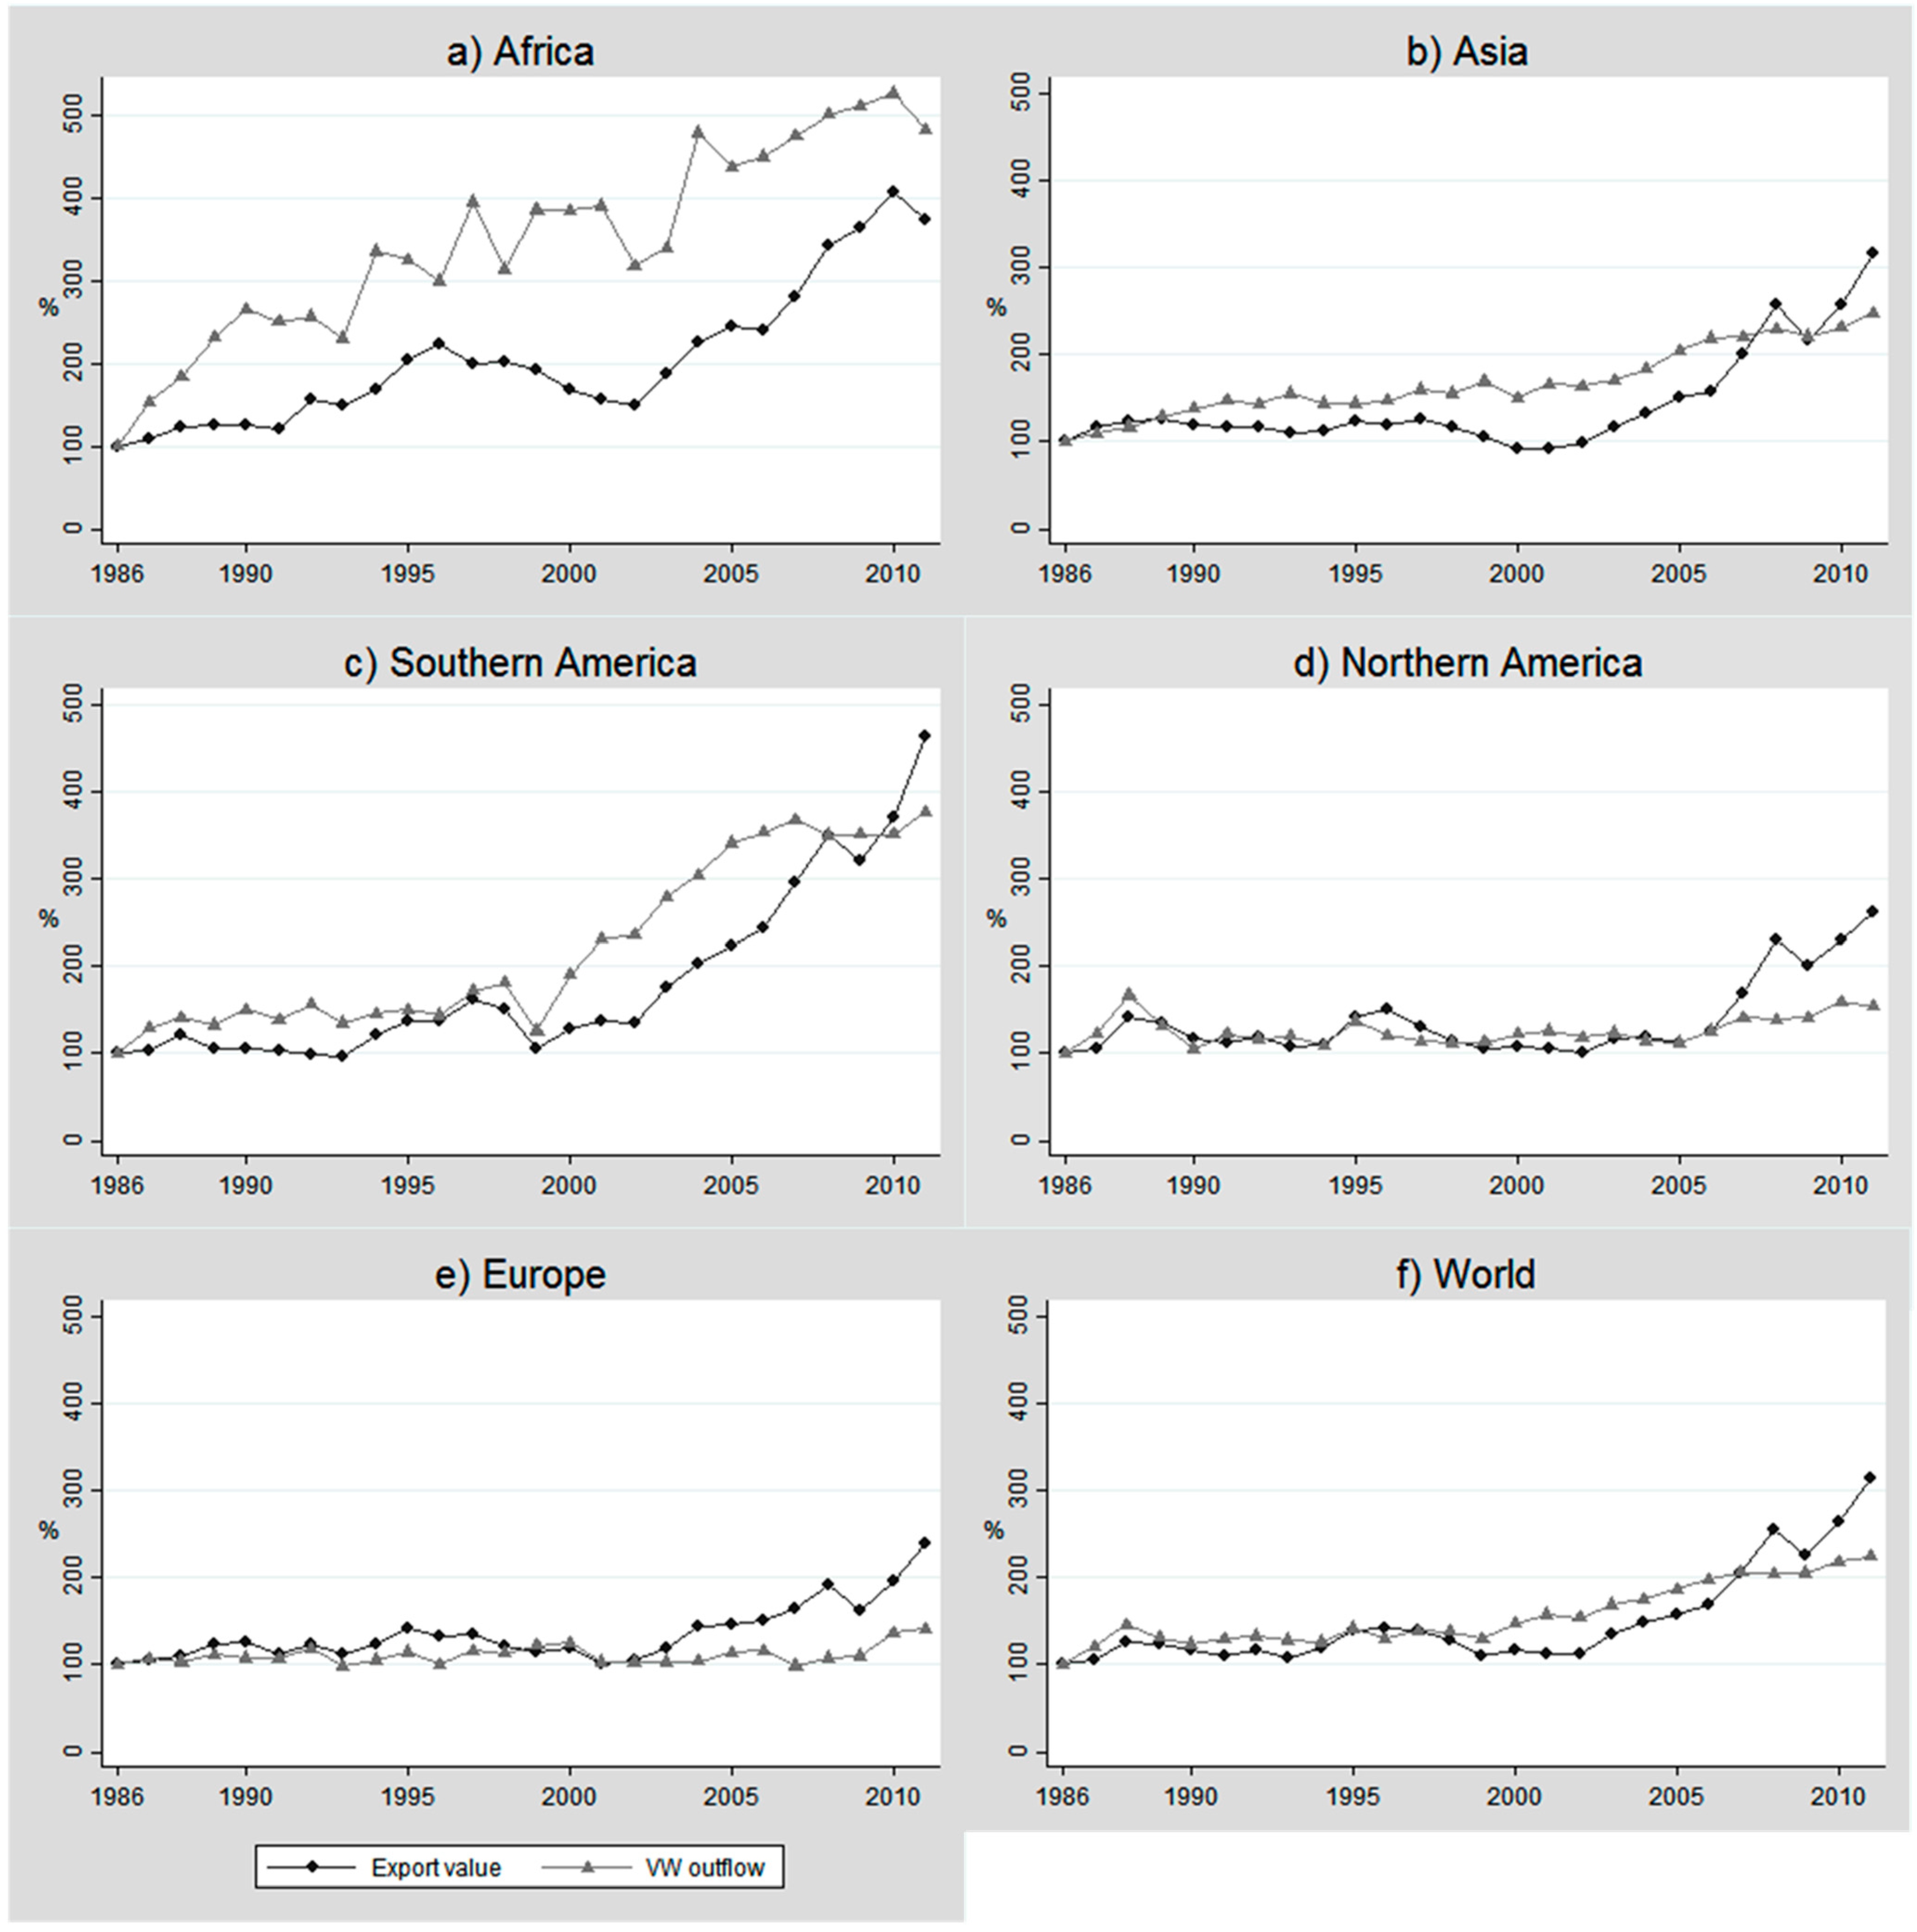
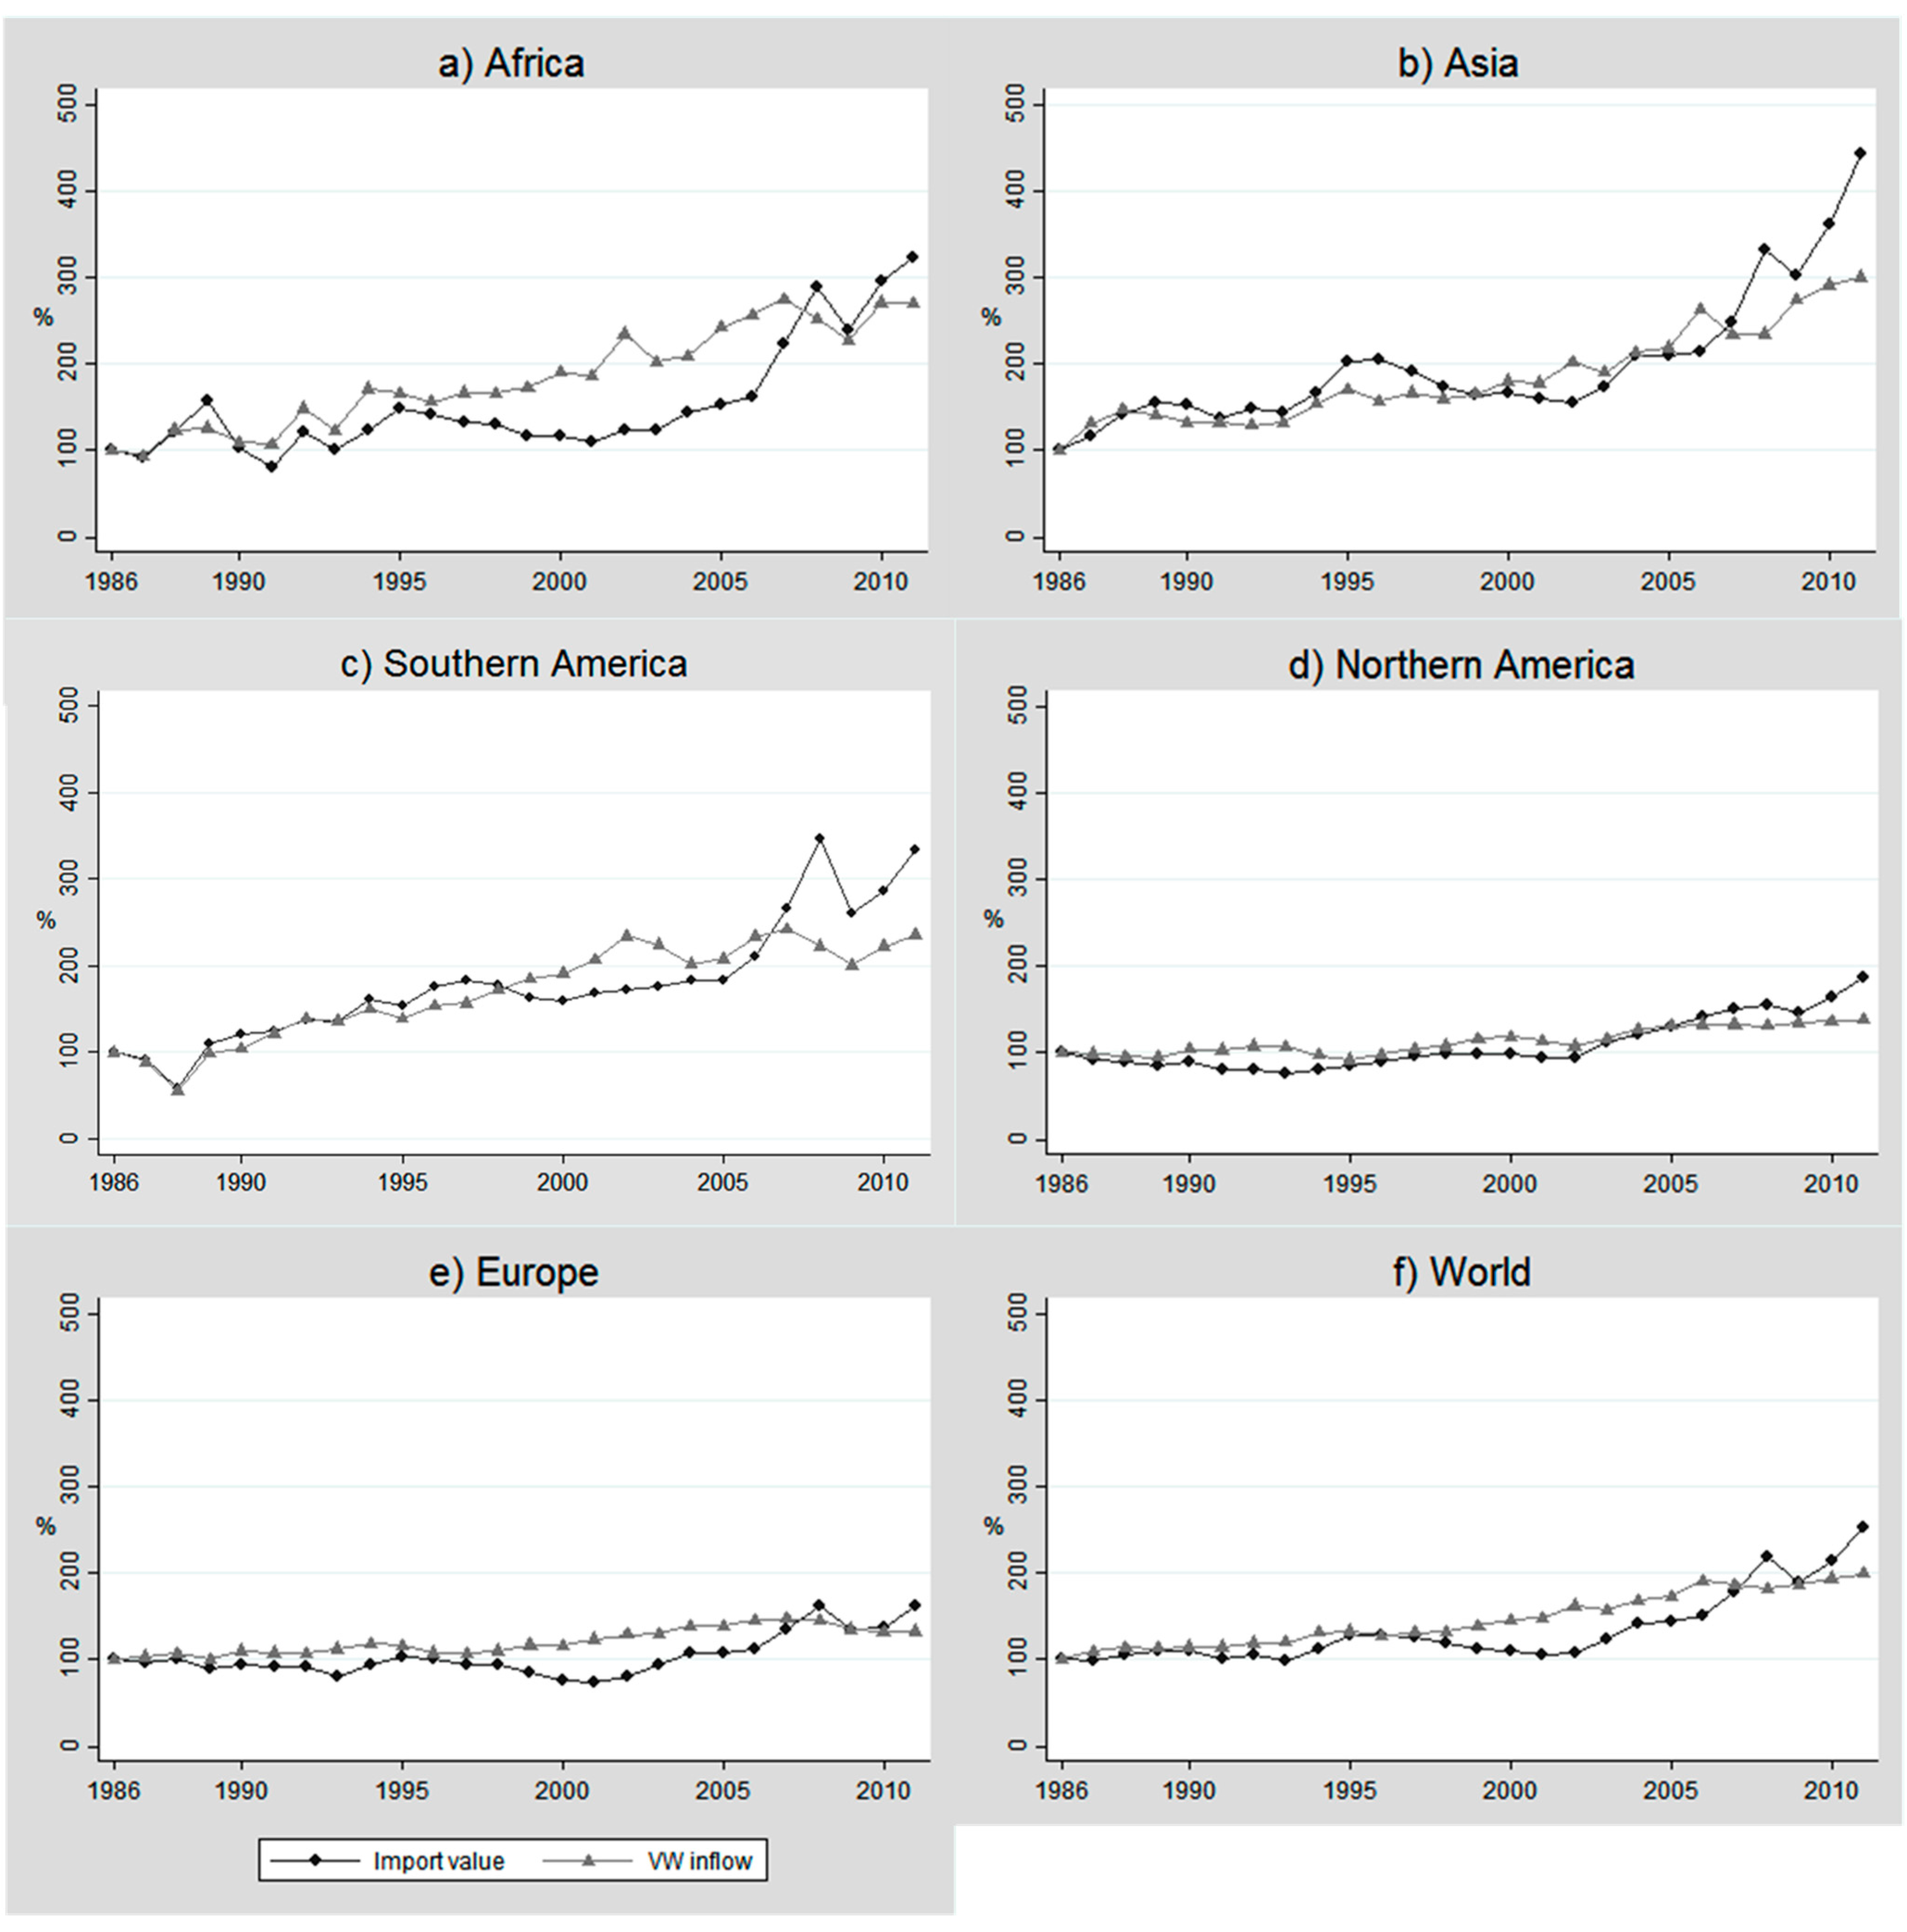
2.1. Interregional Trade and VW Flows

In Table 1, the total value of interregional agri-food exports and imports and the associated VW flows are given for the world and five regions, including Africa, Asia, Europe, Northern America and Southern America. In our analyses, we specifically focus on interregional trade to understand the VW flows between regions and we do not consider intraregional trade. We show figures for 1986 and 2011, the first and the last year of the period covered by our study. Trade values have been taken from FAOSTAT [2] and converted into constant 1990 prices in order to adjust for inflation. Trade values are reported in USD equivalents using annual average exchange rates in cases where countries report trade values in their national currency. VW flows have been calculated for each region as the sum of product trade flows multiplied with the respective annual product- and country-specific water footprint (WF) of production. WF values were adapted from Mekonnen and Hoekstra [43,44] (see Section 4.1 and Section 4.2 for details). Global values have been calculated by summing up the values of the five regions. Positive net export values signal that the region gains more from exports than it spends on imports. Positive net VW inflows signal that the VW inflows are higher than VW outflows. Figures need to be interpreted with care as the regions do not cover all countries and products but do cover the same countries and products in different years because of data limitations. The list of countries and products included in the analysis is provided in the supplementary information (SI) to this article.
Table 1. Interregional agri-food trade values (billion USD, constant 1990 prices) and associated VW flows (km3) per region and globally, 1986 and 2011.
Export ValueImport ValueNet Export ValueVW OutflowsVW InflowsNet VW Inflows
(Billion USD)(Billion USD)(Billion USD)(km3)(km3)(km3)
198620111986201119862011198620111986201119862011
Africa2.17.76.119.7−4.1−12.17.938.035.896.727.958.7
Asia9.028.321.595.1−12.5−66.860.2148.7129.9389.669.7240.9
Europe20.849.638.162.1−17.3−12.560.585.0192.4256.7132.0171.7
N-America26.769.922.842.83.927.1204.1314.671.098.2−133.0−216.3
S-America18.786.95.016.713.870.2105.4396.632.375.8−73.1−320.8
Global77.2242.393.5236.4−16.25.9438.0982.8461.5917.023.5−65.8
Africa is the region with the lowest agri-food export values and the lowest VW outflows. While African exports and imports, and associated VW flows, increased over the period 1986–2011, they remain low compared to the other regions. In Southern America, exports and VW outflows are 10 times higher than in Africa but imports and VW inflows are similar to Africa. VW outflows are the highest in Southern America, with almost 400 km3 of VW outflow in 2011, while VW inflows are the highest in Asia, with 390 km3 in 2011. Northern America ranks second in terms of VW outflows with 314 km3 in 2011 but VW inflows are rather small. In Europe and Asia, the VW inflows are substantially higher than the outflows. While the 2011 value of exports in Europe is almost twice as high as in Asia, the VW outflows from Europe are much lower than those of Asia. In Africa, Asia and Europe, agri-food imports are higher than exports making these regions net food importers and net importers of VW resources. Northern and Southern America, on the other hand, are net exporters of VW with net VW outflows of 216.3 km3 and 320.8 km3 in 2011, respectively. At the global level, we observe that imports are slightly higher than exports. This is mainly due to two reasons. First, export values are generally reported as Free-On-Board (FOB), i.e., insurance and transport costs are not included. Import values are reported as Cost-Insurance-Freight (CIF) and include insurance and transport costs. Hence, import values are generally higher than export values. Second, interregional trade flows include exports to and imports from countries which are not included in the regions (see Section 4 and the SI).
In Figure 1, we depict the growth in agri-food exports and associated VW outflows in the period 1986–2011 for the world and five regions. We use 1986 as the base year and index the export values and VW outflows in that year to 100%. The exports and VW flows for the other years are then expressed relative to the base year. In all regions, export values have increased in real terms over the period 1986–2011 with the sharpest increases since the year 2000. Related VW outflows have increased along with exports. Especially since 2005 onwards, the growth in VW outflows slowed downed in all regions and did not keep pace with the growth in export value that increased at a higher rate than VW outflows. The highest growth in agri-food exports and VW outflows happened in Africa and Southern America. In Africa, export values almost quadrupled between 1986 and 2011 while VW outflows increased almost fivefold. Africa is the only region where VW outflows increased more than the value of agri-food exports. In Southern America, export values nearly quintupled while VW outflows increased nearly fourfold. Most of the changes here happened after 2000. At first, VW outflows increased more rapidly than export values but this reversed in recent years. In Asia, a similar but less pronounced trend is observed with VW outflows growing faster than exports until 2000 and a reversal of this in recent years. Between 1986 and 2011, export values almost tripled and VW outflows increased to 228% of the volume of the base year. Europe and Northern America have experienced the slowest growth in agri-food exports and VW outflows. In both regions, exports more than doubled over the period while VW outflows increased with 40% to 50%. On a global level, the sharpest increases in export values are observed from 2002 onwards. Between 1986 and 2011, interregional export values have tripled and VW outflows have more than doubled.
In Figure 2, we depict the growth in agri-food imports and associated VW inflows in the period 1986–2011 for the world and five regions. Again, we use 1986 as the base year and index the imports and VW inflows in that year to 100%, and express values for the other years relative to the base year. In all regions, import values and VW inflows have increased over the period 1986–2011. The strongest increases are observed in Asia, Southern America and Africa. In Asia, the import value more than quadrupled while VW inflows tripled. In Southern America, the import value more than tripled while VW inflows doubled. In both regions, import values grew more rapidly than VW inflows, especially in recent years. In Africa, both import values and VW inflows roughly tripled. VW inflows grew at a higher rate than import values during the 1990s and early 2000s, but this difference disappeared in recent years. Europe and Northern America have experienced the slowest growth in agri-food imports (63% and 88%, respectively) and VW inflows (33% and 38%, respectively) in the period 1986–2011, and in both regions VW inflows have grown slightly less rapidly than import values. Globally, interregional import values in 2011 amounted to 253% of the 1986 value and related VW inflows have doubled.
Figure 1. Growth in agri-food export values and VW outflows per region and globally. Values are indexed to 100% for the base year 1986.
Sustainability 07 05542 g001
Figure 2. Growth in agri-food import value and VW inflows per region and globally. Values are indexed to 100% for the base year 1986.
Sustainability 07 05542 g002

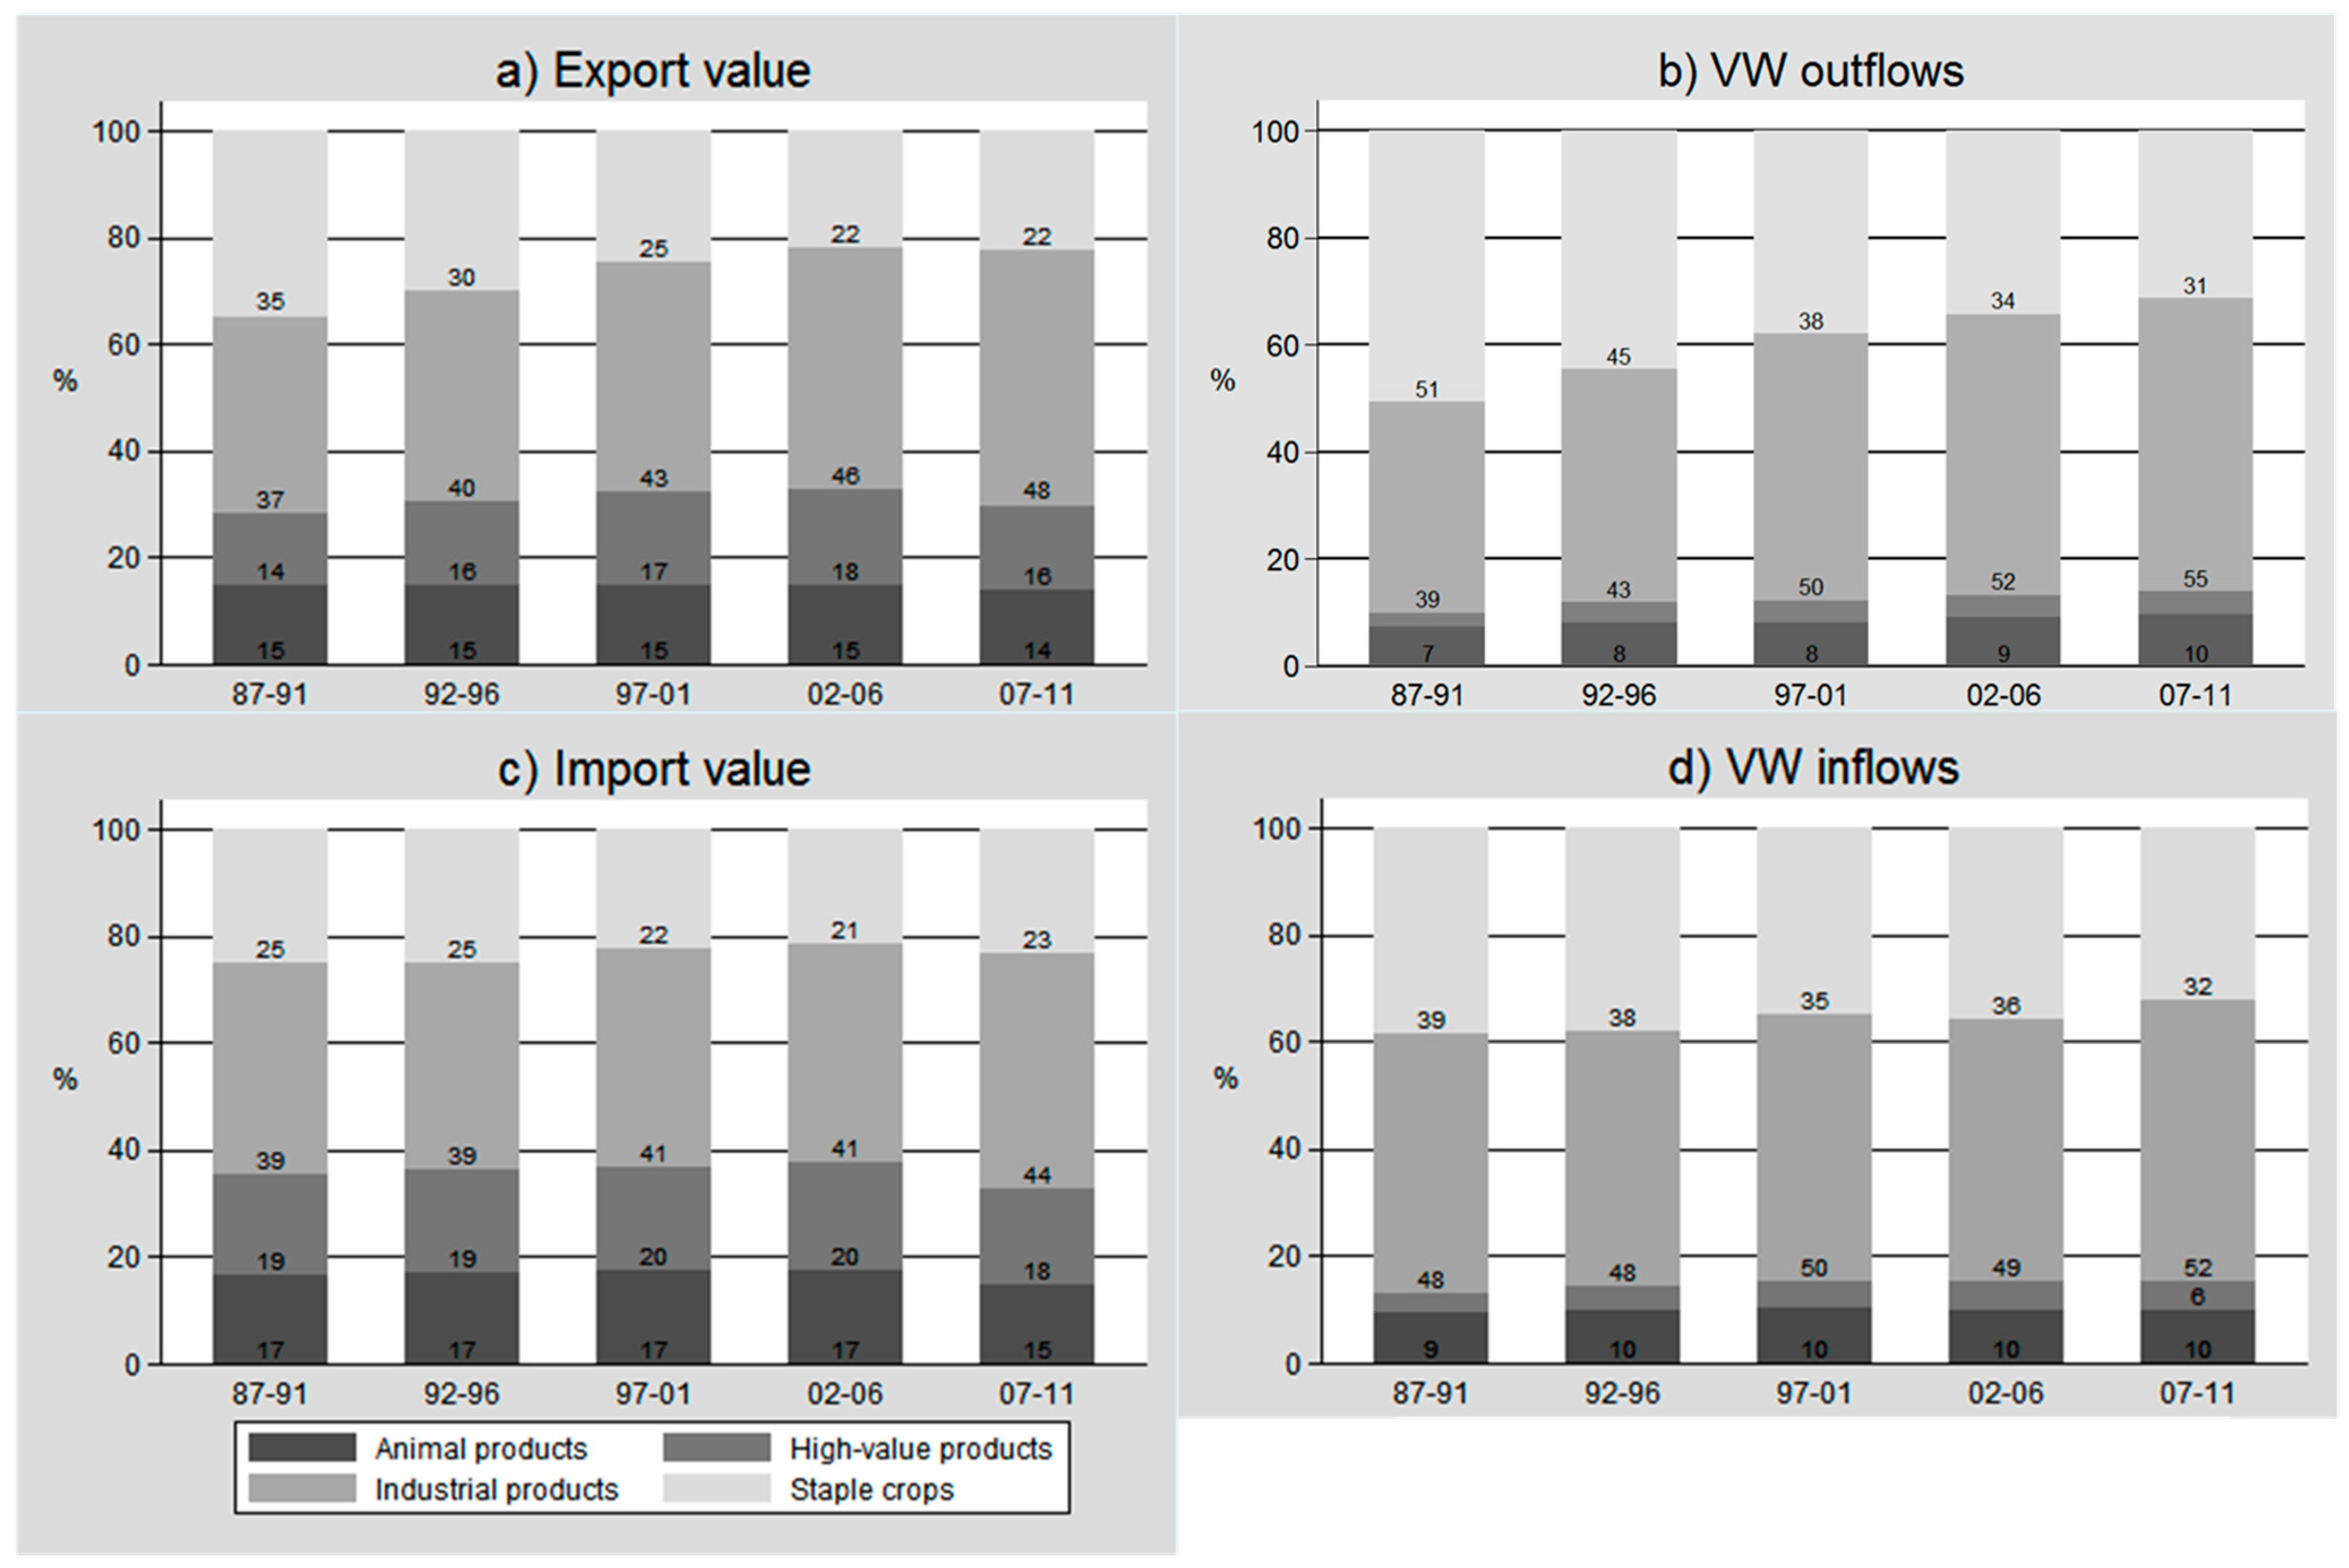
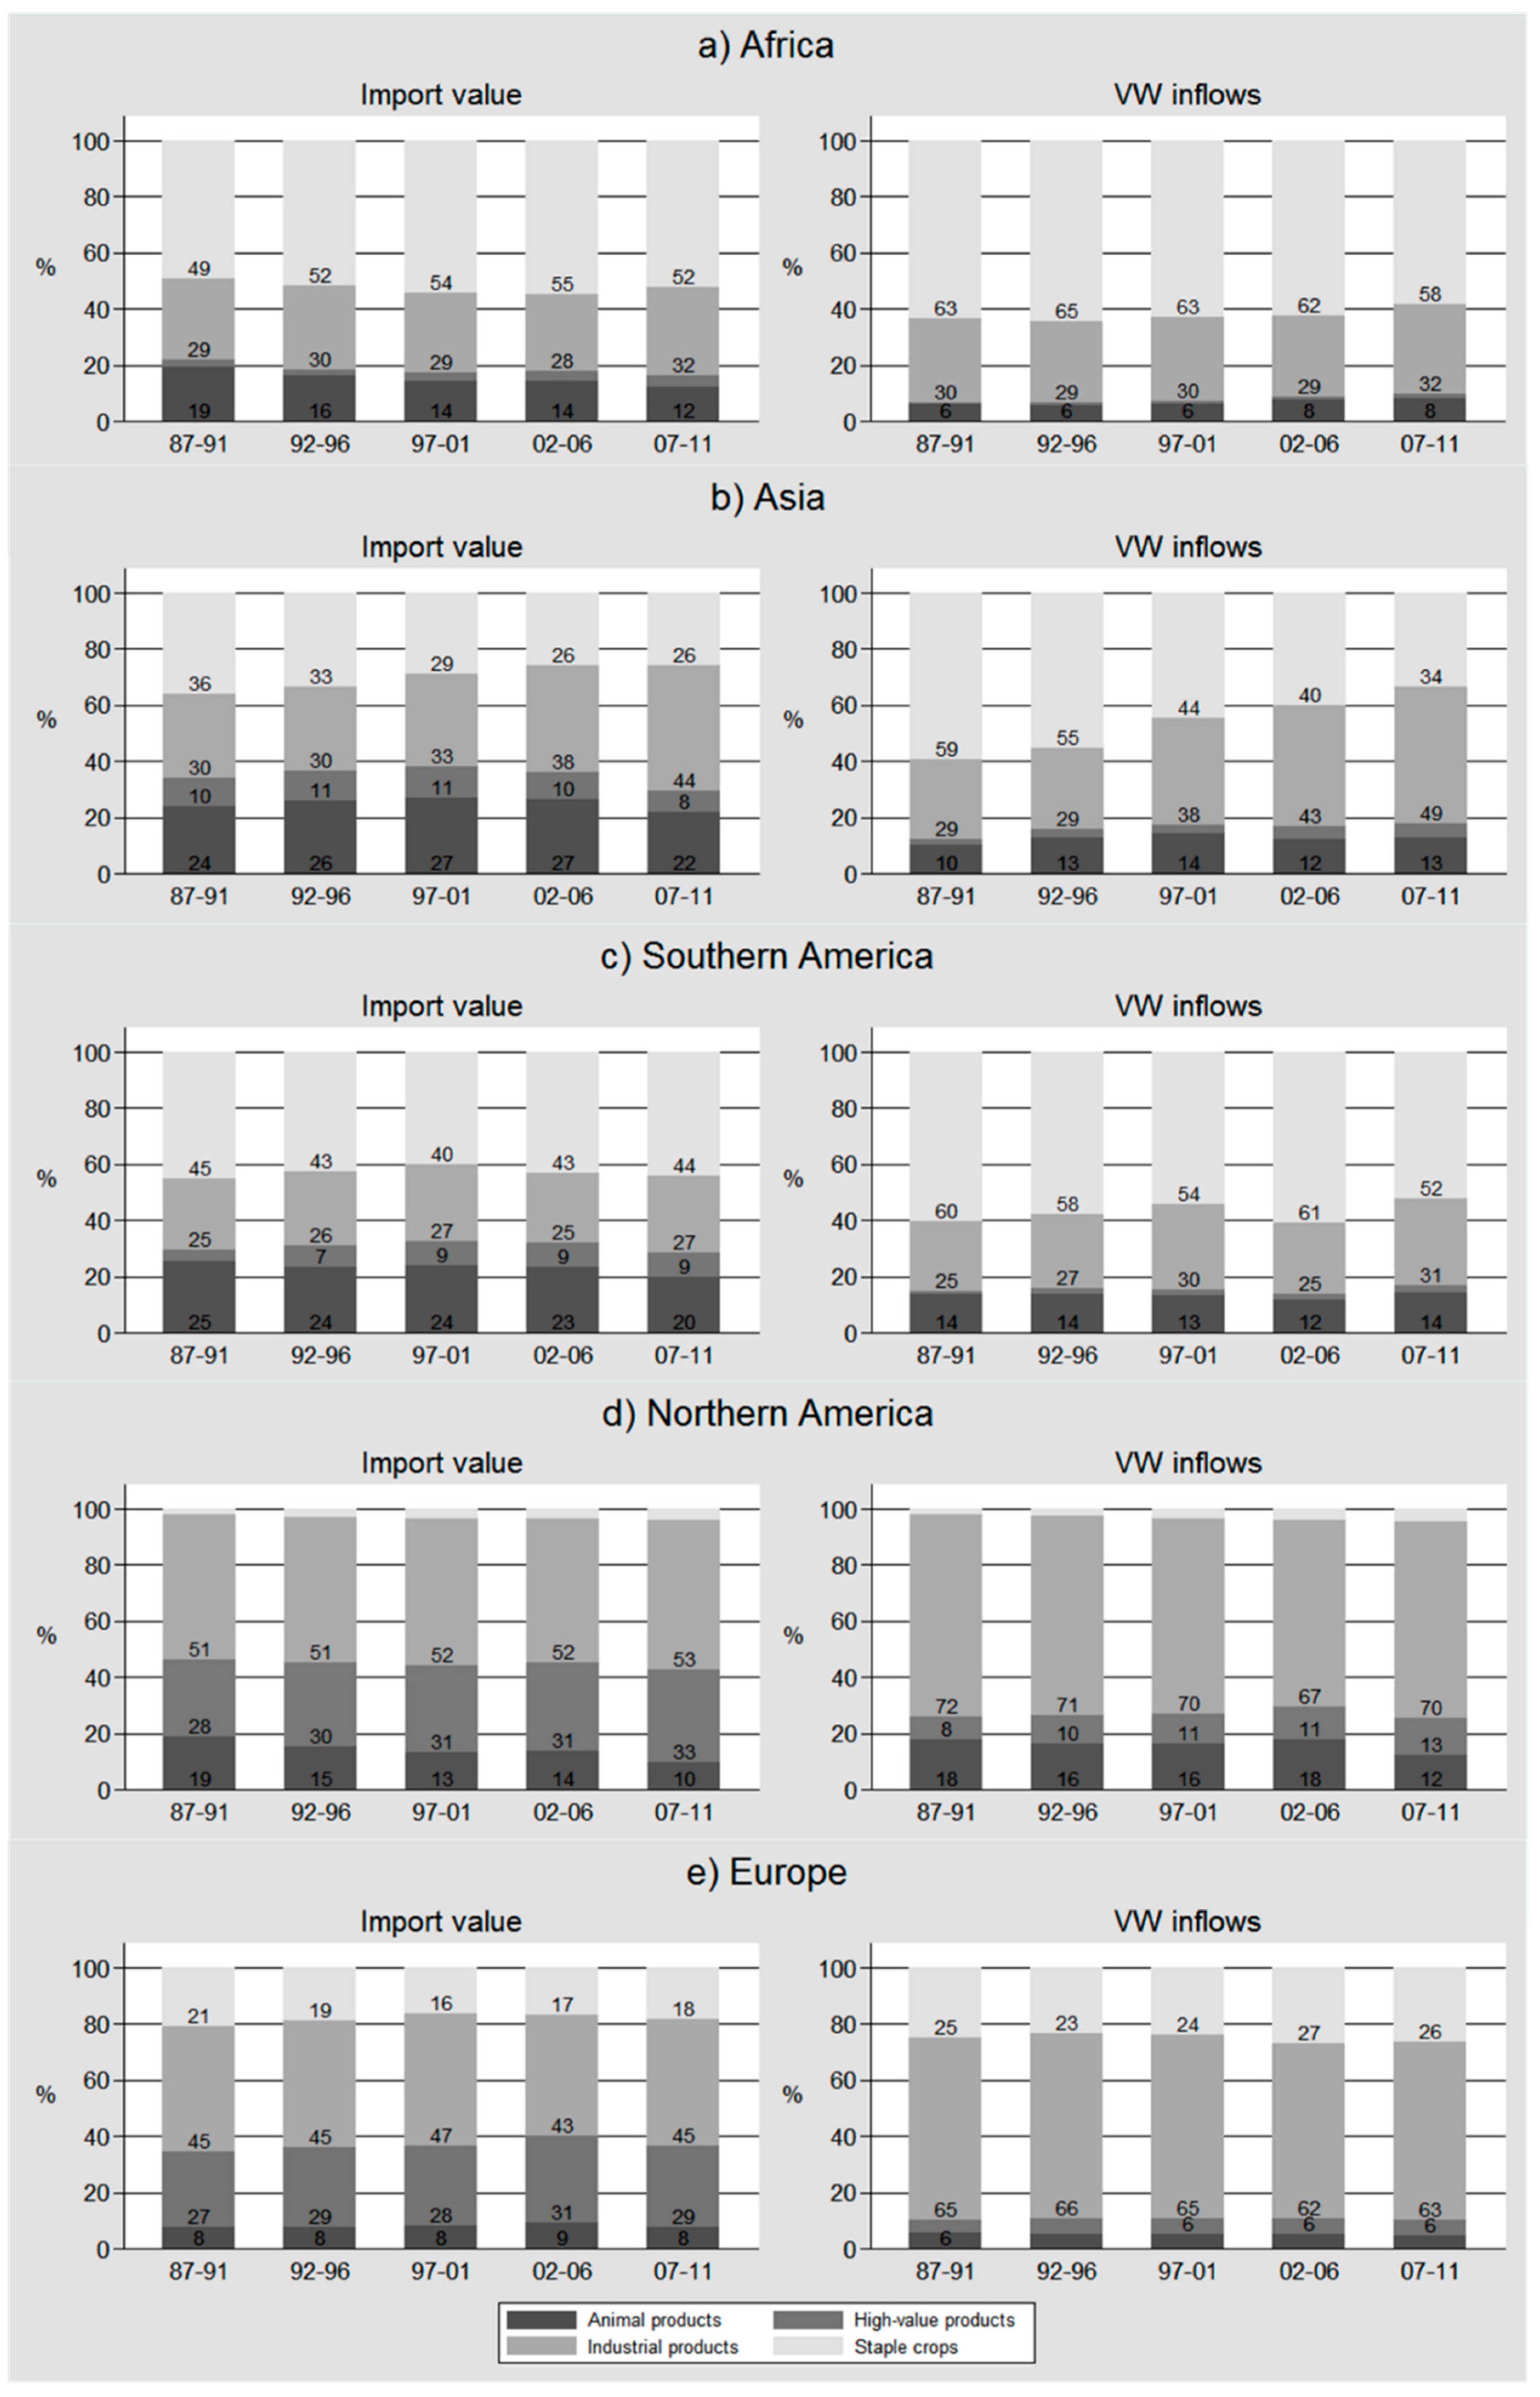
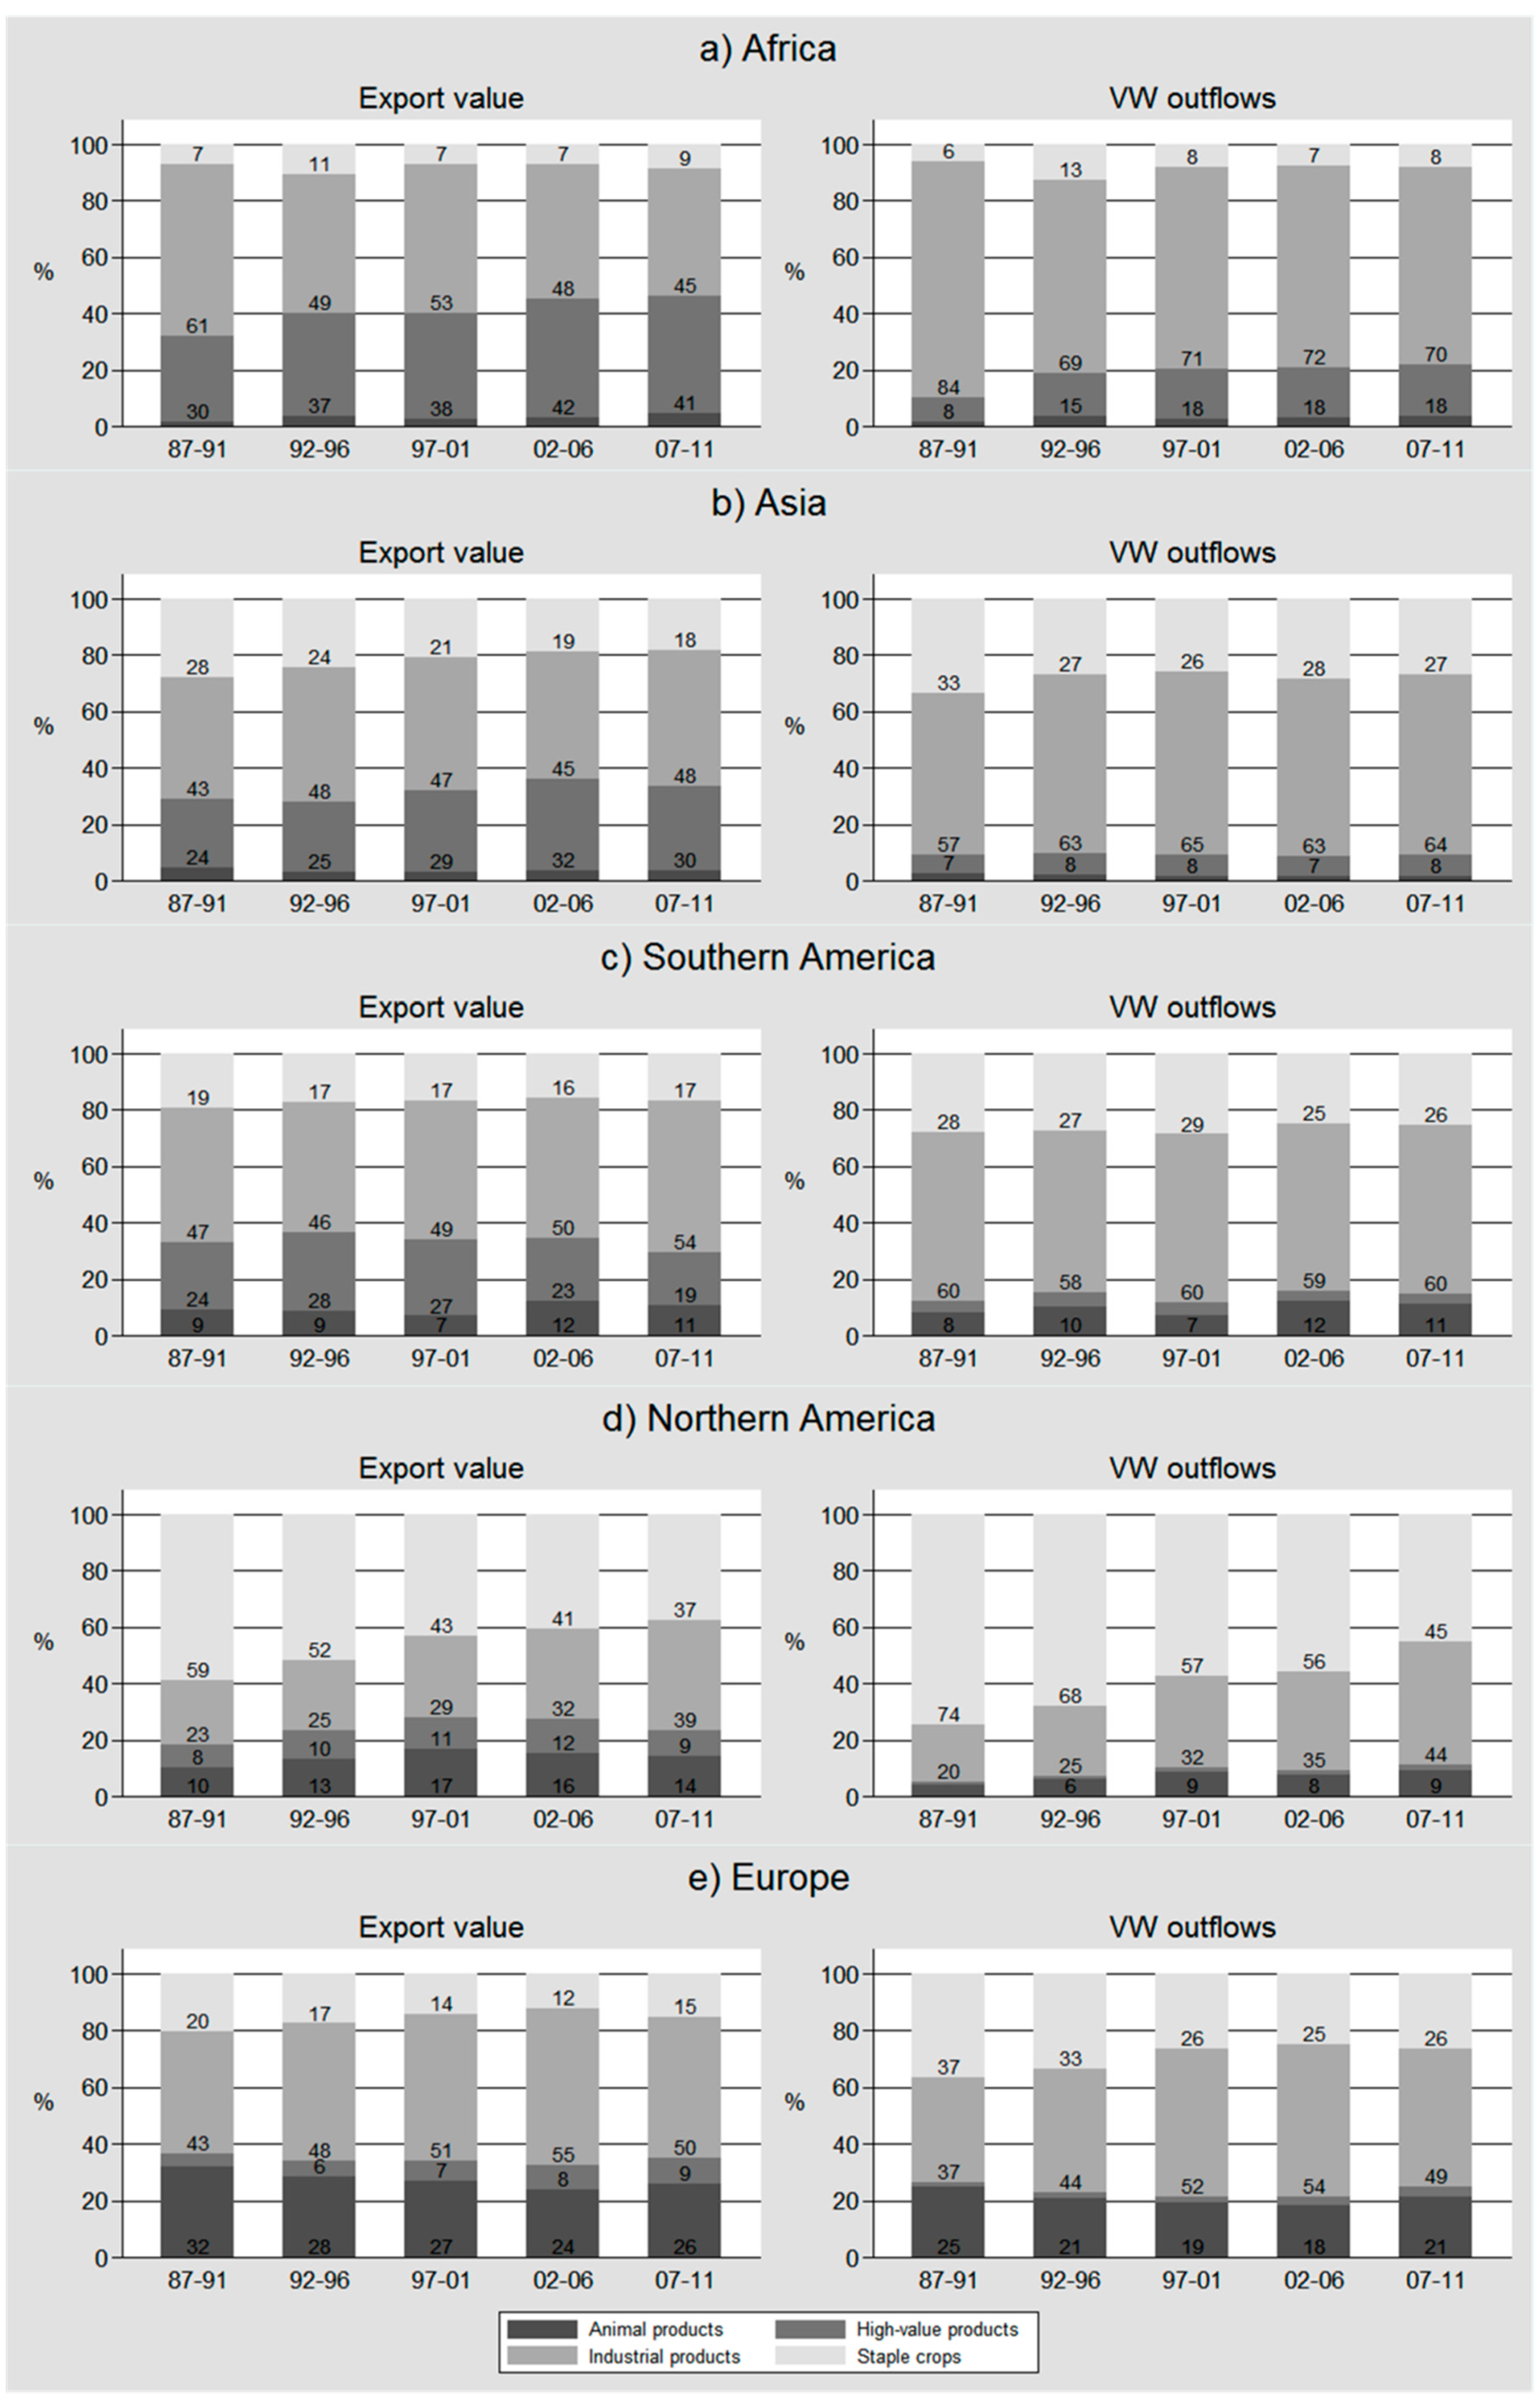
2.2. Composition of Trade and VW Flows

The following figures include five year averages of export values and VW outflows for four different product categories: high-value products, staple crops, live animals and animal products, and industrial products. High-value products include fruits, vegetables, spices and nuts. The products in this group responsible for the largest share of interregional VW exports on a global level in 2011 are nuts and bananas. Staple crops include cereals, roots, tubers and pulses as well as animal feed. The largest contributors to VW exports are wheat, cake of soybeans and maize. Live animals and animal products include milk, eggs and meat. Cattle meat contributes most to global VW exports in 2011, followed by pig meat. Industrial products include sugar crops, tea, coffee, oils, fats and beverages. The largest share of VW exports comes from soybeans, green coffee and palm oil. Non-food agricultural products, such as tobacco, rubber, fibers, hides and skins are not included in the analysis. More detail on the product categorization is provided in Section 4.3 and a list of products included in each category can be found in the SI. As we are mainly interested in the composition of trade, we express export values and VW outflows for the four product groups as percentage of the total export value and of the total VW outflow for each region for the respective years using five-year average values. We are displaying five-year average values instead of annual values in order to keep the figures comprehensive and to facilitate the comparison of trade values and corresponding VW flows.
Figure 3 presents the product composition of interregional exports and imports on a global level. The share of industrial products in global agri-food exports has increased from 37% in the period 1987–1991 to 48% in the years 2007–2011. Related VW flows account for more than half of the total VW volume in recent years. The share of staple crop exports has decreased from 51% to 31% during the study period. Globally, the share of interregional trade in high-value products and animal products has remained relatively stable. High-value exports account for around 15% of the total export value but for less than 5% of the related VW flows. Animal products account for a similar share in export value but for up to 10% of VW flows. The composition of global interregional imports and VW inflows is very similar to the composition of exports and VW outflows.
Figure 3. Importance of different product groups in trade values and VW flows (%) on a global level. Average shares over five-year periods are given.
Sustainability 07 05542 g003
In Figure 4, we show the product composition of exports and VW outflows for the different regions. The evolution and composition of exports differs between regions. In Africa, Asia and Southern America, industrial products account for the largest share of export value, around 50% in all three regions in 2007–2011. While that share increased slightly over the period 1987–2011 in Asia and Southern America, it decreased quite substantially in Africa, from 61% in the beginning of the period to 45% at the end. Especially in Africa, and to a lesser extent also in Asia, the importance of high-value exports increased over time; in the former case, from 30% of the total export value in the years 1987–1991 to 41% in the period 2007–2011. During the same period, the share of staple crops in total exports decreased in Asia and remained stable in Southern America. In the three regions, Africa, Asia and Southern America, the share of industrial products in VW outflows is substantially higher than its share in export value. This is also the case for staple crops but the difference is less pronounced while for high-value products it is the other way around. In the high-income regions, Europe and Northern America, industrial products are important in total exports as well but in Europe also animal products are significant, accounting for around one quarter of total agri-food exports. In Northern America, also staples are important, accounting for 37% of exports in 2007–2011. In these two regions, the importance of the different product categories in export value is more similar to their importance in VW outflows. Industrial products are responsible for the largest share of export earnings (50% in Europe and 39% in Northern America in 2007–2011) and also for the largest share of VW outflows in Europe (49%). In Northern America, the share of VW outflows related to staple crop exports decreased tremendously between 1987 and 1991 (74%) and 2007 and 2011 (45%) while the share of VW outflows related to industrial products more than doubled from 20%–44%.
In Figure 5, we show the product composition of imports and VW inflows for the different regions using the same four product categories and five-year average percentages as above. In Africa and Southern America, staple imports represent the largest share of total agri-food import value and account for the largest share of VW inflows, followed by industrial products. In Asia, the importance of staple crops in total agri-food imports has decreased from 36% of the value in 1987–1991 to 26% in 2007–2011; and the importance in related VW inflows dropped from 59% to 34% over the same time period. The share of industrial products has increased sharply between 1987 and 2011 and now accounts for the highest share of import value (45%) and VW inflows (49%) in Asia. Also in Northern America and Europe, industrial products account for the largest share of import value and VW inflows (70% in Northern America and 63% in Europe in 2007–2011). Moreover, high-value products account for around one third of the import value in both regions but only for a small share (around 10%) of VW inflows.
Figure 4. Importance of different product groups in export values and VW outflows (%). Average shares over five-year periods are given.
Sustainability 07 05542 g004
Figure 5. Importance of different product groups in import values and VW inflows (%). Average shares over five-year periods are given.
Sustainability 07 05542 g005

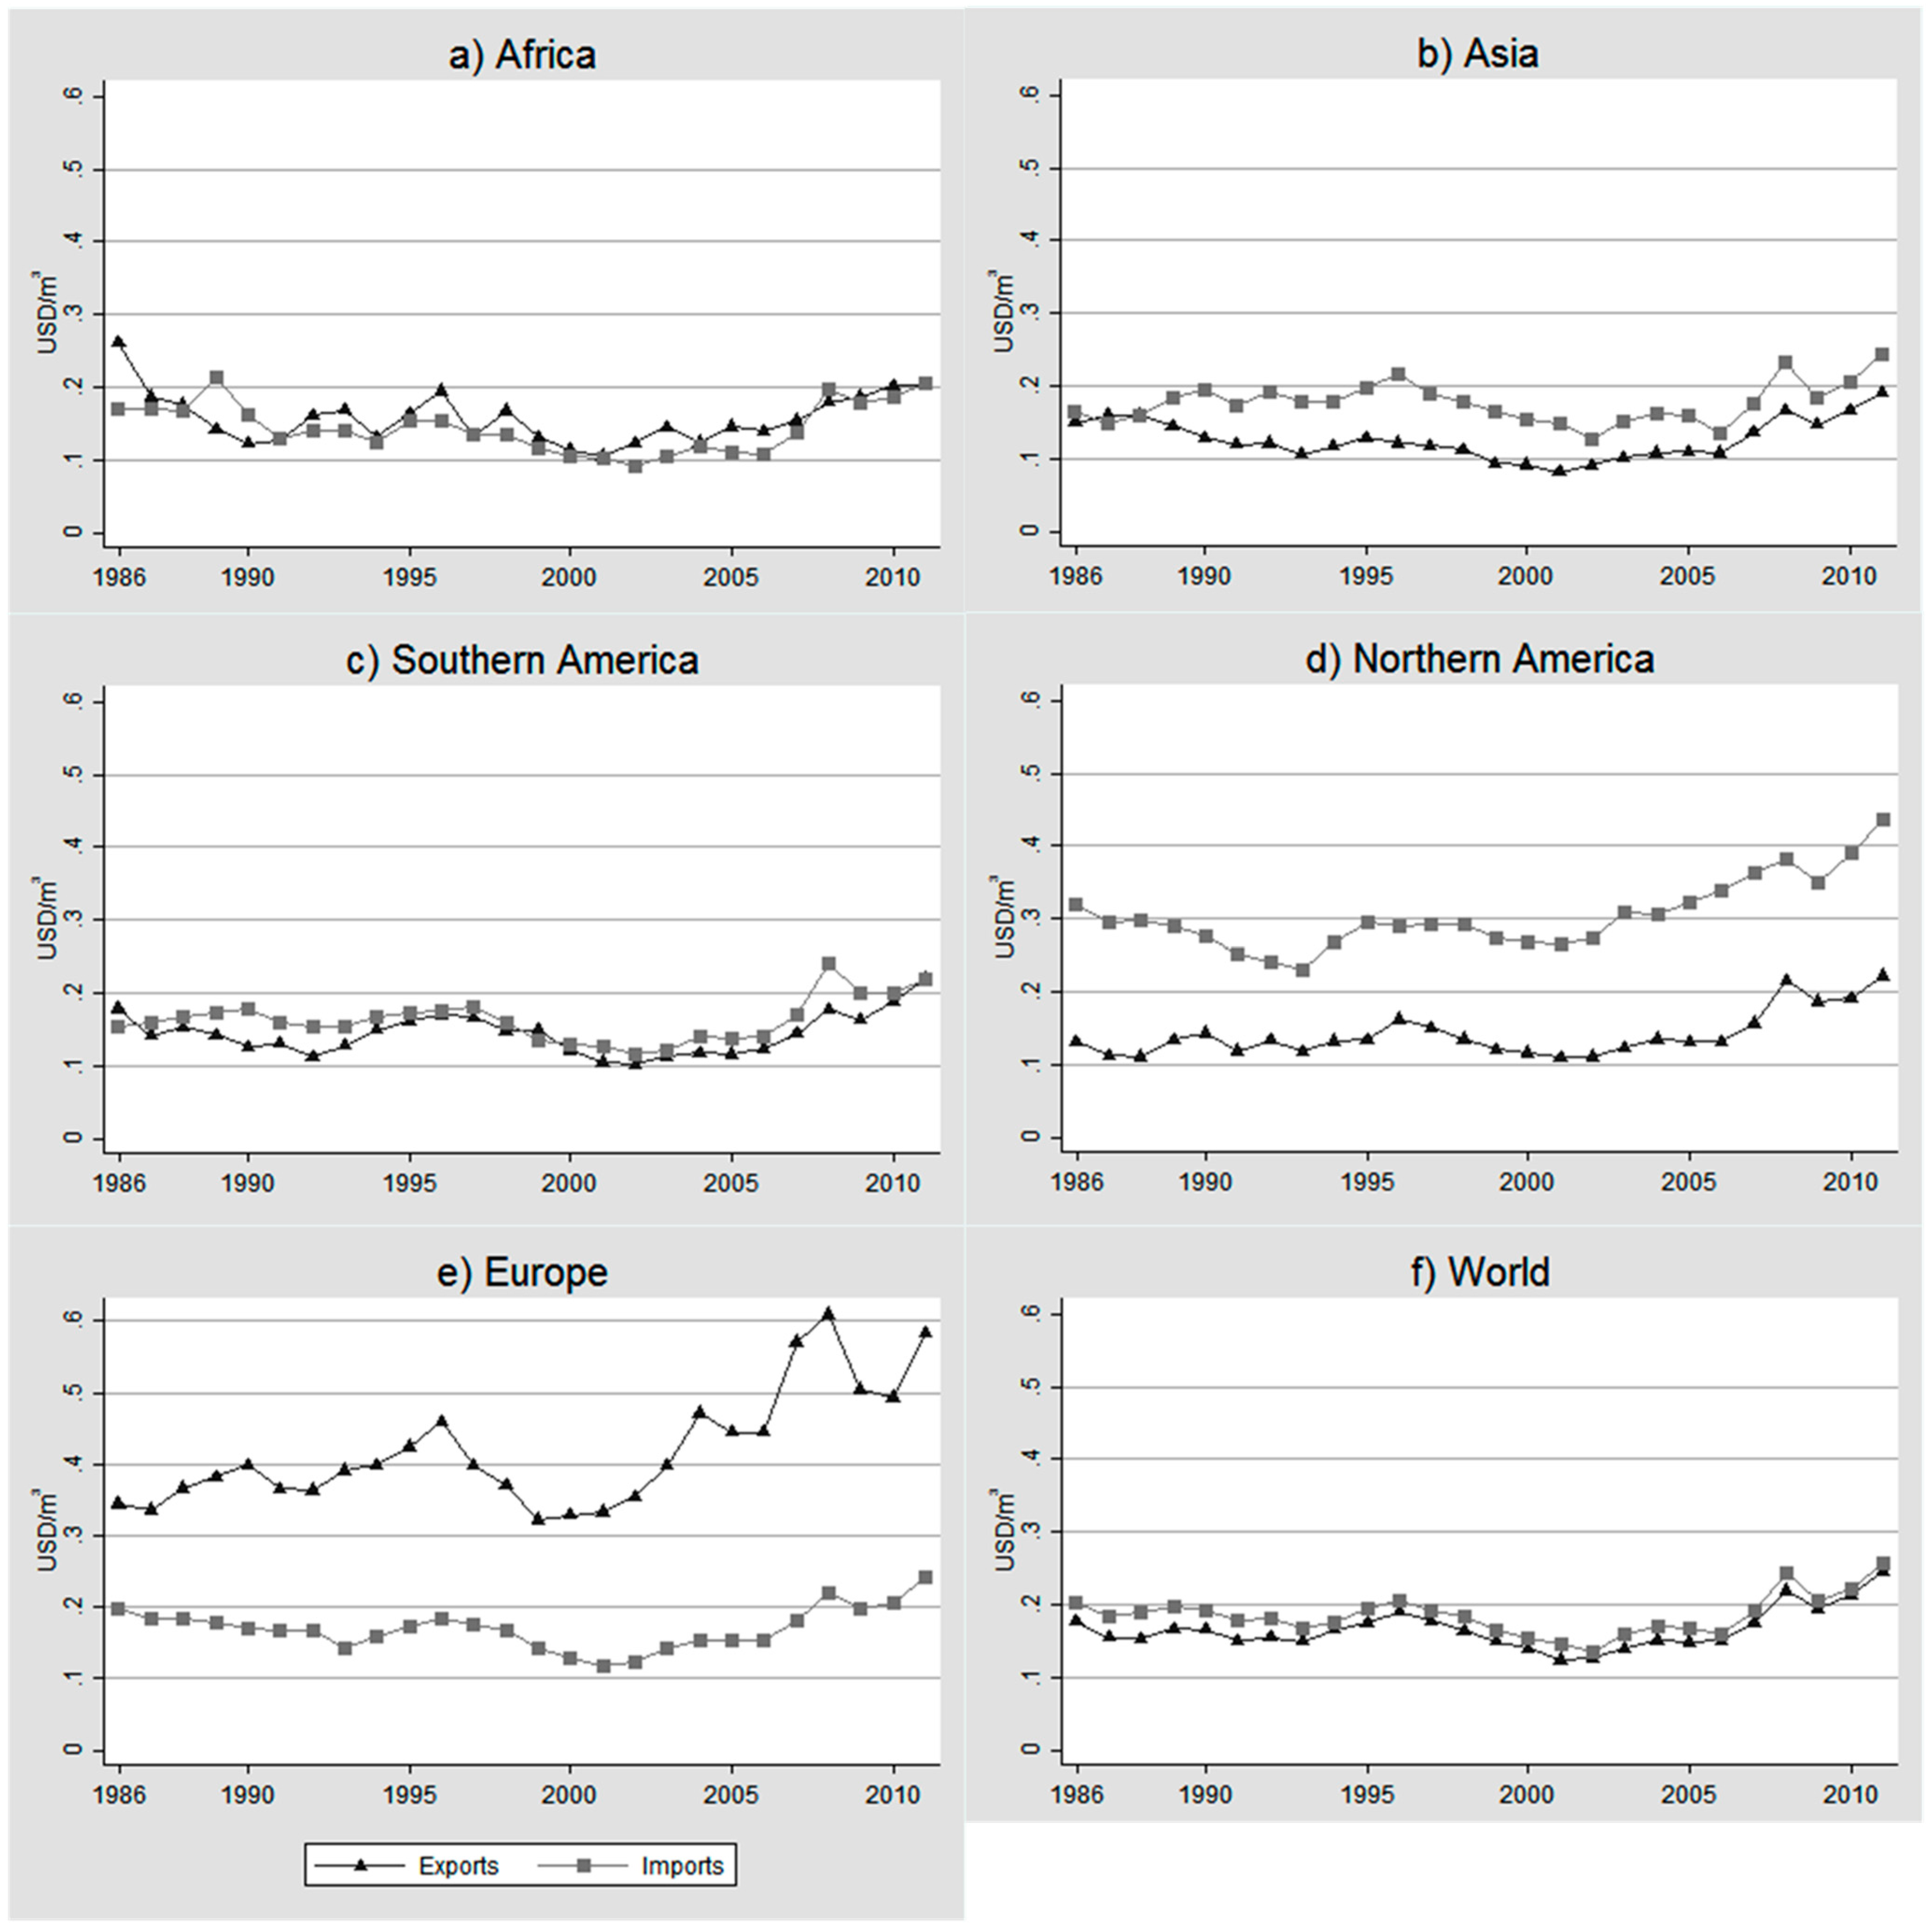
2.3. Economic Efficiency of VW Flows

Figure 6 shows the economic water efficiency of interregional agri-food trade for the world and five regions. It is calculated by dividing total annual trade values by the associated VW flows and is expressed in USD per m3 of VW. For imports, the economic water efficiency describes the average amount of money spent per unit of VW inflow into a region. For exports it is the amount of money earned, i.e., the return per unit of VW outflow. Thus, the higher the economic water efficiency of trade, the more financial value is being generated per unit of VW associated with a traded product. An increase in economic water efficiency over time does either signal that the price of commodities has increased or that the VW volume of commodities has decreased. This can for instance happen when a country changes trade partners and imports a product from a country that uses less VW for its production than the previous trade partner. It could also mean that the product composition within a commodity group has changed towards products with a higher value and/or a lower VW content. Some remarkable trends and patterns emerge in economic VW efficiency over the study period. First, in the period before 2000, water efficiency decreased or stayed stable over the years in all regions, for exports as well as for imports. Since the beginning of the 2000s, the economic water efficiency of both imports and exports increased in all regions. The strongest increases are observed for exports in Europe (economic water efficiency of exports increased from 0.32 USD/m3 in 1999 to 0.58 USD/m3 in 2011) and for imports in Northern America (economic water efficiency of imports increased from 0.26 USD/m3 in 2001 to 0.44 USD/m3 in 2011). In Africa, Asia and Southern America, the economic water efficiency of agri-food trade started to increase especially from 2005 onwards. Second, in Africa and Southern America, the VW efficiencies of imports and exports are very similar and follow a very similar trend over the years. For Europe and Northern America, this is not the case. In these regions, large differences exist between the economic water efficiency of exports and imports. Europe has a very high water efficiency of agri-food exports but has an efficiency of imports that is comparable to other regions and the global average. Specifically, Europe received 0.58 USD per m3 of VW outflows in 2011 and paid only 0.24 USD per m3 of VW inflows in the same year. The situation is reversed in Northern America where the price paid per unit of VW inflow is twice as high as the price received per unit of VW outflow (0.44 USD/m3 vs. 0.22 USD/m3 in 2011). Also in Asia, the economic water efficiency of imports is higher than that of exports but the difference is much less pronounced.
Figure 6. Economic water efficiency of exports and imports (USD/m3) per region and globally.
Sustainability 07 05542 g006

3. Discussion

The results presented in the previous section provide interesting insights into the evolution and patterns of VW flows over time.
First, regarding the growth rates of trade values and VW flows we have shown that generally, interregional trade values (expressed in constant 1990 USD) have increased at a higher rate than related VW flows over time. Reasons for this can be a more water-efficient production of exported products, i.e., higher yields and monetary output per unit of VW input, a changing product composition, i.e., a shift towards products with higher trade values and lower water intensity, or both. Growth rates have been especially high for VW outflows from Africa and Southern America where they raised fourfold between 1986 and 2011. This shows the increased inclusion of these world regions in international agri-food trade which goes along with an increased use of water resources for the production of export goods. However, VW outflows from Africa are still small compared to the volumes of the other regions. At the same time, import values and VW inflows have grown at a slower pace than exports in most world regions. Only in Asia import values and related VW inflows have grown at a higher rate than export values and VW outflows. This implies that Asia is increasingly relying on food imports and water inflows from other regions. The increasing VW inflows to Asia can be attributed mainly to increased soybean imports of China due an increasing demand for meat and animal feed, which has led to a cut in restrictions on soy imports in 2000–2001 [39].
Second, considering the product composition of interregional agri-food trade we have shown that staples and industrial crops account for the largest share of VW flows in all five regions and that the largest share of VW outflows from Africa, Asia, Southern America and Europe is related to exports of industrial products. However, these products generally account for a relatively low share of export earnings which is a disadvantage for the exporting region from an economic water efficiency point of view because large amounts of water flow out of the region while the associated export earnings are relatively low. At the same time, the importance of trade in high-value products is increasing especially in the three southern regions. While trade values of high-value products have expanded rapidly during the past decades, the related VW flows are relatively small. Hence, from a region-wide VW perspective, the recent shift towards promoting horticultural exports as a development strategy is not only beneficial from an economic point of view, but also from a water perspective. This is especially clear in the case of Africa, where earnings from high-value exports have increased from 30% of the total export value in the years 1987–1991 to 41% in the period of 2007–2011. The associated VW outflows only represent 8% of the total VW outflow in 1987–1991 and 18% in 2007–2011. However, we have analyzed trade for large world regions and it is important to keep national and production region-specific water availability in mind when formulating policy recommendations regarding increasing horticultural trade. Although high-value products are generally water-efficient, enough physical water resources need to be available in the production region in order to allow for sustainable production.
Third, VW inflows to Africa, Asia and Southern America are to a large extent related to staple imports. The share of import value related to staples is considerably lower than the share of VW inflows making staples an advantageous import product from an economic and water point of view. From this perspective, the pleas for decreasing the dependency of Africa and other low-income countries on staple food imports is not consistent with increasing the water efficiency of trade in these countries. Whereas the composition of imports has not changed much in Africa and Southern America over the studied period, in Asia the share of staple imports has decreased substantially between 1987 and 2011. At the same time, the share of industrial products in imports has nearly doubled. This can be linked to huge volumes of VW inflows to China due to soybean imports which have more than doubled between 2001 and 2007 and are mainly sourced from the US, Argentina and Brazil [39]. The composition of imports of Europe and Northern America has remained relatively stable over time. The largest share of VW inflows into these regions is due to imports of industrial products such as soybeans and coffee which account for around half of the import value of these regions but are responsible for around two thirds of associated VW flows. Trade in animal products accounts generally for a larger share in trade values than in VW trade. This picture would surely change when assessing VW flows in relation to physical quantities of the traded products because for many animal products the WF per ton is higher than the VW flow per USD. A striking example is beef with a global average WF of 15,415 m3/ton [44]. When considering trade values of cattle meat in 2011 [2], the world average VW flow was 3234 m3/USD. Hence, the VW volume related to the physical quantity is five times higher than the VW volume related to the trade value.
Fourth, regarding overall economic water efficiency of trade, a general trend of constant or decreasing efficiency until 2000 can be observed for all five regions. From 2000 onwards, prices per m3 of water started increasing again. However, there are striking differences in economic water efficiency between regions. Generally, Asia, Africa and Southern America have a much lower economic water efficiency than Northern America and especially Europe. This means they pay considerably less per unit of VW inflows associated with agri-food imports than Northern America and earn much less per unit of VW outflow than the European region. Differences between the economic water efficiency of imports and of exports are also remarkable: Northern America and to a lesser extent Asia pay notably more per unit of imported VW than they receive per unit of VW exported. For Northern America, this can be linked to its trade pattern which is comprised of relatively large shares of high-value imports with low related VW volumes leading to a high price per unit of VW imported. At the same time, the share of staples imports is very low whereas on the other hand, exports are to a large extent comprised of staple crops with a low value per unit of VW, leading to a lower economic water efficiency. Contrary to Northern America, Europe has a much higher water efficiency of exports compared to imports, making its trade pattern very efficient from a regional water perspective. Considering agri-food exports, the price European countries receive per m3 of VW is much higher than that of other regions, i.e., on average 0.42 USD/m3 between 1986 and 2011 compared to 0.16 USD/m3 in Africa, 0.13 USD/m3 in Asia and 0.14 USD/m3 both in Southern and Northern America. This could be due to the product composition of European exports, which includes a relatively large share of animal products with a high value. Moreover, Europe is the only region where industrial products generally account for a larger share in export value compared to their share in VW outflows. This suggests that Europe is exporting industrial products with a higher value and lower VW content than other regions, for instance in the form of processed products in contrast to primary products. One example for this is coffee, where green coffee has a global average green and blue VW content of 15,365 m3/ton and roasted coffee of 18,292 m3/ton [43]. However, the world market price of green coffee was 4391 USD/ton in 2011 whereas roasted coffee was traded for more than twice the price of 9903 USD/ton [2]. If European countries import green coffee and export the roasted product, this substantially increases the difference between economic water efficiency of imports and exports.
We have focused our analysis on interregional trade flows between major world regions. However, there are remarkable differences in the importance of interregional compared to intraregional trade in the regions. Europe, for instance, consists of many small economies that report imports and exports separately, leading to a huge share of intraregional trade in total trade flows. In 2011, 80% of the VW flows related to agri-food exports have been generated by trade within the European countries in our database. On the other hand, the region of Northern America includes the United States of America and Canada which together account for nearly five times the land area of the European Union. Intra-US trade is however not accounted for in international trade databases, and intraregional trade in Northern America would only capture trade flows between the US and Canada. In our database, 15% of the VW flows related to agri-food exports of Northern America are due to intraregional trade. In Africa and Southern America, intraregional agri-food trade is also small, accounting for 20% of VW export flows in Africa and for 13% of the VW export flows of Southern American countries in 2011. In Asia, intraregional VW trade is more important; 68% of the total VW export flows are related to trade within the region.
It is important to see our results in a broader context regarding water scarcity. When comparing physical water quantity as estimated by Gassert et al. [45] and economic water efficiency of trade, it becomes evident that trade patterns do not reflect the social value of water resources: Europe receives the highest price for its VW exports although it is the least water-scarce world region. Asia, on the other hand, is generally very water-scarce but still pays more per unit of VW imported than it earns per unit of VW exported. This might be due to its trade pattern which consists to a large extent of industrial and staple exports that generally have a lower trade value and imports of more expensive animal products. Thus, Asia’s trade pattern is to its disadvantage with respect to economic water efficiency. In Africa, water scarcity is especially occurring in the Northern African countries and in the southern tip of the continent. The opportunity cost of water used for the production of export commodities is thus very location specific. The same holds for Southern and Northern America, where the areas along the Pacific Coast are extremely dry whereas the western side of the continent does not generally suffer from water stress.

4. Material and Methods

4.1. Calculation of Trade Values, Virtual Water Flows and Economic Water Efficiency

First, annual values of exports and imports have been calculated per country by multiplying product-specific trade quantities with their respective trade values in real terms, only considering interregional trade. Then, the sum over all traded products p is taken. Country-level data have subsequently been summed up for all home countries ch,r belonging to world region r:
X v ( r, t )= c h,r p x q ( c h,r , c f , p, t )× x v ( c h,r , c f , p, t )
M v ( r, t )= c h,r p m q ( c h,r , c f , p, t )× m v ( c h,r , c f , p, t )
where Xv is the total value of exports from world region r in year t; xq denotes the physical quantity of product p exported by home country ch,r to foreign country cf in year t and xv is the value of the respective transaction. In the same way, the total value of imports Mv for each world region has been calculated.
Second, the VW content of agricultural commodities that are traded between regions has been calculated following the approach of Hoekstra and Chap again [46]. The volume of virtual water exports VWX from region r in a specific year t is obtained by multiplying the export quantities xq of each country ch,r with the respective time- and product-specific water footprint of production WF(ch,r, p, t) and summing up over all export products and countries belonging to r. This can be expressed as:
VWX( r, t ) = c h,r p x q ( c h,r ,p, t )×WF( c h,r , p, t )
Similarly, the virtual water imports VWX of a region are calculated by summing up the national VWX of all countries belonging to r. VWX of ch,r in t are obtained by multiplying the imported quantities of agricultural commodities mq with their product and time-specific WF of production in the country of origin cf and summing over all products and partner countries:
VWM( r, t ) = c h,r p,  c f   m q ( c h,r , c f , p, t )×WF( c f , p, t )
Growth rates of trade values and VW trade have been calculated using the year 1986 as the base year and indexing trade values and VW flows in that year to 100%. Trade values and VW flows for the other years are then expressed relative to the base year.
Lastly, we calculate the annual economic water efficiency of exports WEX and imports WEM of r by dividing the annual value of trade flows per region by the associated VW content:
WEX( r, t )= X v ( r, t )/VWX( r, t )
WEM( r, t )= M v ( r, t )/VWM( r, t )
Global values have been calculated as the sum of regional trade values and VW flows.

4.2. Data Sources

Data for our analysis were collected from two main sources. First, bilateral trade data of crops and livestock products come from FAOSTAT [2]. These data include information on export and import quantities and values of crops, derived crop products and animal products. Also, information on the trade partner country is provided. The FAOSTAT database only covers bilateral trade data between 1986 and 2011. Nonetheless, this is also the period of major global trade increases and changes in product patterns and thus is suitable for our analysis. We focus on imports and exports of countries belonging to Africa, Asia, Europe, Northern America and Southern America and exclude trade data of countries belonging to the former USSR due to many years of missing values during the political transition. Moreover, Oceania is not considered in our analysis due to its limited importance in international agri-food trade. Due to political changes since 1986, we merged trade data from the Socialist Federal Republic of Yugoslavia and its former member states. The same procedure was applied for Ethiopia and the People’s Democratic Republic of Ethiopia, Germany and the Federal Republic of Germany. Missing trade data have been replaced by linear interpolation for all countries which had less than 10 years of missing data. Countries with more than 10 years of missing data have been excluded from analysis leading to a final set of 86 countries reporting imports and exports. A list of countries included in our analysis is provided in the supplementary information to this paper. The number of trade partner countries is higher than this as the reporting countries might still export to or import from countries that are not included in our database with their own imports and exports. Thus, we do not use a balanced trade network where all export flows reported by a country are also reported by the trade partner as an export flow in order to base our analysis on the largest share of available information. Trade quantities for live animals that were reported as the number of heads have been converted to tonnes based on their global average weight provided by Mekonnen and Hoekstra [44] and FAO [47]. Moreover, trade values have been converted to constant USD of 1990 based on the consumer price index.
Second, the national average water footprint (WF) of production of a wide number of crops, derived crop products, animals and livestock products has been estimated by Mekonnen and Hoekstra [43,44]. It measures the amount of water required for producing one ton of an agricultural product under specific spatial circumstances and can be subdivided into consumptive water use (i.e., water lost to the atmosphere due to evapotranspiration or water incorporated in the final product) and the amount of water required to assimilate pollutants to a maximum allowed level. The former can furthermore be divided into green (rainwater) and blue water (surface and ground water). The water needed to assimilate pollutants is called grey water [43]. For our calculations, we focus on consumptive water use, i.e., the sum of the green and blue WF which together account for 90% of the global WF of crop production [43] and for 93.4% of global animal production [44]. For 195 nations, both WF for crops and livestock products are available from Mekonnen and Hoekstra [43,44]. Additionally, we have calculated the WF for the USSR, the SFR Yugoslavia and Czechoslovakia as the unweighted average of the WF of its member countries and used the WF of Serbia and Montenegro for the states of Serbia and Montenegro, respectively. In cases where country-specific WF information for a certain product was missing, we used the global average value. This allows the inclusion of VW flows related to re-exports and re-imports of products from countries that are not the original producers of a product. The WF is expressed in m3 of water per ton of a product and is obtained for crops by dividing evapotranspiration (m3/ha) by yield (t/ha). As Mekonnen and Hoekstra [43] use average yield data from 1996–2005, we follow Dalin et al. [39] and Duarte et al. [42] and adjust the WF of crop products to annual changes in yields for our reference period:
WF( c, p, t )=WF( c,p ) Y( c, p ) Y( c, p, t )
where WF(c, p, t) is the water footprint for country c of producing product p in year t. In our analysis, t ranges from 1986–2011. WF(c, p) is the national average WF as provided by Mekonnen and Hoekstra [43] and Y(c, p) the average yield used by them. Y(c, p, t) is the yield of product p in country c and year t and has been obtained from FAOSTAT [2].
As trade data are reported in FAO commodity codes and WF data mainly according to Harmonized System (HS) codes, we have converted the classification of the WF dataset using conversion tables provided by FAO [48]. In cases where multiple HS codes correspond to one FAO code the average WF was taken. After merging trade and WF data our final database includes trade data of 254 crop, livestock and derived products according to the FAO classification.

4.3. Classification of Products and Countries

For analyzing the VW trade patterns, we have subdivided the traded commodities into four major categories. All agricultural and food products are classified by FAO [48] into 20 commodity groups. We have used these pre-defined groups and further classified them into four major categories: First, high-value products such as fruits, vegetables, spices and nuts which are of growing importance in the trade pattern of many developing countries. Second, staple crops including cereals, roots, tubers and pulses. These crops constitute a large share of the daily diet in many countries but do generally have a lower trade value. Third, we grouped live animals and animal products such as milk, eggs and meat into one category named animal products. The fourth group, industrial products, subsumes a variety of traditional agricultural commodities such as sugar crops, tea and coffee, oils, fats and beverages. Non-food products, such as tobacco, rubber, fibers, hides and skins are not included in the analysis.
Countries are grouped into five geographical regions being Africa, Asia, Europe, Northern America and Southern America (including Central America and the Caribbean). The final dataset includes trade data of 86 countries of which 18 are in Africa, 17 in Asia, 30 in Europe, two in Northern America and 19 in Southern America. A detailed list of commodities, countries and their classifications can be found in the supplementary information to this article.
A limitation of our study is the fact that bilateral trade data is not available for all countries, or that trade reports are missing for many years. Because of this, we have excluded a whole region, the former USSR, from the analysis. This results in one region less but does not affect our results. However, also within regions, some important countries are missing. This is especially the case for Africa, where some rather large countries such as Nigeria, Congo DR, Sudan, Angola or Chad are not included due to missing data. It is not clear how robust our results are regarding these data limitations. A shortcoming regarding the reliability of the FAOSTAT [2] bilateral trade database it that export and import quantities and values reported by different trading partners, i.e., the importing and the exporting country, do not always correspond which leads to considerable differences between total annual exports and total imports in some years. Moreover, trade values are based on annual exchange rates and not on purchasing power parity (PPP) and do thus not take into account the relative value of trade in the different regions.

5. Conclusions

In this article, we have assessed the evolution and composition of trade values and associated VW flows for five world regions over a period of 26 years. Particularly, we have focused on interregional agri-food trade and analyzed the relationship between trade values and VW flows. Our results show that trade values have generally increased more rapidly than related VW volumes and that the economic water efficiency of imports and exports has increased in all regions. We are not able to establish a causal relationship between these variables and to attribute changes in VW flows to changes in trade patterns. Nonetheless, our graphical analysis illustrates the major trends of interregional agri-food trade between regions, and we could show that there are considerable differences in economic water efficiency between regions. Agri-food trade is dominated by trade of industrial products and staples with a relatively low trade value compared to the related volumes of VW. High-value exports, on the other hand, are of increasing importance in low-income countries and are water efficient from an economic point of view due to low volumes of associated VW.
In order to assess the relationship between agricultural trade patterns and water scarcity in detail, country-and watershed-specific studies could be conducted, using the same methods as presented in this paper.

Acknowledgments

The research leading to these results has received funding from the European Union’s Seventh Framework Programme for research, technological development and demonstration under grant agreement n° 311778. We thank seminar participants in Leuven and three anonymous reviewers for valuable comments on previous versions of this article.

Author Contributions

Jana Schwarz, Erik Mathijs and Miet Maertens designed the research. Jana Schwarz constructed the database and analyzed the data. Jana Schwarz and Miet Maertens wrote the article. All authors read and approved the final manuscript.

Supplementary Materials

Supplementary materials can be accessed at: https://www.mdpi.com/2071-1050/7/5/5542/s1.

Conflicts of Interest

The authors declare no conflict of interest.

References

  1. Anderson, K. Globalization’s effects on world agricultural trade, 1960–2050. Phil. Trans. R. Soc. B 2010, 365, 3007–3021. [Google Scholar] [CrossRef] [PubMed]
  2. FAOSTAT Online Database. Available online: http://faostat3.fao.org (accessed on 20 October 2014).
  3. Aksoy, M.A. The evolution of agricultural trade flows. In Global Agricultural Trade and Developing Countries; Aksoy, M.A., Beghin, J.C., Eds.; The World Bank: Washington, DC, USA, 2005; pp. 17–34. [Google Scholar]
  4. Maertens, M.; Minten, B.; Swinnen, J.F. Modern food supply chains and development. Evidence from horticultural export sectors in Sub-Saharan Africa. Dev. Policy Rev. 2012, 30, 473–497. [Google Scholar] [CrossRef]
  5. World Bank. World Development Report 2008. Agriculture for Development; The World Bank: Washington, DC, USA, 2007. [Google Scholar]
  6. Diop, N.; Jaffee, S.M. Fruits and vegetables. Global trade dynamics, and the impact of trade liberalization. In Global Agricultural Trade and Developing Countries; Aksoy, M.A., Beghin, J.C., Eds.; The World Bank: Washington, DC, USA, 2005; pp. 17–34. [Google Scholar]
  7. Reardon, T.; Barrett, C.B.; Berdegué, J.A.; Swinnen, J.F. Agrifood industry transformation and small farmers in developing countries. World Dev. 2009, 37, 1717–1727. [Google Scholar] [CrossRef]
  8. Pingali, P. Agricultural growth and economic development. A view through the globalization lens. Agric. Econ. 2007, 37, 1–12. [Google Scholar] [CrossRef]
  9. Aksoy, M.A.; Beghin, J.C. Global Agricultural Trade and Developing Countries; The World Bank: Washington, DC, USA, 2005. [Google Scholar]
  10. Dollar, D.; Kraay, A. Trade, growth, and poverty. Econ. J. 2004, 114, 22–39. [Google Scholar] [CrossRef]
  11. Rao, E.J.; Qaim, M. Supermarkets, farm household income, and poverty. Insights from Kenya. World Dev. 2011, 39, 784–796. [Google Scholar] [CrossRef]
  12. Miyata, S.; Minot, N.; Hu, D. Impact of contract farming on income. Linking small farmers, packers, and supermarkets in China. World Dev. 2009, 37, 1781–1790. [Google Scholar] [CrossRef]
  13. Ramaswami, B.; Birthal, P.S.; Joshi, P.K. Grower heterogeneity and the gains from contract farming. The case of Indian poultry. Indian Growth Dev. Rev. 2009, 2, 56–74. [Google Scholar] [CrossRef]
  14. Rao, E.J.; Brümmer, B.; Qaim, M. Farmer participation in supermarket channels, production technology, and efficiency. The case of vegetables in Kenya. Am. J. Agric. Econ. 2012, 94, 891–912. [Google Scholar] [CrossRef]
  15. Dries, L.; Swinnen, J.F. Foreign direct investment, vertical integration, and local suppliers. Evidence from the Polish dairy sector. World Dev. 2004, 32, 491–509. [Google Scholar] [CrossRef]
  16. Maertens, M.; Swinnen, J.F. Trade, standards, and poverty. Evidence from Senegal. World Dev. 2009, 37, 161–178. [Google Scholar] [CrossRef]
  17. Minten, B.; Randrianarison, L.; Swinnen, J.F. Global retail chains and poor farmers. Evidence from Madagascar. World Dev. 2009, 37, 1728–1741. [Google Scholar] [CrossRef]
  18. Christiaensen, L.; Devarajan, S. Making the most of Africa’s growth. Curr. Hist. 2013, 112, 181–187. [Google Scholar]
  19. Minten, B.; Murshid, K.A.; Reardon, T. Food quality changes and implications. Evidence from the rice value chain of Bangladesh. World Dev. 2013, 42, 100–113. [Google Scholar] [CrossRef]
  20. Diao, X.; Hazell, P.; Thurlow, J. The role of agriculture in African development. World Dev. 2010, 38, 1375–1383. [Google Scholar] [CrossRef]
  21. Reardon, T.; Chen, K.Z.; Minten, B.; Adriano, L. The Quiet Revolution in Staple Food Value Chains in Asia; Enter the Dragon, the Elephant, and The Tiger; Asian Development Bank and International Food Policy Research Institute: Mandaluyong, PH, USA, 2012. [Google Scholar]
  22. Rakotoarisoa, M.A. Why Has Africa Become a Net Food Importer? Explaining Africa Agricultural and Food Trade Deficits; Food and Agriculture Organization of the United Nations: Rome, Italy, 2011. [Google Scholar]
  23. Edwards-Jones, G.; Milà I Canals, L.; Hounsome, N.; Truninger, M.; Koerber, G.; Hounsome, B.; Cross, P.; York, E.H.; Hospido, A.; Plassmann, K.; et al. Testing the assertion that “local food is best”. The challenges of an evidence-based approach. Food Sci. Technol. 2008, 19, 265–274. [Google Scholar] [CrossRef]
  24. MacGregor, J.; Vorley, B. Fair miles? The concept of “food miles” through a sustainable development lens. In IIED Sustainable Development Opinion; International Institute for Environment and Development: London, UK, 2006. [Google Scholar]
  25. Peters, G.P.; Minx, J.C.; Weber, C.L.; Edenhofer, O. Growth in emission transfers via international trade from 1990 to 2008. PNAS 2011, 108, 8903–8908. [Google Scholar] [CrossRef] [PubMed]
  26. Hertwich, E.G.; Peters, G.P. Carbon footprint of nations: A global, trade-linked analysis. Environ. Sci. Technol. 2009, 43, 6414–6420. [Google Scholar] [CrossRef] [PubMed]
  27. Cristea, A.D.; Hummels, D.; Puzzello, L.; Avetisyan, M.G. Trade and the greenhouse gas emission from international freight transport. In NBER Working Paper Series No. 17117; National Bureau of Economic Research: Cambridge, MA, USA, 2011. [Google Scholar]
  28. Longo, S.; York, R. Agricultural exports and the environment. A cross-national study on fertilizer and pesticide consumption. Rural Sociol. 2008, 73, 82–104. [Google Scholar] [CrossRef]
  29. Murray, D.L. Export agriculture, ecological disruption, and social inequity. Some effects of pesticides in Southern Honduras. Agric. Hum. Values 1991, 8, 19–29. [Google Scholar] [CrossRef]
  30. Galt, R.E. Pesticides in export and domestic agriculture. Reconsidering market orientation and pesticide use in Costa Rica. Geoforum 2008, 39, 1378–1392. [Google Scholar] [CrossRef]
  31. UNESCO. United Nations World Water Development Report 2014. Water and Energy; UNESCO: Paris, France, 2014; Volume 1. [Google Scholar]
  32. Chapagain, A.K.; Hoekstra, A.Y. The global component of freshwater demand and supply. An assessment of virtual water flows between nations as a result of trade in agricultural and industrial products. Water Int. 2008, 33, 19–32. [Google Scholar] [CrossRef]
  33. Allan, J.A. Policy responses to the closure of water resources: Regional and global issues. In Water Policy: Allocation and Management in Practice; Howsam, P., Carter, R.C., Eds.; Chapman and Hall: London, UK, 1996; pp. 3–12. [Google Scholar]
  34. Allan, J.A. Virtual water: A strategic resource, global solutions to regional deficits. Groundwater 1998, 36, 545–546. [Google Scholar] [CrossRef]
  35. Hoekstra, A.Y.; Chapagain, A.K. Globalization of Water. Sharing the Planet’s Freshwater Resources; Blackwell Publishing: Oxford, UK, 2008. [Google Scholar]
  36. Hoekstra, A.Y.; Hung, P.Q. Globalisation of water resources. International virtual water flows in relation to crop trade. Glob. Environ. Chang. 2005, 15, 45–56. [Google Scholar] [CrossRef]
  37. Chapagain, A.K.; Hoekstra, A.Y.; Savenije, H.H.G. Water savings through international trade of agricultural products. Hydrol. Earth Syst. Sci. 2006, 10, 455–468. [Google Scholar] [CrossRef]
  38. Yang, H.; Wang, L.; Abbaspour, K.C.; Zehnder, A.J. Virtual water trade. An assessment of water use efficiency in the international food trade. Hydrol. Earth Syst. Sci. 2006, 10, 443–454. [Google Scholar] [CrossRef]
  39. Dalin, C.; Konar, M.; Kanasaki, N.; Rinaldo, A.; Rodriguez-Iturbe, I. Evolution of the global virtual water trade network. Proc. Natl. Acad. Sci. USA 2012, 109, 5989–5994. [Google Scholar] [CrossRef] [PubMed]
  40. Carr, J.A.; D’Odorico, P.; Laio, F.; Ridolfi, L. Recent history and geography of virtual water trade. PLoS ONE 2013, 8, 1–9. [Google Scholar]
  41. Konar, M.; Caylor, K.K. Virtual water trade and development in Africa. Hydrol. Earth Syst. Sci. 2013, 17, 3969–3982. [Google Scholar] [CrossRef]
  42. Duarte, R.; Pinilla, V.; Serrano, A. The effect of globalisation on water consumption. A case study of the Spanish virtual water trade, 1849–1935. Ecol. Econ. 2014, 100, 96–105. [Google Scholar] [CrossRef]
  43. Mekonnen, M.M.; Hoekstra, A.Y. The green, blue and grey water footprint of crops and derived crop products. Hydrol. Earth Syst. Sci. 2011, 15, 1577–1600. [Google Scholar] [CrossRef]
  44. Mekonnen, M.M.; Hoekstra, A.Y. A global assessment of the water footprint of farm animal products. Ecosystems 2012, 15, 401–415. [Google Scholar] [CrossRef]
  45. Gassert, F.; Reig, P.; Luo, T.; Maddocks, A. Aqueduct country and river basin rankings. In A Weighted Aggregation of Spatially Distinct Hydrological Indicators; Working Paper; World Resources Institute: Washington, DC, USA, 2013. [Google Scholar]
  46. Hoekstra, A.Y.; Chapagain, A.K. Water footprint of nations. Water use by people as function of their consumption pattern. Water Resour. Manag. 2007, 21, 35–48. [Google Scholar] [CrossRef]
  47. FAO. Technical Conversion Factors for Agricultural Commodities; Food and Agriculture Organization of the United Nations: Rome, Italy, 2003. [Google Scholar]
  48. FAOSTAT Commodity Definitions and Correspondences. Available online: http://www.fao.org/economic/ess/ess-standards/commodity/en/ (accessed on 20 October 2014).

