
Using Water Footprints for Examining the Sustainable Development of Science Parks


Abstract
:1. Introduction
2. Methods
2.1. General IO Model of Production
2.2. Data Description

| The 33 Sectors Compiled in this Study | IO Table Codes for the 162 Sectors in 2001 | IO Table Codes for the 161 Sectors in 2004 | IO Table Codes for the 166 Sectors in 2006 | |
|---|---|---|---|---|
| Code | Name | |||
| 1 | Agriculture | 1–12 | 1–12 | 1–11 |
| 2 | Mining | 13, 14, 16 | 13, 14, 16 | 12–15 |
| 3 | Food and beverage manufacturing | 15, 17–31 | 15, 17–31 | 16–29 |
| 4 | Tobacco manufacturing | 32 | 32 | 30 |
| 5 | Textiles | 33–38 | 33–38 | 31–36 |
| 6 | Clothe production, apparel, and other textile product manufacturing | 39–41 | 39–41 | 37–39 |
| 7 | Leather, fur, and other related product manufacturing | 42–44 | 42–44 | 40–42 |
| 8 | Wood and bamboo product manufacturing | 45–47 | 45–47 | 43–45 |
| 9 | Furniture and ornament manufacturing | 48, 80 | 48, 80 | 103, 104 |
| 10 | Pulp and paper products | 49, 50 | 49, 50 | 46, 47 |
| 11 | Printing and associated businesses | 51, 52 | 51, 52 | 48 |
| 12 | Chemical material manufacturing | 53–59 | 53–59 | 51–57 |
| 13 | Chemical product manufacturing | 60, 63, 64 | 60, 63, 64 | 59–61 |
| 14 | Biotechnology | 61, 62 | 61, 62 | 58, 62 |
| 15 | Petroleum and coal product manufacturing | 65, 66 | 65, 66 | 49, 50 |
| 16 | Rubber product manufacturing | 67, 68 | 67, 68 | 63 |
| 17 | Plastic product manufacturing | 69 | 69 | 64 |
| 18 | Nonmental mineral product manufacturing | 70–74 | 70–74 | 65–69 |
| 19 | Basic metal industries | 75–78 | 75–78 | 70–73 |
| 20 | Fabricated metal production manufacturing | 79, 81–85 | 79, 81–85 | 74–78 |
| 21 | Machinery and equipment manufacturing and repairing | 86–90 | 86–90 | 94–97, 107 |
| 22 | Electrical machinery, supplies, and equipment manufacturing and repairing | 91–95 | 91–95 | 89–93 |
| 23 | Computers and peripherals | 96–99 | 96–99 | 81, 83, 84, 87 |
| 24 | Communication | 100, 101 | 100, 101 | 85, 86 |
| 25 | Integrated circuits | 103 | 102 | 79 |
| 26 | Optoelectronics | 104 | 103 | 80 |
| 27 | Precision machinery | 111 | 110 | 88 |
| 28 | Other electronic components | 102, 105 | 104 | 82 |
| 29 | Transport equipment manufacturing and repairing | 106–110 | 105–109 | 98–102 |
| 30 | Other industrial product manufacturing | 112, 113 | 111, 112 | 105, 106 |
| 31 | Electric power and gas | 114, 115 | 113, 114 | 108, 109 |
| 32 | Water | 116 | 115 | 110 |
| 33 | Services | 117–162 | 116–161 | 111–166 |
2.3. Data Processing
2.3.1. Tap Water Consumption
2.3.2. Surface Water and Groundwater Consumption
2.4. Establishing the Water Footprint Model
| InputOutput | Intermediate Demand | Final Demand | Total Output | Import | |||
|---|---|---|---|---|---|---|---|
| Sector 1 … Sector n | Domestic Consumption | Export | |||||
| Intermediate input | Domestic input | Sector 1 ↓ Sector n | |||||
| Import | |||||||
| Added value | |||||||
| Total input | |||||||
| Water consumption | |||||||
2.4.1. Input Coefficient of Water Resources ()
2.4.2. IO Correlation Matrix (B)
2.4.3. Water Footprint
2.5. Water Footprint Index
3. Results and Discussion
3.1. Water Footprint Analysis of the Six Major Industries at the HSP
3.1.1. Analysis of Industrial Structures
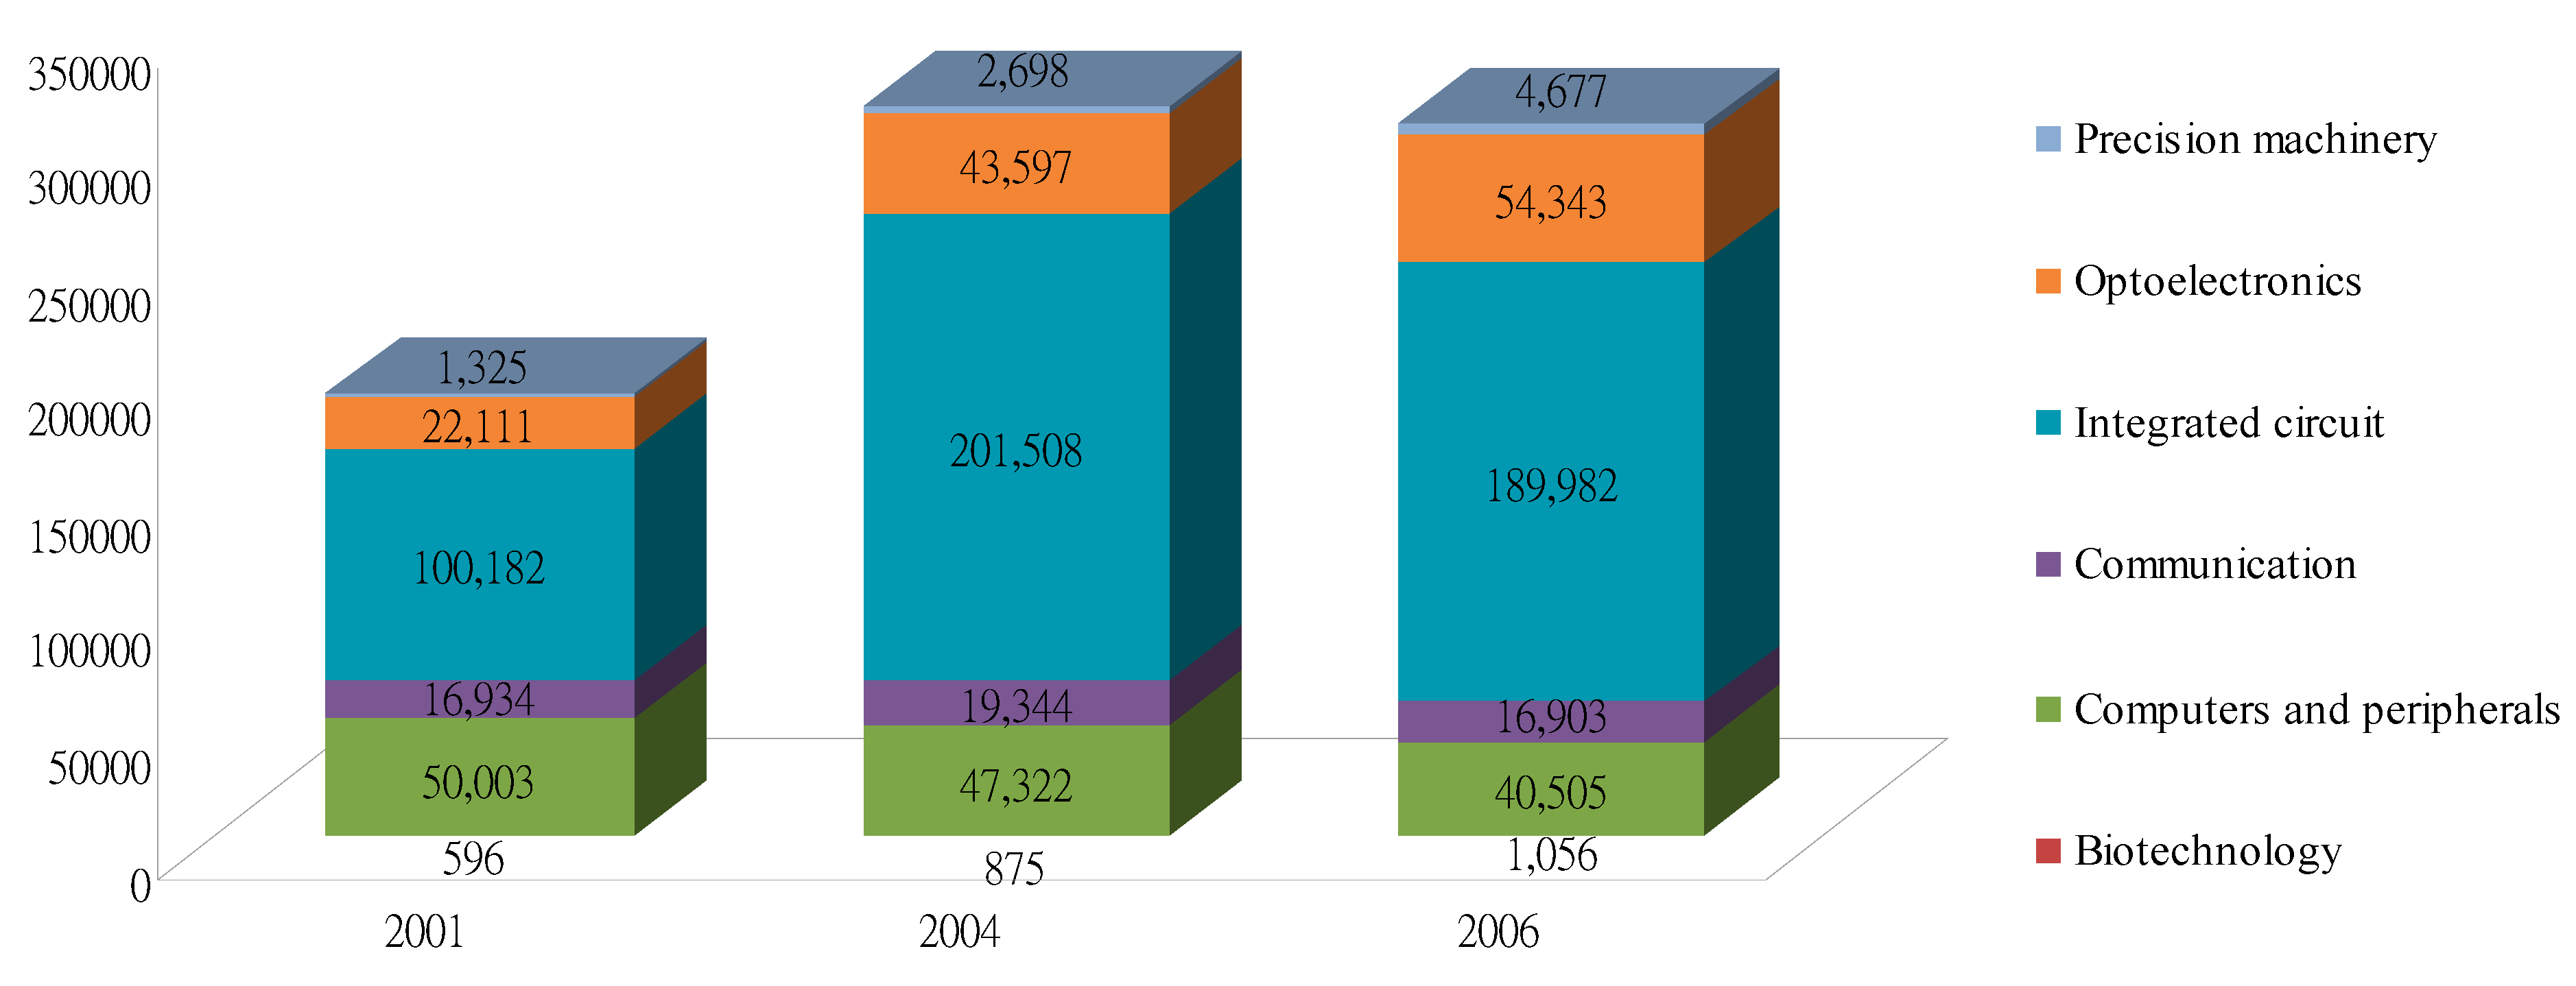
3.1.2. Internal and External Water Footprints
| Sector | Output Value (in NT$ Million) | Water Footprint (10,000 tons) | |||||||||||
|---|---|---|---|---|---|---|---|---|---|---|---|---|---|
| 2001 | 2004 | 2006 | 2001 | 2004 | 2006 | ||||||||
| Internal | External | Sum | Internal | External | Sum | Internal | External | Sum | |||||
| 1 | Biotechnology | 1848 | 2343 | 2869 | 473 | 123 | 596 | 645 | 230 | 875 | 734 | 322 | 1056 |
| 2 | Computers and peripherals | 161,209 | 138,245 | 101,496 | 13,238 | 36,765 | 50,003 | 13,242 | 34,080 | 47,322 | 13,302 | 27,203 | 40,505 |
| 3 | Communication | 56,123 | 60,530 | 45,266 | 5183 | 11,751 | 16,934 | 4710 | 14,634 | 19,344 | 4741 | 12,162 | 16,903 |
| 4 | Integrated circuit | 375,719 | 742,738 | 795,362 | 63,772 | 36,410 | 100,182 | 118,443 | 83,065 | 201,508 | 108,865 | 81,117 | 189,982 |
| 5 | Optoelectronics | 62,217 | 131,871 | 161,290 | 9245 | 12,866 | 22,111 | 20,681 | 22,916 | 43,597 | 26,285 | 28,058 | 54,343 |
| 6 | Precision machinery | 4284 | 8835 | 12,797 | 652 | 673 | 1325 | 1183 | 1515 | 2698 | 1729 | 2948 | 4677 |
| Total | 661,400 | 1,084,562 | 1,119,080 | 92,563 | 98,588 | 191,151 | 158,904 | 156,440 | 315,345 | 155,657 | 151,810 | 307,467 | |
3.1.3. Direct and Indirect Water Footprints
3.2. The Water Footprint Index
| Sector | Water Footprint per Unit of Output(ton/NT$1000) | |||||||||
|---|---|---|---|---|---|---|---|---|---|---|
| 2001 | 2005 | 2006 | ||||||||
| Internal | External | Sum | Internal | External | Sum | Internal | External | Sum | ||
| 1 | Biotechnology | 2.56 | 0.67 | 3.23 | 2.75 | 0.98 | 3.74 | 2.56 | 1.12 | 3.68 |
| 2 | Computers and peripherals | 0.82 | 2.28 | 3.10 | 0.96 | 2.46 | 3.42 | 1.31 | 2.68 | 3.99 |
| 3 | Communication | 0.92 | 2.09 | 3.02 | 0.78 | 2.42 | 3.20 | 1.05 | 2.69 | 3.73 |
| 4 | Integrated circuit | 1.70 | 0.97 | 2.67 | 1.59 | 1.12 | 2.71 | 1.37 | 1.02 | 2.39 |
| 5 | Optoelectronics | 1.47 | 2.08 | 3.55 | 1.57 | 1.73 | 3.31 | 1.63 | 1.74 | 3.37 |
| 6 | Precision machinery | 1.52 | 1.57 | 3.09 | 1.34 | 1.72 | 3.05 | 1.42 | 2.23 | 3.65 |
| Total | 8.99 | 9.66 | 18.66 | 8.99 | 10.43 | 19.43 | 9.34 | 11.48 | 20.81 | |
4. Conclusions and Recommendations
4.1. Conclusion
4.2. Recommendations
4.2.1. Emphasizing Indirect Water Use
4.2.2. Including Grey Water Footprint for Evaluation
4.2.3. Increasing the Awareness of the Government and Enterprises on Water Footprints
Acknowledgments
Conflicts of Interest
References
- Lambooy, T. Corporate social responsibility: Sustainable water use. J. Clean. Prod. 2011, 19, 852–866. [Google Scholar] [CrossRef]
- Water Resources Agency (WRA). Ministry of Economic Affairs, Taiwan. Available online: http://wuss.wra.gov.tw/facarea.aspx (accessed on 12 January 2013).
- Chen, H.S.; Chien, L.H.; Hsieh, T. A study of assessment indicators for environmental sustainable development of science park in Taiwan. Environ. Monit. Assess. 2013, 185, 7001–7012. [Google Scholar] [CrossRef] [PubMed]
- Chen, Y.; Chen, C.Y.; Hsieh, T. Establishment and applied research on environmental sustainability assessment indicators in Taiwan. Environ. Monit. Assess. 2009, 155, 407–417. [Google Scholar] [CrossRef] [PubMed]
- Chen, Y.; Chen, C.Y.; Hsieh, T. Exploration of sustainable development by applying green economy indicators. Environ. Monit. Assess. 2011, 182, 279–289. [Google Scholar] [CrossRef] [PubMed]
- Falkenmark, M. Comparative hydrology—A new concept. In Comparative Hydrology: An Ecological Approach to Land and Water Resources; Falkenmark, M., Chapman, T., Eds.; Unesco: Paris, France, 1989; pp. 10–42. [Google Scholar]
- Seckler, D.; Amarasinghe, U.; Molden, D.; de Silva, R.; Barker, R. World Water Demand and Supply, 1990 to 2025: Scenarios and Issues; Research Report 19; International Water Management Institute: Colombo, Sri Lanka, 1998. [Google Scholar]
- Sullivan, C.A.; Meigh, J.R.; Giacomello, A.M. The water Poverty Index: Development and application at the community scale. Nat. Resour. Forum 2003, 27, 189–199. [Google Scholar] [CrossRef]
- Raskin, P.; Gleick, P.; Kirshen, P.; Pontius, G.; Strzepek, K. Water Futures: Assessment of Long-Range Patterns and Problems; Comprehensive Assessment of the Freshwater Resources of the World; Stockholm Environment Institute: Stockholm, Sweden, 1997. [Google Scholar]
- Morrison, J.; Schulte, P.; Christian-Smith, J.; Orr, S.; Hepworth, N.; Pegram, G. The CEO Water Mandate Guide to Responsible Business Engagement with Water Policy. Available online: http://www.unglobalcompact.org/docs/issues_doc/Environment/ceo_water_mandate/Guide_Responsible_Business_Engagement_Water_Policy.pdf (accessed on 16 February 2011).
- Hoekstra, A.Y.; Chapagain, A.K. Globalization of Water: Sharing the Planet’s Freshwater Resources; Blackwell: Oxford, UK, 2008. [Google Scholar]
- Hoekstra, A.Y.; Chapagain, A.K. Water footprints of nations: Water use by people as a function of their consumption pattern. Water Resour. Manag. 2007, 21, 35–48. [Google Scholar] [CrossRef]
- Aldaya, M.M.; Hoekstra, A.Y. The water needed for Italians to eat pasta and pizza. Agric. Syst. 2010, 103, 351–360. [Google Scholar] [CrossRef]
- Velázquez, E.; Madrid, C.; Beltrán, M.J. Rethinking the concepts of virtual water and water footprint in relation to the production-consumption binomial and the water-energy nexus. Water Resour. Manag. 2011, 25, 743–761. [Google Scholar] [CrossRef]
- Ercin, A.E.; Aldaya, M.M.; Hoekstra, A.Y. Corporate water footprint accounting and impact assessment: The case of the water footprint of a sugar-containing carbonated beverage. Water Resour. Manag. 2011, 25, 721–741. [Google Scholar] [CrossRef]
- Chapagain, A.K.; Hoekstra, A.Y. The water footprint of coffee and tea consumption in The Netherlands. Ecol. Econ. 2007, 64, 109–118. [Google Scholar] [CrossRef]
- Chapagain, A.K.; Orr, S. An improved water footprint methodology linking global consumption to local water resources: A case of Spanish tomatoes. J. Environ. Manag. 2009, 90, 1219–1228. [Google Scholar] [CrossRef]
- Bulsink, F.; Hoekstra, A.Y.; Booij, M.J. The water footprint of Indonesian provinces related to the consumption of crop products. Hydrol. Earth Syst. Sci. 2010, 14, 119–128. [Google Scholar] [CrossRef]
- Mekonnen, M.M.; Hoekstra, A.Y. The green, blue and grey water footprint of crops and derived crop products. Hydrol. Earth Syst. Sci. 2011, 15, 1577–1600. [Google Scholar] [CrossRef]
- Hoekstra, A.Y.; Mekonnen, M.M. The water footprint of humanity. Proc. Natl. Acad. Sci. 2012, 109, 14–25. [Google Scholar]
- Zhao, X.; Chen, B.; Yang, Z.F. National water footprint in an input-output framework—A case study of China 2002. Ecol. Model. 2009, 220, 245–253. [Google Scholar] [CrossRef]
- Wang, H.; Wang, Y. An input-output analysis of virtual water uses of the three economic sectors in Beijing. Water Int. 2009, 34, 451–467. [Google Scholar] [CrossRef]
- Zhao, X.; Yang, H.; Yang, Z.F.; Chen, B.; Qin, Y. Applying the input-output method to account for water footprint and virtual water trade in the Haihe River basin in China. Environ. Sci. Technol. 2010, 44, 9150–9156. [Google Scholar] [CrossRef] [PubMed]
- Aviso, K.B.; Tan, R.R.; Culaba, A.B.; Cruz, J.B., Jr. Fuzzy input-output model for optimizing eco-industrial supply chains under water footprint constraints. J. Clean. Prod. 2011, 19, 187–196. [Google Scholar] [CrossRef]
- Chapagain, A.K.; Hoekstra, A.Y. The blue, green and grey water footprint of rice from production and consumption perspective. Ecol. Econ. 2011, 70, 749–758. [Google Scholar] [CrossRef]
- Elena, G.C.; Esther, V. From energy to water: The virtual water content and water foot print of biofuel consumption in Spain. Energy Policy 2010, 38, 1345–1352. [Google Scholar] [CrossRef]
- Yu, Y.; Hubacek, K.; Feng, K.; Guan, D. Assessing regional and global water footprints for the UK. Ecol. Econ. 2010, 69, 1140–1147. [Google Scholar] [CrossRef]
- Gerbens-Leenes, P.W.; Hoekstra, A.Y.; van der Meer, T.H. Water footprint of bio-energy and other primary energy carriers. In Value of Water Research Report Series No. 29; UNESCO-IHE: Delft, The Netherlands, 2008. [Google Scholar]
- Van Oel, P.R.; Hoekstra, A.Y. The green and blue water footprint of paper products: Methodological considerations and quantification. In Value of Water Research Report Series No. 46; UNESCO-IHE: Delft, The Netherlands, 2010. [Google Scholar]
- Mekonnen, M.M.; Hoekstra, A.Y. The green, blue and grey water footprint of farm animals and animal products. In Value of Water Research Report Series No. 48; UNESCO-IHE: Delft, The Netherlands, 2010. [Google Scholar]
- Hoekstra, A.Y.; Hung, P.Q. Virtual water trade: A quantification of virtual water flows between nations in relation to international crop trade. In Value of Water Research Report Series No. 12; Hoekstra, A.Y., Ed.; UNESCO-IHE: Delft, The Netherlands, 2003; pp. 25–48. [Google Scholar]
- Hoekstra, A.Y.; Chapagain, A.K.; Aldaya, M.M.; Mekonnen, M.M. The Water Footprint Assessment Manual: Setting the Global Standard; Earthscan: London, UK, 2011. [Google Scholar]
- Hoekstra, A.Y.; Chapagain, A.K.; Aldaya, M.M.; Mekonnen, M.M. Water Footprint Manual: State of the Art 2009; Water Footprint Network: Enschede, The Netherlands, 2009. Available online: http://www.waterfootprint.org/downloads/WaterFootprintManual2009.pdf (accessed on 2 February 2011).
- Zhao, C.F.; Chen, B. Driving force analysis of the agricultural water footprint in China based on the LMDI method. Environ. Sci. Technol. 2014, 48, 12723–12731. [Google Scholar] [CrossRef] [PubMed]
- Zhao, C.F.; Chen, B.; Hayat, T.; Alsaedi, A.; Ahmad, B. Driving force analysis of water footprint change based on extended STIRPAT model: Evidence from the Chinese agricultural sector. Ecol. Indic. 2014, 47, 43–49. [Google Scholar] [CrossRef]
- Fang, D.L.; Fath, B.D.; Chen, B.; Ursula, S. Network environ analysis for a socio-economic water system. Ecol. Indic. 2014, 47, 80–88. [Google Scholar] [CrossRef]
- Hoekstra, A.Y.; Hung, P.Q. Virtual water trade, a quantification of virtual water flows between nations in relation to international crop trade. In Value of Water Research Report Series No. 11; UNESCO-IHE: Delft, The Netherlands, 2002. [Google Scholar]
- Chapagain, A.K.; Hoekstra, A.Y. Water footprint of nations. In Value of Water Research Report Series No. 16; UNESCO-IHE: Delft, The Netherlands, 2004. [Google Scholar]
- Oki, T.; Kanae, S. Virtual water trade and world water resources. Water Sci. Technol. 2004, 49, 203–209. [Google Scholar] [PubMed]
- Aldaya, M.M.; Hoekstra, A.Y.; Allan, J.A. Strategic importance of green water in international crop trade. In Value of Water Research Report Series No. 25; UNESCO-IHE: Delft, The Netherlands, 2008. [Google Scholar]
- Hanasaki, N.; Inuzuka, T.; Kanae, S.; Oki, T. An estimation of global virtual water flow and sources of water withdrawal for major crops and livestock products using a global hydrological model. Hydrol. Earth Syst. Sci. 2010, 384, 232–244. [Google Scholar]
- Leontief, W. Technological change, prices, wages, and rates of return on capital in the U.S. economy. In Input-Output Economics, 2nd ed.; Oxford University Press: New York, NY, USA, 1986. [Google Scholar]
- Munksgaard, L.; Jensen, M.B.; Pedersen, L.J.; Hansen, S.T.; Matthews, L. Quantifying behavioural priorities—Effects of time constraints on behaviour of dairy cows, Bos taurus. Appl. Anim. Behav. Sci. 2005, 92, 3–14. [Google Scholar] [CrossRef]
- Kondo, K. Economic analysis of water resources in Japan: Using factor decomposition analysis based on input-output tables. Environ. Econ. Policy Stud. 2005, 7, 109–129. [Google Scholar] [CrossRef]
- Guan, D.; Hubacek, K. Assessment of regional trade and virtual water flows in China. Ecol. Econ. 2007, 61, 159–170. [Google Scholar] [CrossRef]
- Chou, C.E.; Lee, G.E. Virtual water flows and food security in Taiwan. In Proceedings of the Joint Annual Conference of Taiwan Economic Association, Taiwan Society of Health Economics and Taiwan Agricultural and Resources Economics Association, Taipei, Taiwan, 12–15 December 2009.
- Zhang, Z.; Shi, M.; Yang, H.; Chapagan, A. An input-output analysis of trends in virtual water trade and the impact on water resources and uses in China. Econ. Syst. Res. 2011, 23, 431–446. [Google Scholar] [CrossRef]
- Feng, K.; Siu, Y.L.; Guan, D.; Hubacek, K. Assessing regional virtual water flows and water footprints in the Yellow River Basin, China: A consumption based approach. Appl. Geogr. 2012, 32, 691–701. [Google Scholar] [CrossRef]
- Chou, C.E.; Lee, G.E. Establishment of Environment Value Matrix of Green Accounting and Index Systems; Research project commissioned by the National Science Council: Taipei, Taiwan, 2006. [Google Scholar]
- Wiedmann, T.; Lenzen, M.; Turner, K.; Barrett, J. Examining the global environmental impact of regional consumption activities—part 2: Review of input-output models for the assessment of environmental impacts embodied in trade. Ecol. Econ. 2007, 61, 15–26. [Google Scholar] [CrossRef]
- Lenzen, M.; Gallego, B.; Wood, R. Matrix balancing under conflicting information. Econ. Syst. Res. 2009, 21, 23–44. [Google Scholar] [CrossRef]
- Blackhurst, B.M.; Hendrickson, C.I.; Vidal, J.S. Direct and indirect water withdrawals for U.S. industrial sectors. Environ. Sci. Technol. 2010, 44, 2126–2130. [Google Scholar] [CrossRef]
© 2015 by the authors; licensee MDPI, Basel, Switzerland. This article is an open access article distributed under the terms and conditions of the Creative Commons Attribution license (http://creativecommons.org/licenses/by/4.0/).
Share and Cite
Chen, H.-S. Using Water Footprints for Examining the Sustainable Development of Science Parks. Sustainability 2015, 7, 5521-5541. https://doi.org/10.3390/su7055521
Chen H-S. Using Water Footprints for Examining the Sustainable Development of Science Parks. Sustainability. 2015; 7(5):5521-5541. https://doi.org/10.3390/su7055521
Chicago/Turabian StyleChen, Han-Shen. 2015. "Using Water Footprints for Examining the Sustainable Development of Science Parks" Sustainability 7, no. 5: 5521-5541. https://doi.org/10.3390/su7055521
APA StyleChen, H.-S. (2015). Using Water Footprints for Examining the Sustainable Development of Science Parks. Sustainability, 7(5), 5521-5541. https://doi.org/10.3390/su7055521