Abstract
This study explores the extent to which farmers in the Three Gorges Reservoir area remain highly dependent on agriculture despite rapid urbanization and industrialization. The study focuses on the factors that determine a household’s choice of livelihood strategy, with a particular focus on the production of and dependence on agricultural products. Using a sustainable livelihoods approach and survey data from farmers in the Three Gorges Reservoir area in China, the study provides a descriptive statistical analysis and ordinal logistic regression model that shows that close to 56% of households exhibit a low dependence on agriculture. The following variables had a significant influence on livelihood strategy: the maximum years of education of any household member; the age of the household head; the number of laborers in a household; household location; and formal and informal social networks. Regardless of whether the household had children, house value and fixed assets had no significant influence on livelihood strategy. According to the analysis results, we put forward the suggestions that government departments increase investment in infrastructure and make loan policies more favorable for farmers so as to encourage rural able-person to use their social networks to actively establish businesses at migrant destinations.
1. Introduction
The hill and mountain areas in China occupy close to 69% of China’s total land area and are home to 45% of its population. The mountain areas are an essential component of regional development in the country [1,2], but are lagging behind. The incidence of poverty is higher in the mountains than in the plains as a result of the poor accessibility, fragile ecological environment, and tense relationship between people and the land, as well as low social economic development. Poverty in China is mainly found in rural areas, and in the mountains is particularly prevalent, especially in the southwest mountain areas [3,4]. Following the economic system reforms of the 1980s, China has gradually entered a stage of rapid urbanization and industrialization, and now a large number of rural migrant workers leave their villages every year for industries in the cities [5]. Simultaneously, farmers’ livelihood strategies are diversifying. For example, the share of agriculture in household net income is decreasing, while the share of off-farm income is increasing. According to recent statistics, the total number of rural laborers working off-farm nationwide reached 262.6 million in 2012, 163.4 million (62.2%) of them as migrant workers [6]. Farmers’ wage income represented 43% of net income, an increase of 23% since 1990 [7]. For development planning and poverty reduction, it is important to know how these broad statistics relate to the actual situation in specific areas. What is the proportion of migrant farmers in mountain areas, especially in the poor settlements in the southwest? What proportion of household income is provided by agriculture and labor? Is the common assumption that the poorer an area is the greater is the dependence on agriculture true or not? And what are the major factors affecting a household’s choice of livelihood strategy? This study has been designed to answer some of these questions.
A number of authors have shown that poverty can be assessed on the basis of the capital owned by a household [8,9]. At the same time, the portfolio of a household livelihood capital will affect the household livelihood strategy [2,10,11,12,13]. Researchers have used various approaches to classify livelihood strategies. For example, Fang classified livelihood strategies into two types, farm and off-farm [2]; Diniz classified into three types, livestock-oriented, diversified-oriented, and off-farm-oriented [13]; and Alemu into four types—only farm, farm and non-farm, only non-farm, and non-labor [11]. Others also consider the share of forestry and animal husbandry in household income, for example household livelihood strategies can also be classified into less dependence, moderate dependence, high dependence, and very high dependence on forest/livestock income [10,14]. Few studies have considered household livelihood strategies in terms of the share of agricultural income to household net income. China has an ancient history as an agricultural country. In the poorly accessible mountain areas, agricultural income has always been a major part of household income. However, this situation started to change recently when large numbers of people started migrating to work in other areas. In this context, to formulate a sound poverty alleviation policy, it is important to explore the extent to which the income of households in mountainous areas still depends on agriculture (i.e., the share of agricultural net income to household net income) and to clarify the key factors that influence the selection of household livelihood strategies.
Research regarding the relationship between farmers’ livelihood capital and livelihood strategies is quite abundant [2,10,11,12,13], whereas studies of farmers’ livelihood capital and livelihood strategies in mountainous areas are relatively limited. This situation provides a valuable reference for implementing this research. However, compared with the relevant research areas [12], China’s mountainous areas (especially the mountainous areas in the west) have their own peculiarities (such as land fragmentation and the obvious contradiction between people and land). Therefore, the relevant research conclusions are not necessarily consistent with the research conclusions of China’s mountainous areas. The specific relationship between farmers’ livelihood capital and selections of livelihood strategies in China’s mountainous areas requires further discussion. Due to differences in nature, economy, culture, and other aspects of studies in various countries, there will be some differences when various types of farmers’ livelihood capital are specifically quantified. For instance, Babulo’s [10] and Bhandari’s [12] studies did not consider the influence of the social relation network on farmers’ livelihood strategies, whereas the relevant research in China showed that farmers’ social relation network could have a significant influence on the selection of household livelihood strategies [1,8]. From this perspective, establishing an indicator system of farmers’ livelihood capital that conforms to the actual situation in China’s mountainous areas, clarifying the relationship between this capital and the selection of livelihood strategies, and comparing with the relevant research results could provide some implications for future research. From two dimensions, namely the research areas (i.e., China’s typical mountainous areas) and the quantification of the indicator system of livelihood capital, the research has enriched the field and could inspire future research.
2. Methods and Data
2.1. Sustainable Livelihoods Analysis Framework
Livelihood refers to the means of earning a living or the activities undertaken by a family to obtain the basic materials needed to sustain household survival and development [15]. Based on this, many scholars have put forward the concept of “sustainable livelihoods”. According to Scoones, “sustainable livelihoods” refers to the means of earning a living, the basis in terms of capabilities and assets (including reserves, resources, claims, and entitlements), and the activities themselves. If people can cope with stress and shocks; restore, maintain, and increase assets; maintain and improve their ability; provide an opportunity for the survival of the next generation; and earn net income for the livelihood of others in both the long and short term, without damaging the natural basis, the livelihood will be sustainable [16]. Many sustainable livelihood analysis frameworks have been proposed. The most influential and widely used is the Sustainable Livelihoods Approach Framework (SLA framework) proposed by DFID (the UK Department for International Development). This framework places rural poor people at the center of a web of inter-related influences that affect how these people create a livelihood for themselves and their households. The core content of this framework is the asset pentagon, the five types of assets that form the core of livelihood resources: financial, human, natural, physical, and social capital [10,17,18]. Farmers can use their assets or other poverty reduction factors to improve their living conditions [1,2,15]. The asset portfolio and application method influences farmers’ strategies for achieving their livelihood objectives [17]. The SLA framework emphasizes the need to analyze the many factors that affect both livelihood and the process, attempts to distinguish the main factors affecting livelihood and the interactions between them, and plays an important role in understanding livelihood, especially the livelihoods chosen by the poor [2,18]. The present study used the SLA framework to analyze the factors that influence a household’s choice of livelihood strategy, with a particular focus on the production of and dependence on agriculture products.
2.2. Study Area
The Three Gorges Reservoir area comprises 19 county-level administrative areas over an area of 54,200 km2 affected by inundation under the Three Gorges Project (TGP). In this area, agriculture mainly consists of crop cultivation and livestock and rarely large-scale forestry. The area is an important part of the upper reaches of the Yangtze River economic zone. At the end of 2012, the area had a population of 14.5 million, with a population density of 374 people/km2, nearly 2.7 times the national average. Arable land accounts for 40% of the land area and the average size of arable land per capita is 0.05 hm2, lower than the national average (0.07 hm2). Sixty percent of the population works in agriculture. The narrow strip of land is too densely populated, which leads to tension among people and overexploitation and degradation of the environment. In addition, the per capita net income of the rural residents is 7180 Yuan (USD 1160), 9.3% lower than the national average for the rural population [6].
2.3. Data Source
This study mainly used data from a survey conducted in August 2013 in the Three Gorges Reservoir area. The survey sample was determined using a combination of stratified sampling and equal probability random sampling. Sample counties were selected by building a target system that included economic development, industrial structure, social development, resources, environmental conditions, and traffic accessibility, with a total of 19 indicators. Considering the possibility of completing the field research, principal component analysis and system clustering were used to divide the 19 counties (districts) in the Three Gorges Reservoir area into four categories. One county was selected at random from each category, giving four sample counties: Yubei, Zhongxian, Wanzhou, and Wuxi. Following the selection of the sample counties, 109 townships in four counties were used as a study unit. Considering the undulating natural terrain features of mountainous areas and the workload required for the field survey, we divided the 109 townships into two categories based on the altitude of the townships and then randomly selected a sample township from each category. Each sample county included two sample townships, comprising a total of eight townships. Eventually, considering project funding and field investigation workload, we used a hierarchical clustering method to divide the 107 villages into two categories based on the village economic development level and the distance from the villages to townships. Considering the remote and closed study area, the homogeneity of farmers living in the same village is relatively strong. From 5345 total sample households, we randomly selected 22 sample households from the roster of each sample village, then 11 researchers conducting household questionnaire surveys investigated two sample households in every sample village. The total number of households in the sample was 352. During data analysis, the data were cleaned by excluding invalid questionnaires based on missing data or nonsensical responses. Finally, the data from 349 valid household questionnaires were used for analysis. The spatial locations of the sample counties and sample villages are shown in Figure 1.
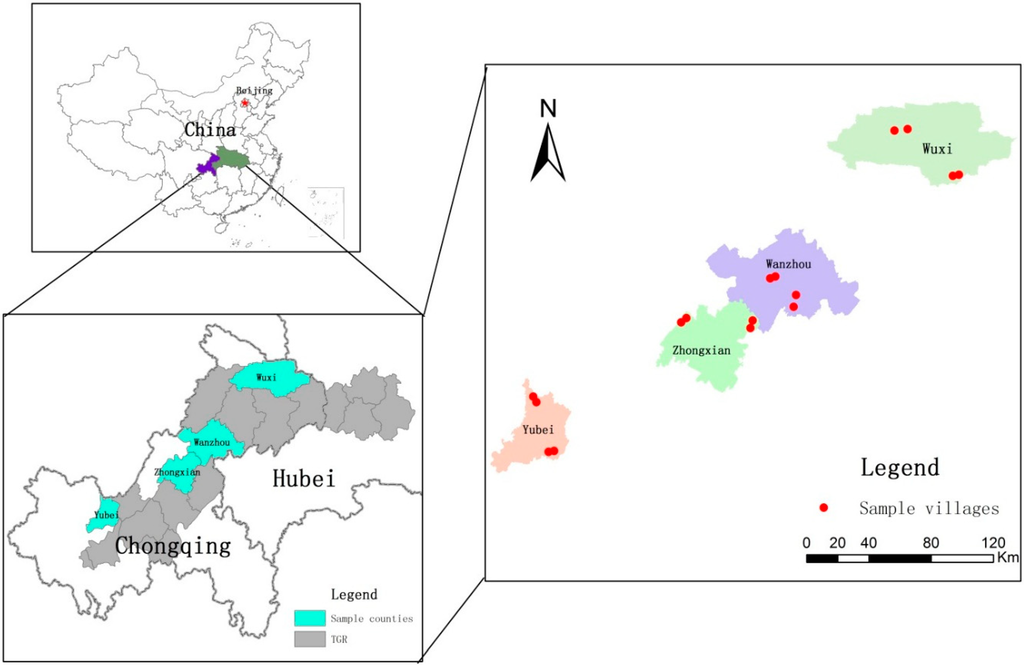
Figure 1.
Distribution of the sample counties and villages.
2.4. The Design of the Dependent Variable
2.4.1. Income Sources and Income Accounting
Farm households’ net income was divided into four types: agriculture net income, off-farm net income, transfer net income, and miscellaneous income. Agriculture net income comprised planting net income, livestock net income, and forestry net income. Off-farm net income comprised family members’ labor net income and proprietary industrial business net income. Two simplifying assumptions were made in the process of calculating farm households’ net income. First, own-labor value was not deducted from net income because estimating the opportunity cost of labor time (shadow wage rate) is difficult and inconsistent. Second, for calculating agriculture net income, cash income was calculated by multiplying the crop yields, livestock yields, and forestry yields by the unit price in the market, but changes in supply and demand and loss of income from unsold yield were not taken into account.
Finally, each of the four income items was estimated as follows:
- (1)
- Agriculture net income was calculated by subtracting the cost of inputs used in the production process, such as seed and starter animals, fodder, fertilizer, pesticides, agricultural film, irrigation, livestock medicine, and so on from the gross income from crops, livestock, and forestry calculated by multiplying crop yields, livestock yields, and forestry yields (mainly fruit) by the unit price in the market in the investigation year.
- (2)
- Off-farm net income was calculated by adding family members’ net income from labor, including wages and welfare income, and net income from any proprietary industrial business.
- (3)
- Transfer net income was calculated by subtracting the total household expenditure on monetary gifts for weddings and funerals of relatives and friends from the gross transfer income, taken as the sum of state policy subsidies (such as reforestation subsidies, grain supplement, seed subsidies, propagation sowing subsidies, low-income household subsidies, Five Guarantees families and party members subsidies, retired military subsidies, and so on) and monetary gifts from friends and relatives.
- (4)
- Other miscellaneous income was calculated as the sum of all income not included under agriculture net income, off-farm net income, and transfer net income, such as land rental fees, interest on bank deposits, and other income.
2.4.2. Clustering Sample Households
The share of agriculture net income to total household net income was calculated for each household and used to group sample households into four groups according to the share of net income from agriculture, and thus dependence on agriculture and interpreted in terms of livelihood strategies (LS): LS 1, <20% = less dependent; LS 2, 20%–40%, = moderately dependent; LS 3, 40%–60%, = highly dependent; and LS 4 >60%, = extremely dependent.
2.5. The Design of the Independent Variable and Hypotheses
Using the SLA framework as a base, the factors affecting farmers’ choices of livelihood strategies were divided into five types of capital: human, physical, natural, financial, and social. Selecting too many indices can lead to endogeneity problems in the econometric analysis. One solution is to carefully select the indices and carry out a multicolinearity test [19]. The asset-based explanatory variables used here were carefully chosen to mitigate the problem of endogeneity. The name and description of the indicators used to calculate the different types of capital are shown in Table 1.

Table 1.
Name and definition of the indicators used to calculate different types of capital.
| Variable | Definition |
|---|---|
| Human capital | |
| pop | household size |
| lab | number of laborers in household |
| children | whether the household has children aged 6–13 years old (1 = yes; 0 = no) |
| hhage | age of household head in years |
| hhedu | years of education of household head |
| maxhedu | maximum years of education of any household member |
| Physical capital | |
| fiasvalue | current market value (in Yuan a) of all the fixed assets that a household possesses |
| hovalue | current market value (in 10,000 Yuan a) of the value of the house(s) that a household possesses |
| disc | distance from household to the nearest county center (kilometers) |
| Natural capital | |
| area | household’s per capita area of cultivated land (mu) b |
| Financial capital | |
| loan | whether the household loaned from formal financial channels (such as banks) in the past five years (1 = yes; 0 = no) |
| borrow | whether the household borrowed from relatives and friends in the past five years (1 = yes; 0 = no) |
| Social capital | |
| sonwohelp | the social network of relatives and friends available for assistance when seeking non-farm work (1 = none; 2 = underdeveloped; 3 = developed) |
| sonmohelp | the social network of relatives and friends available for assistance when in urgent need of a lot of money (1 = none; 2 = underdeveloped; 3 = developed) |
| whpafaass | does household head participate in a farming association? (1 = yes; 0 = no) |
a 1 USD = 6.19 Yuan (at the time of the study); b 1 mu ≈ 667 m2 or 0.667 ha.
2.5.1. Human Capital and the Effect on Livelihood Strategy Selection
Human capital includes such things as health, knowledge and skills, labor capacity, and adaptability and is the basis of a farmer’s livelihood. The quantity and quality of human capital directly determine the ability and scope of the farmers to control the other types of capital [17]. Six indicators were selected in the study to measure human capital: household size, number of laborers in a household, whether the household has children aged 6–13 years old, the age of the household head, the years of education of the household head, and the maximum years of education of any one household member. A laborer was taken to be any healthy 16- to 64-year-old individual able to engage in manual labor, excluding school students.
Generally, the larger the family size is, the greater the daily consumption will be; thus, the heavier the burden on the laborers. In the study area, the average size of arable land per capita is 0.05 hm2. This provides only enough food and clothing for the family and not enough to account for large expenditure (such as hospital expenses). Additionally, seasonal agricultural production will produce large amounts of surplus labor. The intense conflicts between the people and the land and the comparison of migrant worker income (higher than agricultural income) have become strong push and pull forces for the migration of the surplus labor in mountainous areas [20]. In this case, if the older people at home can take care of the children and address the farming, migrant work becomes a strategy for young laborers to reduce the family burden. If the older people cannot take care of the children because of physical discomfort or the need to be looked after, the laborers will have to carry out the farming tasks at home or work nearby [21].The reality in the study area is that young laborers choose to migrate, driven by economic interests, leaving the elderly at home to carry on farming and take care of grandchildren. Thus, the hypothesis is that the more family members and laborers there are, the more household income will depend on wages and the less it will be dependent on agriculture (H1).
The age of the household head is also thought to have an important influence on livelihood strategies. Other studies indicate that younger individuals tend to have fewer family burdens, higher energy, and relatively higher educational levels and are more willing to take employment in distant cities [20,22]. Conversely, older individuals with a heavy family burden and declining physical condition prefer local employment that allows them to manage agricultural production during the harvest season. Elderly farmers have few opportunities for off-farm employment, and changing their livelihood strategy may not be a viable option [10]. Thus, the hypothesis is that the older the household head, the more likely the household is to depend on agriculture and agricultural income (H2).
Research experience suggests that in many developing countries, involvement of children in family farming is significant in poor rural agrarian areas [12,22,23]. In the mountainous areas of China, things may be slightly different. On the one hand, children not only can help parents share housework (such as meal preparation) but can also perform farm work (such as harvesting corn). This will prompt the adult labor force to spend more time on agricultural production and further increases agricultural income. On the other hand, as a result of the agricultural and non-agricultural assistance of children, part of the surplus labor force is released and migrates to increase the non-agricultural income. The hypothesis is that children have a significant influence on livelihood strategy, although the influence mechanism is unclear (H3).
Education is an indicator of the quality of a laborer’s human capital and is expected to have a significant influence on the choice of livelihood strategy. Previous studies have shown that people with higher levels of education are better able to obtain information about jobs and encounter greater opportunities through various industries. They are more competitive in the labor market and find it easier to access short-term non-agricultural work [24,25]. Thus, the hypothesis is that the more years of education the household head has, the more likely he or she will work outside and the household income will be less dependent on agriculture (H4). In practice, the household head is generally older and has a lower level of education than younger family members, so the study also included the indicator of the maximum years of education of any household member. The hypothesis is that the more years of education any household member has, the less the household income will depend on agriculture (H5).
2.5.2. Physical Capital and the Effect on Livelihood Strategy Selection
Three indicators were used to quantify physical capital: the present value of the physical home, the present value of the household fixed assets (The 15 types of fixed assets are: tractor, water pump, cattle, electric bicycle, motorcycle, motor tricycle, car, television, refrigerator, washing machine, mobile phone, air conditioning, water heater, modular furniture, computer), and the household location (i.e., distance from the household to the nearest county center). Fixed assets included productive tools (such as cattle and motorcycles) and durable consumer goods (such as computers and cell phones). Fifteen types of assets were selected based on the results of a preliminary investigation that showed the types of assets that farmers in the area possess. The value of housing and fixed assets was estimated by the respondents. To reduce subjective variation in the estimation, the investigators adjusted the estimated values based on the actual situation observed and then discussed and confirmed or readjusted these changes with the respondents to obtain the final valuations.
Chinese culture generally places less value on consumption (such as food, clothing etc.) and emphasizes income and assets. Thus, Chinese farmers are likely to regard asset accumulation as a productive goal [21]. The field research in this study also found that farmers preferred to invest in their houses. Valuable and attractive houses are both a cause for pride and extremely beneficial for the children’s marriage prospects, so farmers usually spend years of savings or go into debt to finance building a house. Of the 349 sample farmers, 147 (42%) estimated the value of their houses at more than 100,000 Yuan ($16,155). In this area, agricultural income alone is not sufficient to build such houses and most of the funds are likely to come from migrant work and borrowing from friends. The hypothesis is that the higher the value of the house, the more likely the farm household is to have adopted a livelihood strategy based on migrant work; thus, household income will be less dependent on agriculture (H6).
At present, the economic life pattern of “one month enjoying holidays, two months planting crops and nine months earning money” is popular among China’s rural laborers [21]. As a result, a “pendulum” floating population is emerging, with migrants returning to their home farms for a few months every year [26].
Compared to the pure farming households without migrant workers, households with migrant workers can earn more, and migrant remittance can be used for fixed assets [27,28,29]. The hypothesis is that the higher the present value of household fixed assets, the more likely it is that livelihood strategies will be migrant work-oriented; thus, household income will be less dependent on agriculture (H7).
The study also used distance from the household to the nearest county center as an indicator of household location. The greater the distance, the greater the cost of information exchanges and the more difficult it is for laborers to work outside. The hypothesis is that the greater the distance to the nearest county center, the more likely it is that livelihood strategies will focus on agricultural production; thus, household income will highly depend on agriculture (H8).
2.5.3. Natural Capital and the Effect on Livelihood Strategy Selection
Land is the most important natural capital for mountain households and is the basic existence guarantee for farmers, unemployment guarantee for migrant workers, and ultimate guarantee for ensuring a pension [26]. The indicator used to measure natural capital was the per capita area of cultivated land per household.
The Three Gorges Reservoir area is a typical mountainous area, with fragmented, scattered, and steep land. According to the survey, the average blocks of land cultivated by farm households was 11.5, with a range from 0 to 70. When the per capita area of cultivated land is larger, and/or the land is more fragmented and scattered, more labor will be needed to work it and the household is less likely to have surplus labor. The hypothesis is that the larger the per capita area of cultivated land, the more likely it is that livelihood strategies will focus on agricultural production; thus, household income will depend highly on agriculture (H9).
2.5.4. Financial Capital and the Effect on Livelihood Strategy Selection
Financial capital includes loans and free assistance obtained from both formal and informal channels. Two indicators were used to calculate financial capital: whether the household received loans from formal financial institutions (such as banks) in the last five years, and whether the household borrowed from relatives and friends in the last five years.
According to some scholars’ studies, the farmers’ risk management strategy is rational and the method of processing risks has a hierarchy [8,21]. Generally speaking, in the face of external shocks, the farmers will first reduce consumption and use savings to cope with the situation. If the savings are not enough, they will ask relatives and friends for loans; if this fails, they will turn to bank loans or other moneylenders. Households whose family members work outside year round can generally use their own savings to cope with the external shocks as they have relatively high wages, but households that are highly dependent on income from agriculture are more likely to be poor because of the low agricultural returns and high risks (such as extreme climate). The hypothesis is that the households with loans in the past five years are more dependent on agriculture than households without loans (H10).
2.5.5. Social Capital and the Effect on Livelihood Strategy Selection
Social capital refers to the social networks used by farmers to implement their livelihood strategies, including the community organizations and social networks built by individuals. Three indicators were used to quantify social capital: the social network available for assistance when seeking non-farm work, the social network available for assistance when in urgent need of money, and whether the household head was participating in a farm association. If the household has a large social network available for assistance when seeking non-farm work, it is more likely that the laborers will be able to obtain useful employment information and engage in non-farm work. The hypothesis is that the more developed the social networks of relatives and friends available for assistance when seeking non-farm work, the more likely it is that livelihood strategies will be oriented toward off-farm work; thus, household income will depend less on agriculture (H11).
Most migrant workers work off-farm year round (61% of the farm households had family members working off-farm for nine months or longer), and some households do not even engage in farm work. Thus, they may have fewer interactions (especially production interactions) with other villagers, weaker trust relationships, and relatively small social networks to rely on for assistance when in urgent need of a lot of money. The perennial farmers who are always farming at home develop strong relationships and increased trust them due to mutual assistance in daily life and production. The low income of agriculture often makes it difficult for households that are more dependent on agriculture to address external shocks (such as hospitalization expenses for the elderly). They are then forced to turn to friends and relatives for loans. During the process of borrowing, trust relationships are further strengthened. Therefore, the number of friends and relatives available for assistance when in urgent need of a lot of money is increased in these households. The hypothesis is that the more developed the social networks of relatives and friends available for assistance when in urgent need of a lot of money, the more likely it is that a household depends on agriculture (H12).
Households whose household head participates in a farm association are likely to have advantages in terms of obtaining agricultural technical guidance, choosing new crop varieties, etc., which will help increase their agricultural income. The hypothesis is that if the household head participates in a farm association, household income will highly depend on agriculture (H13).
2.6. Analytical Method
Because the dependent variable (dependence on agriculture) is an ordinal categorical variable, and the independent variable contains not only continuous variables (such as t household size) but also categorical variables (such as whether the household has children aged 6–13 years old), we used the ordinal logistic regression model to identify the factors that influence a household’s choice of livelihood strategy. Additionally, we obtained model parameters by using the maximum likelihood estimation method, and the above process was achieved by Stata 11.0.
3. Results and Discussion
3.1. Household Types and Description of Livelihood Strategies
Table 2 shows the number of sample households in each of the four livelihood strategy classes, the share of total household net income from each of the different sources, and the net value of total household income. The share of miscellaneous income in total household income was extremely small and not further considered. The great majority of households (56%) were less dependent on agriculture (income share < 20%); less than 18% were extremely dependent on agriculture (income share >60%).
Table 2.
Household income share in total income (by income source) and net total income (n = 349).
| LS Class | Agriculture Income Share | Dependence on Agricultural Income | No. of hh | Av. Income Share a | Net Household Income from All Sources | |||
|---|---|---|---|---|---|---|---|---|
| Agriculture | Off-Farm | Transfer | Mean b | Range | ||||
| LS1 | ≤20% | Less dep. | 197 | 0.094 (0.045) | 0.895 (0.170) | 0.011 (0.168) | 69,713 (34,278) | 12,000–233,800 |
| LS2 | (>20%–40%] | Moderately dep. | 65 | 0.291 (0.062) | 0.748 (0.301) | −0.039 (0.289) | 42,747 (24,672) | 6450–104,578 |
| LS3 | (>40%–60%] | Highly dep. | 24 | 0.482 (0.062) | 0.328 (0.255) | 0.191 (0.260) | 26,610 (22,456) | 3160–87,300 |
| LS4 | >60% | Extremely dep. | 63 | 1.011(0.732) | 0.130 (0.296) | −0.142 (0.679) | 9985 (9062) | 685–35,837 |
| Total | 349 | 0.337(0.485) | 0.679 (0.386) | −0.016 (−0.363) | 52,435 (38,172) | 685–233,800 | ||
Av. = average; dep. = dependent; hh = household; LS = livelihood strategy. a Numbers in parentheses = standard deviation. b 1 USD = 6.19 Yuan (at the time of the study).
On average, off-farm net income comprised 68% of total income, more than twice as the average share of agricultural income (34%). This suggests that farmers in the region are on average only moderately dependent on agriculture and are more oriented towards labor. This is consistent with the finding that 95% of households (331) that had at least one family member who worked outside reported that they had worked outside in the survey year. The share of the transfer net income to total income was negative (−1.6%); in other words, farmers’ monetary gift expenditure is more than the total income from policy subsidies and monetary gifts from friends and relatives. Monetary gifts have always been an important part of farm household expenditure in Southwest China. According to the survey, a household with extensive social networks can spend more than 80,000 Yuan ($12,924) in monetary gifts, whereas the average for all households was 3311 Yuan ($535).
In LS1, by far the largest group, approximately 91% of the share of an average household’s total income came from off-farm work, and dependence on agriculture was very low. In LS2, the share of off-farm work in net income was still high at 75%, but agriculture was a much more important source of income, providing more than a quarter of the net total (29%). There were only 24 households in LS3, 7% of the sample. These households were more dependent on agricultural income (48% share of net income) than off-farm income (33%). Farmers in LS4 were almost wholly dependent on agriculture, with off-farm income accounting for only 13% of the net total, and this was absorbed by the very high losses in farmers’ transfer net income, with a negative balance of −14%. Farmers in LS2 also spent more than they received in transfer income (net share: −4%), farmers in LS1 received approximately the same amount that they spent, and farmers in LS3 received a substantial amount that provided 19% of their net income. The average total household net income was strongly associated with the level of dependence on agriculture, with low dependence households having an average net income more than seven times that of the extremely dependent households (69,713 Yuan ($11,262) per year compared to 9985 Yuan ($1613) per year).
3.2. Factors Influencing Farmers’ Livelihood Strategies
Table 3 shows the Mean and Standard Deviation of the livelihood capital indicators under various types of livelihood strategies. The average household size was 4.1, including 2.7 laborers. Household size was related to dependence on agriculture and ranged from 2.9 for the most dependent households (LS4) to 4.6 for the least dependent (LS1). Thirty percent of the households have 6–13-year-old children, which ranged from 0.4 for the least dependent (LS1) to 0.2 for LS3. The mean age of the household heads was 48.8 years, with little variation among the groups, except for the least dependent group, which had somewhat younger heads of household. The average years of education of the household heads (7.0) was markedly lower than that of other household members (9.0); there was little variation among the groups except for the group most dependent on agriculture, in which both the household heads and other family members had lower levels of education (5.9 and 6.8 years, respectively).
Physical capital was assessed in terms of the market value of the house and fixed assets and distance from the nearest county center. As shown in Table 3, farmers with a greater dependence on agriculture tended to have less valuable fixed assets, whereas those with less dependence on agriculture tended to have more valuable houses. Households with the highest dependence on agriculture also tended to be located furthest from the county center (49.5 kilometers cf. 41.2 kilometers).
The natural capital comprised the area of cultivated land. The average land per capita cultivated per household was 0.6 mu (0.4 ha), or 2.5 mu (1.67 ha) for an average household, which is relatively low. The households most dependent on agriculture had the most land per capita (1.25 mu (0.83 ha)), and the households least dependent on agriculture had the least (0.38 mu (0.25 ha)).
Financial capital was assessed in terms of loans. As shown in Table 3, the households that were less dependent on agriculture had greater lending ratios (LS1 > LS4), whereas households that were more dependent on agriculture had greater borrowing ratios (LS4 > LS1), although the greatest amount was for LS2.
Social capital was determined in terms of the size of the social network of family and friends available to assist financially or in finding a job, as well as participation in a farm association. There was considerable variation between the groups, but no obvious relationship with the dependence on agriculture (LS1 had the most developed social network to assist with work, and LS2 had the most developed social network to help financially). Few household heads participated in a farm association, only 4% overall, with 11% of the LS3 households and 2% of the LS1 households.
Table 3.
Summary statistics for the explanatory variables (by LS class).
| Variable | Total Sample | LS1 (Less Dependent) (n = 197) | LS2 (Moderately Dependent) (n = 65) | LS3 (Highly Dependent) (n = 24) | LS4 (Extremely Dependent) (n = 63) | |||||
|---|---|---|---|---|---|---|---|---|---|---|
| Mean | S.D. | Mean | S.D. | Mean | S.D. | Mean | S.D. | Mean | S.D. | |
| pop | 4.10 | 1.62 | 4.55 | 1.46 | 4.28 | 1.62 | 3.17 | 1.55 | 2.87 | 1.40 |
| lab | 2.74 | 1.26 | 3.01 | 1.15 | 3.17 | 1.22 | 2.04 | 1.23 | 1.75 | 1.02 |
| children a | 0.34 | 0.48 | 0.40 | 0.49 | 0.34 | 0.48 | 0.17 | 0.38 | 0.24 | 0.43 |
| hhage | 48.75 | 10.51 | 45.53 | 9.01 | 50.86 | 9.19 | 55.75 | 13.34 | 53.95 | 11.26 |
| hhedu | 6.98 | 3.29 | 7.28 | 2.83 | 7.37 | 3.55 | 6.29 | 4.25 | 5.92 | 3.74 |
| maxhedu | 9.01 | 3.74 | 9.63 | 3.23 | 9.57 | 3.58 | 8.17 | 4.57 | 6.79 | 4.23 |
| ln(fiasvalue) | 8.68 | 1.05 | 8.85 | 0.90 | 8.72 | 0.82 | 8.40 | 1.20 | 8.17 | 1.43 |
| ln(hovalue) | 1.81 | 1.19 | 2.04 | 1.04 | 1.99 | 1.00 | 1.21 | 1.33 | 1.11 | 1.42 |
| disc | 43.83 | 18.27 | 41.24 | 17.32 | 48.20 | 19.30 | 38.45 | 18.63 | 49.46 | 18.06 |
| area | 0.60 | 0.84 | 0.38 | 0.46 | 0.75 | 0.67 | 0.58 | 0.56 | 1.17 | 1.49 |
| loan a | 0.35 | 0.48 | 0.35 | 0.48 | 0.43 | 0.50 | 0.29 | 0.46 | 0.30 | 0.46 |
| borrow a | 0.46 | 0.50 | 0.45 | 0.50 | 0.49 | 0.50 | 0.46 | 0.51 | 0.48 | 0.50 |
| sonwohelp a | 1.87 | 0.83 | 1.95 | 0.84 | 1.92 | 0.82 | 1.54 | 0.72 | 1.71 | 0.83 |
| sonmohelp a | 2.26 | 0.75 | 2.31 | 0.75 | 2.34 | 0.69 | 2.17 | 0.70 | 2.06 | 0.78 |
| whpafaass a | 0.04 | 0.19 | 0.02 | 0.14 | 0.06 | 0.24 | 0.08 | 0.28 | 0.05 | 0.21 |
a dummy variables.
3.3. Determinants of Livelihood Strategies
The results of the regression analysis are presented in Table 4. Collinearity diagnostics and tolerance statistics were used to diagnose potential multicollinearity problems [30]. No evidence of multicollinearity was found in the data. Meanwhile, to avoid the heteroscedasticity of the independent variable influencing the results, when building the z statistic, we used robust standard errors. The Wald chi2 is 119.94 (Prob > chi2 = 0.0000), which indicates that at least one of the independent variables has a significant influence on the dependent variable. Additionally, the Pseudo R2 of the model is 0.2032.
Table 4.
Ordinal logistic regression estimates and test statistics for the agriculture dependence model a.
| Explanatory Variables | Regression Coefficient | Robust Std. Err. | z | P > |z| | OR b |
|---|---|---|---|---|---|
| pop | −0.072 | 0.141 | −0.51 | 0.611 | 0.931 |
| lab | −0.544 *** | 0.176 | −3.09 | 0.002 | 0.580 |
| children | 0.225 | 0.339 | 0.66 | 0.507 | 1.252 |
| hhage | 0.328 *** | 0.125 | 2.63 | 0.009 | 1.388 |
| hhage2 | −0.002 ** | 0.001 | −2.04 | 0.042 | 0.998 |
| hhedu | 0.093 * | 0.053 | 1.76 | 0.078 | 1.097 |
| maxhedu | −0.155 *** | 0.050 | −3.10 | 0.002 | 0.856 |
| ln(fiasvalue) | 0.034 | 0.197 | 0.17 | 0.864 | 1.034 |
| ln(hovalue) | −0.170 | 0.141 | −1.21 | 0.228 | 0.843 |
| disc | 0.023 *** | 0.008 | 2.98 | 0.003 | 1.023 |
| area | 0.653 *** | 0.196 | 3.33 | 0.001 | 1.922 |
| loan c | −0.030 | 0.269 | −0.11 | 0.911 | 0.970 |
| borrow c | 0.681 *** | 0.263 | 2.59 | 0.010 | 1.975 |
| dum_sonwohelp_2 | −0.543 | 0.422 | −1.29 | 0.197 | 0.581 |
| dum_sonwohelp_3 | −1.110 ** | 0.557 | −1.99 | 0.046 | 0.329 |
| dum_sonmohelp_2 | 0.636 | 0.438 | 1.45 | 0.147 | 1.889 |
| dum_sonmohelp_3 | 1.033 * | 0.620 | 1.67 | 0.096 | 2.812 |
| whpafaass c | 2.315 *** | 0.625 | 3.71 | 0.000 | 10.121 |
Note: Number of obs = 349; Wald chi2 (18) = 119.94; Prob > chi2 = 0.0000; Pseudo R2 = 0.2032 OR = odds ratio. The names and definitions of the variables are given in the note for Table 1. a The reference category is LS1; b OR=EXP (B); c the reference category is 0. * Significant at α = 0.10; ** Significant at α = 0.05; *** Significant at α = 0.01.
3.3.1. Impact of Human Capital on Household Livelihood Strategy Selection
Inconsistent with hypothesis H1, the size of a household had no significant influence on household livelihood strategy, whereas the number of laborers did. The results suggest that dependence on agriculture is negatively associated with the number of laborers; the partial correlation coefficient is −0.544. Specifically, a one-person increase in the family labor force corresponds to a reduction of household income dependence on agriculture by 0.420 levels. One possible reason for this relationship is that the scattered land and lack of significant economic crops mean that agricultural income is generally low and does not feature as strongly as expected as a proportion of net income, even when agriculture is a major strategy. Furthermore, even when older people and children can help in farm work, the increase in agricultural income is relatively small, and when additional household members are aging, sick, or very young, they make demands on the labor force and actually reduce the output. Thus, the number of members available for labor is much more significant than household size alone.
Interestingly, the age of the household head had a significant influence on household livelihood strategy, and the relationship between the two is represented by an inverted U curve. This result is inconsistent with Babulo’s: his study shows that the age of the household head had no significant influence on household livelihood strategy [10]. In our study, when the age of the household head is below 82 years (0.328/(2 × 0.002)), the older the household head, the greater the dependence on agriculture (the partial correlation coefficient of the household head is 0.328). Specifically, with a one-year increase in the age of the household head, household income dependence on agriculture increases by 0.388 levels. The low educational level meant that the only outside options for most of the household heads in the survey were industries that demand high-intensity labor, such as construction. When age and poor health limited their ability to continue in such jobs, one option was to return to farming, with household income again more dependent on agriculture. When the household head is under 82 years of age, the older the household head, the lower the dependence on agriculture (the partial correlation coefficient of the household head square is −0.002). This is consistent with the actual situation in the study area. When the household head is too old to farm, there is naturally a reduced dependence on agriculture.
Interestingly, inconsistent with hypothesis H3, whether the household has children had no significant influence on the household livelihood strategy, although the partial regression coefficient is positive. This finding differs from the findings in other developing countries [12,22,23]. One possible reason for this difference is a different division standard of household livelihood strategy. For example, Bhandari’s study [12] divided the household livelihood strategy into two categories, left farming and continued farming, and drew a conclusion that working-age children are statistically important human capital measures in the decision to exit farming. This study separates household livelihood strategy into four categories according to the share of agriculture net income to total net income. The span between the four categories is large. For example, the agricultural income share of LS1 is less than 20%, whereas that of LS2 is more than 20% and less than 40%. So, even if children had a significant influence on whether the adult labor force engaged in agriculture, the degree should not significantly affect the proportion of household income. Whether children had a significant influence on labor transfer in this study area can be discussed in future studies.
Interestingly, consistent with the results of Babulo’s study [10], the number of years of education of the household head had a positive significant influence on household livelihood strategy, which is inconsistent with hypothesis H4 (more years of education, more likely to work outside). In contrast, the maximum years of education of any household member had a negative influence on household livelihood strategy, consistent with hypothesis H5. Specifically, with a one-year increase in education of the household head, the household income’s dependence on agriculture increases by 0.097 levels. With a one-year increase in the maximum years of education of any household member, the household income’s dependence on agriculture decreases 0.144 levels. One possible reason for this relationship is that the low level of rural economic development and relative scarcity of advanced agricultural equipment meant that agricultural production in the region was labor-intensive, which generally limited the years of education of all household heads. Generally, when new agricultural production tools and technologies emerge, households with higher education will adopt them earlier [8,20], and this will make household income more dependent on agriculture. Meanwhile, the household members who had received the most education were mostly young or middle-aged (79 of the 97 people with a high school background were under the age of 45) and probably more inclined to migrate, partially to be able to support children and elderly parents financially. Thus, having a family member with a higher educational level was reflected in income from labor being more important than income from agriculture.
3.3.2. Impact of Physical Capital on Household Livelihood Strategy Selection
Surprisingly, inconsistent with hypotheses H6 and H7, the value of houses and fixed assets had no significant influence on the household livelihood strategy. The reason the former was not significant is that houses have become a symbol of wealth for farmers: valuable and attractive houses are both a cause for pride and are extremely beneficial for the children’s marriage prospects, so farmers usually spend years of savings or go into debt to finance building a house [20]. So, except for a few rich households, there is no significant difference among the house value of most households. Fixed assets had no significant influence on household livelihood strategy. This is consistent with the result of Babulo’s study [10]. This finding may be in part because the value of agricultural production tools (such as pumps, dozen rice machine, etc.) is generally low and there is no obvious difference between farmers. At the same time, there are very few families that can afford expensive fixed assets (such as cars, computers, etc.) due to low education levels and low income. Furthermore, most of the families can afford the commonly used fixed assets (such as mobile phones, televisions, refrigerators, etc.); however, the purchasing power of the wage-based income households is relatively stronger. Thus, the value of these commonly used fixed assets in these households is generally higher than in households that are highly dependent on agriculture, but there is still no obvious difference between farmers. This relationship can be confirmed from the LS1 to LS4 households’ descending value of fixed assets. Additionally, another reason that the value of houses and fixed assets had no significant influence on the household livelihood strategy is that the livelihood vulnerability of households in southwest mountainous areas is strong, whereas the strike capabilities of households are weak. So, households often save their cash income to resist external shocks rather than invest in houses or fixed assets. This has been proved by Chen’s [8] and Tai’s [20] studies.
The distance from a household to the nearest county center had a positive influence on the household livelihood strategy, consistent with hypothesis H7 (the greater the distance, the greater the dependence on agriculture). Specifically, with a 1-km increase in the distance to the nearest town center, the household income’s dependence on agriculture increases by 0.023 levels. Greater distance means reduced access to labor and other markets, an increased need for self-sufficiency, and greater dependence on agriculture.
3.3.3. Impact of Natural Capital on Household Livelihood Strategy Selection
Consistent with the results of Babulo’s [10] and Jansen’s [31] studies, the per capita cultivated land area had a positive influence on livelihood strategy, consistent with hypothesis H8 (more land is related to increased dependence on agriculture). Specifically, with a 1-mu increase in per capita cultivated land area, the household income’s dependence on agriculture increases by 0.922 levels. One possible reason for this relationship is that having more land means that more labor is required and that family members are less able to migrate; thus, the dependence on agriculture is greater.
3.3.4. Impact of Financial Capital on Livelihood Strategy Selection
Interestingly, on the one hand, consistent with the findings of Babulo’s study [10], whether a household had loans had no significant influence on the household livelihood strategy (inconsistent with hypothesis H10). On the other hand, consistent with hypothesis H10, whether a household had borrowed had a positive influence on the livelihood strategy. Specifically, the households with loans are 1.975 times more dependent on agriculture than the households without loans. One reasonable explanation for this phenomenon is that farmers who are dependent on agriculture are more likely to be exposed to risks from factors such as extreme weather, pests, and natural disasters, especially given the lack of support facilities, such as irrigation. They are also less likely to have savings available to cope with demands for events such as weddings, funerals, children’s schooling, and abnormal medical charges. Thus, households dependent on agriculture are more likely to have to borrow. The link did not exist for formal loans. This may be because taking a loan from a bank is the least preferred option, partially because interest payments are high. Equally, those dependent on agriculture may find it more difficult to obtain a bank loan as they have few assets to offer as security and may have to leave assets that they need for farm work as a pledge or must find a creditworthy guarantor, which is also problematic in a poor area.
3.3.5. Impact of Social Capital on Livelihood Strategy Selection
Consistent with hypothesis H11, the social network of relatives and friends available for assistance when seeking non-farm work had a negative influence on household livelihood strategy. Specifically, there was no difference between the households with an undeveloped social network and those with no social network, whereas the households with developed social network were 0.329 times less dependent on agriculture than those with no social network. In China’s rural areas, social networks based on blood relationships and geopolitical and friendship links have a significant influence on farm household income. These networks not only provide information for workers but can also provide financial assistance, life care, and emotional support, especially for moderate external risks [32,33]. A greater network means more likelihood of accessing work and a higher proportion of income from migrant labor, with a concomitant reduction in dependence on agriculture.
Similarly, consistent with hypothesis H12, the social network of relatives and friends available for assistance when in urgent need of a lot of money had a positive influence on livelihood strategy. Specifically, there was no difference between the households with an undeveloped social network and those with no social network, whereas the households with a developed social network were 2.812 times more dependent on agriculture than those with no social network. Migrant laborers have fewer interactions in the village and weaker trust relationships than agriculture-dependent household workers who live in the village year round and are likely to have more relatives and friends available for assistance. Thus, the more developed the social networks of the households, the more the household income is dependent on agriculture.
Additionally, consistent with hypothesis H13 (participation of a household head in a farm association linked to dependence on agriculture), households whose household head participates in a farm association are 10.121 times more dependent on agriculture than the households whose household head does not participate. This result is consistent with Fang’s study [2]; his study also shows that households that have participated in a farm association tend to choose farming as their main livelihood strategy.
4. Conclusions
This paper attempts to answer the following two key questions: “To what extent are the farmers in the Three Gorges Reservoir area still highly dependent on agriculture against a background of rapid urbanization and industrialization?” and “Which factors determine a household’s choice of livelihood strategy, with a particular focus on the production of and dependence on agricultural products?” Based on the DFID SLA framework, data were collected from a sample of 349 rural households in the Three Gorges Reservoir area. The analysis of the data and the ordinal logistic regression results showed the following:
- (1)
- Households tended toward migrant work as their main livelihood strategy, with the majority of income from off-farm sources. Close to 56% of households showed low dependence on agriculture, and 19%, 7%, and 18% showed moderate dependence, high dependence, and extreme dependence on agriculture, respectively.
- (2)
- The livelihood capital portfolio of farm households significantly affected their livelihood strategy.
The number of laborers in a household, the age of the household head, the education years of the household head, the maximum years of education of any household member, household location, per capita area of cultivated land, whether the household loaned or borrowed in the last five years, and formal and informal social networks had a significant effect on the choice of livelihood strategy.
Based on our findings, several recommendations can be made for research and policy.
The number of laborers in a household encouraged a strategy of migrant work and reduced the dependence on agriculture, whereas the number of household members had no significant influence. The maximum years of education of any household member and the years of education of the household head had an opposite and significant influence on household livelihood strategy. Many studies consider only the household size and the educational level of the household head; future studies should include the more differentiated indicators.
The distance of a household from the nearest county center increased the dependence on agriculture and reduced the options for a strategy of migrant work. Government departments should consider increasing investment in infrastructure, such as roads for remote and less developed villages, which could improve accessibility, increase the access to employment information, reduce transportation costs for village enterprises, and increase economic benefit.
Whether the household had borrowed in the last five years was linked to a strategy of increased dependence on agriculture, whereas whether the household had loaned was not. Government loan policies could be made more favorable for farmers, which could encourage them to lead other villagers toward achieving increased prosperity.
Farmers’ formal and informal social networks had a significant influence on household livelihood strategy. During the course of the study, it became clear that many migrant workers from the villages were working in the same city (for example, the large number of people from Baoping Village engaged in construction demolition in Wuhan). The government should consider not only strengthening support for farm associations but also encouraging rural able-person to use their social networks to actively establish businesses at migrant destinations (such as establishing a large demolition company) where they can work together. This would help farmers achieve a common prosperity and enhance their collective ability to resist external risks, as well as strengthening village resilience.
Acknowledgments
We gratefully acknowledge financial support from the National Key Basic Research Program of China (973 Program, Grant No. 2015CB452706), the General Program of the National Natural Science Foundation of China (No. 41071350); the Main Direction Program (KZCX2-EW-317); the National Natural Science Foundation of China (No. 41101552; No. 41401198); and the West Light Foundation of the Chinese Academy of Sciences (2013Yuhui).
Author Contributions
Dingde Xu, Jifei Zhang, Golam Rasul, and Shaoquan Liu designed the research; Dingde Xu, Jifei Zhang, Golam Rasul, Shaoquan Liu, Fangting Xie, Mengtian Cao, and Enlai Liu performed the research; Dingde Xu analyzed the data; and all authors wrote the paper.
Conflicts of Interest
All authors declare no conflict of interest.
References
- Chen, G.; Fang, Y.; Chen, Y.; Shen, M. Mountain Development Report: Chinese Mountain Settlement Research; The Commercial Press: Beijing, China, 2007. (In Chinese) [Google Scholar]
- Fang, Y.; Fan, J.; Shen, M.; Song, M. Sensitivity of livelihood strategy to livelihood capital in mountain areas: Empirical analysis based on different settlements in the upper reaches of the Minjiang river, China. Ecol. Indic. 2014, 38, 225–235. [Google Scholar] [CrossRef]
- Zhong, Z. The chinese western development initiative: New opportunities for mineral investment. Resour. Policy 2002, 28, 117–131. [Google Scholar] [CrossRef]
- Lu, D.; Neilson, W.A.W. China’s West Region Development: Domestic Strategies and Global Implications; World Scientific Publishing Incorporated: Singapore, 2004. [Google Scholar]
- Yueh, L. Thirty years of legal and economic reform in China: Growth, institutions, and laws. J. Chin. Econ. Bus. Stud. 2010, 8, 117–132. [Google Scholar] [CrossRef]
- China National Statistical Bureau. China Yearbook of Household Survey, 2013; China Statistics: Beijing, China, 2013. (In Chinese) [Google Scholar]
- China National Statistical Bureau. Migrant Workers Monitoring Report in 2013; China Statistics: Beijing, China, 2013. (In Chinese) [Google Scholar]
- Chen, C.; Ding, S. Small Farmers Risk and Risk Management Research in China; China Financial Economic Publishing House: Beijing, China, 2005. (In Chinese) [Google Scholar]
- Ansoms, A.; McKay, A. A quantitative analysis of poverty and livelihood profiles: The case of rural rwanda. Food Policy 2010, 35, 584–598. [Google Scholar] [CrossRef]
- Babulo, B.; Muys, B.; Nega, F.; Tollens, E.; Nyssen, J.; Deckers, J.; Mathijs, E. Household livelihood strategies and forest dependence in the highlands of tigray, northern ethiopia. Agric. Syst. 2008, 98, 147–155. [Google Scholar] [CrossRef]
- Alemu, Z.G. Livelihood strategies in rural South Africa: Implications for poverty reduction. In Proceedings of the International Association of Agricultural Economists, Foz do Iguacu, Brazil, 18–24 August 2012.
- Bhandari, P.B. Rural livelihood change? Household capital, community resources and livelihood transition. J. Rural Stud. 2013, 32, 126–136. [Google Scholar]
- Diniz, F.H.; Hoogstra-Klein, M.A.; Kok, K.; Arts, B. Livelihood strategies in settlement projects in the brazilian amazon: Determining drivers and factors within the agrarian reform program. J. Rural Stud. 2013, 32, 196–207. [Google Scholar] [CrossRef]
- Nganga, S.K.; van der Steeg, J.; Notenbaert, A.M.O.; Moyo, S.; Herrero, M. Household livelihood strategies and livestock benefits dependence in Gaza province of mozambique. Afr. J. Agric. Res. 2011, 6, 560–572. [Google Scholar]
- Cai, Z. Livelihood capital analysis of farmers in poor villages of the wenchuan earthquake disaster area, China. Chin. Rural Econ. 2012, 12, 55–67. (In Chinese) [Google Scholar]
- Scoones, I. Sustainable Rural Livelihoods: A Framework for Analysis; Ids Working Paper 72; Institute of Development Studies: Brighton, UK, 1998. [Google Scholar]
- DFID. Sustainable Livelihoods Guidance Sheets; Department for International Development: London, UK, 1999. [Google Scholar]
- Fang, Y. The effects of natural capital protection on pastoralist’s livelihood and management implication in the source region of the Yellow River, China. J. Mt. Sci. 2013, 5, 885–897. [Google Scholar] [CrossRef]
- Wang, J.; Guo, Z. Logistic Model: Method and Application; Higher Education Press: Beijing, China, 2001. (In Chinese) [Google Scholar]
- Tai, X.; Li, S. Study of Vulnerability Measurement for Chinese Rural Households; Social Sciences Academic Press: Beijing, China, 2012. (In Chinese) [Google Scholar]
- Liu, S.; Xie, F.; Zhang, H.; Guo, S. Influences on rural migrant workers’ selection of employment location in the mountainous and upland areas of Sichuan, China. J. Rural Stud. 2014, 33, 71–81. [Google Scholar] [CrossRef]
- Loughran, D.; Pritchett, L. Environmental Scarcity, Resource Collection, and the Demand for Children in Nepal (Research Report); World Bank: Washington, DC, USA, 1997. [Google Scholar]
- Filmer, D.; Pritchett, L. Environmental Degradation and the Demand for Children: Searching for the Vicious Circle (World Bank Policy Research Paper No. 1623); The World Bank: Washington, DC, USA, 1997. [Google Scholar]
- Liu, S.; Zhang, H.; Xie, F.; Guo, S. Current situation and influencing factors of pluriactivity in mountainous and hilly rural areas of Sichuan Province, China. J. Mt. Sci. 2013, 10, 445–454. [Google Scholar] [CrossRef]
- Stiglbauer, A.R.; Weiss, C. Family and non-family succession in the upperaustrian farm sector. Cabiers Econ. Sociol. Rural. 2000, 54, 6–26. [Google Scholar]
- Bai, L.; He, Y. Return home, or go out? The study of backflow of rural migrant labors—A case study of Anhui and Sichuan Province. Sociol. Res. 2002, 3, 64–78. [Google Scholar]
- Richard, A.H. Remittances, Investment, and Rural Asset Accumulation in Pakistan. Econ. Dev. Cult. Chang. 1998, 47, 155–173. [Google Scholar] [CrossRef]
- De Brauw, A.J.; Edward, T.; Scott, R. The Impact of Migration and Remittances on Rural Incomes in China. In Proceedings of the 199 American Agricultural Economics Association Annual Meetings, Nashville, TN, USA, 8–11 August 1999.
- Jokish, B.D. Migration and Agricultural Change: The Case of Smallholder Agriculture in Highland Ecuador. Hum. Ecol. 2002, 30, 523–550. [Google Scholar] [CrossRef]
- Scott, M. Applied Logistic Regression Analysis; Sage Publications: Newbury Park, CA, USA, 1995. [Google Scholar]
- Hans, G.P.J.; John, P.; Amy, D.; Willem, W.; Rob, S. Policies for sustainable development in the hillside areas of Honduras: A quantitative livelihoods approach. Agric. Econ. 2006, 34, 141–153. [Google Scholar] [CrossRef]
- Zhao, Y. The role of migrant networks in labor migration: The case of China. Contemp. Econ. Policy 2003, 21, 500–511. [Google Scholar] [CrossRef]
- Gui, Y.; Berry, J.W.; Zheng, Y. Migrant worker acculturation in China. Int. J. Intercult. Relat. 2012, 36, 598–610. [Google Scholar] [CrossRef]
© 2015 by the authors; licensee MDPI, Basel, Switzerland. This article is an open access article distributed under the terms and conditions of the Creative Commons Attribution license (http://creativecommons.org/licenses/by/4.0/).