Article

Assessing Green Development Efficiency of Municipalities and Provinces in China Integrating Models of Super-Efficiency DEA and Malmquist Index

School of Management, Wuhan University of Technology, 205 Luoshi Road, Hongshan District, Wuhan 430070, China
*
Author to whom correspondence should be addressed.
Sustainability 2015, 7(4), 4492-4510; https://doi.org/10.3390/su7044492
Submission received: 31 October 2014 / Revised: 9 March 2015 / Accepted: 11 March 2015 / Published: 16 April 2015

Abstract

:
In order to realize economic and social green development, to pave a pathway towards China’s green regional development and develop effective scientific policy to assist in building green cities and countries, it is necessary to put forward a relatively accurate, scientific and concise green assessment method. The research uses the CCR (A. Charnes & W. W. Cooper & E. Rhodes) Data Envelopment Analysis (DEA) model to obtain the green development frontier surface based on 31 regions’ annual cross-section data from 2008–2012. Furthermore, in order to classify the regions whereby assessment values equal to 1 in the CCR model, we chose the Super-Efficiency DEA model for further sorting. Meanwhile, according to the five-year panel data, the green development efficiency changes of 31 regions can be manifested by the Malmquist index. Finally, the study assesses the reasons for regional differences; while analyzing and discussing the results may allude to a superior green development pathway for China.

1. Introduction

In recent years, the attention of international institutions, academic circles and policymakers has been markedly drawn to the issue of designing, planning and managing sustainable and green cities [1,2,3]. Cities have been recognized as playing a crucial role for fostering economic activities and human development, as it has been forecasted that 69% of the world’s population will be living in urban areas by 2050. At the same time, the social and economic activities and interactions that take place in a city may create stress on the natural environment and resources both at a local level (e.g., on water resources, land use, local air quality) and national and international levels (e.g., on the climate).
With the acceleration of industrialization and informatization, ecological environment contamination and natural resources hoarding has gained increasing attention. Therefore, regional green development (city, province and nation) has been taken more and more seriously. In the 1970s, the United Nations’ Educational, Scientific and Cultural Organization (UNESCO) launched the Man and the Biosphere Program (MAB) [4], with a focus on the research of ecological cities. In 1990, David Gordon systematically raised the idea, implications and implementation strategy of a green city. He established the Environmental Kuznets Curve according to the cross-sectional data of 42 countries (Grossman and Krueger [5]). In 2010, United Nations Environment Program (UNEP) indicated—A “Green Economy” (GE) is an important concept linking economic growth and environmental sustainability. It implies realizing growth and employment opportunities from less polluting and more resource efficient activities, including energy, water, waste, buildings, agriculture and forests; as well as managing related structural changes such as potentially adverse effects on vulnerable households and traditional economic sectors [6].
It considered urban green development as a new kind of economic development mode, which changed the traditional development mode, gathering all sorts of capital across the entire society and embarking on a low carbon and resources development path to achieve coordinated allocation of urban capital and improve residents’ well-being and social equity while greatly reducing environmental risks and ecological scarcity [6].
Recently, the importance of investigating the opportunities offered by cities for local and national green economic growth has been further recognized [7]. The OECD offers the following definition of urban green growth:
“Urban green growth means fostering economic growth and development through urban activities that reduce negative environmental externalities, the impact on natural resources and the pressure on ecosystem services. The greening of the traditional urban economy and expanding the green urban sector can generate growth (through increased supply and demand), job creation and increased urban attractiveness. These effects are in part the result of stronger interactions at the urban level among economic efficiency, equity and environmental objectives.”
From: Cities and Green Growth: A Conceptual Framework
By analyzing the academic concerns and research trends of domestic and foreign regional green development, respectively, through Google Trends (Figure 1) and the CNKI Academic Theory Trend (Figure 2), it is found that the more developed the country is—the United States, Britain, Canada, Australia, for example—the more attention the country pays to the notion of green cities and green assessment. However, academic focus on regional green development in China started late and has lagged behind, most research limited to the concept of green city building, while research on assessment methods of regional green development is quite rare.
From mainstream references in the literature to this topic, such as the green city [8], ecological city [9], green economy [10,11], circular economy [12,13], low carbon city [14,15], ecological economy, green development, sustainable development [16], resource saving and environmental friendly society (two-oriented society) [17], we can see that representative achievements are mainly in the fields of indicator systems of regional green development assessment, the comprehensive assessment model and regional coordinated development evaluation methods.
Figure 1. Search trend of green city.
Sustainability 07 04492 g001
Figure 2. Academic attention trend of green city.
Sustainability 07 04492 g002
To summarize, this research mainly addresses the following research gaps: firstly, how to assess the level of regional green development in a relatively logical and accurate way; secondly, how to develop scientific and effective institutions and policies to help build green cities, provinces and countries based on the assessment results; thirdly, how to find the optimal path for China’s green regional development; lastly, how to ultimately realize holistic green sustainable development in terms of human, economic and social aspects.
In order to fill in the above research gaps, primarily, a scientific and applicable assessment model has to be constructed. As in the recent studies, most assessment models for green development and sustainability, such as Analytic Hierarchy Process (AHP) [18,19] and fuzzy comprehensive assessment [20], still have acquired certain controversy. In summary, there is contention regarding: firstly, how to select the assessment indicators and whether they are scientific and veritable or not. Generally, using a questionnaire survey or expert scoring to obtain the initial indicators is overly subjective; secondly, what are the optimal dimensions of an indicator system? Some scholars insist on a three-dimensional indicator system—for example, economy, environment and society—while four/five-dimensional systems also have considerable support; thirdly, how to prevent distortion in initial indicators in the assessment models. As we know, the traditional assessment methods usually need to use dimensionless calculation, data standardization or panel data cointegration for adapting indicators, which break the primitiveness and purity of the initial indicators, and, to some extent, make the assessment results inaccurate and unscientific.
To overcome the above obstacles, the method of Data Envelopment Analysis (DEA) in the intersectional field of mathematics, operations research, management science and computer science is relatively scientific and applicable to measure the regional green development of China. Moreover, as the assessment method of DEA not only can bypass calculations of indicator weights and data standardization, but because it is also qualified for evaluating green development efficiency, a growing number of scholars from all over the world choose the DEA method to give appraisals of eco-efficiency and sustainability of regional development [21,22,23].
Based on the equation of “green development efficiency = green output/green input” according to the input and output indicators refined by certain methods below, we use the original CCR-DEA model [24] to assess the green development performances of 31 regions in China from 2008–2012. Moreover, in order to further evaluate and compare the regions whose green development efficiency value is equal as 1 in the CCR-DEA model, the Super-Efficiency-CCR-DEA model [25,26,27] is introduced. For a holistic and dynamic approach, according to the panel data of 31 regions in China for five continuous years, we adopt the Malmquist Index Approach, which has been regularly applied together with the DEA model in recent studies [28,29], to embody the transformations of different regions in the Chinese mainland. Finally, from the substantial results, we may analyze the problems we are facing in achieving regional green development and explore the optimal pathway to reaching it.

2. Methods

Based on the approach of using inputs and outputs to measure the pollution variables for assessment of environmental efficiency, the data envelopment analysis was introduced [30]. The Data Envelopment Analysis (DEA) assessment model is established by using mathematical programming, for example linear program, multi-objective programming, semi-infinite programming, stochastic programming, general optimization of conical structure and so forth. As the first DEA model, CCR model should be relatively developed in measuring regional green development efficiency. However, CCR model is invalid to make further comparison to regions whose green development efficiency value is 1. Even though the Super-Efficiency DEA model is able to conduct advanced assessment, if we want to truly understand the overall and continuous sustainable development performance of different regions, a dynamic assessment needs to be adopted; thus, we have to introduce the Malmquist index.
The assessment has relative efficiency in DMU (decision-making units) of polynomial input and polynomial output. The green development efficiency of one region equals the green performance of the region (the economic output and green enjoyment) divided by the gross ecological consumption of the region (natural resource consumption and the pollution load of the region ecological environment).

2.1. CCR-DEA Model

The research selects n (n = 31) region as DMU, each DMU has s (s = 5) kinds of output indicators: regional GDP, urban residential investment, urban and rural residents’ savings (balance at the end of the year), consumption per 10,000 Yuan of GDP, urban green areas. m (m = 7) has several kinds of input indicators: water consumption, dust(smoke) emissions, total industrial wastewater discharge, general industry solid waste, forest coverage, power consumption and industrial waste gas discharge. x k = ( x 1k ,   x 2k ,  ,   x mk ) T , xik represents the input of i in k; y k = ( y 1k ,   y 2k ,  ,   y sk ) T , yjk represents the output of j in k, v = (v1, v2, …, vm)T, v represents the importance weight of 7 input; u = (u1, u2, …, us)T, u indicates the importance weight of 5 output, (i = 1, 2, …, m; j = 1, 2, …, s; k = 1, 2, …, n). For convenience, the corresponding input and output data of DMU-k0 is x 0 = x k0 ,   y 0 = y k0 , 0 k 0 n . We use DEA-CCR model, Equation (1), to assess DMU-k0, and we can use Cooper–Cooper transformation to get Equation (2).
         Minθ { max u T y 0 v T x 0 u T y k v T x k 1k=12n u0v0u0v0
 s.t.{ j=1 n X j λ j θ X k j = 1 n Y j λ j Y k λ j 0j=12n

2.2. Sup-CCR-DE

A Model

We use the CCR model to calculate the green development assessment efficiency of 31 regions in our country. Then, we use Sup-CCR-DEA model to make further comparison and rank the green development efficiency values of different municipalities and provinces. The detailed formula is as follows in Equation (3):
            Minθ  s.t.{ j = 1 j k n X j λ j θ X k j = 1 jk n Y j λ j Y k λj0j=1,  2,  ,  n
X and Y still represent the input and output while represents the combination coefficient of every decision-making unit. Different from the CCR model, when assessing the green development efficiency of DMU-k by SE-DEA model, it will substituted by the linear combinations of input and output vectors of the other 30 DMUs. According to SE-DEA, if the green development efficiency value of the assessing region is not 1, we can get the same results with every traditional DEA model such as CCR and BCC or SE model. The difference is that SE model can figure out that when the green development of the region is efficient, the green development efficiency value remains unchanged no matter how much we increase the input. At this time, the green development efficiency value of super efficiency is equal to or greater than 1. And the greater the value of θ is, the better the green development efficiency is.
We should note that when assessing regional green development efficiency, in fact, the traditional assessment method only regards those factors that have obvious monetary measuring attribute (such as manpower and money) as input indicators, and regional GDP or per capita GPD as output indicators. However, we may neglect the fact that the green enjoyment (such as urban green areas, forest coverage, etc.) is capable of measuring the human and social acquisition from regional green development, so as the ecological consumption (such as water consumption, dust (smoke) emissions, etc.) that is also able to reveal the investment for realizing regional sustainable development. Thus, we creatively derive the remaining indicators from inputs or outputs. For example, forest coverage and urban green areas can be considered as output indicators while total industrial wastewater discharge and dust emissions can be considered as input indicators, and so forth.

2.3. Malmquist Index Approach

With a number of advantages, such as making no assumptions about the functional relationships among inputs and outputs, skipping data standardization and weight calculations, the method of DEA is well suited to analyze multiple interacting and little-known social and environmental phenomena. While attributing to the limitation of scope, present research shows that the Malmquist Index is a potentially powerful tool for interdisciplinary environmental impacts analysis [29]. The Malmquist Index has been frequently used for accounting for the changes in policy efficiency; meanwhile, the characteristics of which potentially offer many advantages for assessing the multidimensional environmental impacts that may vary over time [28,29]. Combining the Data Envelopment Analysis (DEA) method with linear programming method of the parameters, Malmquist index approach is to measure the productivity changes from the angle of multi-input and output.
According to Equation (4) of the total factor productivity (TFP), Malmquist index takes the geometric average from TFP of consecutive period. We can see the Malmquist index from the year “t” to the year “t + 1” in Equation (5):
 TF P k =Effc h k ×Tec h k =( Pec h k ×Sec h k )×Tec h k
  • Effchk represents the relative efficiency index of region K;
  • Techk represents the regional green technology development efficiency of K;
  • Peckk represents the pure development efficiency of region K;
  • Sechk represents the scale development efficiency of region K.
M i =TFP=( x t+1 y t+1 x t y t )       = [ D i t+1 ( x t y t ) D i t+1 ( x t+1 y t+1 ) × D i t ( x t y t ) D i t ( x t+1 y t+1 ) ]      = D i t ( x t y t ) D i t+1 ( x t+1 y t+1 ) [ D i t+1 ( x t+1 y t+1 ) D i t ( x t+1 y t+1 ) × D i t+1 ( x t y t ) D i t ( x t y t ) ] 1 2

3. Indicator Systems

We complied with indicator screening principles of systematicness, operability, comparability, effectiveness and dynamism, as well as referring to the indicators selected by authoritative Chinese scholars in the field of green sustainable development by retrieving and reviewing the significant journals designated by the National Natural Science Foundation. In addition, we drew on some international indicators [31,32,33,34,35,36]. Since our society, economy and environment are closely linked and interacting with each other, we selected 32 initial indicators from the aspects of economy, society and environment to constitute the first round of assessment indicators, as shown in Table 1. As is mentioned before, green development efficiency of one region equals the green performance (the economic output and green enjoyment) of the region divided by the gross ecological consumption (natural resource consumption and the pollution load of the region ecological environment) of the region. Notably, only the indicators with monetary values are assigned as input/output indicators in common assessment methods; for example, gross regional product, household consumption expenditure and the like. However, indicators of ecological consumption and environmental pollution are ignored by many as it is difficult to measure monetary costs. Thus, for a comprehensive and accurate assessment, we single out several indicators, such as Forest Coverage, Green Areas in City, etc.; as inputs and outputs to evaluate the green efficiency of each city.
Indicators including Gross Regional Product, Share of the Tertiary Industry to the GDP, Urban Residential Investment, Savings Deposit of Urban and Rural Households at Year-end, Green Areas in City, Daily Treatment Capacity of Urban Sewage, Innocuous Disposal of Domestic Garbage, Registered Urban Unemployment Rate, Per Capita Annual Cash Living Expenditure of Urban Households by Income Percentile, Green Coverage Rate of Build-up Area, Water Penetration in City, Gas Penetration in City, Per Capita Urban Park Green Area, Forest Coverage, Share of the Nature Reserve to the Jurisdiction and Per Capita Water Resource are output indicators; the rest of them are input indicators.
In order to improve the indicator quality and make them more logical and applicable, the second round of refining is discriminability screening, in which step the coefficient of variation may work. According to the cross-sectional data of 31 provinces and municipalities in China in 2012, we use SPSS17.0 to calculate the mean value, standard deviation and coefficient of variation of the first round of indicators, making 0.4 the critical value, and deleting 10 indicators which are below 0.4. (The data comes from China Statistical Yearbook, China Environment Yearbook, the statistical data of this paper are all from the respective annual Statistics Yearbooks [37,38]).
Then, we come to the third round of indicator refining—correlation selection. As there may be some correlations among the remaining 22 indicators, in order to avoid reusing the information on regional green development, certain distinguishing work need to be done: (1) conduct the dimensionless calculation of indicators; (2) calculate the correlation coefficient among indicators: R ij = k=1 n ( Z ki Z i ¯ )( Z kj Z j ¯ ) k=1 n ( Z ki Z i ¯ ) 2 ( Z kj Z j ¯ ) 2 ; (3) use statistical software SPSS17.0 to get correlation coefficient matrix, delete and preserve the indicators based on correlation coefficient values of indicators and some subjective factors (whether the statistical caliber of the indicator in one year is consistent with that in previous or subsequent years or not, whether the indicator can be referred to in the last five years or not, whether the indicator can be reasonably regarded as input or output indicator, etc.).
Table 1. The 32 initial indicators and the discriminability screening.
Names of IndicatorMean ValueStandard DeviationCoefficient of Variation
Gross Regional Product (100 million Yuan)18,598.514,326.00.8
Share of the Tertiary Industry to the GDP41.39.20.2
Urban Residential Investment (100 million Yuan)1864.21244.90.7
Household Consumption Expenditure (100 million Yuan)6247.94918.40.8
Government Consumption Expenditure (100 million Yuan)2443.01700.40.7
Savings Deposit of Urban and Rural Households at Year-end (100 million Yuan)12,846.79895.00.8
Revenue of State-owned Resources Compensable Use (100 million Yuan)88.473.20.8
Fiscal Expenditure of Energy Conservation and Environmental Protection (100 million Yuan)93.547.50.5
Consumer Price Index102.70.40.0
GDP Energy Consumption (tons of standard coal/ten thousand Yuan)1.00.50.4
Resource Tax Revenue (100 million Yuan)27.628.81.0
Green Areas in City (ectare)76,382.078,578.31.0
Total Number of Special Vehicles and Equipments for City Appearance and Environmental Sanitation3618.02564.70.7
Daily Treatment Capacity of Urban Sewage (10 thousand cubic metre)441.7395.60.9
MSW delivering quantity (10 thousand ton)551.0422.20.8
Innocuous Disposal of Domestic Garbage84.815.50.2
Registered Urban Unemployment Rate3.30.60.2
Per Capita Annual Cash Living Expenditure of Urban Households by Income Percentile (yuan)23,218.65844.40.3
Green Coverage Rate of Build-up Area38.53.80.1
Water Penetration in City96.04.80.1
Gas Penetration in City89.314.10.2
Average Wage of Employed Persons in Water Conservancy, Environment and Administration of Public Facilities (Yuan)24,230.46365.90.3
Per Capita Water Consumption (cubic meters/per capita)535.7457.00.9
Per Capita Urban Park Green Area (square meters)11.82.50.2
Dust Emissions (10 thousand ton)39.929.80.7
Total Industrial Wastewater Discharges (ton)71,479.360,903.10.9
General Industrial Solid Wastes (10 thousand ton)10,614.39824.50.9
Forest Coverage (%)30.017.60.6
Power Consumption (100 million Kwh)1599.71172.10.7
Share of the Nature Reserve to the Jurisdiction %9.57.30.8
Per Capita Water Resource (cubic metres/per capita)6711.824,421.03.6
Industrial Waste Gas Discharge (100 million cubic metres/per capita)20,500.614,979.10.7
After three rounds of refining, we got a group of indicators that is comprehensive and operable, and basically can objectively and accurately reflect the regional green development efficiency of our country. They are: (input variables) regional GDP, urban residential investment, savings deposits of urban and rural residents, forest coverage, urban green areas; and (output variables) GDP consumption, water consumption, general industry solid waste, dust emissions, total industrial wastewater discharge, power consumption, and industrial waste gas discharge.

4. Calculation of Regional Green Development Efficiency in China

We established Table 2 after entering the input and output indicators refined above of 31 regions in China from 2008–2012 via the programs DEAP 2.1 (by Tim Coelli Centre for Efficiency and Productivity Analysis University of Queensland. Brisbane, QLD 4072 Australia.) and EMS Version 1.3 (Copyright Holger Scheel University of Dortmund. [email protected]). We list outcomes by Super-Efficiency-CCR on account of the consensus of outputs by CCR and Sup-CCR in calculating those for inefficient green development (the CCR value is less than 1).
SUP represents the Super-Efficiency-CCR value of green development and R represents the ranking.
Table 2. Outcomes of Super-Efficiency DEA model for municipalities and provinces in China. Data sources: China Statistical Yearbook, China Environmental Statistics Yearbook [37,38].
Region20082009201020112012
SUPRSUPRSUPRSUPRSUPR
Beijing5.34 35.21 25.02 35.84 15.671
Tianjin0.81 210.83 190.82 190.82 170.8716
Hebei0.71 250.72 240.75 220.74 230.6825
Shanxi0.77 230.69 260.57 260.58 260.5026
Inner Mongolia0.43 280.46 280.44 280.39 280.3827
Liaoning0.99 151.10 110.89 150.98 121.129
Jilin1.19 80.92 170.89 140.88 150.9513
Heilongjiang0.79 220.78 220.83 180.83 160.8617
Shanghai0.87 170.97 160.97 131.07 101.1110
Jiangsu1.14 101.13 91.16 71.21 61.167
Zhejiang1.20 71.22 61.19 61.19 71.206
Anhui0.94 161.05 120.86 160.76 210.8318
Fujian1.21 61.14 81.13 81.13 81.1111
Jiangxi1.07 111.02 131.02 101.08 91.0712
Shandong1.76 51.82 51.74 51.78 51.845
Henan0.81 200.83 200.83 170.76 220.7322
Hubei0.67 260.69 250.69 250.68 250.7223
Hunan0.82 190.79 210.79 200.77 200.8119
Guangdong3.03 42.83 42.82 42.67 42.574
Guangxi0.71 240.77 230.75 240.79 190.7820
Hainan5.96 25.00 35.45 24.95 24.423
Chongqing1.00 141.16 70.98 110.95 131.158
Sichuan1.00 130.99 140.76 210.79 180.7820
Guizhou0.87 180.83 180.75 230.73 240.6924
Yunnan1.05 120.98 150.98 120.94 140.8915
Tibet25.23 122.0 120.1 14.33 34.882
Shaanxi1.15 91.11 101.04 91.00 110.9314
Gansu0.37 290.29 290.29 290.27 290.2929
Qinghai0.20 300.20 300.17 310.18 300.1830
Ningxia0.18 310.19 310.19 300.17 310.1831
Xinjiang0.56 270.49 270.49 270.43 270.3728
In addition, with the same range of data above, we get the results in Table 3 by using DEAP 2.1 (by Tim Coelli Centre for Efficiency and Productivity Analysis University of Queensland). Then, as we recognized, if M (Malmquist value) is greater than 1, it means the green development efficiency is on the rise compared with the past year. On the contrary, if M fails to reach 1, it means the green development efficiency is decreasing in comparison with the previous year. In other words, the green development driving force of the region should be enhanced.
Table 3. Dynamic Tendency of Region Green Development Efficiency Changes.
RegionYear
2008–20092009–20102009–20102009–2010
Beijing1.186 1.305 1.108 1.243
Tianjin1.050 1.048 1.139 1.097
Hebei1.236 1.352 1.224 1.012
Shanxi1.142 1.031 1.147 1.026
Inner Mongolia1.079 1.005 1.015 1.022
Liaoning1.149 1.256 1.326 1.136
Jilin1.045 1.042 1.098 1.102
Heilongjiang1.019 1.106 1.108 1.043
Shanghai1.256 1.018 1.057 1.054
Jiangsu1.017 1.228 1.408 1.076
Zhejiang1.133 1.126 1.139 1.104
Anhui1.075 1.222 1.131 1.009
Fujian1.032 1.032 1.146 1.006
Jiangxi1.065 1.031 1.136 1.008
Shandong1.112 1.169 1.123 1.120
Henan1.131 1.222 1.023 1.043
Hubei1.068 1.051 1.161 1.091
Hunan1.032 1.050 1.118 1.075
Guangdong1.094 1.072 1.069 1.066
Guangxi1.210 1.043 1.192 1.004
Hainan1.224 1.207 0.815 1.068
Chongqing1.143 1.179 1.105 1.124
Sichuan1.125 1.049 1.163 1.017
Guizhou1.307 0.910 0.956 0.960
Yunnan1.177 0.990 0.936 0.955
Tibet0.697 0.981 0.365 1.112
Shaanxi1.185 1.050 0.973 0.952
Gansu0.810 1.110 1.057 1.067
Qinghai0.991 0.905 1.212 0.962
Ningxia1.076 1.086 0.911 1.080
Xinjiang 0.902 1.038 0.952 0.875
Mean Value 1.081 1.089 0.874 1.046
As is shown in Table 3, during the period between 2008 and 2009, most regions (28) increased their green development efficiency scores, except for a few western regions; they are Tibet, Gansu and Xinjiang. From the next year, the overall trend of regional green development was relatively flat according to the results, but the regions with decreased green efficiency were then Guizhou, Yunnan, Tibet and Qinghai. However, from 2010–2011, an increasing number of regions lagged behind in their green development. There were seven regions with Malmquist index values below 1, as well as the mean value. Fortunately, the situation improved in the following year.

5. Results and Discussion

As in the above-mentioned green development streamline (Figure 3), in the last five years, from the regional green development efficiency results shown in Table 2, we can ascertain that the green development tendency is quite flat in most regions, except for a few regions. Tibet Autonomous Region, for example, demonstrated obvious changes, which further validates the accuracy of our method. If the green development tendency changes of most regions have steep fluctuations in a short period, it means the measures and assessment methods are random; on the contrary, if the green development tendency efficiency value of most regions remains unchanged or grows, it means the selected measures and assessment methods have weak discriminability and persuasion.
Figure 3. Green development efficiency tendency of 31 regions over five years.
Sustainability 07 04492 g003

5.1. Coastal Region

Regions, such as Tianjin, Shanghai and Zhejiang Province, which may have high assessment values of green efficiency according to previous values, did not reach the expected values. As shown in Figure 4, the green development efficiency value of Guangdong is greater than 1 all the time and significantly higher than that of other regions where the green efficiency value is consistently around 1. As shown in Table 2, the green development Malmquist index of the coastal area in eastern China has always been greater than 1, which means its green efficiency has been smoothly growing. That is because as early as 1842, after the first Opium War, as the first batch of opening trading ports in Nanjing Treaty, Guangzhou, Xiamen, Ningbo, Fujian and Shanghai covered almost the whole eastern coastal areas of China. Therefore, being affected by Western capital at the earliest point, the eastern coastal areas boosted their economy but only Guangdong’s green development efficiency ranked in the top five provinces in the whole country. However, the efficiently of Tianjin, known as the international shipping and logistics center for northern China and Beijing, China’s financial center, was barely satisfactory, which is worthy of reflection. The reasons are as follows:
(l)
According to the relative theory of relationship between environmental quality and per capita income studied by Grossman et al. and the relative conclusion of Kuznets curve on environment [39], it is difficult to achieve regional economic development in primary stages without sacrificing environmental quality and losing resources. As one of the fastest developing countries, China is still undergoing a difficult transition where most regions are still on the left-hand side of the inflection point on the inverted U curve, and it is inevitable that there will be stage where environmental measures are taken only after polluting the environment, as was the experience for Western developed countries. Neither the capitalistic empire Britain that has a long history just like our country, nor the world giant America that has a relatively short history, advocated environment protection in the history of its development as it has today. As the pioneer of the first industrial revolution, Britain, without rich resources, made coal its main energy source in the middle of the 18th century. Water and air pollution became increasingly serious with the rapid development of new industry. Engels’ British Working Class vividly recorded how the smog disaster and water pollution became a nightmare for residents. Similarly, on the road to becoming the world’s only superpower, the United States also paid terrible environmental costs. In November 1971, the “American file” that was announced by the newly established Environmental Protection Agency (EPA) published more than 80,000 photos by 100 American photographers, recording changes in America over the years: the oil tank of Exxon in Louisiana piled up into a mountain and Clark Street under industrial waste gas. According to the Xinhua report, the biologists Lamon Jadans, who studies air pollution and co-authored the global toxic chemicals monitoring plan of United Nations Environment Programme (UNEP), said: “several kinds of pollutants’ concentration in the air of some places in China undoubtedly reach the level of some highly industrialized regions in Europe and North America in the 1970s. But when spreading equally to economic output and individuals, those pollutants emissions is much higher than China’s current capacity, On the whole, the situation is the same now.”
Figure 4. Green development efficiency assessment values of eastern coastal areas in the last five years.
Sustainability 07 04492 g004
(2)
The urban and rural residents have a deep-rooted concept of putting their own economic interests first and they extremely lack consciousness of public environment protection. After the reform and opening up, China's coastal areas experienced rapid economic development, and the urbanization phenomenon gradually turned white-hot. According to the list of richest 10 county-level cities in China published by Forbes 2013, Jiangsu and Zhejiang earned all the places. In the eastern coastal areas, the money-oriented notion of economic status as determined by “superstructure” is deeply rooted in the people’s hearts, which seems to have become the consensus of people in the other parts of the mainland such as Jiangsu, Fujian, Guangdong and other developed areas. The road of green development is a long-term development plan. As investing in green equipment and environmental technology innovation will only increase the cost of enterprise in the short term, and the need to hire professionals and research personnel, the green road is often ignored by enterprise, institutions and individuals who pursue maximum profit in chasing immediate interests.
As per the current situation, as of 2013, for China’s small and medium-sized enterprises development and relative data, in recent years, small and medium-sized enterprise in the eastern area accounted for over 60% of the total number. These enterprises are characterized by labor-intensive methods and poor technical equipment. This partly illustrates the reason that, except for Guangdong province, where there is a focus on new technology and optoelectronic information industries, other parts of the eastern area did not achieve the expected green development efficiency. In addition, from the CNKI academic search trends diagram, we can find that academia did not pay much attention to issues of regional green development; instead, people were more concerned with economic crisis and science and technology innovation, which brings more direct benefit for human beings.

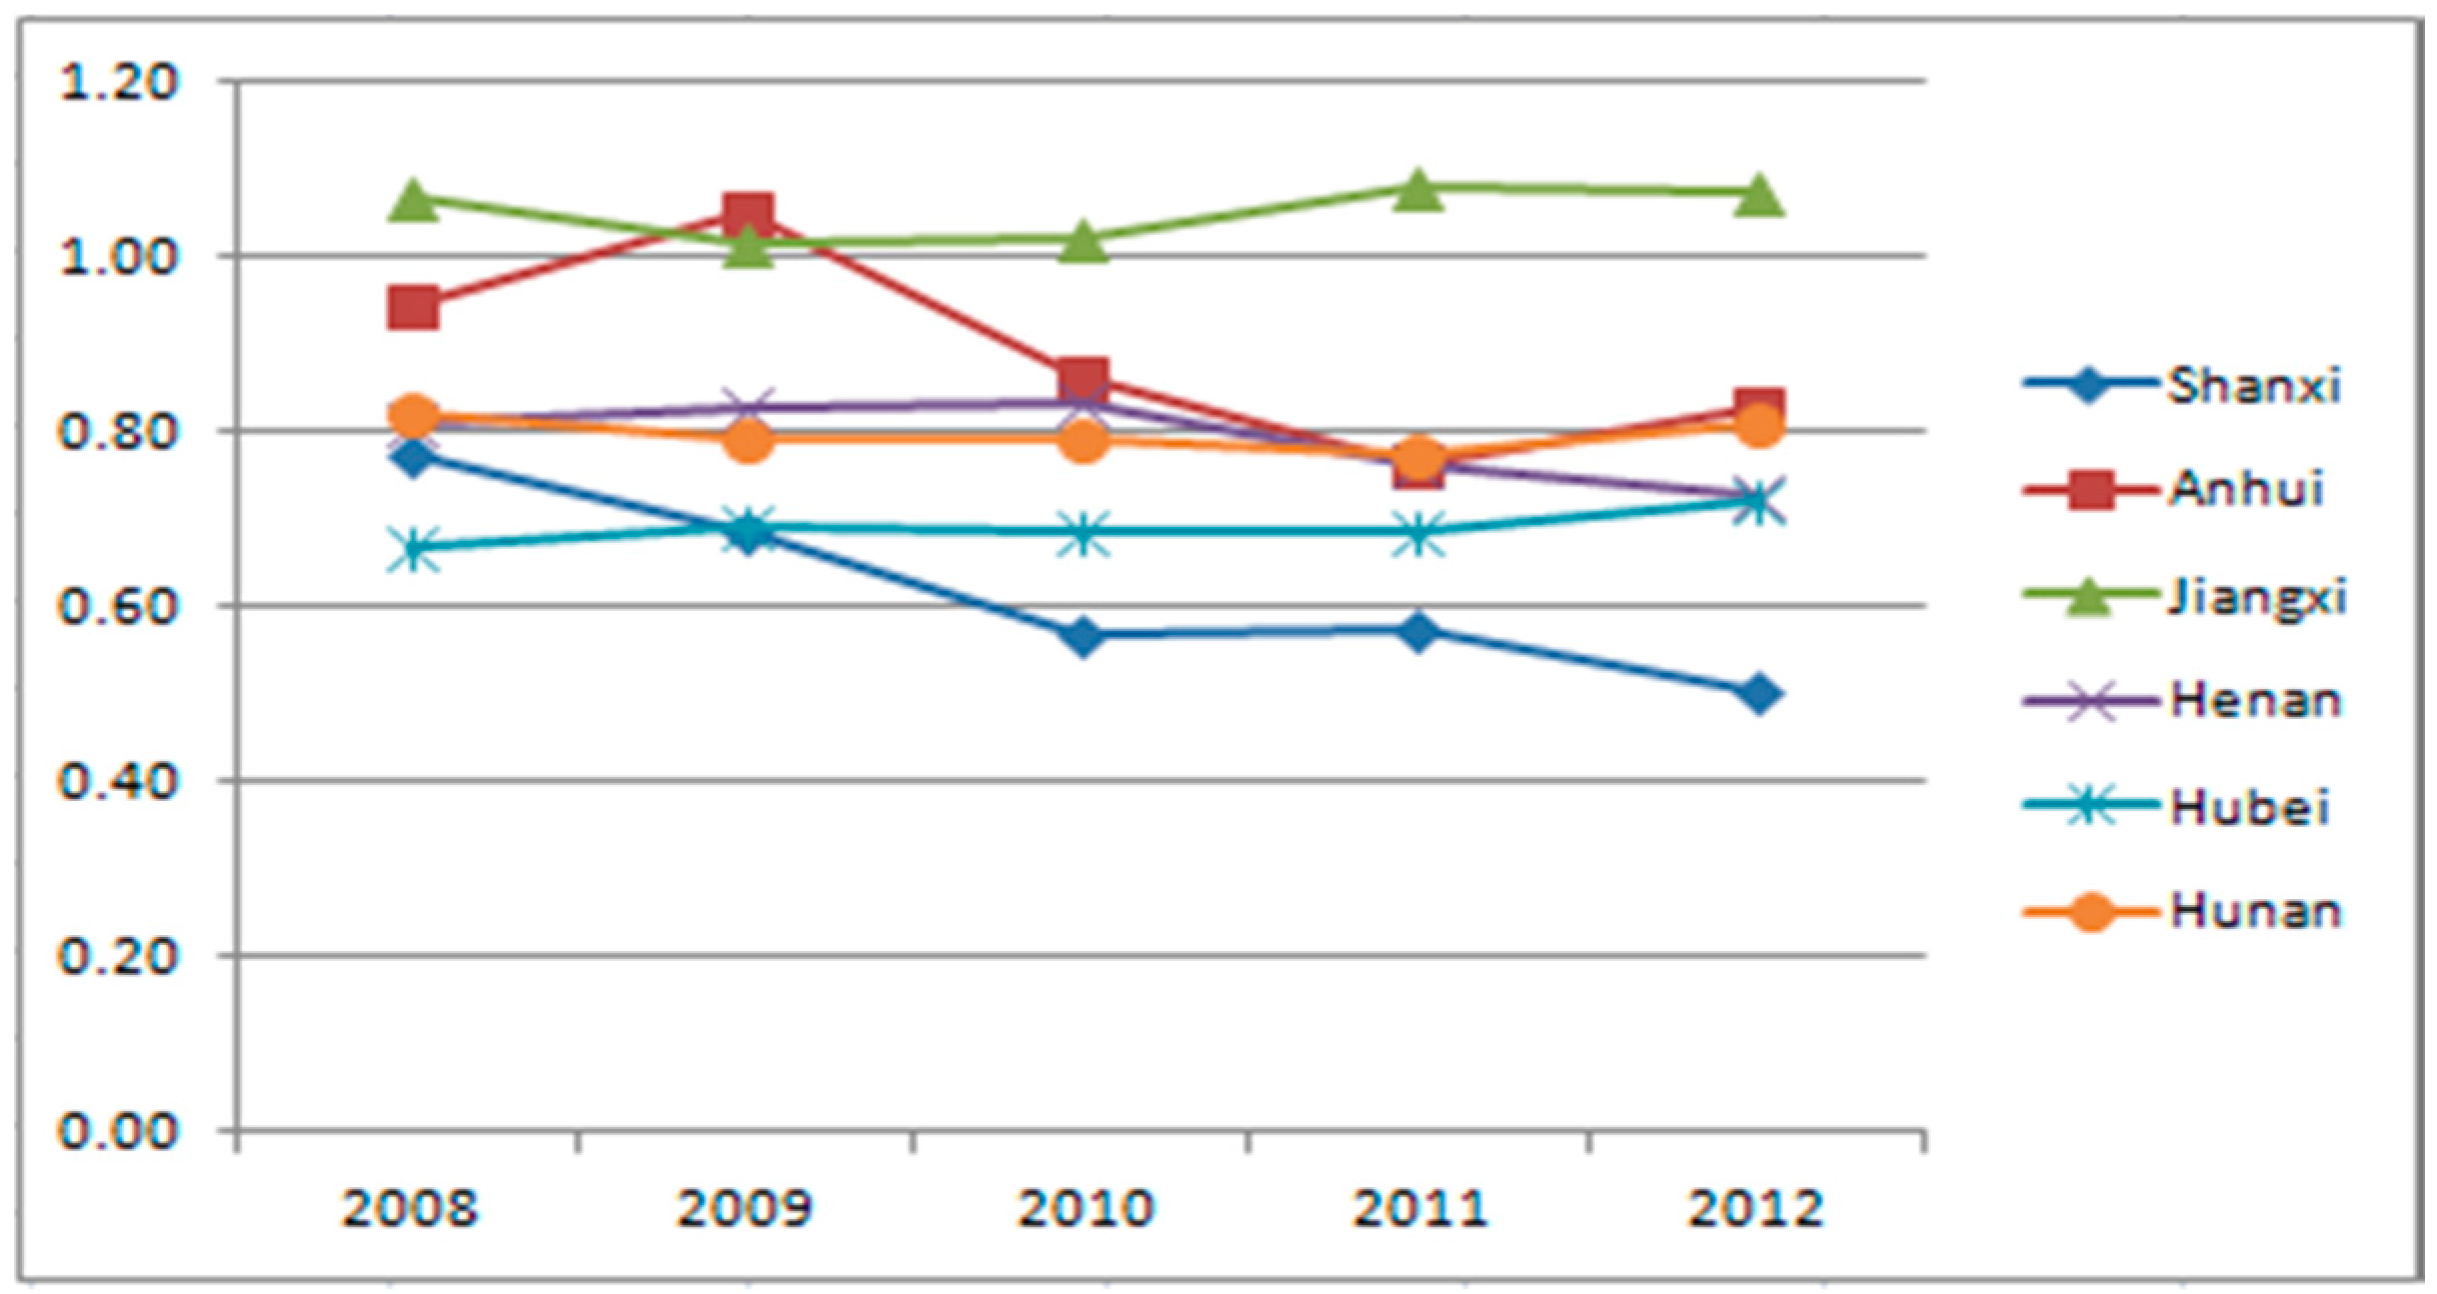
5.2. Six Provinces in the Central Part of China

On 5 March 2004, premier Wen Jiabao firstly put forward a policy from the Central Committee of the Communist Party of China that promotes the rise of the Central China Economic Zone, which includes Henan, Hubei, Hunan, Jiangxi, Anhui, and Shanxi. On 23 September 2009, premier Wen Jiabao chaired a State Council executive meeting, discussing and passing through Promoting the Rise of the Central Region Planning. The central region was seeking to achieve the goal of significantly improving the economic development level and sustainable development ability, further enhancing the development vigor, and making new progress in building a harmonious society by 2015. However, according to the green development efficiency results as is shown in Figure 5, except for Jiangxi, which has always been at the frontier of green development, the other five provinces performed poorly; Shanxi, especially, showed a tendency of slow decline, even below the base line of 0.6, since the planning was formally passed in 2009. Through sorting the original indexes, it is found that the output indicator values of the central region have always been at the middle level, and some indexes are prominent; for example, the regional GDP of Hubei and Henan have been at the advanced level in our country, and the forest coverage of Jiangxi has always been in the top three. As for the output indicators, the indicator of pollutants emission in the central region ranks relatively high, especially the particular indicators of specific areas. For example, besides the wastewater discharge, the other pollutant emissions in Shanxi have been at a rather high position in the whole country, and the pollution index in Henan is increasing in recent years. The reasons are as follows:
(1)
The use of resources is inefficient, especially in Shanxi Province. As it is known for its rich mineral resources, Shanxi has mined a lot of coal resources in recent years to achieve prosperity, and illegal coal mines have been found everywhere. In recent years, it is common to see news likes “coal mine owner in Shanxi spent one hundred million marrying daughter”, shocking people. However, according to the indicator of economic development in Shanxi, the situation was different, which reflects there is a big gap between the rich and the poor and the development mode mainly depends on mining and consuming its regional resources.
(2)
Construction is everywhere. It seems that putting up buildings on a large scale has been the only road to developing the economy in China. In order to keep pace with international metropolises such as Beijing and Shanghai, many provinces compete to enrich their own “hardware”: build railways, subways, and vigorously develop the real estate, etc. In recent years, serious air pollution problems appeared in Hunan, Hubei, and Henan, and the PM2.5 in these provinces was relatively high.
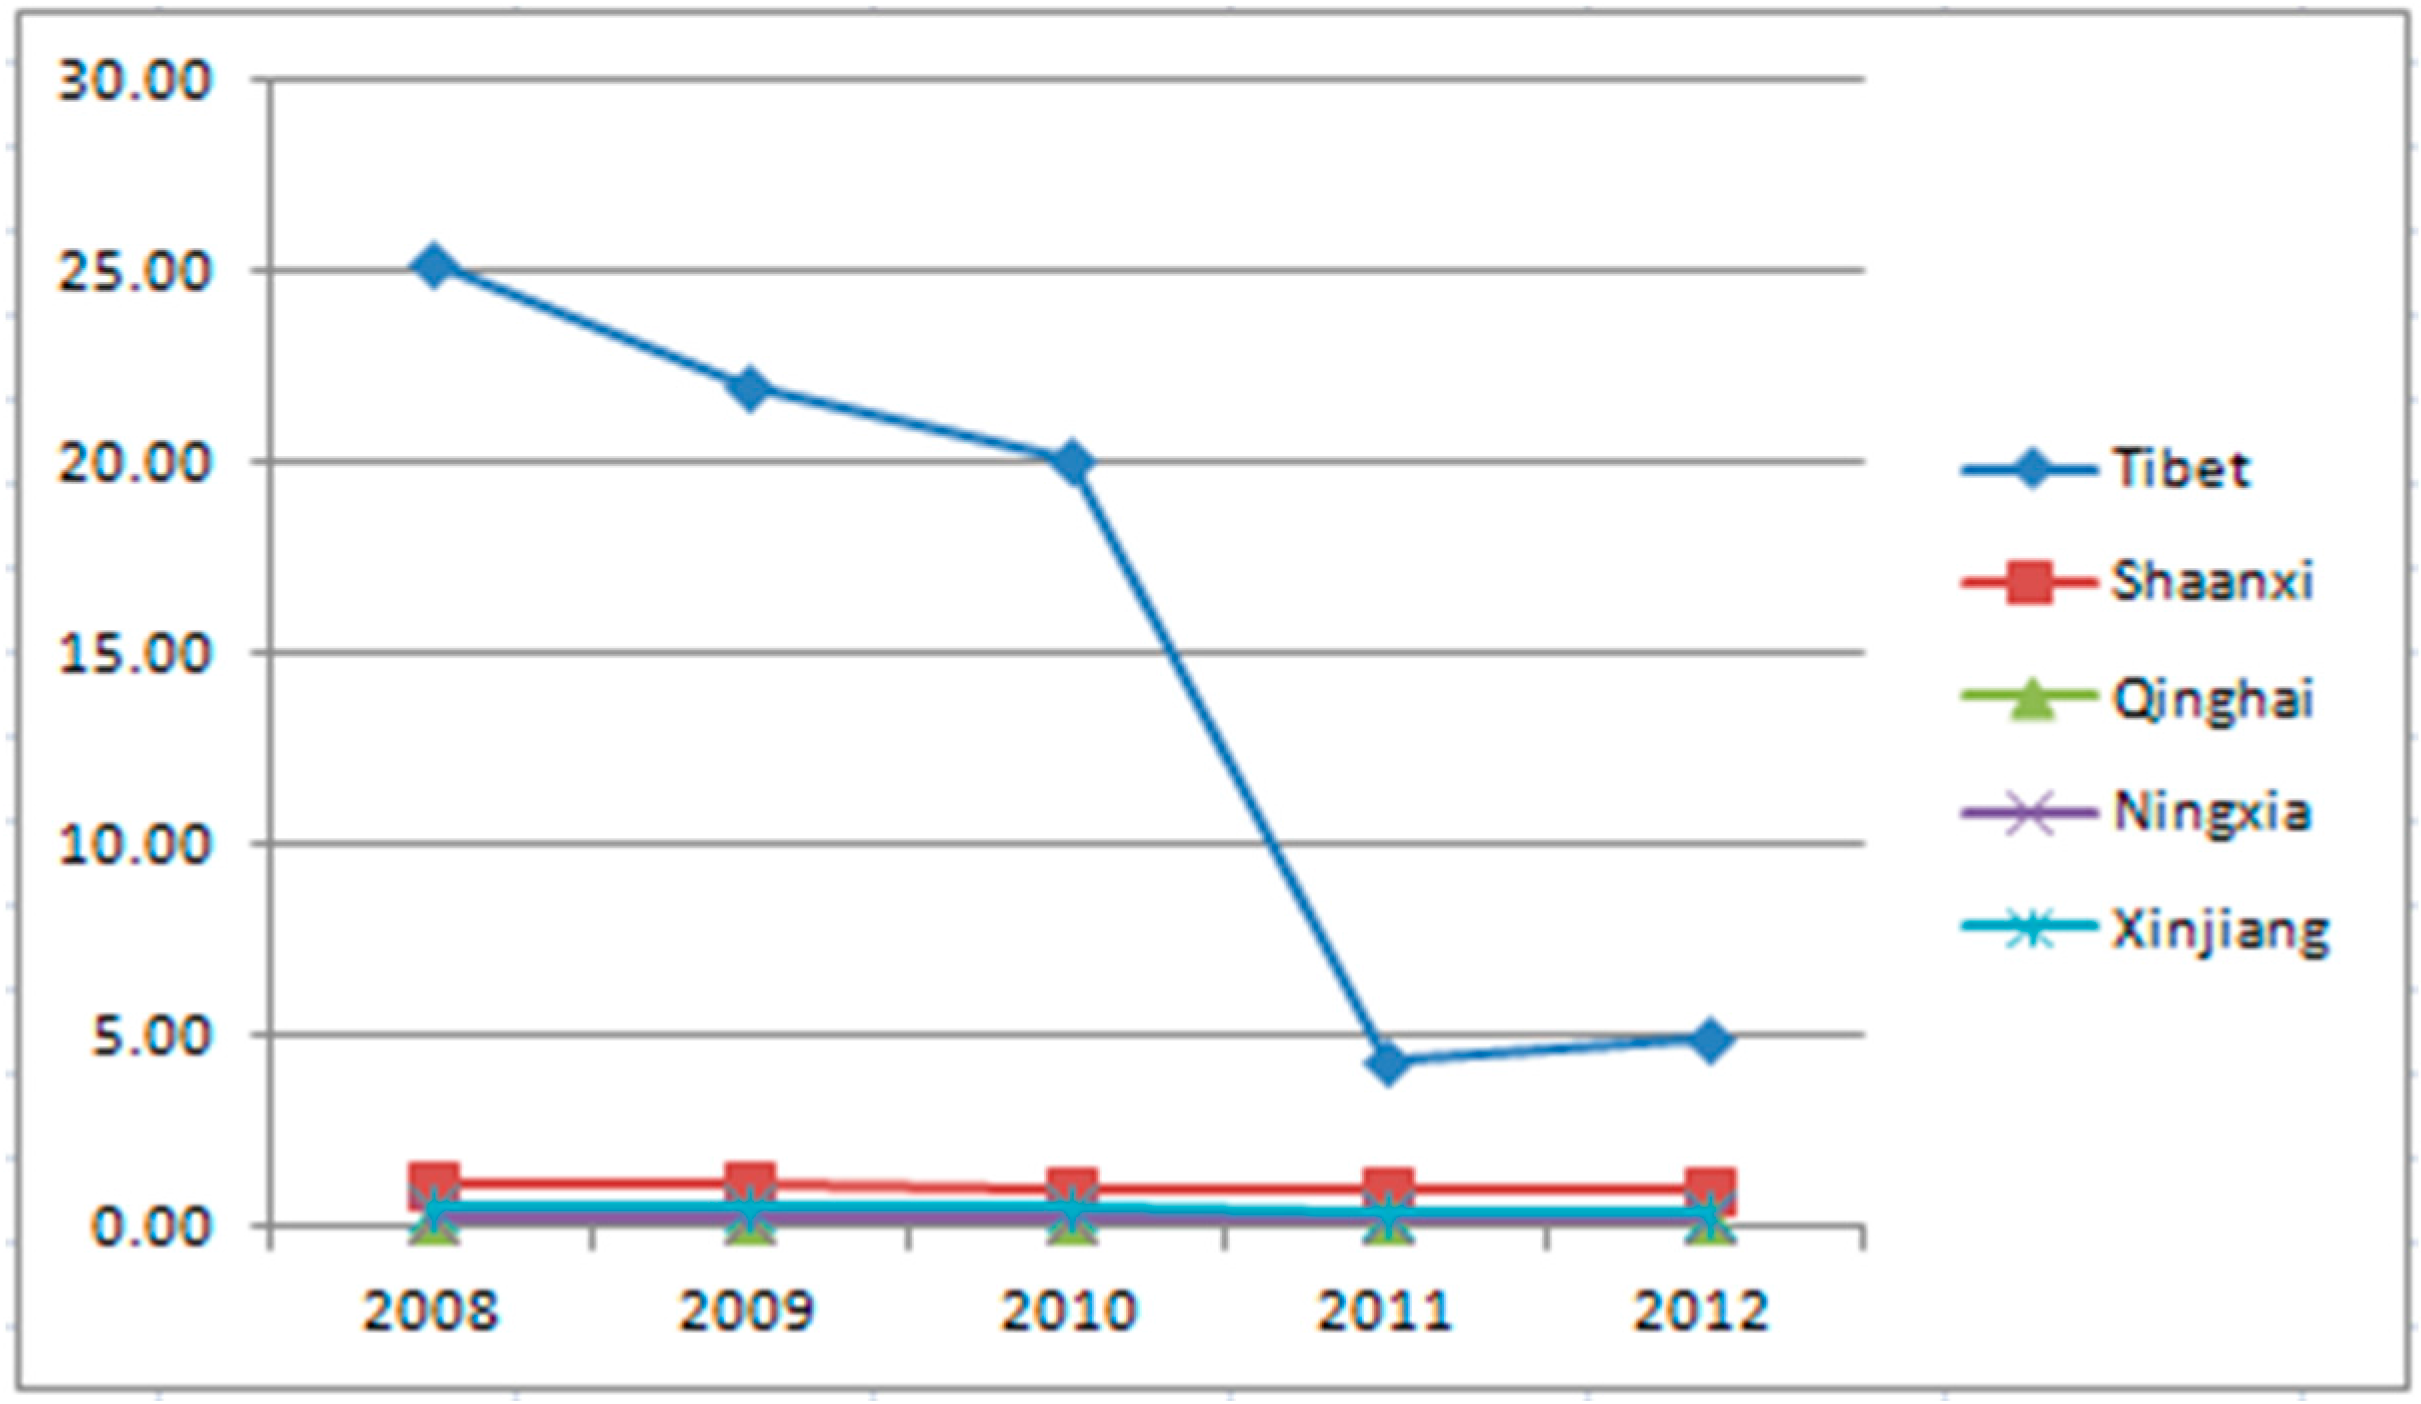
Figure 5. Green development efficiency assessment values of six provinces in central China in the last five years.
Sustainability 07 04492 g005

5.3. Western Areas

On the basis of the assessment above, the green development efficiency of western areas is at the bottom of the whole country. However, the Malmquist index of 31 regions in China is greater than 1 in the last five years while only the index of western areas is smaller than 1, which reflects the green development in western areas experienced a downward trend. As shown in Figure 6, now we take four typical western areas as examples and make an analysis.
Figure 6. Green development efficiency assessment values of four western areas in the last five years.
Sustainability 07 04492 g006
Tibetʼs green development value efficiency is still at a high position while the green development route fell sharply. The green development in other regions is far from the green frontier. The reasons are as follows:
Low energy efficiency and resource scarcity exist at the same time. Since the Western Development Office of the State Council started the strategy of Western Development in March 2000, remarkable progress has been made. Although the western region has vast territory with abundant resources—such as Xinjiang, which boasts rich solar energy and petroleum resources—resources failed to be effectively used, mainly because of poor weather conditions, inconvenient traffic and water scarcity. Especially, in recent years, some terrorist events and disturbance happened in Tibet and Xinjiang which lead to instability in society, which makes it difficult to introduce policies to develop the country through science and education.

6. Conclusions

From a holistic viewpoint, this paper creatively adapted a Super-Efficiency Data Envelopment Analysis Model for region green development efficiency and a Malmquist index for regional sustainable development abilities. The model of CCR DEA model traces out the regional green development frontier surface, which manifests the regions on the pathway to green development, or otherwise. In addition, to realize dynamic assessment, we chose the Malmquist index to make further continuous assessments of regional sustainable development capacity according to the panel data of 31 municipalities and provinces from 2008–2012. The models in our research may be applied to assess the green development status and evolutions of different regions in Chinese mainland.
Through research, we think that regional green development should not simply be regarded as a slogan or ordinary policy. We should implement it into every aspect of society to form a scientifically-grounded and well-organized green development system. Now, we are in the primary stage of the research, only assessing the regional green development in China. Then, we will conduct further research, ascertaining the optimal pathway for green development in accordance with China’s particular conditions, taking a scientific approach automatically adapted to the assessment values of green development in different regions.

Acknowledgment

This work was supported in part by NSFC under Grant Nos. 91024020 and by the Humanities and Social Science Research Fund of Ministry of Education of P.R. China under Grant No. 11YJC840038, and under Grant No. 14YJA840010.

Author Contributions

The first author, Qing Yang, proposed the original method of the DEA and designed the main steps of the research. The second author (corresponding author), Xingzi Wan, designed the indicator system and conducted the empirical analysis of Mainland China by collecting the panel data, and wrote the paper. The third author, Huimin Ma, supervised the whole process of writing the paper and helped the writer refine the research results and discussions.

Conflicts of Interest

The authors declare no conflict of interest.

References

  1. Burnett, J. City buildings—Eco-labels and shades of green! Landsc. Urban Plan. 2007, 83, 29–38. [Google Scholar] [CrossRef]
  2. Marchand, G.; Michel, S.; Sellami, F.; Bertin, F.; Blanchet, F.; Crowch, A. Tsobgou-Ahoupe, R. Un habitat de la fin du Mésolithique dans le Centre-Ouest de la France: L’Essart à Poitiers (Vienne). L'Anthropologie 2007, 111, 10–38. [Google Scholar] [CrossRef]
  3. De Oliveira, J.A.P.; Doll, C.N.H.; Balaban, O.; Jiang, P.; Dreyfus, M.; Suwa, A.; Dirgahayani, P. Green economy and governance in cities: assessing good governance in key urban economic processes. J. Clean. Prod. 2013, 58, 138–152. [Google Scholar] [CrossRef]
  4. Ishwaran, N. Science in intergovernmental environmental relations: 40 years of UNESCO’s Man and the Biosphere (MAB) Programme and its future. Environ. Dev. 2012, 1, 91–101. [Google Scholar] [CrossRef]
  5. Grossman, G.M.; Krueger, A.B. The inverted-U: What does it mean? Environ. Dev. Econ. 2008, 1, 119–122. [Google Scholar]
  6. UNEP. Green Economy: Driving a Green Economy Through Public Finance and Fiscal Policy Reform Working Paper. Available online: http://www.unep.org/greeneconomy/ (accessed on 30 March 2015).
  7. OECD. Green Growth in Cities. Available online: http://www.oecd.org/regional/green-growth-in-cities.htm (accessed on 30 March 2015).
  8. Wolch, J.R.; Byrne, J.P. Landscape and Urban Planning Urban green space, public health, and environmental justice : The challenge of making cities “just green enough”. Landsc. Urban Plan. 2014, 125, 25. [Google Scholar]
  9. Dou, X.; Li, S.; Wang, J. Ecological Strategy of City Sustainable Development. APCBEE Procedia 2013, 5, 429–434. [Google Scholar] [CrossRef]
  10. Bogdan, A.; Istudor, N.; Gruia, R.; Florea, G. New holistic approach of bioeconomics and ecoeconomics theories, practical bridging from the green economy to blue economy, trough new integrated and innovative paradigm about “bio -eco-geo- economy”. Procedia Econ. Finance 2014, 8, 83–90. [Google Scholar] [CrossRef]
  11. Musango, J.K.; Brent, A.C.; Bassi, A.M. Technological Forecasting & Social Change Modelling the transition towards a green economy in South Africa. Technol. Forecast. Soc. Change 2014, 87, 257–273. [Google Scholar] [CrossRef]
  12. Nzeadibe, T.C.; Anyadike, R.N.C. City, Social participation in city governance and urban livelihoods: Constraints to the informal recycling economy in Aba, Nigeria. City Cult. Soc. 2012, 3, 313–325. [Google Scholar] [CrossRef]
  13. Wu, H.; Shi, Y.; Xia, Q.; Zhu, W. Resources, Conservation and Recycling Effectiveness of the policy of circular economy in China: A DEA-based analysis for the period of 11th five-year-plan. Resour. Conserv. Recy. 2014, 83, 163–175. [Google Scholar] [CrossRef]
  14. Kennedy, S.; Sgouridis, S. Rigorous classification and carbon accounting principles for low and Zero Carbon Cities. Energy Policy 2011, 39, 5259–5268. [Google Scholar] [CrossRef]
  15. Lehmann, S. Can rapid urbanisation ever lead to low carbon cities ? The case of Shanghai in comparison to Potsdamer Platz Berlin. Sustain. Cities Soc. 2012, 3, 1–12. [Google Scholar] [CrossRef]
  16. Zeev, S.; Meidad, K.; Avinoam, M. A multi-spatial scale approach to urban sustainability—An illustration of the domestic and global hinterlands of the city of Beer-Sheva. Land Use Policy 2014, 41, 498–505. [Google Scholar] [CrossRef]
  17. Qing, Y.; Yang, D. Research on the MSP Evolution Patterns of Two-oriented Society Coordinated Development in Regions of China. Procedia Environ. Sci. 2012, 12, 777–784. [Google Scholar] [CrossRef]
  18. Javadian, M.; Shamskooshki, H.; Momeni, M. Application of sustainable urban development in environmental suitability analysis of educational land use by using AHP and GIS in Tehran. Procedia Eng. 2011, 21, 72–80. [Google Scholar] [CrossRef]
  19. Yupu, Z.; Yongbo, S.; Jiangbo, Q. Sustainable development of coal cities in Heilongjiang province based on AHP method. Int. J. Min. Sci. Technol. 2012, 22, 133–137. [Google Scholar] [CrossRef]
  20. Sami, M.; Javad, M.; Pazhohanniya, M. Environmental Modelling & Software Environmental comprehensive assessment of agricultural systems at the farm level using fuzzy logic: A case study in cane farms in Iran. Environ. Modell. Softw. 2014, 58, 95–108. [Google Scholar] [CrossRef]
  21. Blancard, S.; Hoarau, J.-F. A new sustainable human development indicator for small island developing states: A reappraisal from data envelopment analysis. Econ. Modell. 2013, 30, 623–635. [Google Scholar] [CrossRef]
  22. Nitkiewicz, T.; Pachura, P.; Reid, N. An appraisal of regional intellectual capital performance using Data Envelopment Analysis. Appl. Geogr. 2014, 53, 246–257. [Google Scholar] [CrossRef]
  23. Yin, K.; Wang, R.; An, Q.; Yao, L.; Liang, J. Using eco-efficiency as an indicator for sustainable urban development: A case study of Chinese provincial capital cities. Ecol. Indic. 2014, 36, 665–671. [Google Scholar] [CrossRef]
  24. Charnes, A.; Cooper, W.W.; Rhodes, E. Measuring the efficiency of decision making units. Eur. J. Oper. Res. 1978, 2, 429–444. [Google Scholar] [CrossRef]
  25. Avkiran, N.K. Association of DEA super-efficiency estimates with financial ratios: Investigating the case for Chinese banks. Omega 2011, 39, 323–334. [Google Scholar] [CrossRef]
  26. Noura, A.A.; Lotfi, F.H.; Jahanshahloo, G.R.; Rashidi, S.F. Super-efficiency in DEA by effectiveness of each unit in society. Appl. Math. Lett. 2011, 24, 623–626. [Google Scholar] [CrossRef]
  27. Chung, Y.; Heshmati, A. Measurement of environmentally sensitive productivity growth in Korean industries. J. Clean. Prod. 2014. [Google Scholar] [CrossRef]
  28. Arabi, B.; Munisamy, S.; Emrouznejad, A.; Shadman, F. Power industry restructuring and eco-efficiency changes: A new slacks-based model in Malmquist–Luenberger Index measurement. Energy Policy 2014, 68, 132–145. [Google Scholar] [CrossRef]
  29. Macpherson, A.J.; Principe, P.P.; Mehaffey, M. Using Malmquist Indices to evaluate environmental impacts of alternative land development scenarios. Ecol. Indic. 2013, 34, 296–303. [Google Scholar] [CrossRef]
  30. Rolf, F.; Grosskopf, S.; Lovell, C.A.K.; Pasurka, C. Multilateral productivity comparisons when some outputs are undesirable: A nonparametric approach. Rev. Econ. Stat. 1989, 37, 71–89. [Google Scholar]
  31. European Commission. Building Environmental Quality Evaluation for Sustainability through Time Network (BEQUEST). Available online: http://cordis.europa.eu/project/rcn/43677_en.html (accessed on 30 March 2015).
  32. European Commission. A European Thematic Network on Construction and City Related Sustainability Indicators (CRISP). Available online: http://cordis.europa.eu/project/rcn/43677_en.html (accessed on 30 March 2015).
  33. European Foundation. Urban Sustainability Indicators; Office for Official Publications of the European Communities: Luxembourg, 1998. [Google Scholar]
  34. UN-HABITAT. Urban Indicator Guidelines–Monitoring the Habitat Agenda and the Millennium Development Goals; UN-HABITAT: Nairobi, Kenya, 2004. [Google Scholar]
  35. United Nations. Indicators of Sustainable Development: Guidelines and Methodologies; United Nations: New York, NY, USA, 2007. [Google Scholar]
  36. World Bank. Global City Indicator Programme Report–Part of a Program to Assist Cities in Developing an Integrated Approach for Measuring City Performance. Available online: http://www.cityindicators.org/ProjectDeliverables.aspx (accessed on 30 March 2015).
  37. China Statistical Yearbook Editorial Board. China Statistical Yearbook 2009–2013; China Statistics Press: Beijing, China, 2009–2013. [Google Scholar]
  38. China Environment Yearbook Editorial Board. China Environment Yearbook 2009–2013; China Statistics Press: Beijing, China, 2009–2013. [Google Scholar]
  39. Lindmark, M. An EKC-pattern in historical perspective: Carbon dioxide emissions, technology, fuel prices and growth in Sweden. Ecol. Econ. 2002, 42, 333–347. [Google Scholar] [CrossRef]

