Article

Genuine Savings as an Indicator for “Weak” Sustainability: Critical Survey and Possible Ways forward in Practical Measuring

Institute for Food and Resource Economics, University of Bonn, Nußallee 21, 53115 Bonn, Germany
Sustainability 2015, 7(4), 4146-4182; https://doi.org/10.3390/su7044146
Submission received: 16 November 2014 / Revised: 18 February 2015 / Accepted: 1 April 2015 / Published: 10 April 2015

Abstract

:
Published by the World Bank (as “Adjusted Net Savings”) for around 160 countries, Genuine Savings (GS) presents the most respected but also the most debated indicator for “weak” sustainability. It originates from the so-called “Hartwick rule” for the re-investment of rents from the depletion of natural in reproducible forms of capital. Coming from the theoretical reasoning behind GS, this paper discusses possible extensions either not yet discussed or underrepresented in current research. Mainly, I suggest a discussion of additional items that could be included in GS and show that both the global average and individual country levels of GS would change immensely by including these recommendations.

1. Introduction

This paper has two goals: first to provide an overview of the growing literature on Genuine Savings (GS) and its development, as it is the most important indicator for “weak” sustainability; second to critically discuss this indicator and suggest possible modifications. Typical critical reviews of GS, such as by Dietz and Neumayer [1,2], discuss unrealistic assumptions or exogenous shocks to the GS model, as well as the problems in measuring the depreciation of natural capital. I discuss this, but concentrate on further problems in the actual calculation of GS, suggesting possible extensions thus far not discussed in GS literature.
Dividing GS into its individual calculation components, I discuss different ideas and examples for the potential modification of the indicator, in order to contribute to the stagnating discussion on GS calculation with real world data. In contrast with earlier publications, I do not concentrate primarily on natural capital, as this is discussed comprehensively in literature, rather I also discuss the two other forms of capital. I suggest that the discussion on GS should step back and determine not only what parts of natural capital depletion should be substituted and how to calculate this, but also which contents of physical and human capital could additionally be included.
Thoughts on sustainable development (SD) emerged centuries ago and found their first clear expression in Carlowitz’s “Sylvicultura Oeconomica” from 1713 [3] and Malthus’ essay on exponential population growth from 1798 [4] (for historical overviews see, for example, Rao [5], Elliott [6] or Rogers et al. [7]). The Malthusian vision on “Limits to Growth” [8] resulted in a substantial scientific, especially economic, discussion on intergenerational equity in the 1970s (see Dasgupta and Heal [9], Solow [10,11] and Stiglitz [12], and for a review Pezzey [13]). From this, Hartwick [14] formulated a rule-of-thumb for a fair intergenerational handling of exhaustible resources: Keep the total capital stock of a country at least constant over time by “invest(ing) all profits or rents from exhaustible resources in reproducible capital such as machines”. This is rooted in the idea that—population given—it is the sum of total capital, and not its single components, that is most decisive for production capacities and thus the basis for future development (for overviews of all of these topics see Harris [15] and the “Handbook of Sustainable Development” by Atkinson et al. [16]). GS combines the net investment in physical and human capital with the depletion of natural capital to provide an indicator for this so-called “Hartwick rule” as a paradigm for “weak” sustainability.
The World Bank (“Adjusted Net Savings” in World Bank terms to distinguish between the GS model and the actual calculation) subtracts consumption and the depreciation of physical capital from Gross National Income (GNI) to illustrate the net investment in physical capital. Besides the usual critique on the depreciation method, I discuss possible extensions, such as durable consumption goods, which could be considered sustainable investments. After reducing GNI by consumption and depreciation, the World Bank adds current education expenditures to indicate investment in human capital. I argue that human capital is also depreciating through death and, as a consequence, health expenditures that increase life expectancy could also be seen as increasing human capital.
After adjusting for education expenditures, the World Bank subtracts the rents of natural resources and damages by air pollution as depletion of natural capital. Natural resources are divided into the categories of energy, mineral and forest depletion, and are calculated by the ratio of the present value of rents to the exhaustion time of the resource. I discuss which natural resources should be included and show their influence on the GS of individual countries. The inclusion of air pollution is surveyed and discussed from the viewpoint of a whole line of literature that considers a broader base of pollution damages, as well as the critique that GS should not include pollution but concentrate on pure natural resource depletion.

2. Weak Sustainability

The most commonly cited definition of sustainable development (SD) (for a review of journal articles about sustainability see Pezzey and Toman [17]) is found in the Brundtland Report of the United Nations World Commission on Environment and Development, which states that “(s)ustainable development is development that meets the needs of the present without compromising the ability of future generations to meet their own needs” [18] (for an overview of the manifold definitions and approaches, see for example Rao [5] (pp. 67–109), Baker [19] (pp. 15–48) or Bell and Morse [20] (pp. 3–41)). Built upon this foundation and its advancement as a development path with non-declining welfare, one of the most plausible definitions by Neumayer [21] states that SD is development that “does not decrease the capacity to provide non-declining per capita utility for infinity”.
The two opposing paradigms of “weak” and “strong” SD discuss what this capacity should exhibit (for the distinction between weak and strong sustainability see the rather famous “Blueprint for a Green Economy” by Pearce et al. [22] and the comprehensive discussion by Neumayer [21]): the concept of “strong” SD as coined by Daly in 1977 in his “Steady-state economics” [23], assumes substitution between non-renewable and renewable resources within the framework of natural capital when possible, but states that SD cannot be achieved by re-investing income from the depletion of natural resources into other forms of capital [24].
Conversely, the theory of “weak” sustainability (WS) assumes that different forms of capital are in principle substitutable and only the maintenance of the total capital stock is important to provide future utility. The so-called “Hartwick rule” [14,25,26,27,28] or “Solow-Hartwick rule” [10,11,29,30,31] provides a general rule for WS (for a short overview of the development of this rule by Robert Solow and John Hartwick, see Hartwick [32] and the “Introduction” by Hartwick [33] in the “Handbook of Environmental Accounting”): Keep a country’s total capital stock at least constant by investing in all forms of capital at the same level of all forms of capital consumption to allow for sustained consumption over time [21]; this creates a “rule of thumb” for the absolute minimum condition to ensure a fair chance of guaranteeing future sustainability [34].
Besides natural capital providing us with resources as input for production processes and services such as air cleaning, there are man-made or produced forms of capital, namely physical capital such as machines, roads or buildings and human capital such as skills and knowledge that allow for increased productivity of labor. Substitutability between different forms of capital is one of the major unresolved discussions in sustainability literature: To what extent is the loss of natural capital substitutable by the production of man-made capital?
The basic assumption behind the paradigm of “weak” sustainability is that the social welfare of a society depends on its total wealth–determined in capital values–and adjustments to this wealth change the path of SD. Therefore, the present value of future utility, which should determine the value of capital, is at least theoretically equal to social welfare. Therefore, if net investment in all existing forms of a country’s capital stock (physical, human and natural) is positive, the capacity to provide future utility is also positive. If this is accepted, the logical follow-up question addresses the means of measuring the capital stock of a country or changes in this stock beyond the traditional forms of capturing economic processes [35,36,37] (the World Bank has its own program of Environmental Economics and Indicators, estimating (besides GS) the total wealth of countries, such as intangible institutional capital [38,39]).

3. Genuine Savings (GS)

Hamilton and Clemens [36] develop a formal model for Genuine Savings (GS) by starting with the assumption of a simple closed economy, the resource input of which can be used for consumption or investment in produced, man-made capital (in principal this model is an extension of the model by Hartwick [26,27]. For an extensive derivation of the dynamic optimization model for GS, see also Neumayer [21]). Produced capital is divided into physical capital and human capital. The production of physical capital is afflicted with pollution:
F   ( K P ,   K H , δ K N ) = C + δ K P + δ K H + P A
The stock of the three forms of capital (physical (KP), human (KH) and natural (KN)) depends on the one hand on the composition of C in terms the consumption of KN and KP, and on the other hand the investment in physical (δKP) and human capital (δKH) as well as pollution abatement costs (PA). Consumer utility is a function of consumption (C) and environmental services (B), U = U(C, B). A country’s wealth depends on the maximization of this utility function with a constant rate of discount [21], and is subject to investment in physical capital:
δ K P = F C P A δ K H
depletion or consumption of natural capital:
δ K N = r e s o u r c e   g r o w t h r e s o u r c e   d e p l e t i o n
pollution emissions or their abatement expenditures, respectively:
P A = p o l l u t i o n   e m i s s i o n s n a t u r a l   d i s s i p a t i o n
and investment in human capital measured by current operating education expenditures, which could also be seen as endogenous technological progress [36]:
δ K H = t o t a l   e d u c a t i o n   e x p e n d i t u r e s i n v e s t m e n t   i n   b u i l d i n g s   a n d   e q u i p m e n t
The model by Hamilton and Clemens [36] evolves from the original comparison of savings, which in a closed economy should equal investments, and the combined depreciation of physical and natural capital as evidence of “weak” sustainability in the definition by Pearce and Atkinson [37]. In their view, an economy is sustainable if the savings are higher than the combined depreciation of all different forms of capital. For this constraint, WSI as a “weak” sustainability index has to be positive:
W S I = ( S Y ) ( δ K P Y ) ( δ K N Y )
δKP is depreciation of physical capital, and δKN the depletion of natural capital. Hamilton [40,41], Pearce et al. [42], Atkinson et al. [43], and, as shown, Hamilton und Clemens [36] expand on Equation (6) by adding investment in human capital (δKH) as additional savings for the future and pollution emission damages as additional depletion of KN. Since emissions not only negatively influence natural capital but also physical–for example through damages to the facades of buildings–and human capital–through adverse effects on health–the total capital stock of a country is influenced. I therefore denote this as NK for negative capital, which influences all capital forms as social costs:
W S I = ( S Y ) ( δ K P Y ) + ( δ K H Y ) ( δ K N Y ) ( δ N K Y )
In a nutshell, GS illustrates a mix of consumption and savings. Following Atkinson et al. [43] it can be considered “genuine” since it is “saving over and above the value of asset consumption” [44]. These savings could theoretically be seen as re-investment of depleted natural capital (and social costs by environmental degradation) into other forms of capital, resulting in the net investment into a country’s total capital stock [45,46].
Hamilton et al. [47] shows that negative GS at one “point in time means that future utility must be less than current utility over some period on the optimal path”, or in other words, negative GS presents a clear sign of non-sustainability [36]. Contrary to their first approaches, authors such as Atkinson [44], Hartwick [45], Dietz et al. [46], Hartwick et al. [48] or Hamilton and Atkinson [49] point out that GS is a one-sided indicator, showing “unsustainability, not sustainability” [50] since negative GS rates demonstrate an unsustainable re-investment of natural capital into other forms of capital.
To translate this into calculations with real data, Hamilton and Clemens [36], Hamilton [51] and a number of official WB publications [38,39] select the traditional Gross National Income (GNI) as the starting point for the Genuine Savings (GS) calculation:
G N I =   I P + I G + C P + C G + n e t   e x p o r t s + n e t   i n c o m e   f r o m   a b r o a d
GNI comprises total investment in physical capital (differentiated into private (IP) and public (governmental) investment (IG)), private (CP) and public consumption (CG), net exports and foreign earnings. The assumption that this in principal shows the distribution between investment and consumption of a society serves as the foundation for the calculation of Gross National Savings (GNS) in Equation (9), which subtracts total consumption from GNI to achieve the remaining gross savings:
G N S = G N I C P C G + n e t   c u r r e n t   t r a n s f e r s
The addition of net current transfers (NCT) includes all goods and services, income and both incoming and outgoing financial items without a quid pro quo. In total, GNS comprises all items increasing a country’s savings beyond what is left from GNI once consumption has been subtracted.
The next step of the calculation subtracts the depreciation of physical capital (δKP)—“the replacement value of capital used up in the process of production” [39]—from GNS to achieve the net investment in physical capital, Net National Savings (NNS):
N N S = G N S d e p r e c i a t i o n   o f   p h y s i c a l   c a p i t a l   ( δ K P )
NNS shows whether new investment in physical capital is higher than the consumption of the existing capital stock. However, physical capital (KP) is not the only capital upon which a country’s wealth and development hinges. A population’s knowledge and skills, its so-called human capital, is comprehensively addressed in theoretical discussions, though its measurement remains elusive. Therefore, in the calculation of GS, investment in human capital (δKH) is proxied by current operating education expenditures (COEE), including wages and salaries and excluding capital investments in building and equipment, as this is already found in KP [38,39,52]. Certain COEE components, such as the purchase of books or payment of teachers’ salaries, are traditionally treated as consumption and therefore subtracted in CG in Equation (9). For Education Adjusted National Savings (EANS) these components are reincluded:
E A N S = N N S + C O E E   ( δ K H )
Building on theories of green national accounting, in the next step GS deducts the rents from the depletion of natural resources (RN) calculated by multiplying the actual world market prices (P) minus region-specific average production costs (AC) to show the decrease of the natural capital stock:
R N = ( ( P A C ) × p r o d u c t i o n   v o l u m e )
Following official WB publications [38,53] this was adjusted in 2011 by setting the present value (PV) of RN (discounted at 4%) in relation to the remaining resource stock:
δ K N = P V R N e x h a u s t i o n   t i m e   o f   t h e   r e s o u r c e   s t o c k   ( m i n ( 25   y e a r s , r e s e r v e s p r o d u c t i o n ) )
To date, this methodical extension has only been realized for the latest two “World Development Indicators” [39,53], whereas previous editions since 1970 are only affected theoretically, while the data itself has not yet been adjusted.
According to the aforementioned “Hartwick rule” [14] these rents should be completely reinvested into the two other forms of capital. Essentially, net investment in KP and KH should be higher than δKN. The “World Development Indicators” [54] divide depleted natural capital into energy (to date, this covers coal, crude oil, and natural gas), mineral (this covers bauxite, copper, iron, lead, nickel, phosphate, tin, zinc, gold and silver) and net forest depletion (“net forest depletion is calculated as the product of unit resource rents and the excess of roundwood harvest over natural growth” [54]), clearly omitting not only several forms of natural capital such as fish or soil stocks, but also individual resources such as diamonds [38].
In my definition from Equation (7)—following argumentations by Fankhauser [55] and the explanation in the calculation manual by Bolt et al. [52]—air pollution damages are social costs negatively influencing all forms of capital (δNK) [36,38]. The analysis of air pollution is difficult due to deficits in the data (see discussion in Section 4.6.4), therefore only the damages from carbon dioxide and particulate emissions are currently included. Marginal global CO2 damage “is estimated to be $20 per ton of carbon (the unit damage in 1995 U.S. dollars) times the number of tons of carbon emitted” [54] and particulate emission damage is estimated as the willingness to pay to avoid mortality attributable to PM10.
Genuine Savings (GS)—Adjusted Net Savings in World Bank terms—“measures the change in value of a specified set of assets, that is, the investment/disinvestment in different types of capital (produced, human, natural)” [39]:
G e n u i n e   S a v i n g s   ( G S ) = ( G N I C P C G + N C T ) δ K P + δ K H δ K N δ N K
In the following section, I discuss the critiques that emerge in relevant literature combined with my own arguments and examples for simple modifications. The literature mainly concentrates on the theoretical background and the well-known problem of population growth, with which I also start my discussion. One additional debate surrounding GS, addressed by most of the publications considered, is the calculation of rents from natural resource depletion. I raise this topic but concentrate on the inclusion of further natural resources and pollution damages. I show possible extensions to the individual calculation steps of GS and the resulting different capital forms.

4. Critique and Possible Extensions

4.1. Theoretical Background

Hamilton and Clemens [36] show in their formal model that the inclusion of net depletion of natural capital and the cost of atmospheric pollution as well as the accumulation of human capital puts GS in the position to equal changes in a country’s social welfare [56]. To accept this, one has to “adopt a neoclassical stance and assume the possibility of substitution between “natural” (KN) and “man-made” (KP) capital” [37], which could be discussed from the viewpoint of “strong” sustainability. However, for a look at the substitutability of different forms of capital I point to the discussion between “strong” and “weak” sustainability by Neumayer [21,57,58] or Dietz and Neumayer [1,2] as the most detailed critical reviews of GS, as well as my own overview in Section 2. These earlier analyses concentrate on assumption problems within the GS model and measurement problems in the actual GS calculation. I proceed in the same way, excluding the fundamental debate on substitutability (this debate has already been carried out by others such as, Beckerman [59,60], Jacobs [61] and Daly [62], or Neumayer [63], and Simpson et al. [64]).
One of the harshest criticisms of GS stems from the fact that the indicator is theoretically built on a perfect competition model. Since it is clear that the assumptions of an inter-temporally efficient economy that develops along an optimal path in a perfectly competitive market do not hold in reality, GS as a measure for WS is to treat with caution. “Markets fail, especially inter-temporally, and natural assets exhibit public goods characteristics” [1], wherefore resource prices can be substantially different from optimal ones. For the GS calculation, which uses world market prices in Equation (12), this means that GS rates could be positively influenced while resource depletion is unsustainable. Over-depletion of natural resources should decrease their prices below the optimal level (and quantities above this level), but with proper re-investment GS would still remain positive [21]. Or in more simple terms: If world market prices (P) are lower than the actual value of a resource (due to incorrect exceptions or excessive supply, for example), the depletion of this resource increases to achieve the same profit, while the rents (RN) in Equations (12) and (13) remain constant. As follows, if investment in physical and human capital also remains constant, GS stays the same even while the consumption of natural resources rises.
Hamilton and Atkinson [65], Hamilton et al. [47] or Hamilton and Hartwick [66] state that GS at least indicates the right direction due to the argument that over-depleted states that move in the direction of optimization increase their GS. However, Neumayer [21] argues that this holds true only in a partial equilibrium analysis and not in a general analysis that sustainability attempts to address. The same is true for externalities not incorporated in the model or other effects that shift quantities and prices away from the optimal level. Therefore, it is rather unclear how over or under-depletion influences GS, especially if positive and increasing GS could result from unsustainable resource use and environmental degradation [17,21]. Therefore, as pointed out by Pezzey [50], only negative GS can function as a one-sided unsustainability test while positive GS at one “point in time does not indicate that future utility is everywhere non-declining” [67]. Or simply, positive GS provides an encouraging sign, especially given that a goal of a country’s policies can yield sustainability but not more.

4.2. Population Growth and GS per Capita

One of the major discussion topics in topical literature is the assumption of a constant population in the model and therefore in the calculation of the rate of change of a country’s total wealth [1,2]. This change is divided into the three described capital forms, but only for whole countries and not per capita. This contradicts the argument that social welfare depends on per capita utility and not only on total values [21]. Not without reason, traditional welfare indicators such as GDP or GNI as the calculation base for GS are shown in per capita terms, while “genuine saving could be positive even though per capita wealth is declining” [68]. Dasgupta [69] predicts constant population in the long run, but in the average of the last five decades (1960–2010) only the population growth of Bulgaria, Curacao, and Serbia was slighty negative, and only eighteen countries had average positive rates below 0.5%. Therefore, since most populations are not static, per capita welfare should be sustained and GS should measure real changes in assets per capita rather than total capital [70]. Negative GS are a clear sign of declining wealth, both in total and per capita terms [38]. However, if GS is positive there should be an easy and practical way to also calculate the per capita value.
While the first attempts to include population growth into the GS calculation by Dasgupta [71], Dasgupta and Mäler [72] or Hamilton [73] were rudimentary, a whole line of research by the team surrounding Arrow et al. [70,74,75,76] discusses the population of a country as an additional capital asset. Put simply, a rising population increases opportunities to build human capital and in the long run increase a country’s workforce and therefore the amount of consumers. This could be seen as a capital form itself which I discuss again in Section 4.5.3 on human capital.
Authors such as Hamilton [68], Hamilton and Atkinson [49] or the World Bank [38] later recommend dividing GS by total population, deducting a so-called Malthusian correction term multiplying wealth per capita by the population growth rate [1] for per capita wealth changes:
( G S P ) = δ G S P ( ( δ P P ) × ( W P ) )
Intuitively, Equation (15) shows that GS per capita increases if the growth of GS is higher than that of population. The only comprehensive estimation of per capita GS by Hamilton [68] comes to the conclusion that most developing countries show declining per capita wealth, even if total GS rates are positive, since their population grows faster than their GS rates. However, although Pezzey [50], the World Bank [38,39], Hamilton [77] and Ferreira and Vincent [78] argue that sustainability has to be measured in per capita utility, to date the World Bank only publishes total GS rates [1,2]. In traditional accounts GNI from Equation (8) is presented in per capita terms by dividing it by total population:
G N I   p e r   c a p i t a = t o t a l   G N I m i d y e a r   p o p u l a t i o n
Hamilton [68,73], who derives Equation (15) in his model uses a similar simplified formula to show changes in per capita wealth with real world data since comprehensive yearly values for a country’s wealth are not yet available:
G S   p e r   c a p i t a = t o t a l   G S t o t a l   p o p u l a t i o n
Concerning Equation (17) I argue that population growth is implicitly included in yearly changing population figures and by dividing total GS by the total population one achieves at least preliminary GS rates per capita until complete data for national wealth is available. While negative GS indicates unsustainability as shown in Pezzey [50], positive GS divided by the midyear population level at least shows whether the capital stock per capita is changing or not. Whether this is enough to hold utility constant is not addressed by Equation (17), but it at the very least indicates a trend and enables a comparison with other countries. The World Bank already has calculated comprehensive per capita wealth for the three years 1995, 2000 and 2005, and sees GS as the indicator which captures “the dynamic behavior that drives wealth changes from one point to the next” [39]. In this definition, GS “measures the annual change in a country’s national wealth” [39] and if the (positive) growth rate of this change is higher than population growth, wealth per capita is then increasing. Until wealth accounting is consistent worldwide and continuously possible, the World Bank could provide a per capita “weak” sustainability index by juxtaposing these growth rates as indicated:
W S I = g r o w t h   r a t e   t o t a l   G S g r o w t h   r a t e   t o t a l   p o p u l a t i o n
Since the World Bank also publishes the population growth rate (in %) for all countries for which it publishes GS rates [53], Equation (18) is a possible indicator to show the development of “weak” sustainability over time.
It is disputable which method is most sound, but overall it seems advisable to consider population size; discussing how exactly this should be done is an emerging research goal [2]. GS remains an incomplete and imperfect indicator, which additionally has to be extended by further parts of the three presented capital forms. Further limitations of the theoretical GS model are raised by the volatility of natural resource prices and therefore volatile terms of trade of resource exporters and importers.

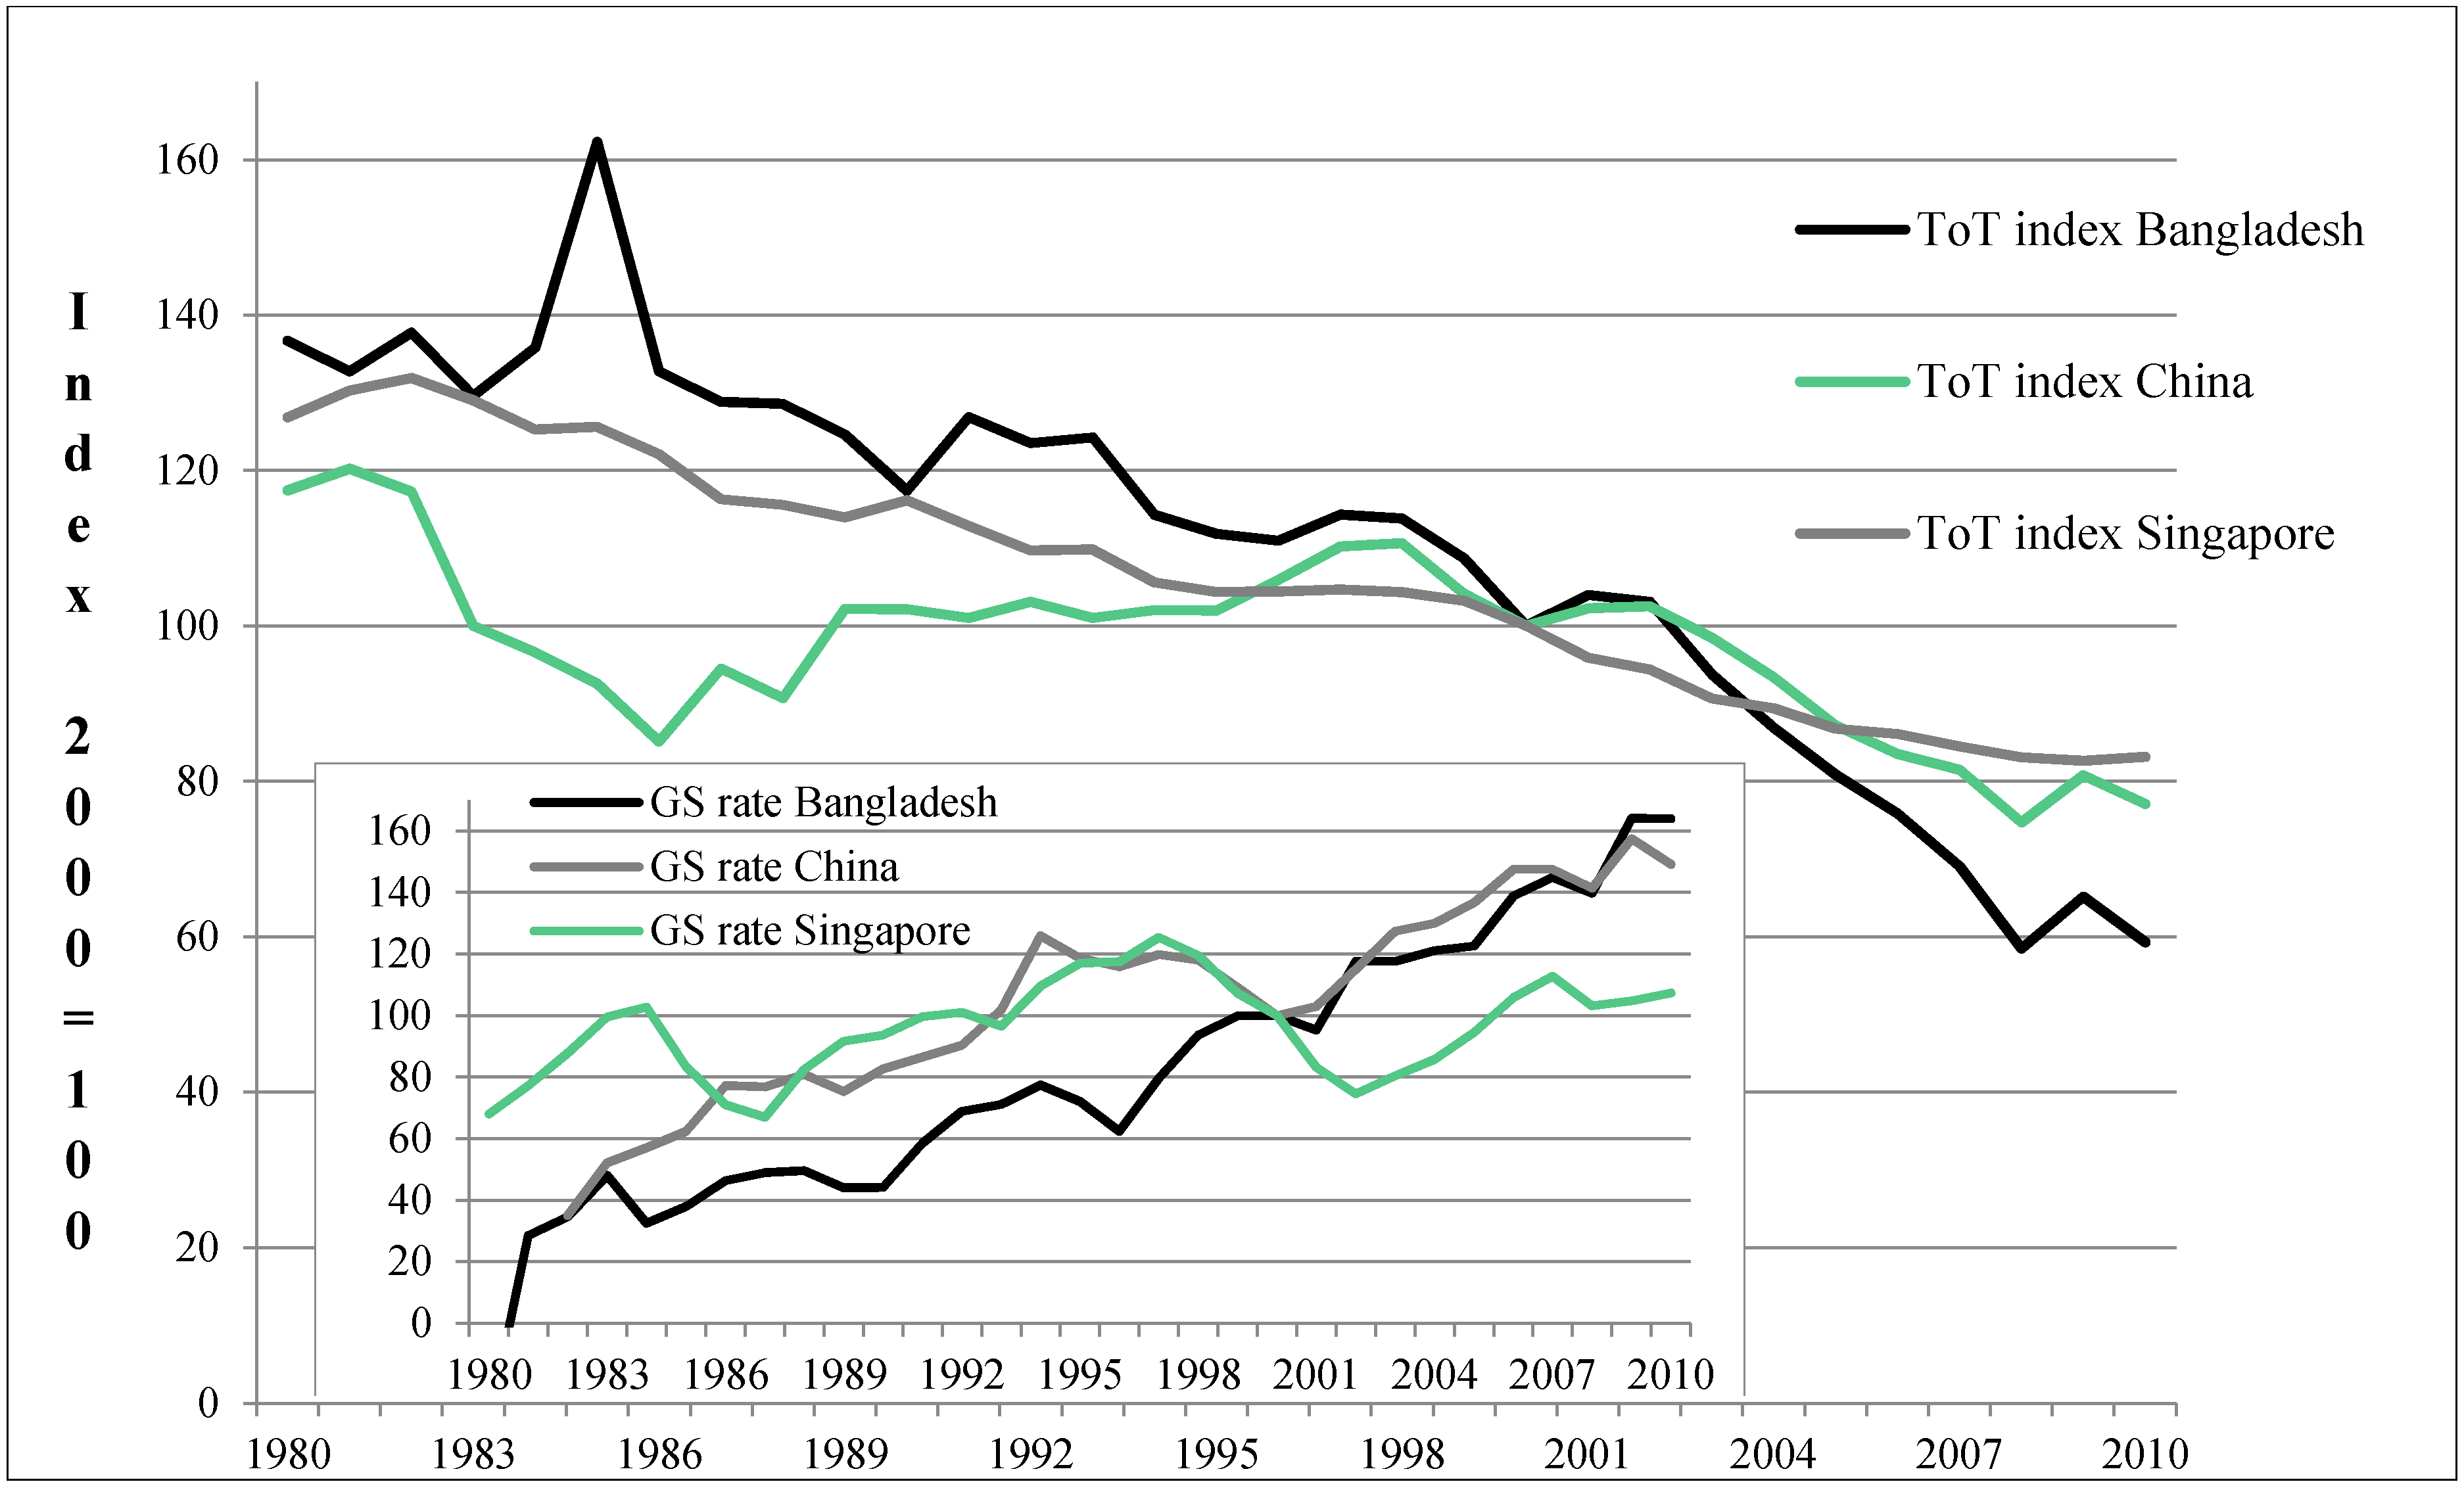
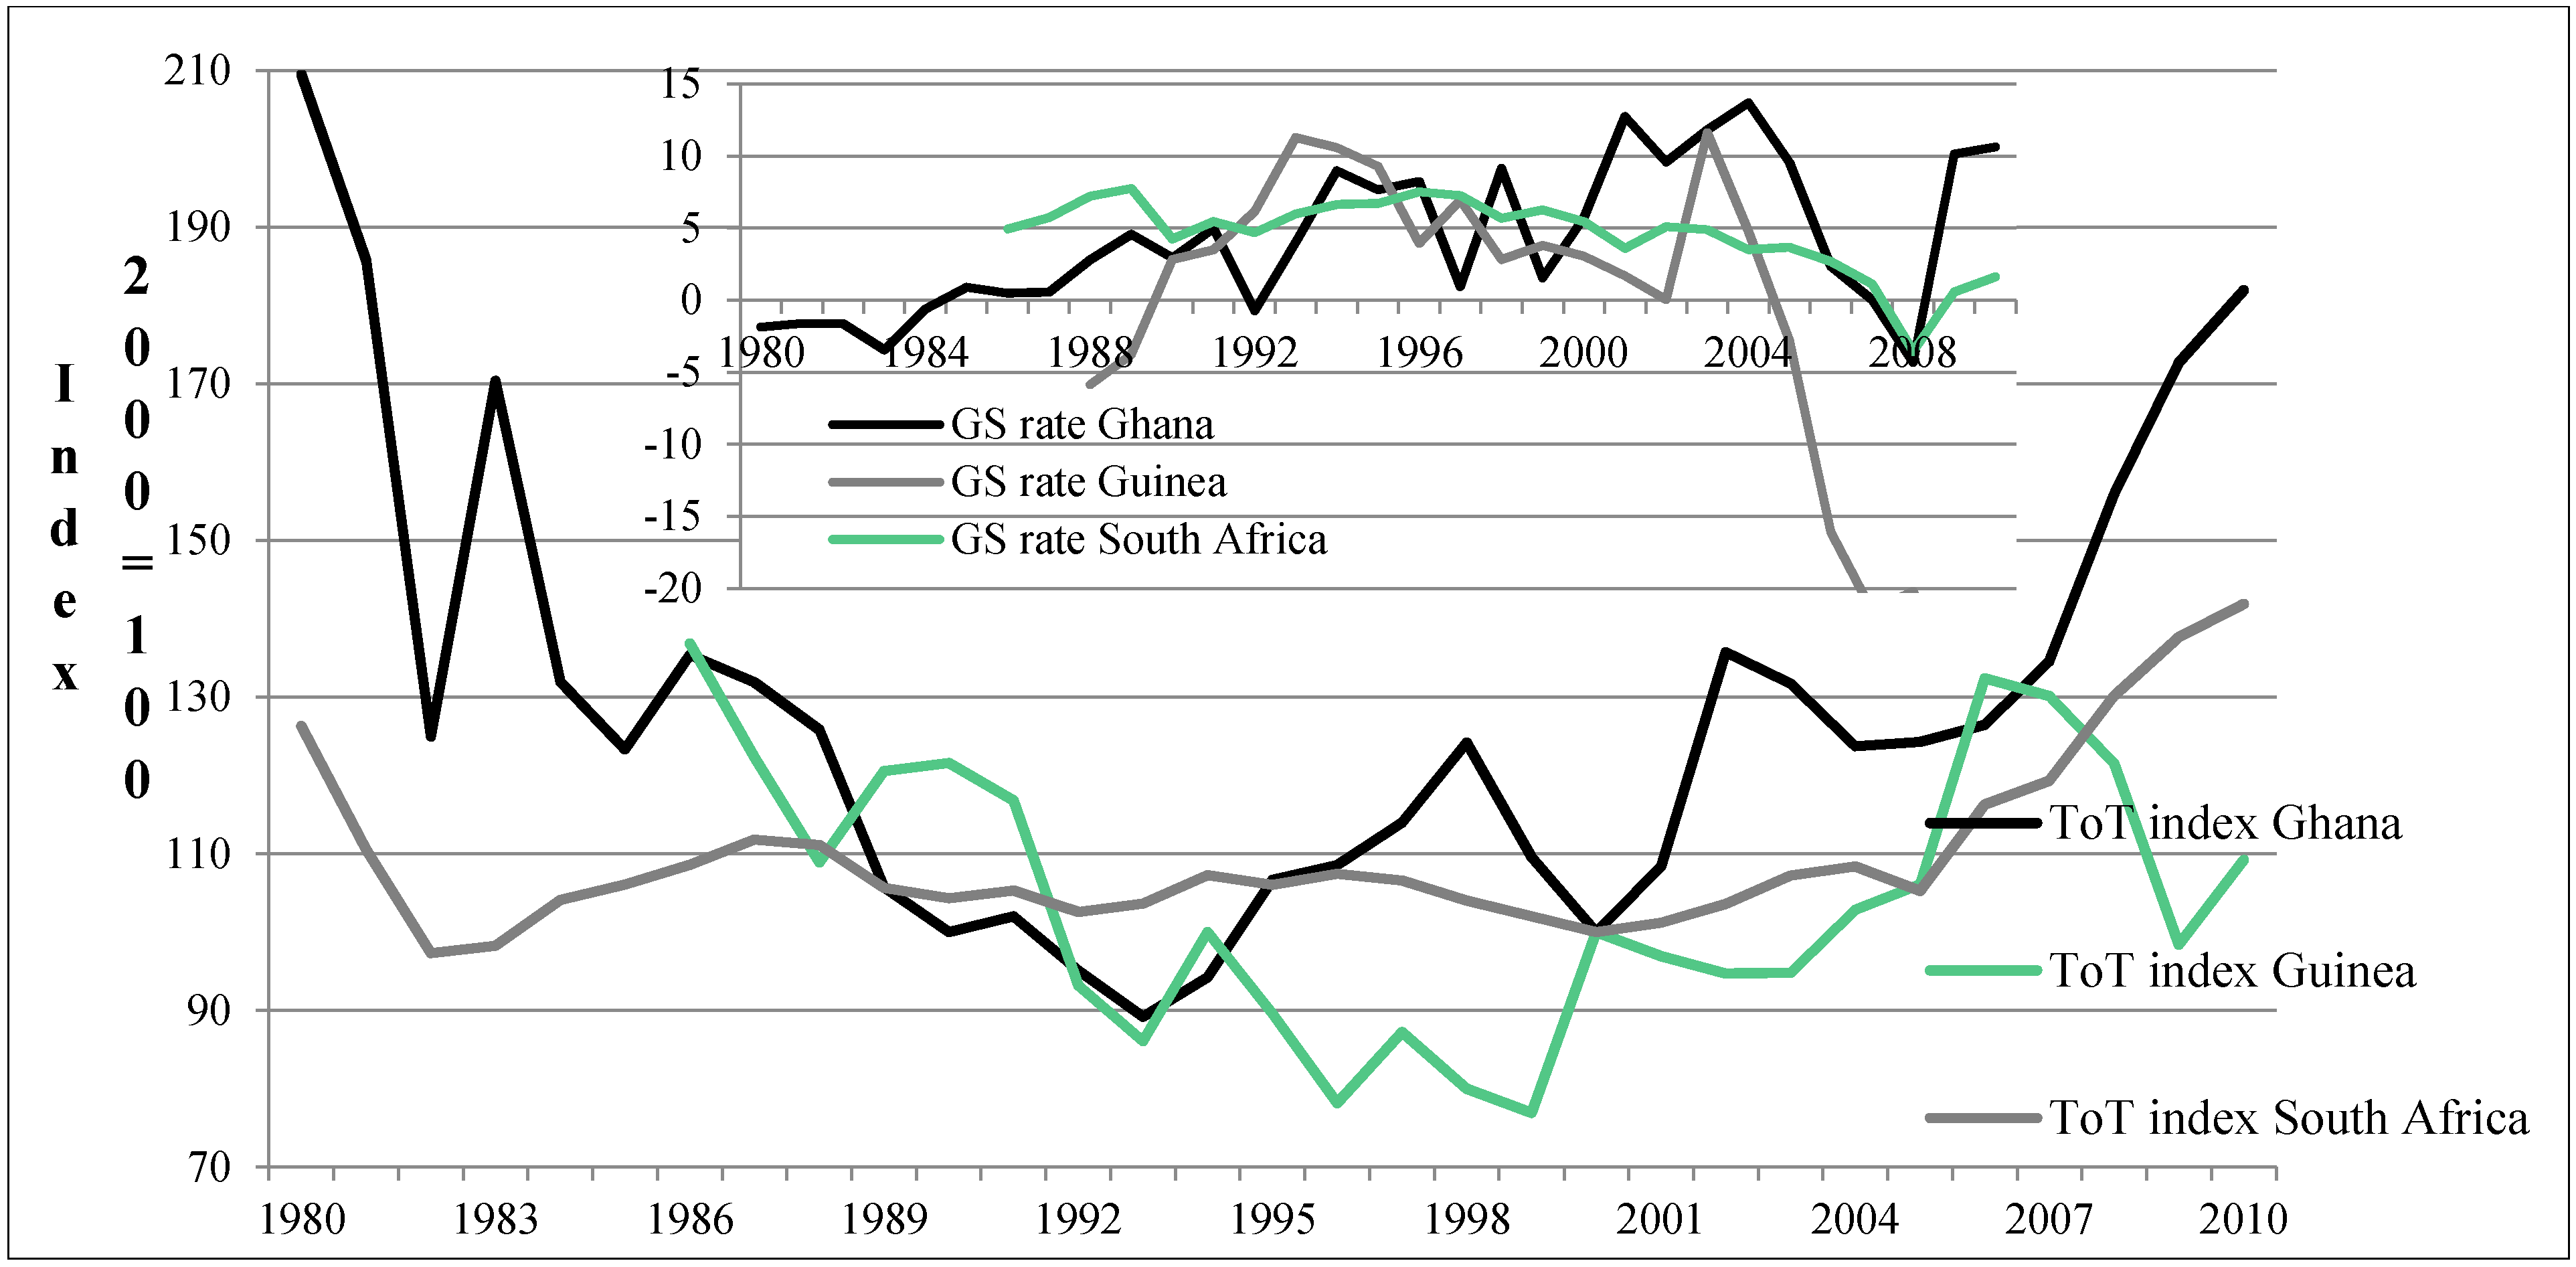
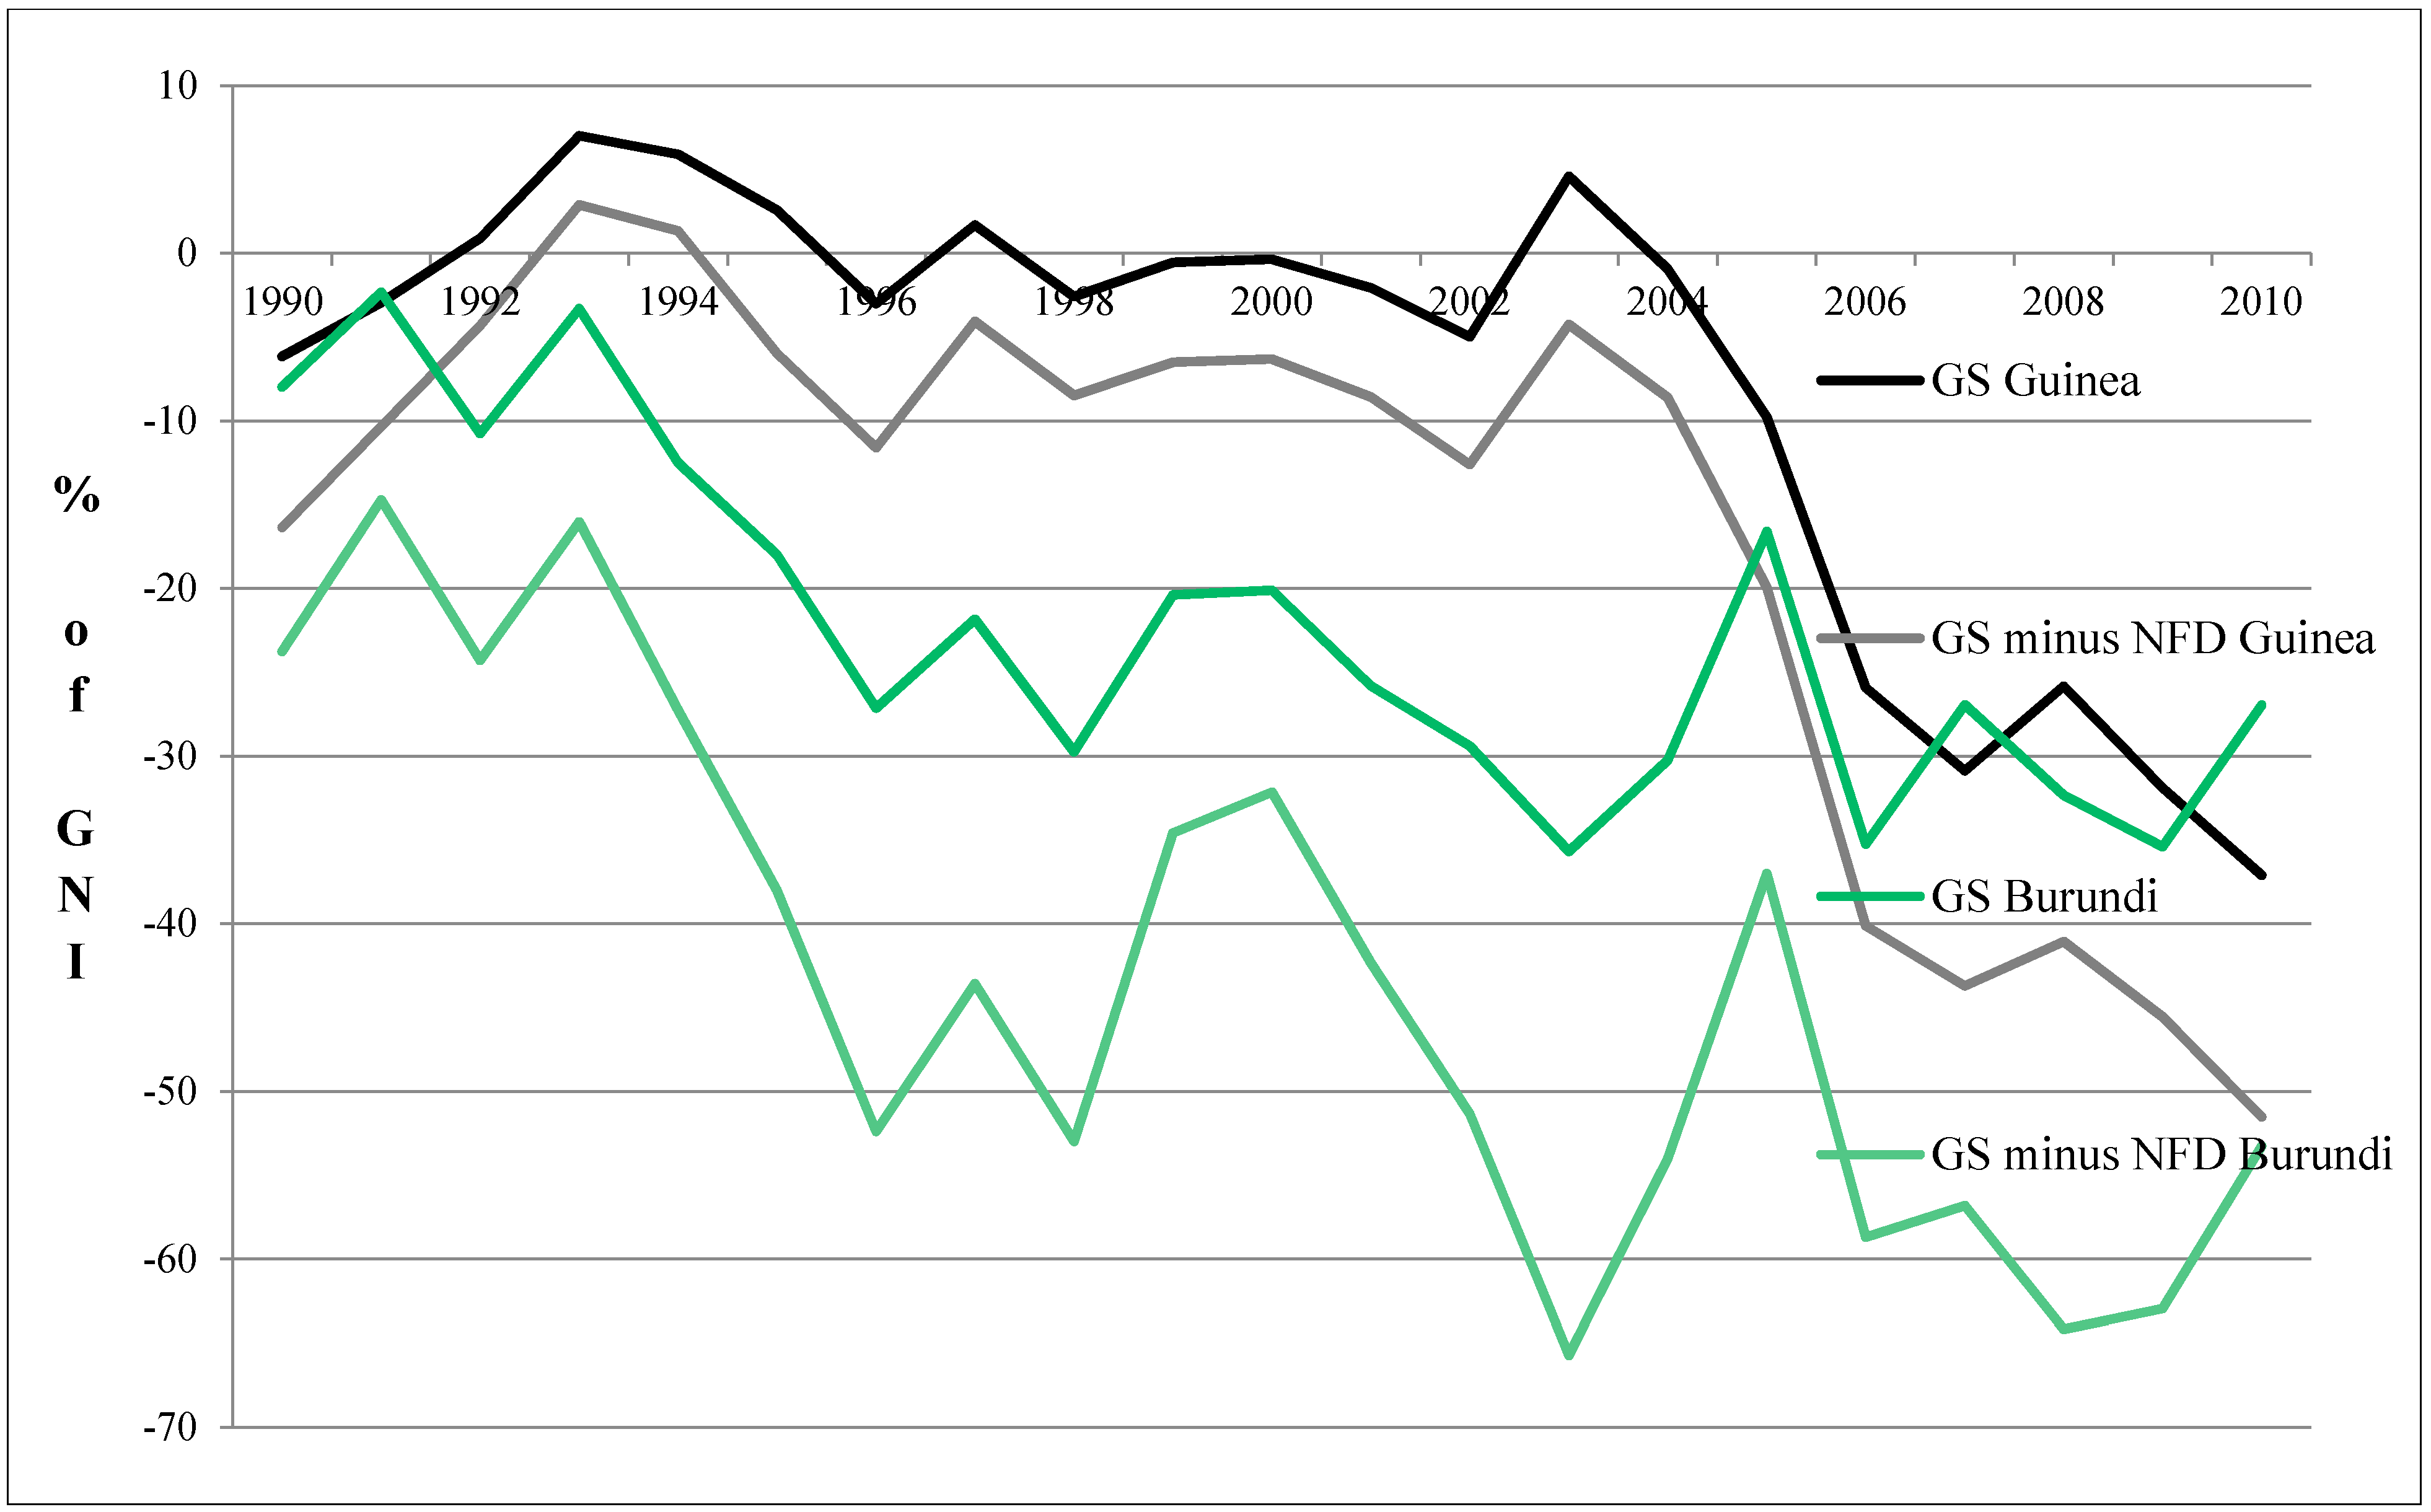
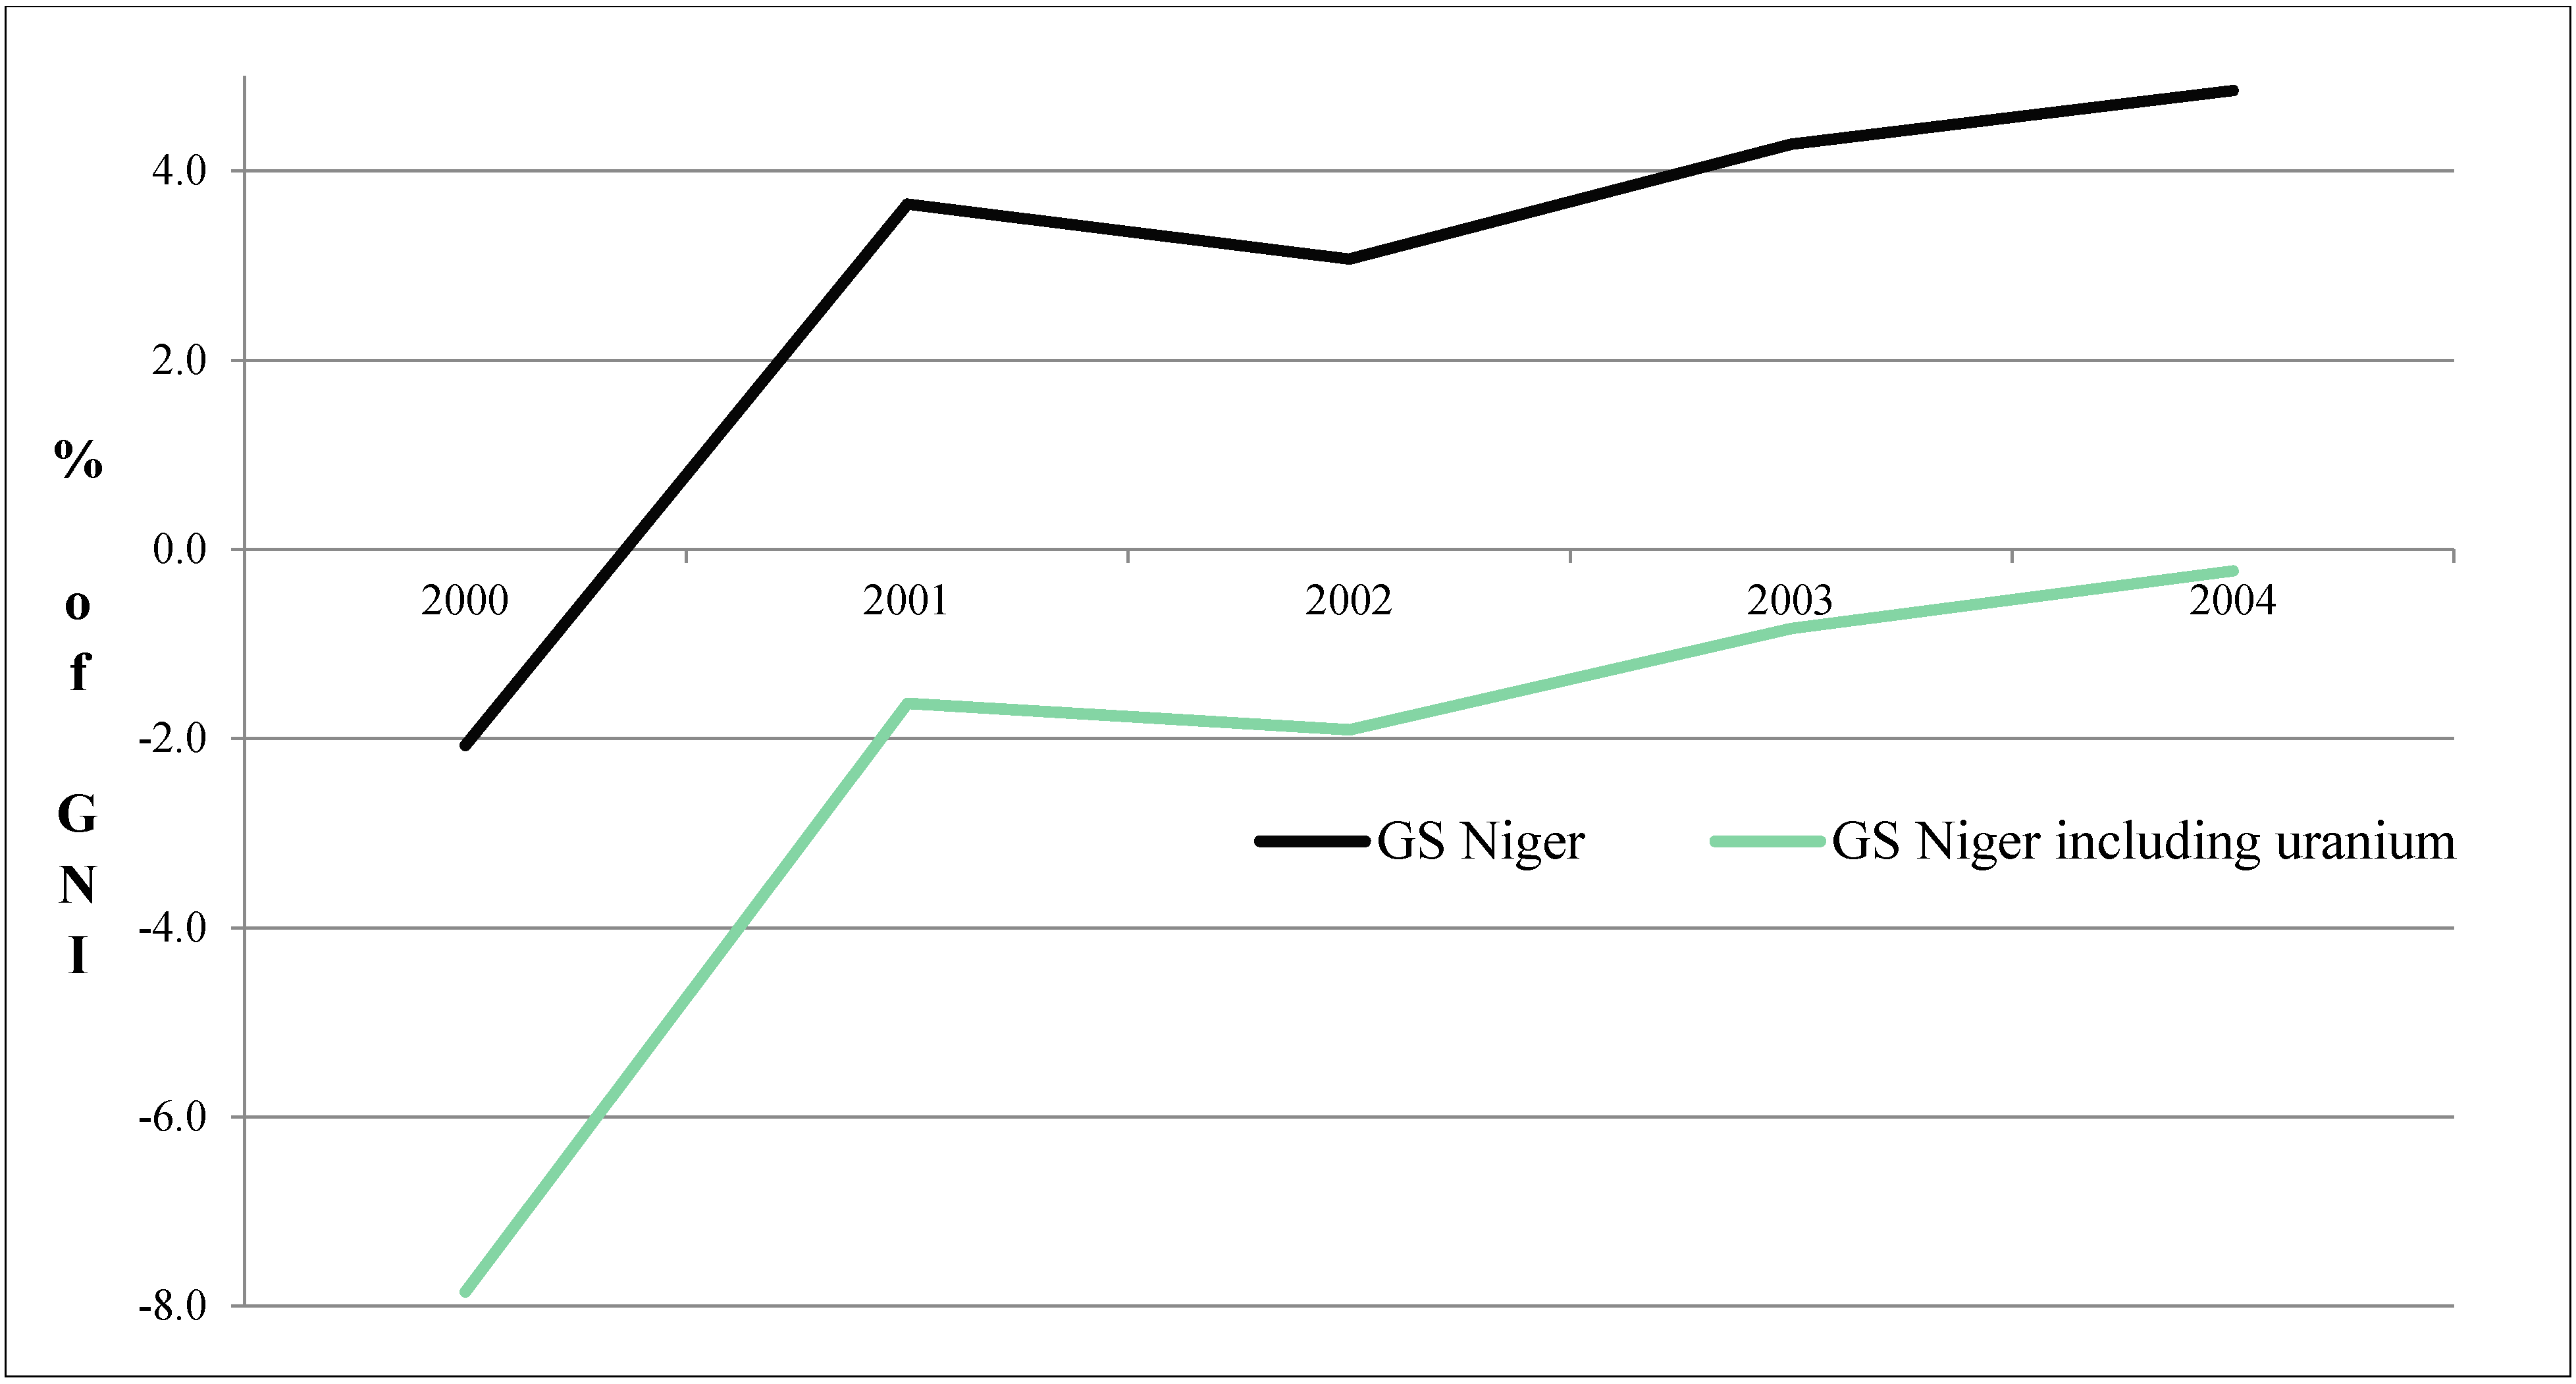
4.3. Open Economies and Volatile Terms of Trade (ToT)

Exogenous shocks to the GS model, such as technological progress or unexpected resource discoveries, change the prices in open economies [2,21]. Especially the effects of changing terms of trade (ToT) influence GS rates immensely; Vincent et al. [79] argue that investment rules for resource-trading countries have to be adjusted by the present-value of anticipated future ToT shifts. The unrealistic assumption of a closed economy in the original “Hartwick rule” is adjusted to open economies and changing prices for resource exports by Asheim [80], Hartwick [28], Sefton and Weale [81] and Vincent et al. [79]. The GS model for open economies is derived in Hamilton et al. [47], Hamilton and Clemens [36] and Neumayer [21].
Variable world market prices change ToT and thereby affect the sustainable level of re-investments: In the model, higher ToT serve to decrease the net saving corrections that resource exporters have to undertake, given that the physical amount of depleted resources results in higher additional income and therefore increases GNI and, besides higher consumption expenditures, also potentially the investment in physical capital [21,47]. Several studies on economic growth in resource-abundant countries, such as Sachs and Warner [82] or Neumayer [83], also show that increasing ToT positively influence a country’s income. The empirical study by Boos and Holm-Müller [84], which includes ToT as an explanatory variable for GS and its components, comes to a contrary conclusion regarding the relationship between ToT and GS rates. Since δKN in Equation (13) is built on rents from natural resource depletion, which rise with higher resource prices, changing ToT influence GS rates substantially and contrary to GNI.
In countries that deplete natural capital, large amounts of income from δKN are primarily obtained through exports, while parts of investment in KP are determined by the demand for imported consumption and capital goods. Independently of whether the ToT of a country develop positively or negatively, they affect the ratio between the depletion of natural capital (δKN) (through exports) and the change in physical capital (δKP) (through the investment in imports). ToT are usually expressed as PX/PM, the price indices for exports and imports, and therefore δKN/δKP change in the same direction as a country’s ToT [84,85].
According to the calculation method in Equation (14), the depletion of natural capital (δKN) is subtracted, with higher rents negatively influencing GS, while reinvestment in physical capital that is higher than its depreciation (δKP) positively influences GS. In total, this means that increasing ToT should affect GS negatively, in contrast to the positive influence on GDP growth noted in Sachs and Warner [82,84,85]. This implies that shares of reinvestment that are higher than consumption in the usage of additional income from increasing prices for the same amount of natural resources could be too small to fulfil the “Hartwick rule”. In summary, increasing resource prices should result in reinvestment at the same level, otherwise it will influence GS negatively (Boos and Holm-Müller [86] show in a case study on Zambia that in this specific example of a copper-dependent country, the increasing world market prices since the mid-2000s result not only in rapidly rising depletion of δKN and therefore rising ToT, but also decreasing GS rates).
Since the ToT effects counterbalance each other on a global scale over a cross-section of countries, I cannot show world averages, but I illustrate, in Figure 1 and Figure 2, the different effects of changing ToT on the GS rates of individual country samples. In Figure 1 I use Bangladesh, China and Singapore as country examples that are extremely dependent on natural resource imports. These countries show clear positive trends of decreasing ToT on GS. As a result, the decline of ToT, at least in these individual cases, is correlated with positive GS rates for resource importers.
Additionally, Figure 2 shows the negative influence of increasing ToT on the GS of Ghana, Guinea and South Africa, which depend on resource exports. In Figure 2 this relationship is not as clear as in Figure 1, but in all six countries the ToT and GS rates are negatively correlated, all with coefficients of more than 0.5, and in two cases surpassing 0.9. Naturally, none of these cases provides definitive proof of a common relationship in all countries over time. However, this seems to support the theoretical argumentation of Boos and Holm-Müller [85] that the ToT of a country have a significant negative influence on its GS rate. Authors such as Vincent et al. [79] or Hamilton et al. [87] recommend the inclusion of the present value of future ToT shifts, but without predictable long-term trends, for now this remains impossible.
Figure 1. GS and ToT in Bangladesh, China and Singapore. (Own calculation and illustration with data from World Bank [53,54]).
Sustainability 07 04146 g001
Figure 2. GS and ToT in Ghana, Guinea and South Africa. (Own calculation and illustration with data from World Bank [53,54]).
Sustainability 07 04146 g002
This shall only serve as an example for a discussion that should be addressed in further research. Especially for resource-dependent countries that export natural and import physical capital a discussion about the relation between these two is important for the calculation of GS. For example, a more detailed examination of the relationship between the determinants held responsible for the so-called Resource Curse and the GS rates of resource-dependent countries could support this discussion (see for example [84,85,86]).
However, the most important problem for these economies and especially their decision makers is the extreme volatility of world market prices of natural resources and the resulting uncertainties of future prices, and therefore the cost of resource imports and, especially, income from exports. According to Neumayer [21] and Boos and Holm-Müller [84,85], problems typically arise if countries assume future rising prices and fail to anticipate or prepare for future unanticipated shocks and significant drops in international resource prices. Figure 3 shows with the example of Zambia, one of the world’s last examples of a country suffering from the so-called Resource Curse according to Haber and Menaldo [88], how the mineral depletion within δKN in Equation (14) develops almost parallel to world copper prices, Zambia’s largest income source. Uncertainties that influence future investment planning are extremely high due to these volatile prices, which therefore result in similarly volatile GS rates that hinder a long-term consideration of “weak” sustainability.
The World Bank could avoid these problematic effects in the calculation of GS at least partly by using average world market prices over more than one year, as shown for the Zambian example in the embedded chart in Figure 3. I use five-year averages and, as one can see, this preserves the long-term trends of Zambia’s copper depletion but flattens δKN within the GS calculation in Equation (14). The actual calculation of rents through world market prices in Equations (12) and (13) is theoretically a sound way to ascribe a value to depleted natural resources. In a situation such as that of Zambia or other examples such as Saudi Arabia, with dependency levels of more than 40% of their GNI from natural resource exports, such price volatilities also result in volatile δKN and GS rates. Using averages could at least partially avoid this problematic and bring prices nearer to the real long-term value of depleted natural capital. Spikes or drops would change GS rates less rapidly and show a more realistic picture of the “weak” sustainability of re-investments.
Figure 3. World copper prices and the mineral depletion of Zambia. (Own calculation and illustration with data from World Bank [53,54]).
Sustainability 07 04146 g003
Additionally, literature typically discusses whether it is fair to attribute the depreciation of natural resources completely to the resource exporters-which have mainly negative GS-without including an adjustment mechanism. Proops et al. [89] show that GS rates change completely if resource exploitation was attributed to the countries that consume the natural resources and not to those that produce them. It is true that resource importers could therefore maintain a constant level of capital stock at the expense of resource exporters.
However, GS is not an indicator for the responsibility of natural capital depreciation but rather one which shows how the capital stock of a country is changing. In their own interest countries endowed with rich resource stocks should re-invest their rents sustainably to fulfil the “Hartwick rule” and maintain a constant capital stock by using income from responsible users [21]. Nonetheless, I discuss this topic in the section on damages from emissions, as there are different opinions on the inclusion of cross-border emissions as a negative contribution to the capital stock.

4.4. Gross National Savings (GNS)

4.4.1. Consumption versus Investment

As the first step of the GS calculation, GNS in Equation (9) subtracts total consumption from the capital stock of a country, leaving mainly investment in physical capital δKP, as can be seen in Equations (7) and (8). However, as a point usually not discussed in GS literature, authors such as Daly and Cobb [90] or Cobb and Cobb [91], Stockhammer et al. [92] or Castaneda [93] argue in the discussion of the Index of Sustainable Economic Welfare (ISEW) that durable consumption goods such as cars or furniture also increase the physical capital stock [94,95,96]. Especially durable goods such as refrigerators in equatorial regions or buses in regions without public transportation function at least partly as investment in social welfare.
Naturally, the discussion regarding which consumption expenses should be considered an investment is daunting, and a long-term theoretical discussion should be based on a systematic survey of durable consumption goods. Contrarily, there are also considerations as to whether similar amounts from the already included investments in KP are so-called “white elephants”, namely investment projects with negative social costs [97]. Since this paper does not aim to discuss traditional national accounts or the definition of consumption itself, I recommend a discussion concerning the parts of consumption that could be considered investments that back sustainable development on the one hand, and those which could be seen as strictly detrimental on the other hand.
In Figure 4, I show that the considered fixed share of 10% from consumption for investment by Daly and Cobb [90] makes a considerable difference in total world aggregates; even a 5% portion of consumption expenditures allocated to investments shows an observable difference in the sum of world GS rates. A sensitivity analysis showed that these differences are not as large for individual countries, but the difference is especially immense for the developed and generally not resource exporting regions North America and Europe (as well as Central Asia). Figure 5 shows that the inclusion of 10% of consumption expenses in investment increases the total GS rates in both regions by more than 7%.
Figure 4. World GS rates including investment in durable goods. (Own calculation and illustration with data from World Bank [53,54]).
Sustainability 07 04146 g004
Figure 5. GS rates Europe and North America including investment in durable goods. (Own calculation and illustration with data from World Bank [53,54]).
Sustainability 07 04146 g005

4.4.2. Net Current Transfers (NCT)

Among other factors, net current transfers in Equation (9) include all forms of income exchange between countries without repayment, such as aid or remittances from migrants not only employed in another economy but also considered residents there. It is disputable whether the inclusion of aid or remittances into a county’s capital stock can be seen as providing a contribution to its sustainable development. In principal, this increases the capital stock and could partly be seen as quid quo pro from net importers of natural resources. However, aid weakens macroeconomic and public expenditure policies through windfalls that are not tied to economic performance, while investments are often earmarked for projects and could therefore be invested in sectors that crowd out more important investments [37,97]. However, the global average difference between GS with or without aid lies at only approximately 0.3% over the last three decades.
López-Córdova and Olmedo [98] provide a detailed overview of the developmental impacts of international migrant remittances that are proven to show a positive effect on private investments, especially in human capital [42]. However, it is argued that remittances are produced by emigrants who remove human capital from their respective country’s stock. These migrants use their human capital more gainfully, which results in private investments in either physical or human capital.
Therefore, it is difficult to distinguish between sustainable and unsustainable portions of remittances within the GS rates of a country. Nonetheless, remittances—142 countries are net receivers—are an important source of foreign income. This seems especially dramatic in countries such as Jamaica (where remittances comprise more than 70% of the total value of GS rates between 1990 and 2009), Lebanon (65%), or Lesotho (more than 90%). Since remittances increase GS rates and could be used for investment, they influence “weak” SD either positively or negatively. However, Boos and Holm-Müller [84] show in a cross-country analysis a highly significant positive relationship between remittances and investment in physical capital, as well as the total GS rates of those countries. The example of remittances shows the need for more discussion on the contents of net current transfers (NCT). The contents of NCT should be examined in more detail, especially for most developing countries, to discuss whether these are individually contributing to “weak” sustainability or not.

4.5. Net National Savings

4.5.1. Depreciation of Physical Capital

The depreciation of physical capital or consumption of fixed capital (CFC), as defined in the “Handbook of National Accounting” [99], is a normal cost of production, namely the decline in the stock of physical (fixed) capital (assets). Using a perpetual inventory method (PIM), CFC is calculated as “the difference between successive real market values of an asset over its lifetime” [100]. The PIM is recommended by the UN over the typical “depreciation used in business accounting in order to come closer to the actual cost of fixed capital used in production” [101] by adjusting for inflation.
However, the PIM raises the same critique as business depreciation, since it assumes on the one hand constant depreciation rates and on the other that every investment is productive [47,78]. Both assumptions can be criticized since the consumption of physical capital in reality is not constant and not all capital goods are productive or even good for the physical capital stock. One example can be seen in so-called “white elephants”, investment projects with negative social surplus but sinecures for certain interest groups [97]. Improvements to both categories are difficult, especially the quantification of investment quality, but one way around this problem is at least to discuss the possible unsustainability of investments, such as in military infrastructure.

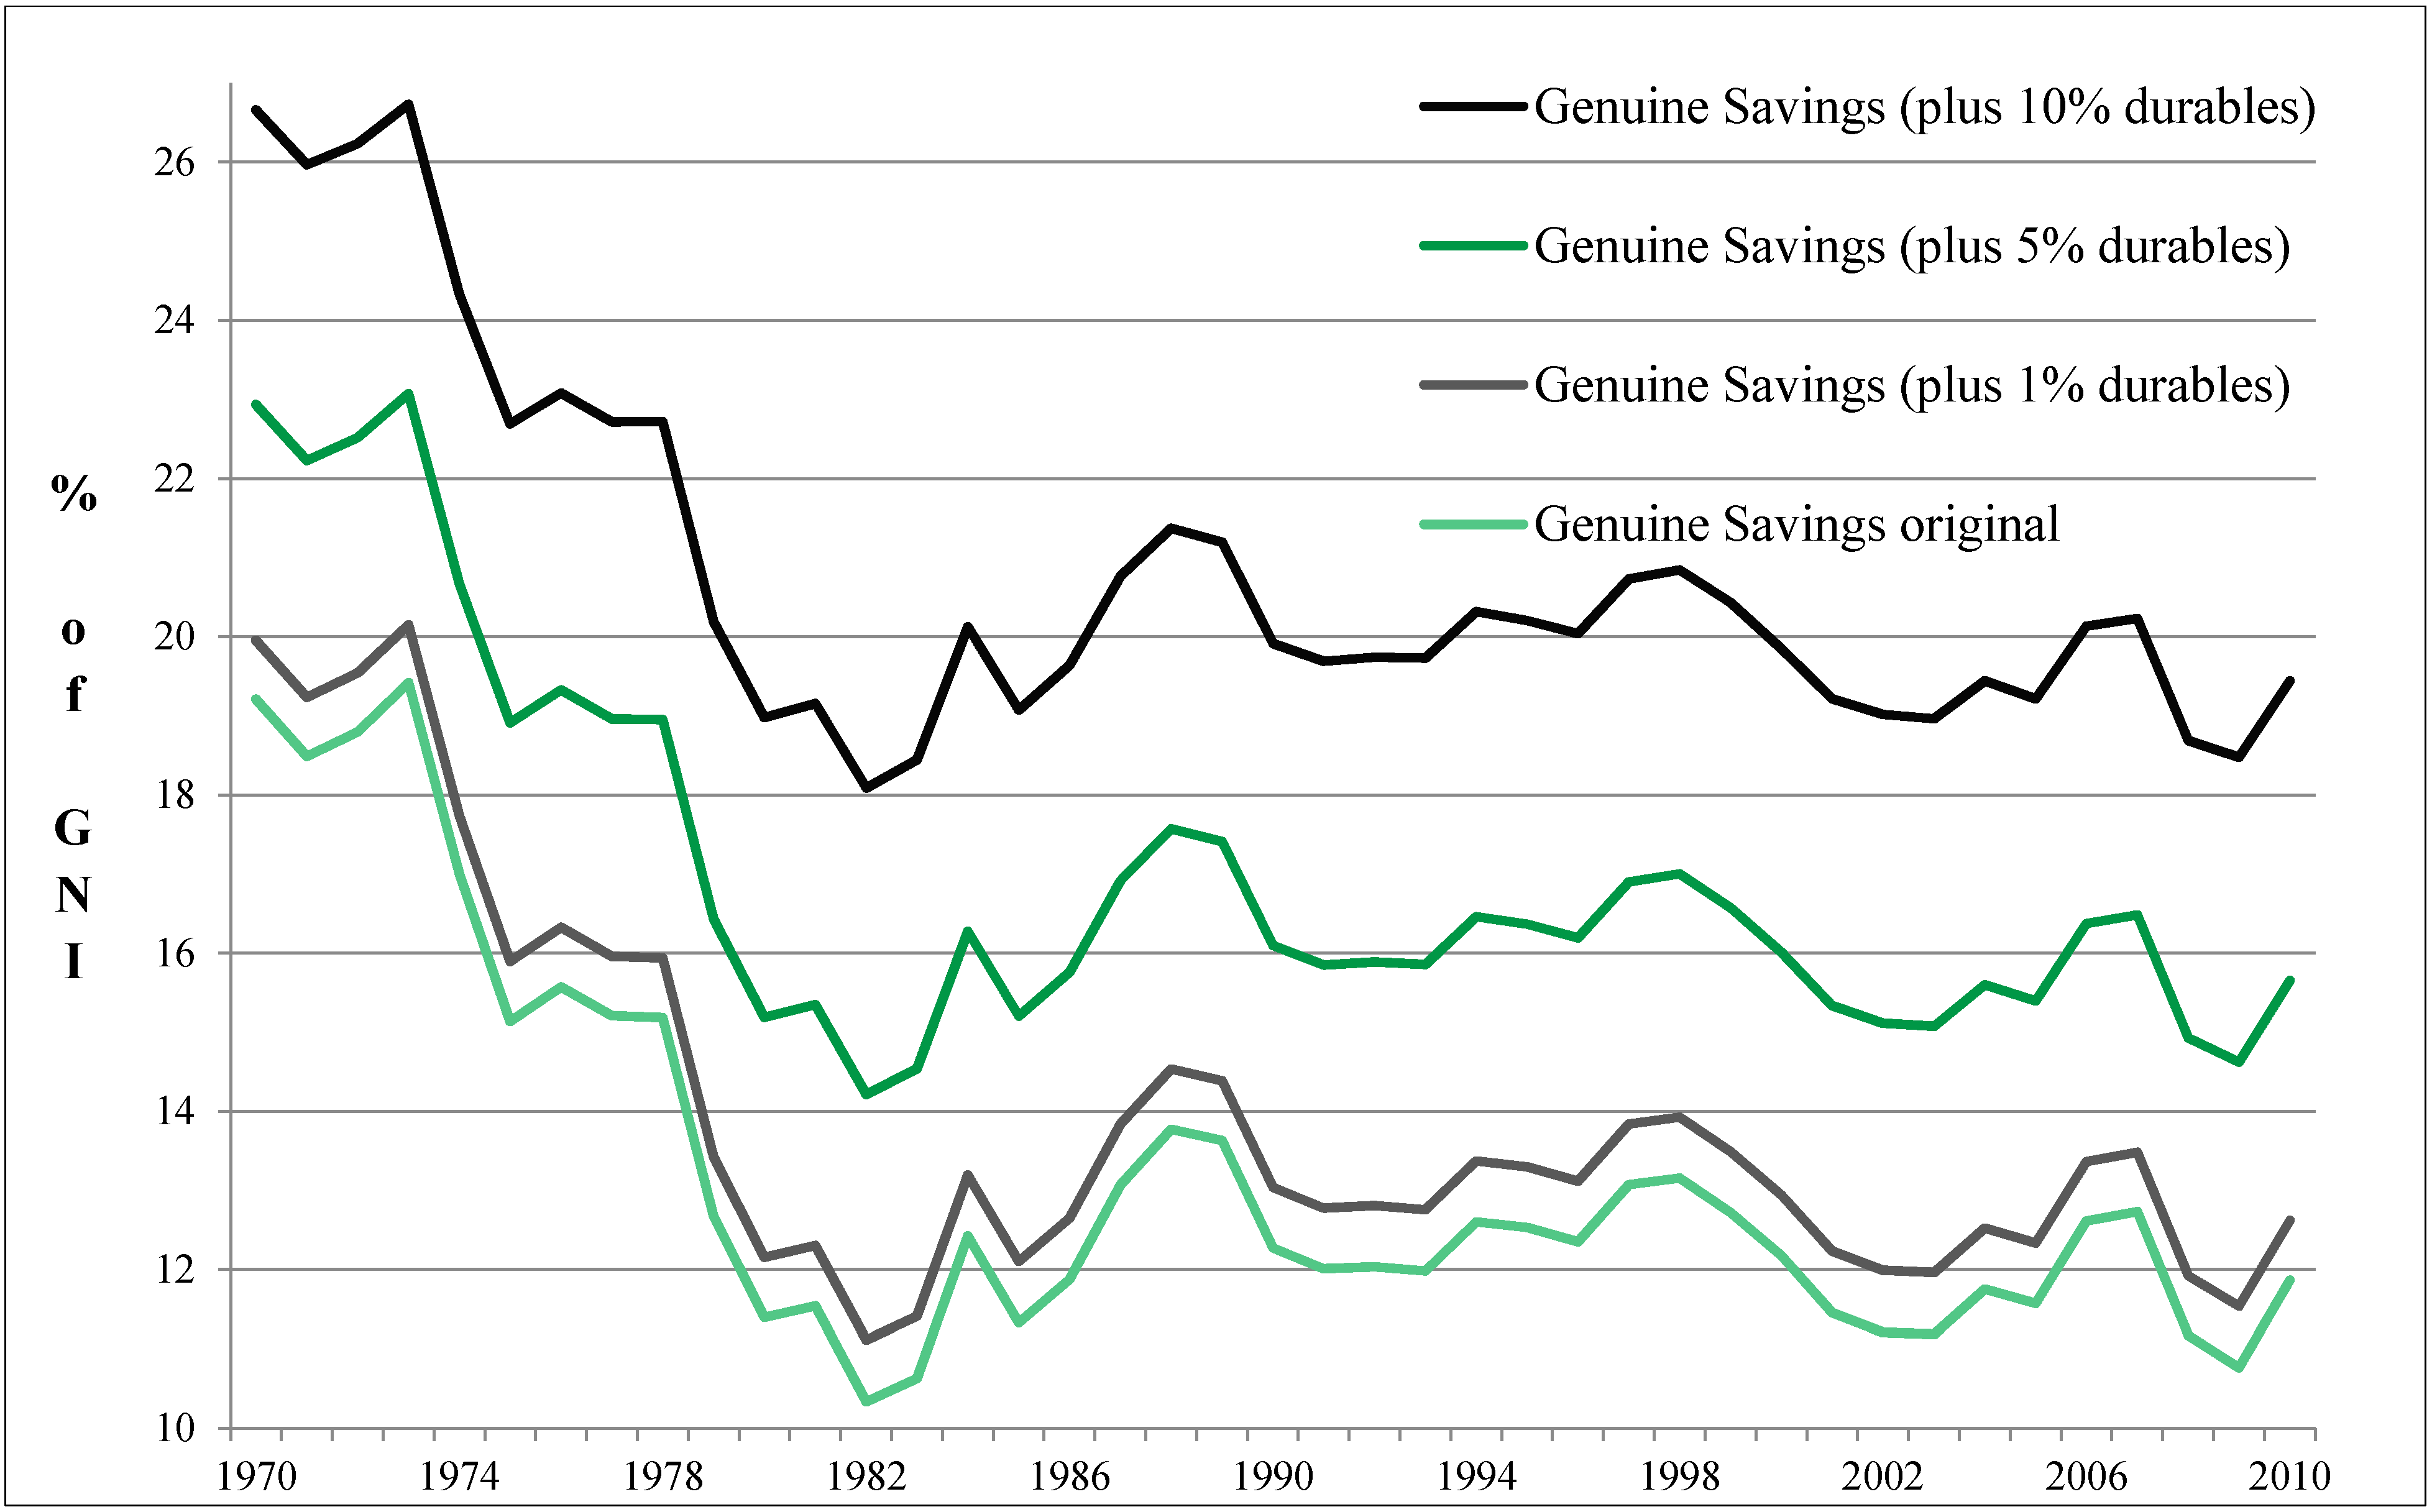
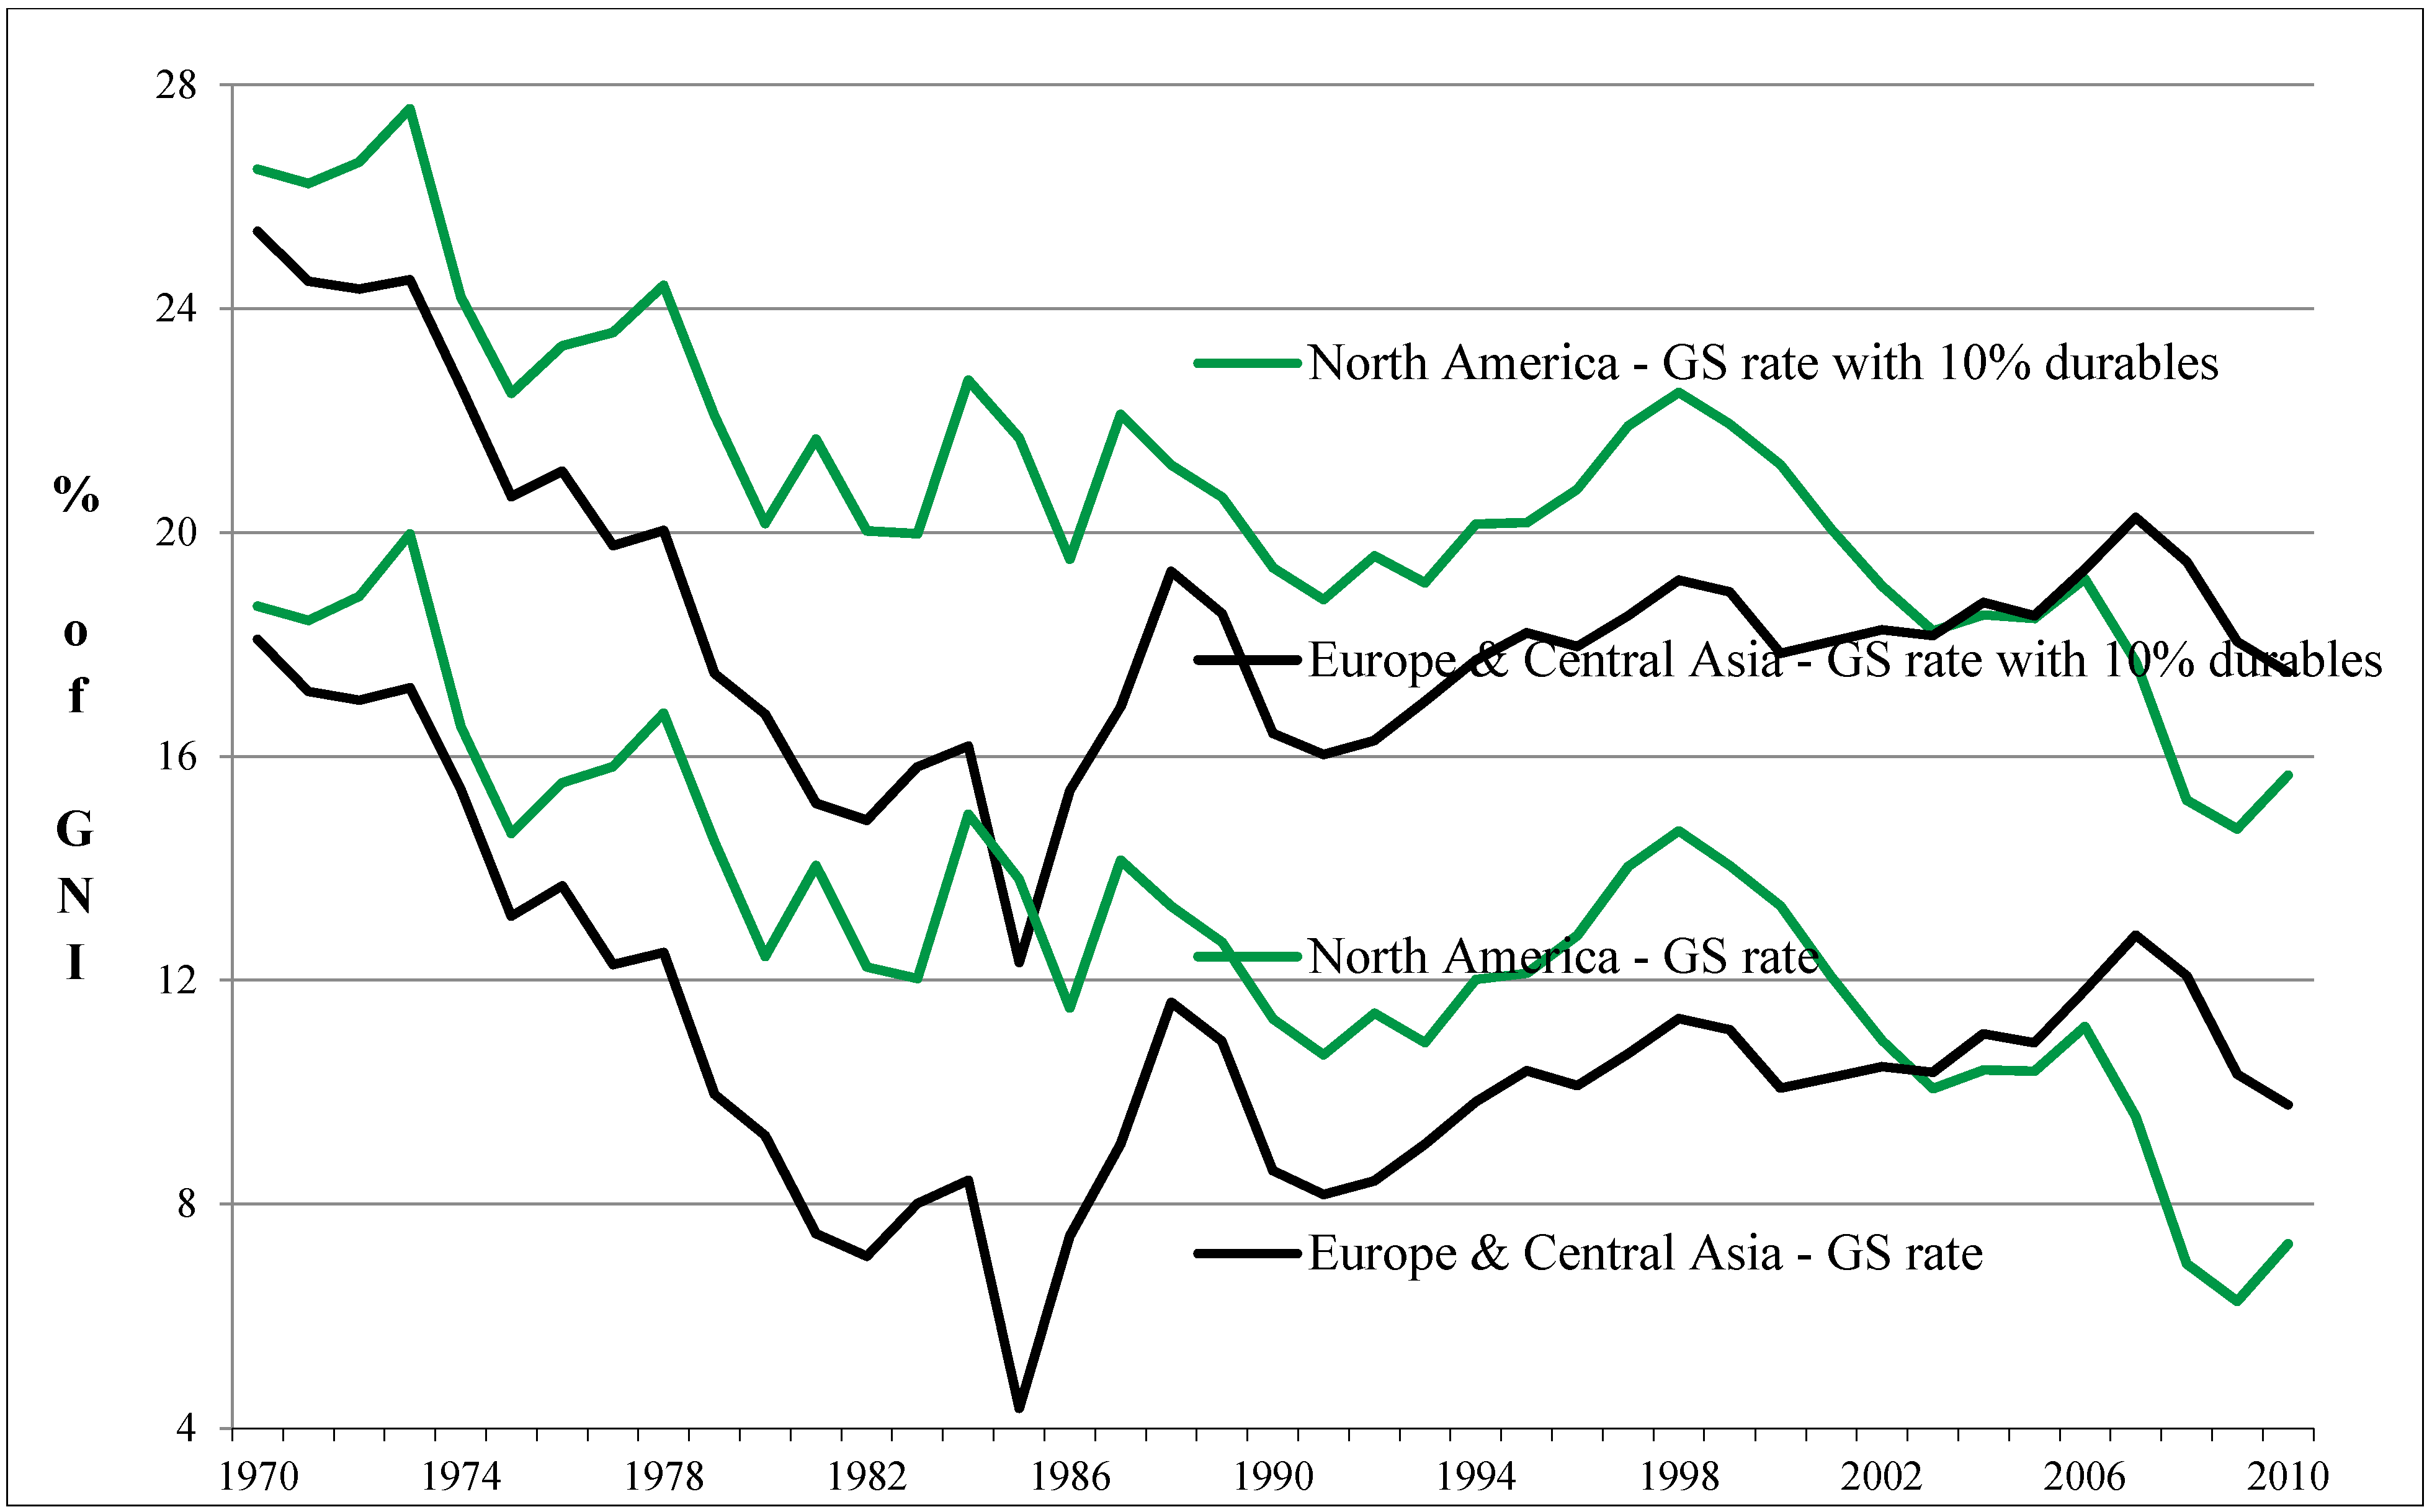
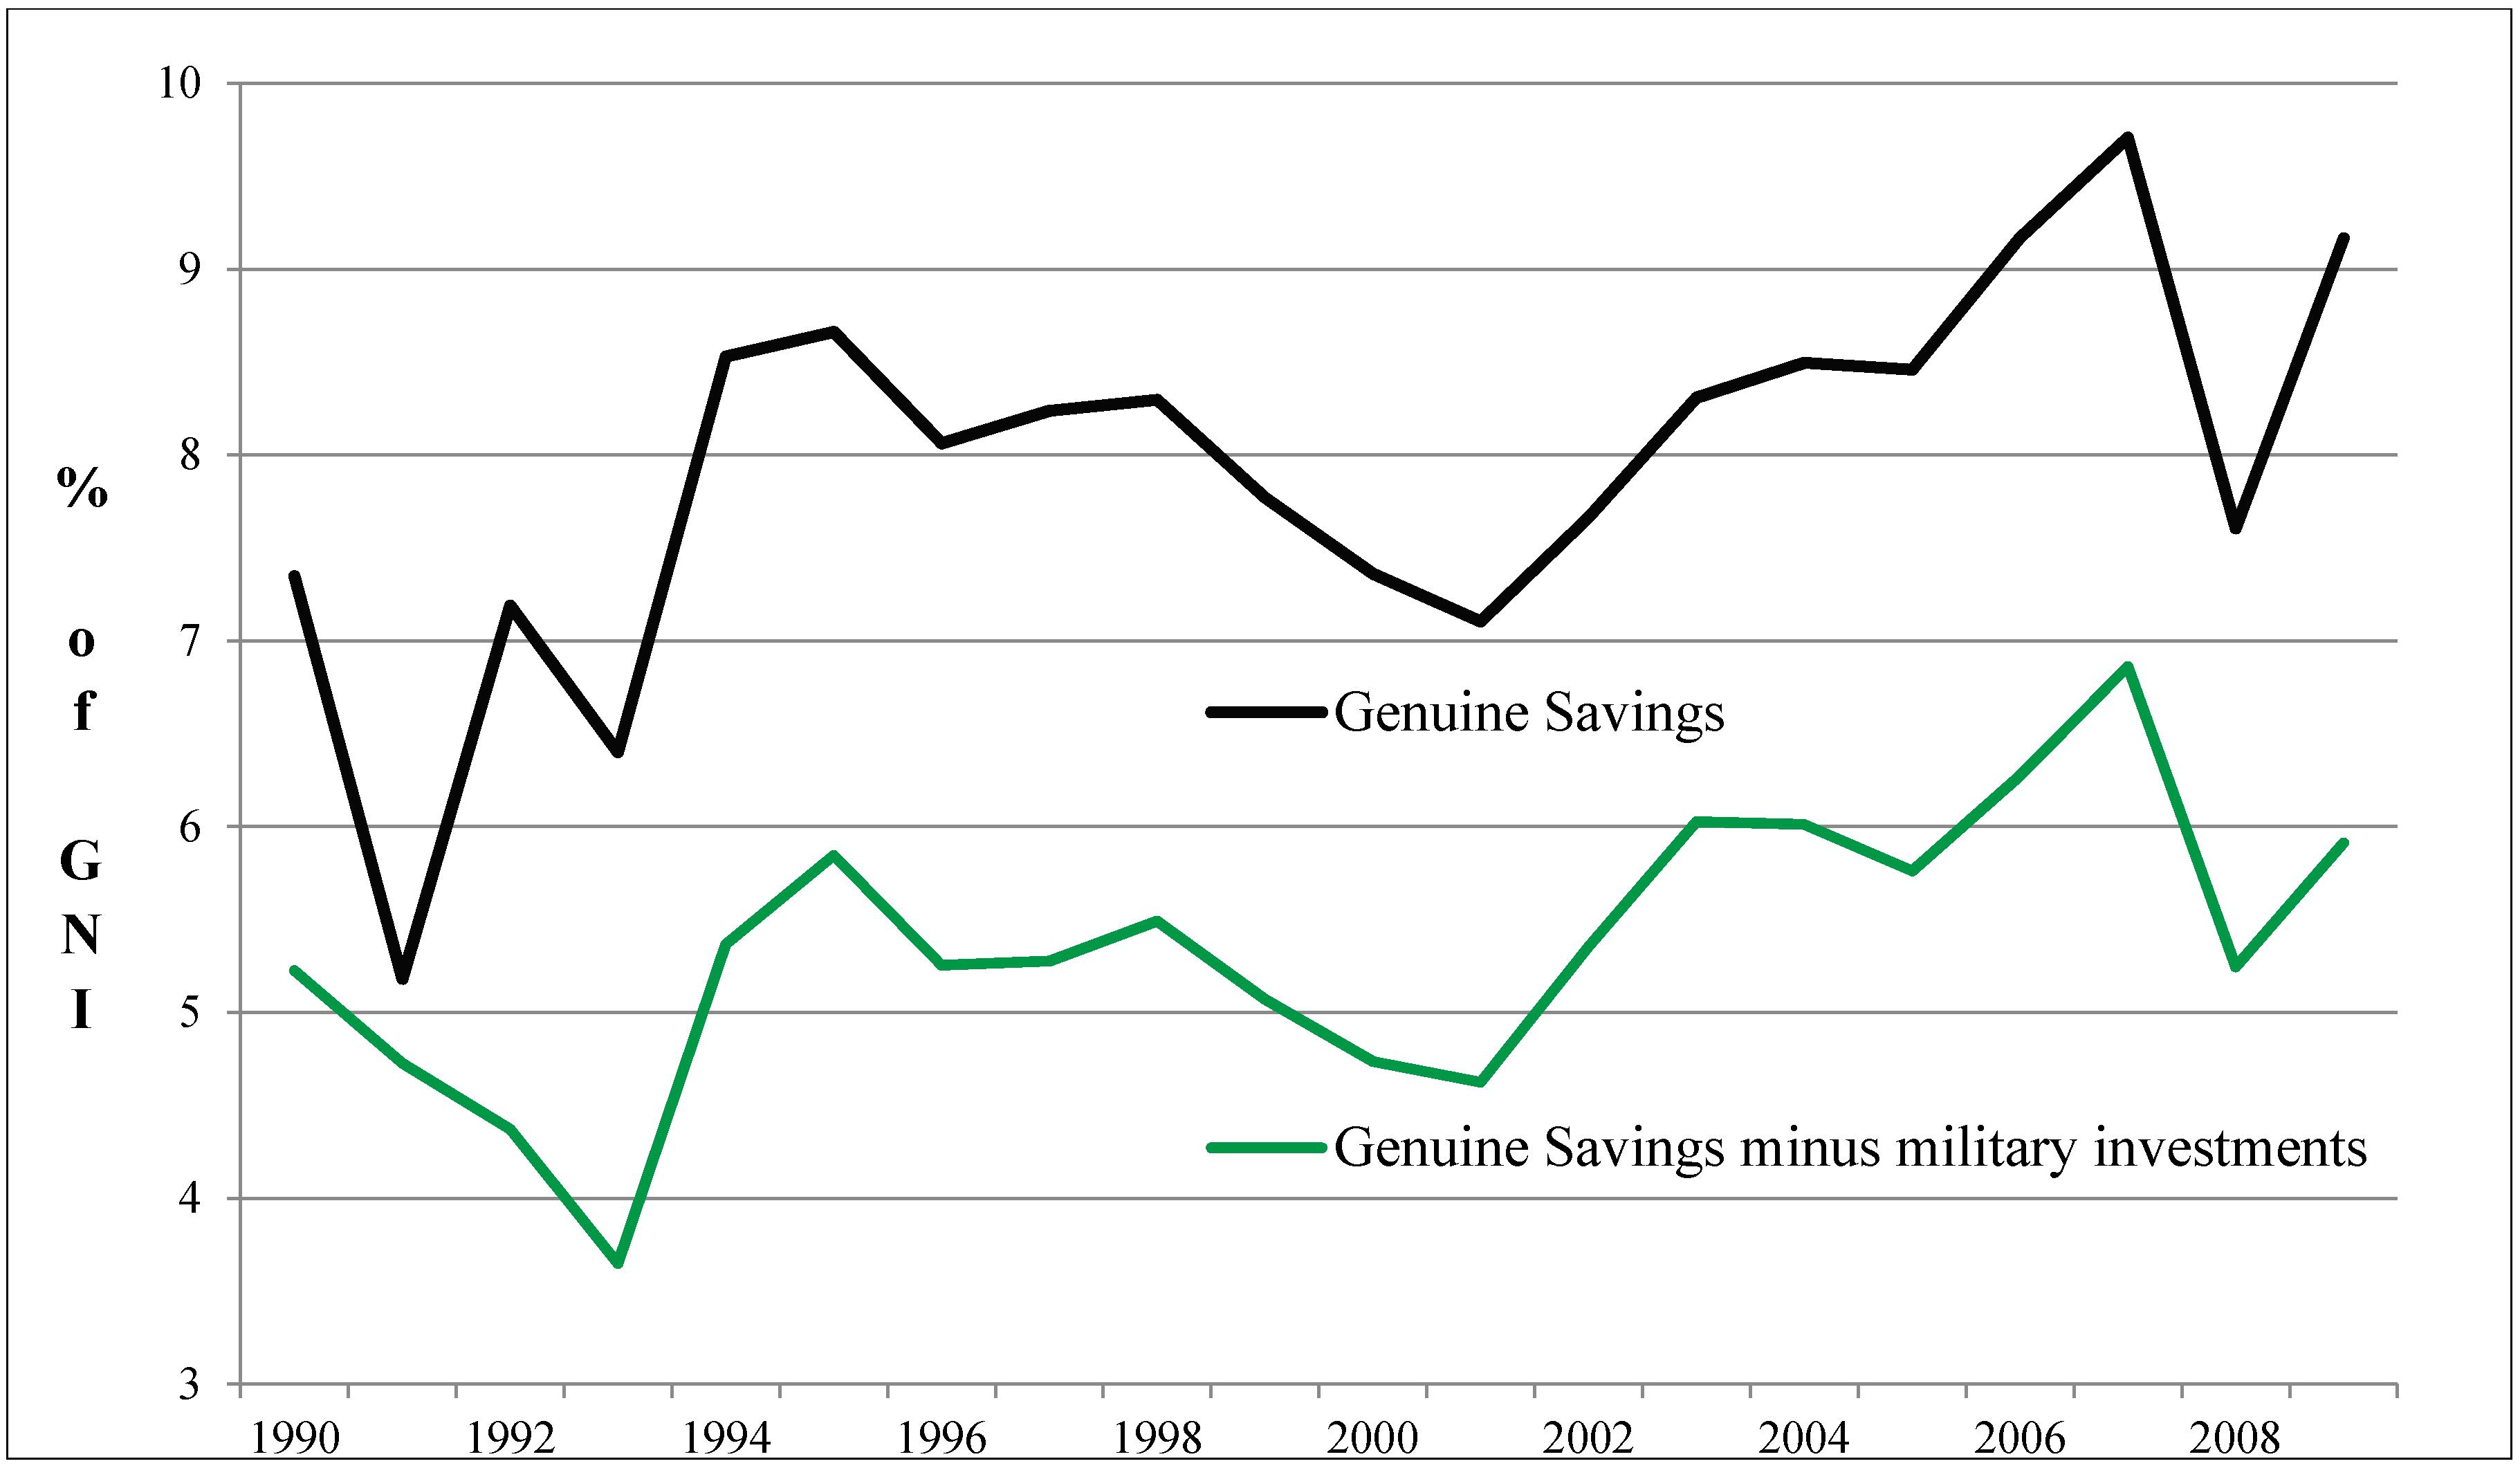
4.5.2. Defensive Investments

Other indices for sustainable development, such as the Index for Sustainable Economic Welfare (ISEW), exclude investments in physical capital that are used for defensive expenditures such as household pollution abatement costs, as well as the cost of car accidents, underemployment, or crime [95]. A clear definition of defensive expenditures does not exist; early studies even exclude parts of education [102] or health expenditures [91] as defensive and not improving a country’s welfare. A definition of defensive expenditures first published by Daly and Cobb [90]—expenditures that defend a population against externalities from production—does not exactly define what this means, therefore any consumption or capital good could be defensive [21].
As a result, I do not follow this definition or the discussion in ISEW literature regarding which expenses should be deducted at what level [94]. In a discussion of GS I have the advantage that consumption is already eliminated, leaving only defensive investments to consider. Investments such as those for combatting crime are still disputed and have to be clearly defined to determine the respective data from national accounts. Furthermore, depending on the region, investments in jails could be as important to sustainable development as other investments.
Figure 6 shows the change in global GS rates between 1990 and 2009 if investments in the development of military equipment, buildings and the like are deducted by allocating 10% of total military expenditures to investment, as is done in the GS calculation for education expenditures. It is rather interesting that GS decreases globally by 2.7% (of GNI) for this period if this 10% military investment is deducted. Conversely, this means that more than one third of NNS in Equation (10)—interpreted as investments in physical capital—in the global average GS from 1990 until 2009 was determined by military investments (average GS of 7.9% of GNI compared to military investment of 2.7%). However, the contribution of military investment to the SD of a country is a mere political or philosophical discussion. Its economic dimension requires further research together with other potential defensive investments, especially considering its significant contribution to the global average of GS.
Figure 6. GS excluding military investments between 1990 and 2009 (world average). (Own calculation and illustration with data from World Bank [53,54]).
Sustainability 07 04146 g006

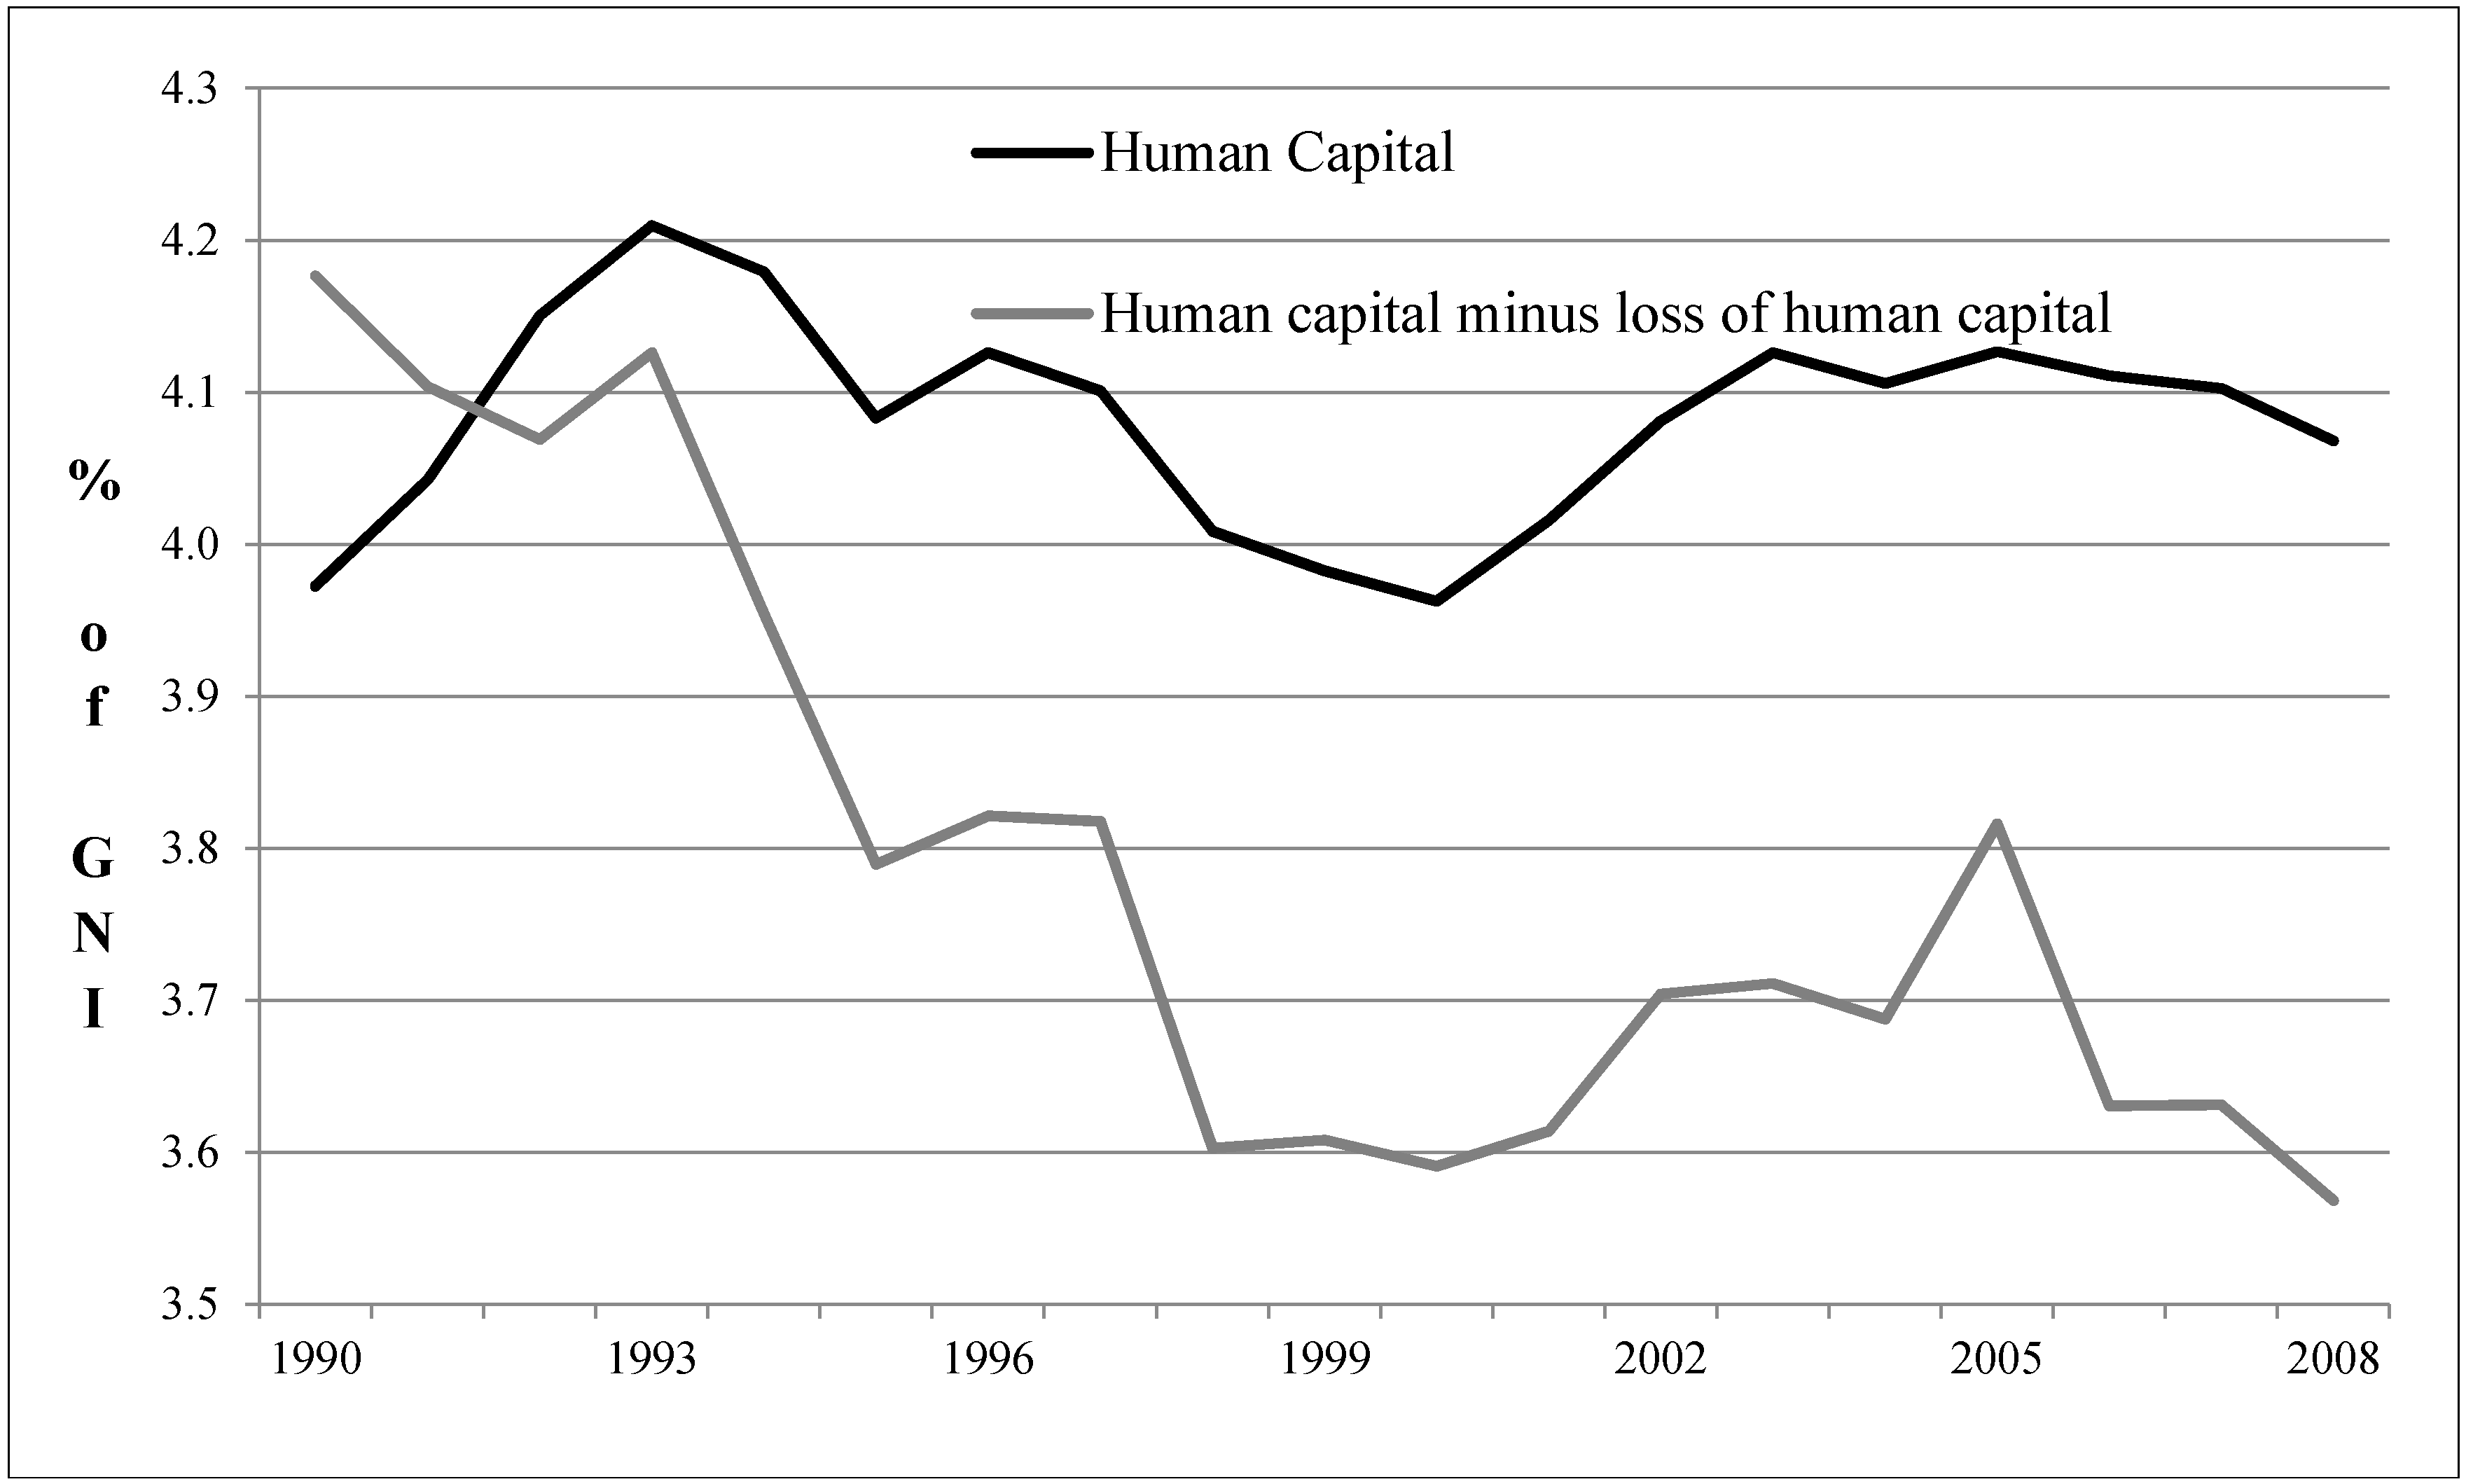
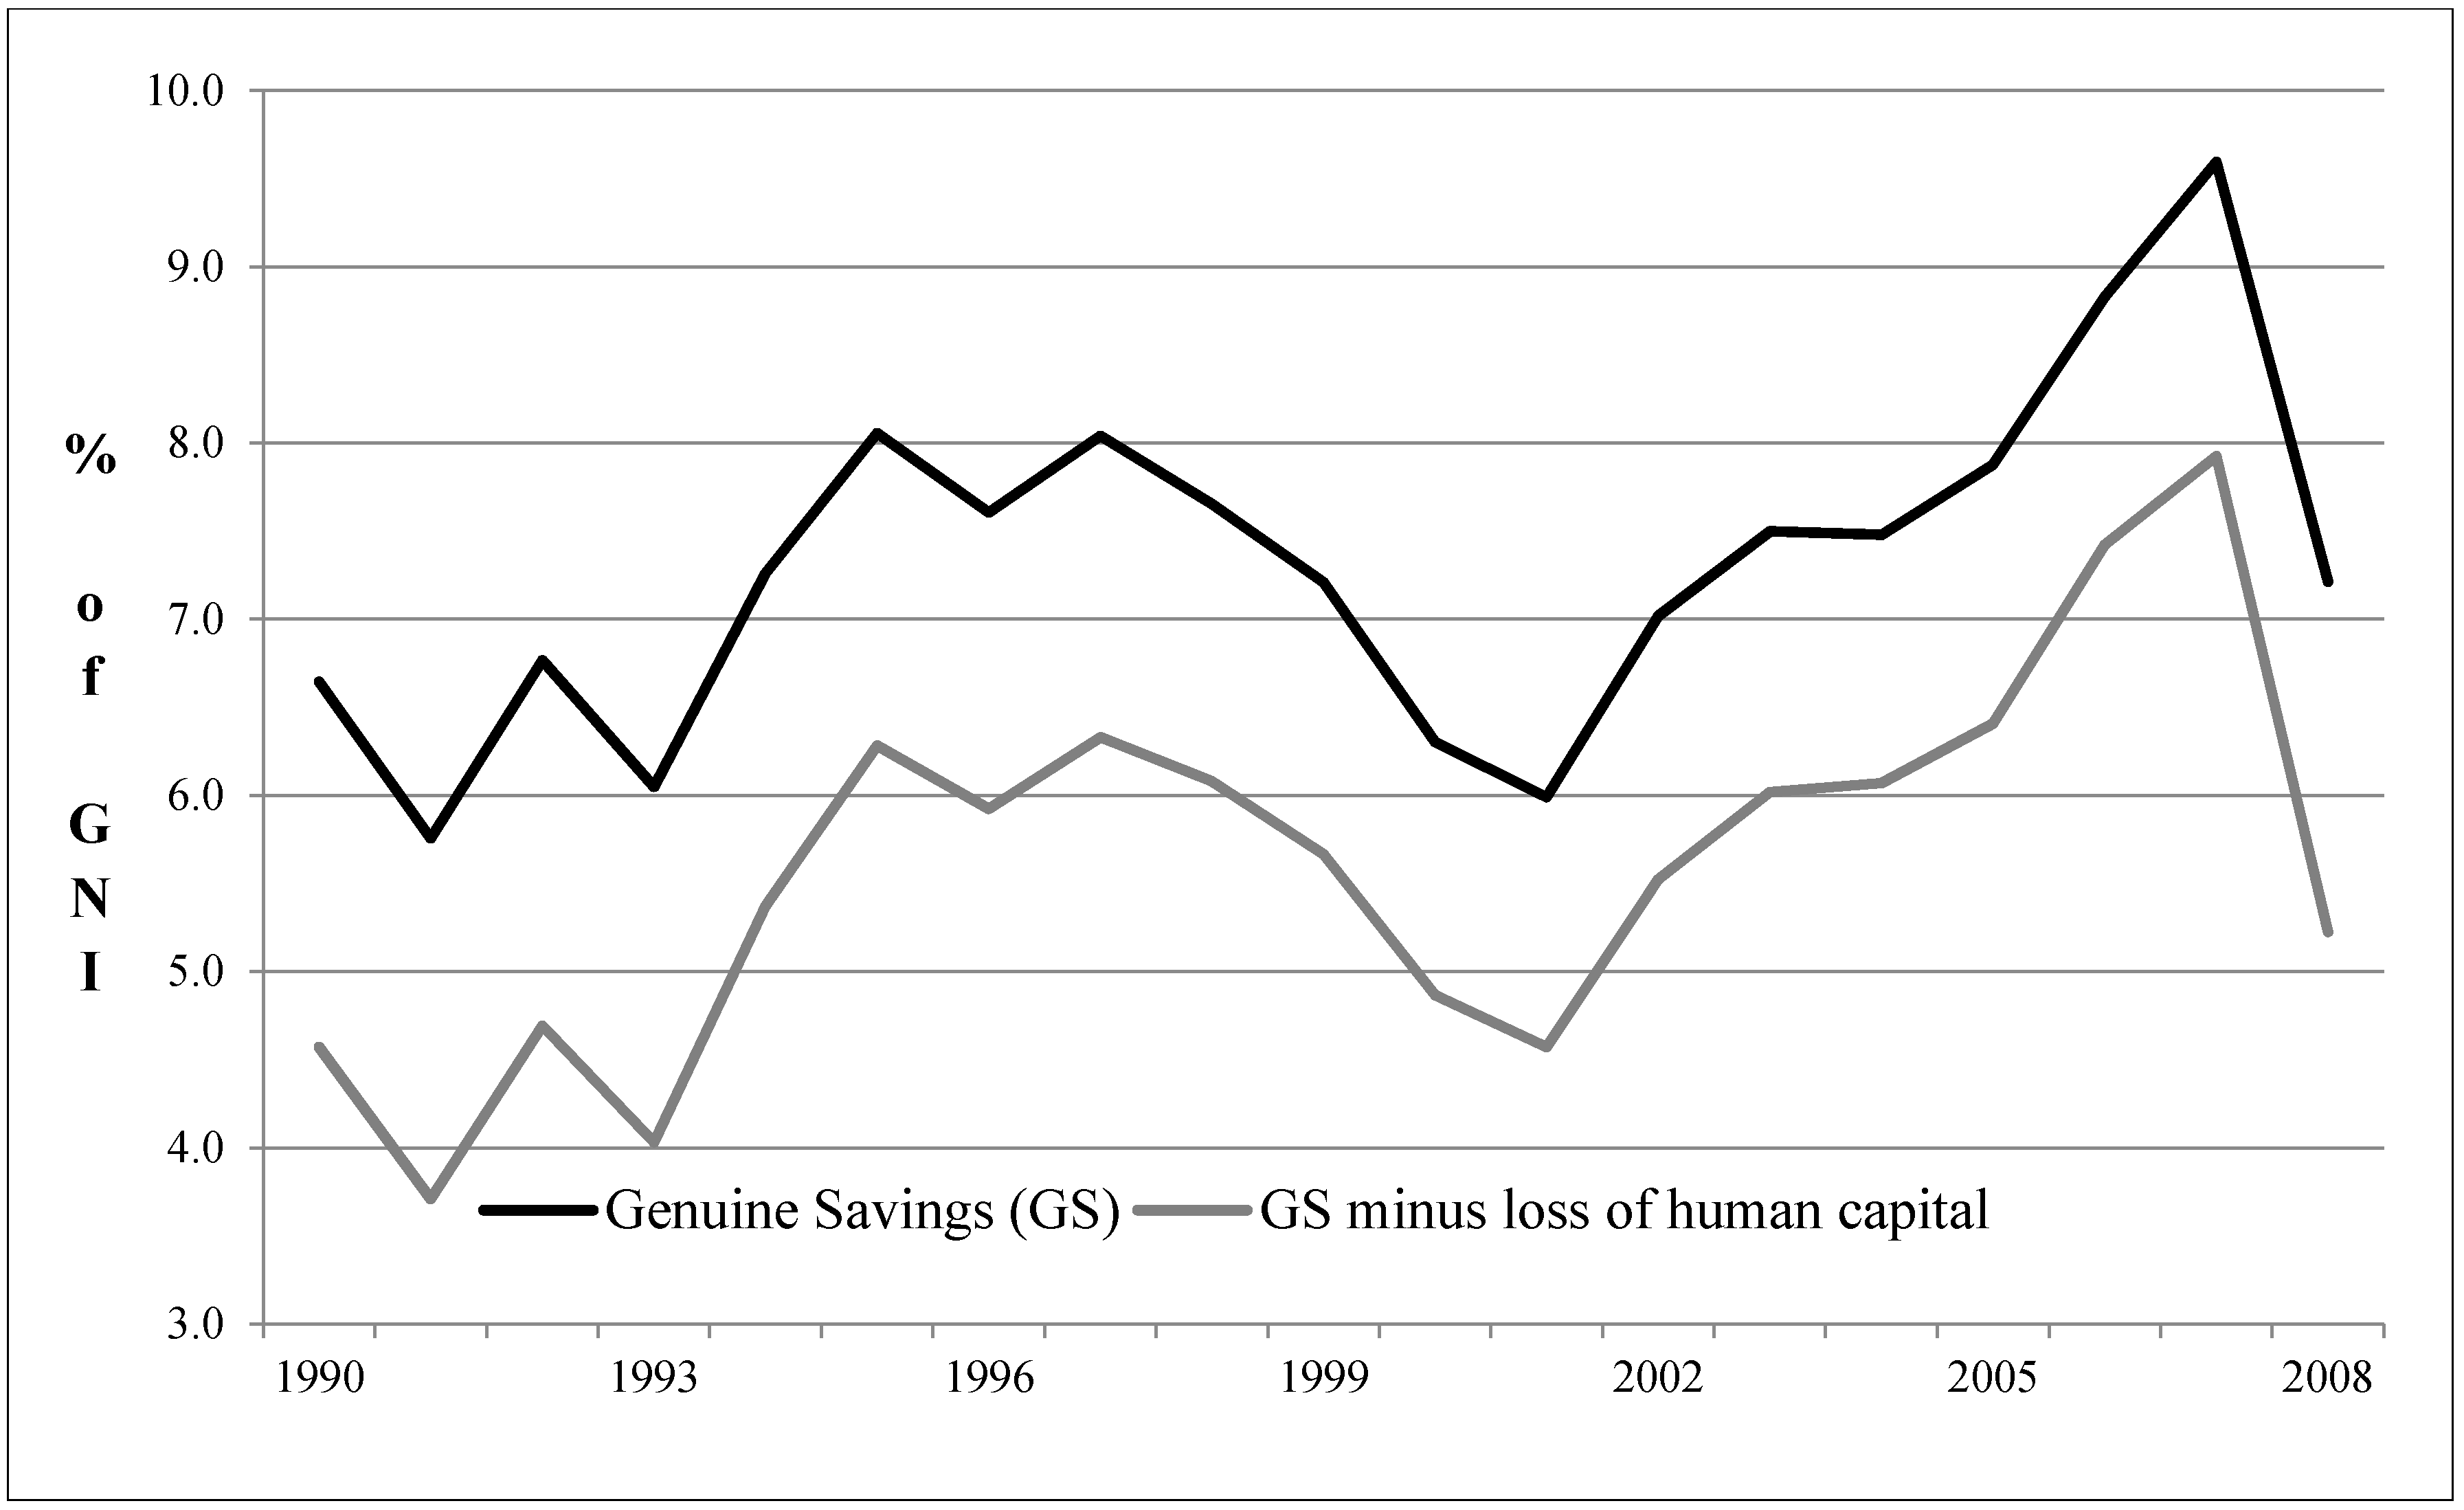
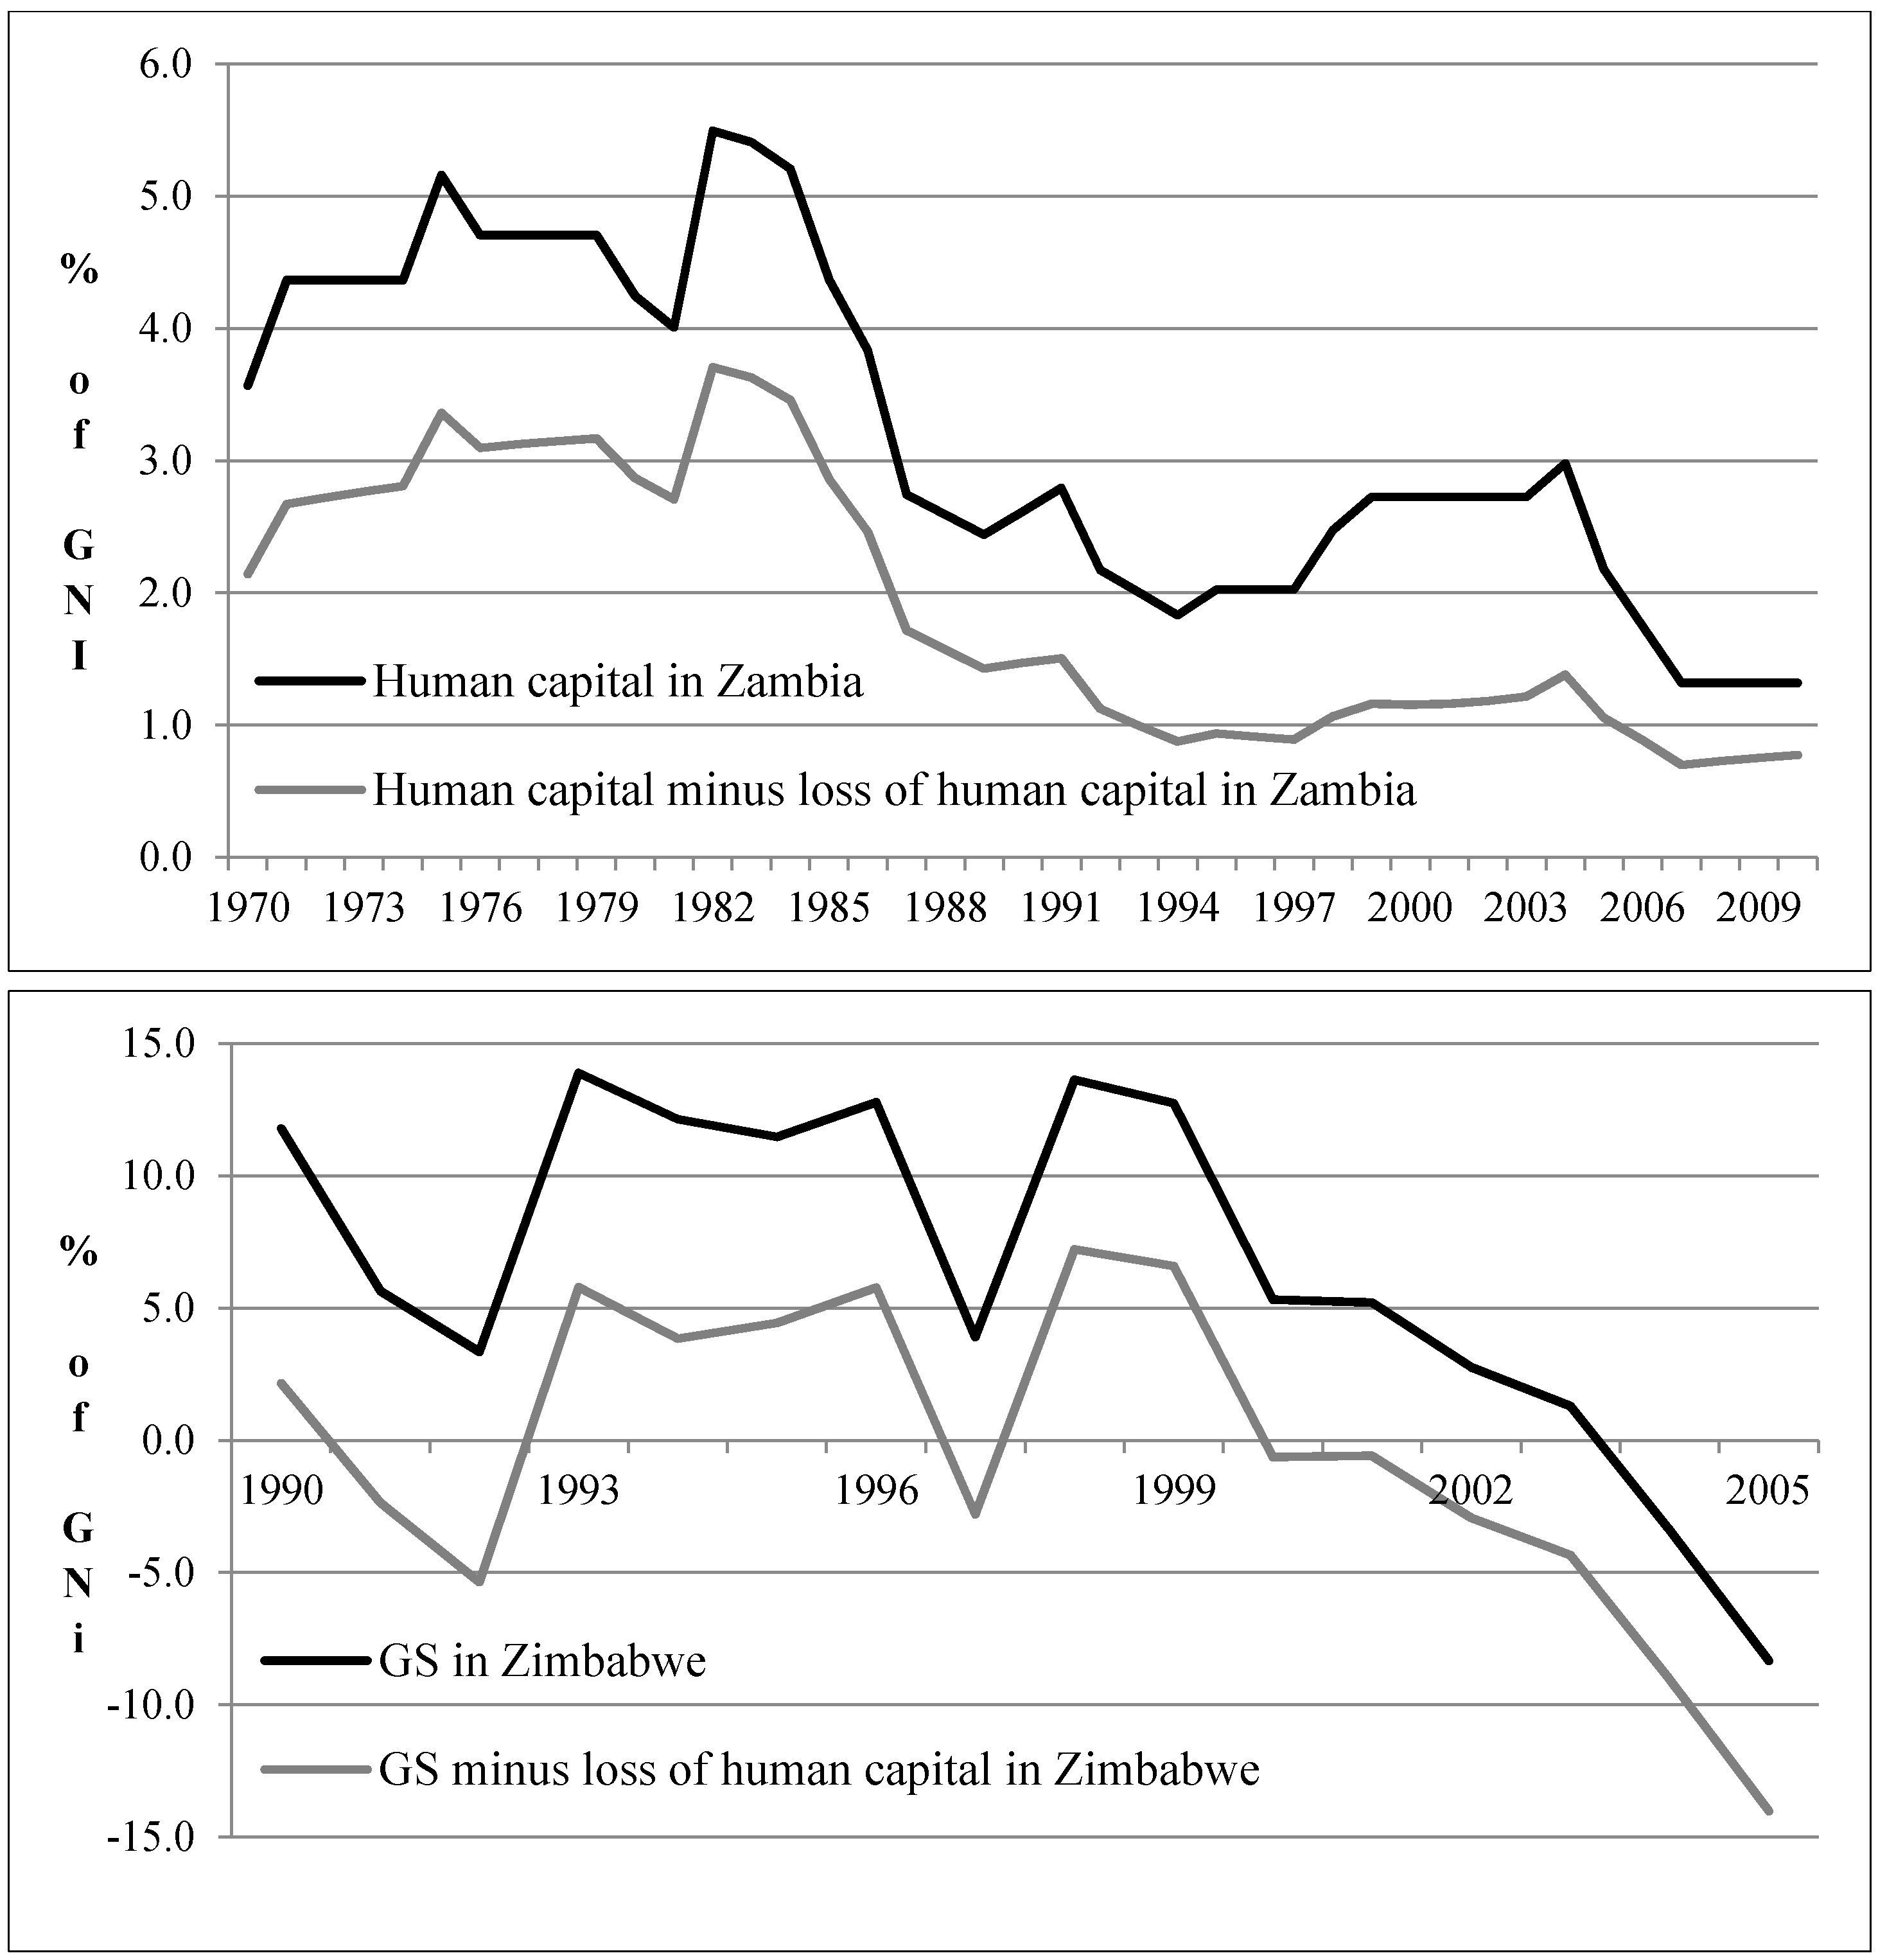
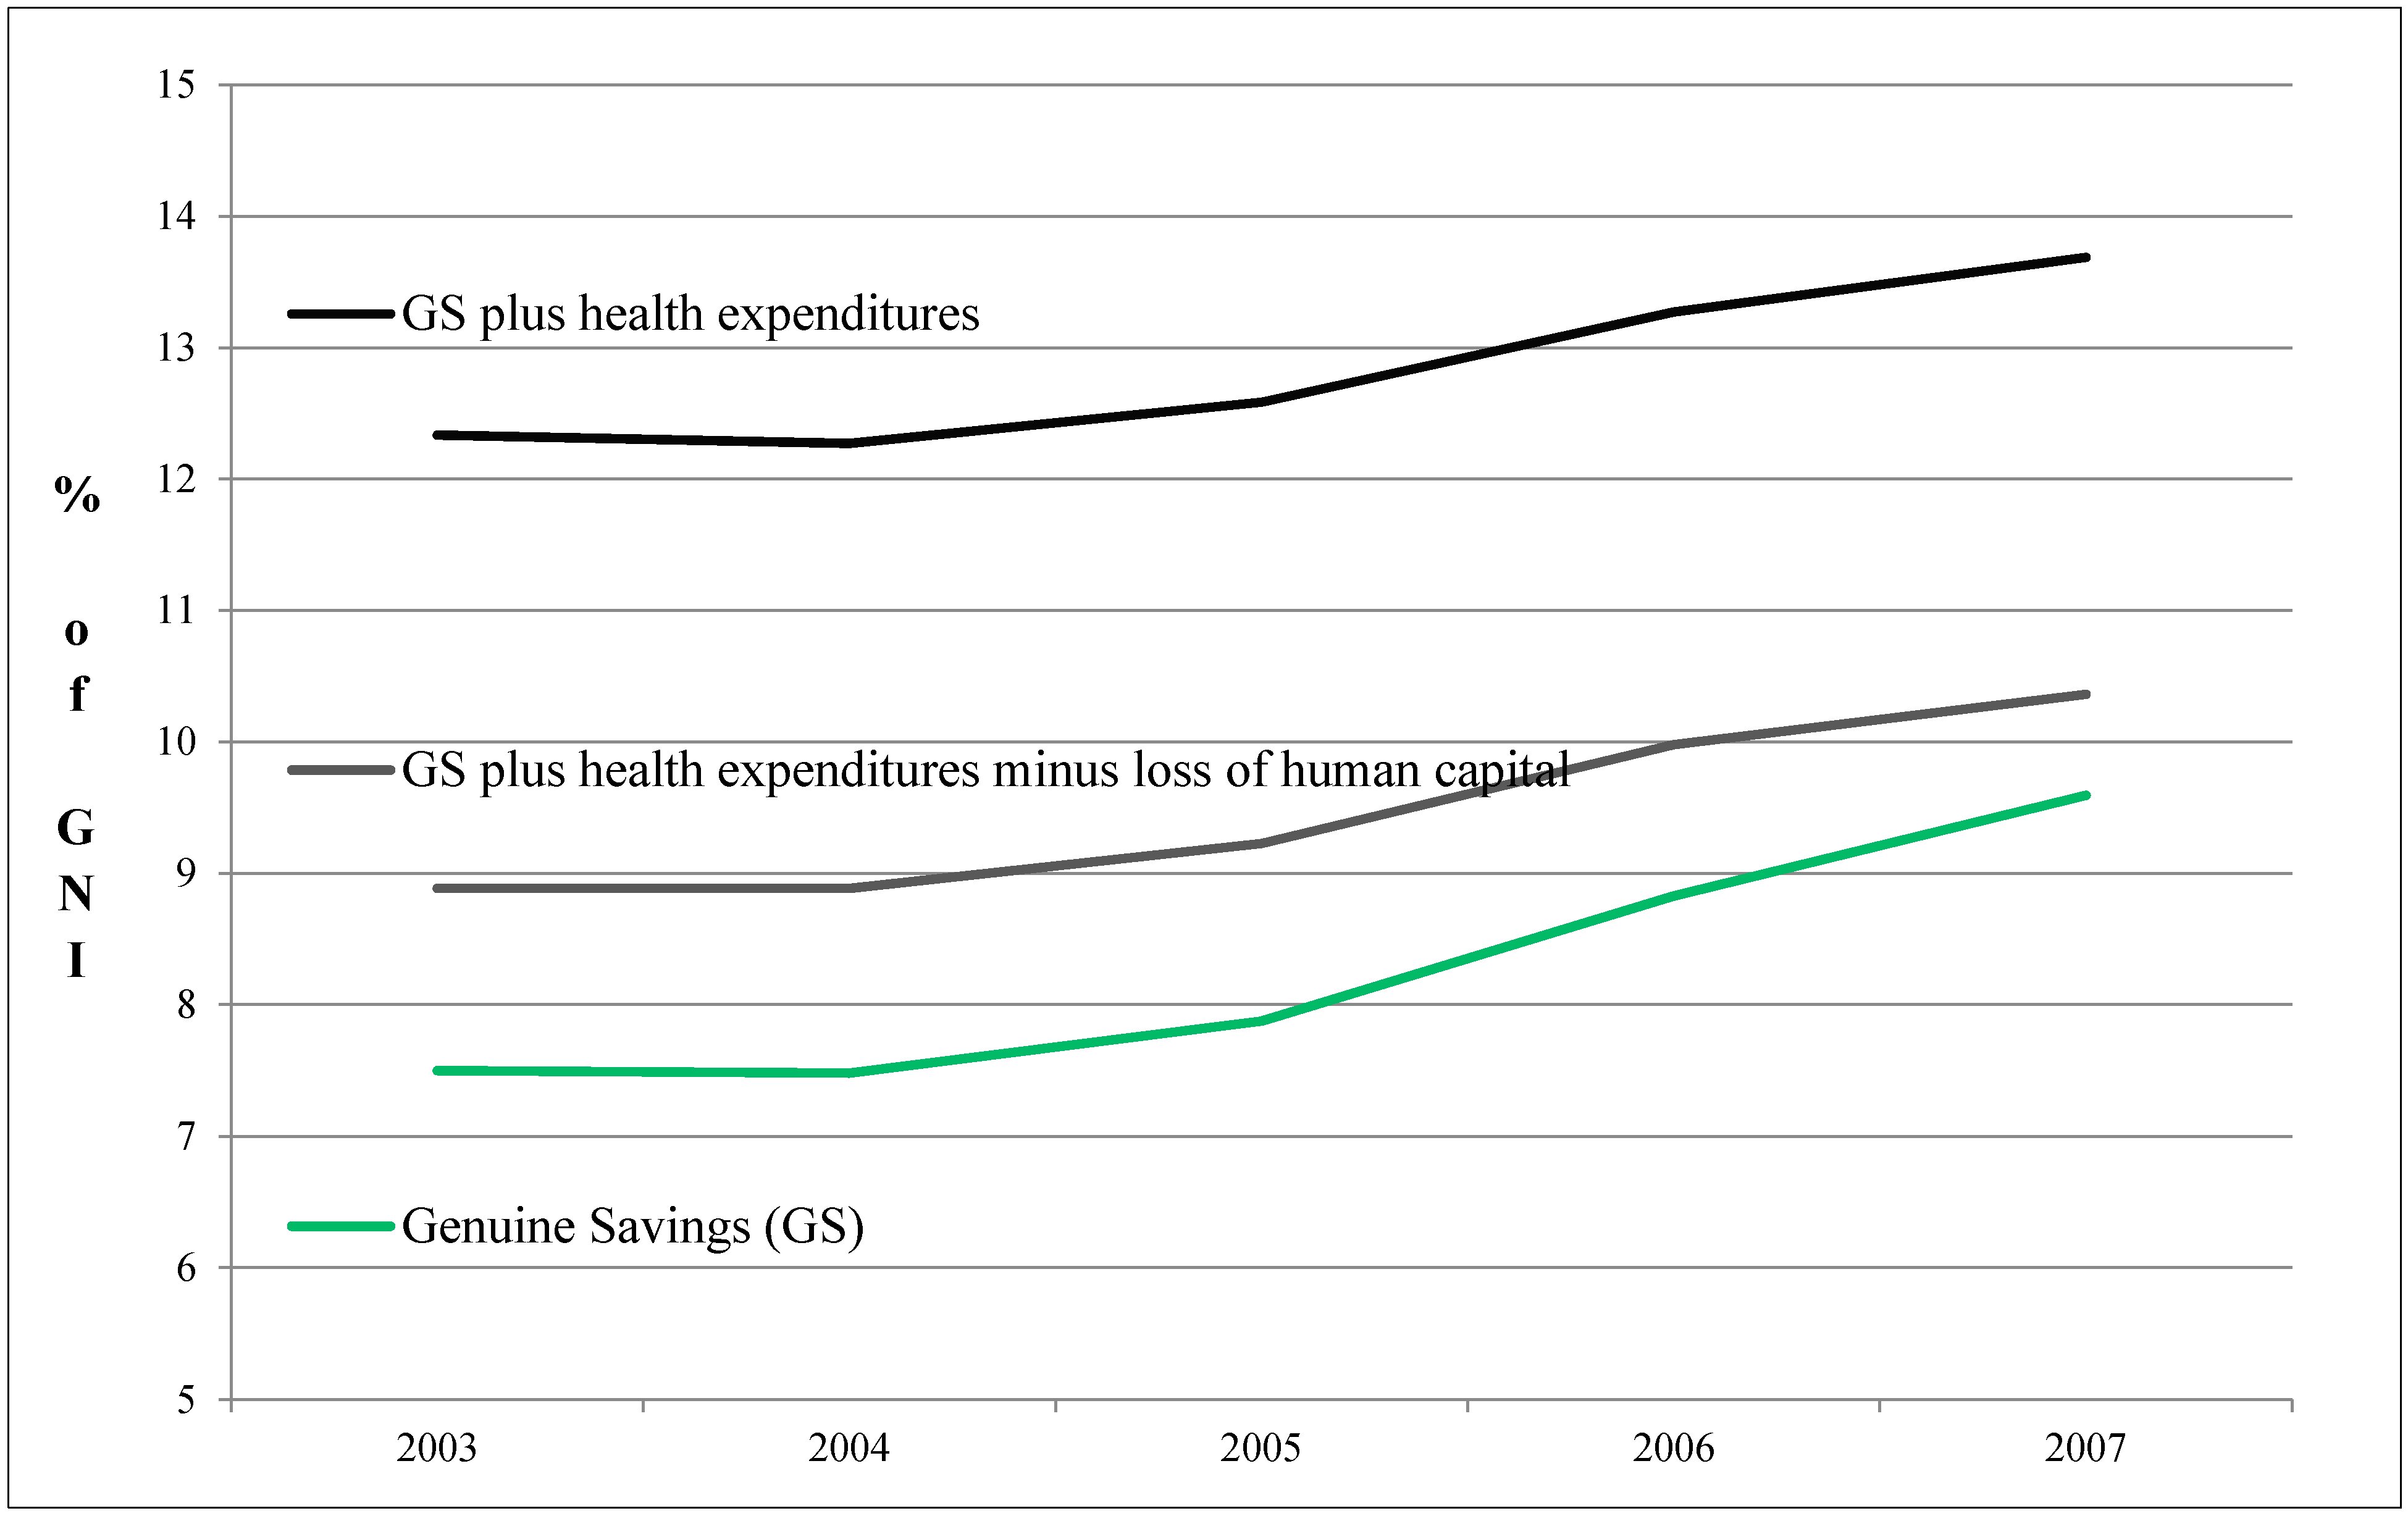
4.5.3. Human Capital

Human capital is defined as the total stock of competences and knowledge of all individuals within a country’s population gained through education, training and experience used for daily economic life [103]. The usual expression of human capital, first defined by Mincer [104], is a log-linear relationship between earnings and years of schooling to show that higher human capital results in higher income [39]. Investment into this capital stock is realized, for example, by teachers’ salaries, expenditures for libraries or enrollment fees [105]. Therefore, Hamilton and Clemens [36] utilize a country’s current education expenditures as an indicator for investment in human capital.
Dasgupta [69] criticizes this approach as an overestimation, since human capital also depreciates when educated employees leave the workforce or “die and take their human capital with them” [71]. However, Neumayer [21] argues that education expenditures still undervalue real investment in human capital since other expenditures that build human capital are not quantifiable. Dasgupta [69] even discusses examples such as the effect of parents’ time and effort with children or personal investments in strategic positions within social networks that increase one’s value for employers.
In general, I follow the argument that current education expenditures underestimate the real investment in or growth rate of human capital. However I also show two short examples demonstrating how GS could be influenced by including depreciation of human capital. One could argue that the extreme differences in life expectancies between countries are important when considering the return on investment in human capital [14,18,39]. Especially life expectancies that fall below the “normal” retirement age of 65 defined by Convention No. 102 of the International Labor Organization [106] decrease the contribution of education expenditures on economic activity.
Figure 7 shows average global decreases in human capital and Figure 8 shows the total GS rate after subtracting the fraction of education expenditures that is not used for an entire working life. Since the age of a working life is defined from 15 to 65 I deduct 2.5% from current education expenditures for every year a country’s life expectancy at birth is below 65 years. On average over the last two decades, 66 countries out of the 205 available in the “World Development Indicators” exhibit life expectancies under this age. Clearly the difference for the world average is immense if I use this simple extension to assign education expenditures to the average working years the population of a country is able to fulfil.
Figure 7. Human capital minus loss between 1990 and 2008 (world average). (Own calculation and illustration with data from World Bank [53,54]).
Sustainability 07 04146 g007
Figure 8. GS and the loss of human capital between 1990 and 2008 (world average). (Own calculation and illustration with data from World Bank [53,54]).
Sustainability 07 04146 g008
In Figure 9, I again use examples from Southern Africa, namely Zambia and Zimbabwe, in which the life expectancies fall below the international retirement age of 65. The example of Zimbabwe, with an average life expectancy of 49 years in the period from 1990 to 2005, shows a significant difference of more than 6% of GNI when measuring GS with and without the inclusion of life expectancies.
Figure 9. Human capital minus loss between 1970 and 2010 in Zambia. (Own calculation and illustration with data from World Bank [53,54]).
Sustainability 07 04146 g009
Therefore, different life expectancies clearly can have an effect on the human capital of a country. I argue along with Arrow et al. [70] that life expectancies and quality of health are related and thereby health expenditures could also be seen as investment in human capital. In Figure 10, I show data for the five-year period from 2003 to 2007 to illustrate how health expenditures change GS. As in the case of education expenditures, I subtract 10% of health expenditures for investments in hospitals and other facilities already included in NNS and show that adding health expenditures increases world average GS values between 1% and 5%, depending on the inclusion of the loss of human capital. Such large increases appear slightly high for the additional incorporation of only a part of one capital form, but Arrow et al. [70] even demonstrate in their five cases that the inclusion of health capital is more than twice as large as all other forms of capital combined. A capital form resulting in such a difference and so far underrepresented in the scientific discussion lends itself to future discussion on the calculation of GS.
The quality of education and health systems differs greatly. Thus, one dollar spent on education or health cannot be considered one dollar of additional human capital, as the returns are different from country to country. According to the World Bank [38,39], social returns on education expenditures are almost two-thirds higher in developing countries compared to the industrialized world. The World Bank [38,39] therefore suggests extending the proxy for human capital by other measures such as average years of education, but acknowledges the overall usefulness of the rate of returns on education. This paper shall only present critiques and possible extensions, as a fundamental discussion on all research topics behind the different calculation parts of GS would go beyond the scope of this work. In line with Arrow et al. [70], I also argue that “the analysis of health capital is an innovation that will require much further study to understand”.
Figure 10. GS plus health expenditures between 2003 and 2007. (Own calculation and illustration with data from World Bank [53,54]).
Sustainability 07 04146 g010
In the next section on natural capital, I deliberately abstain from a detailed discussion of the calculation method, instead choosing to show interesting examples of omitted resources that could be included.

4.6. Natural Capital

4.6.1. Energy Depletion

Rents from energy depletion include crude oil, natural gas, and hard as well as lignite coal, calculated as shown in Equation (12), where P is the international market price. However, other energy sources such as peat or uranium as input for nuclear power plants are absent from the calculation. The United Nations Statistics Division (UNSD) Industrial Commodity Statistics Database publishes production values only in metric tons, while world market prices and average production costs are difficult to obtain. Therefore, these energy resources and others for which no data is available are omitted by the World Bank [38,39].
In total, there are only twelve countries that produce peat on a large scale: Albania, Argentina, Bangladesh, Belarus, Burundi, Estonia, Finland, Ireland, Russia, Rwanda, Senegal and Sweden. As an industrial energy source in plants it is only used extensively in Ireland, Finland and Sweden, while in a small number of developing countries immeasurable values are privately used as fuel. Therefore, I would suggest including peat rents into the GS of these bigger producers but to omit it in the marginal amounts most countries show. For P in Equation (12) individual country prices could be used if it is not possible to establish a world market price.
Another case is uranium, which is only produced in 21 countries in a total of 42 mines. Moreover, only Australia, Canada, Kazakhstan, Namibia, Niger, the Russian Federation, the United States and Uzbekistan produce uranium in four-digit metric ton terms. Figure 11, Figure 12 and Figure 13 show the three countries Australia, Namibia and Niger as those in which uranium makes a visible difference. These examples show that it could be advisable to include uranium in the calculation of the GS of such uranium-depleting countries. Especially the Nigerian GS rate decreases from positive to negative values by including the depletion of uranium, as Figure 13 shows.
Figure 11. GS of Australia including uranium between 2000 and 2004. (Own calculation and illustration with data from World Bank [53,54]).
Sustainability 07 04146 g011
Figure 12. GS of Namibia including uranium between 2000 and 2004. (Own calculation and illustration with data from World Bank [53,54]).
Sustainability 07 04146 g012
Figure 13. GS of Niger including uranium between 2000 and 2004. (Own calculation and illustration with data from World Bank [53,54]).
Sustainability 07 04146 g013

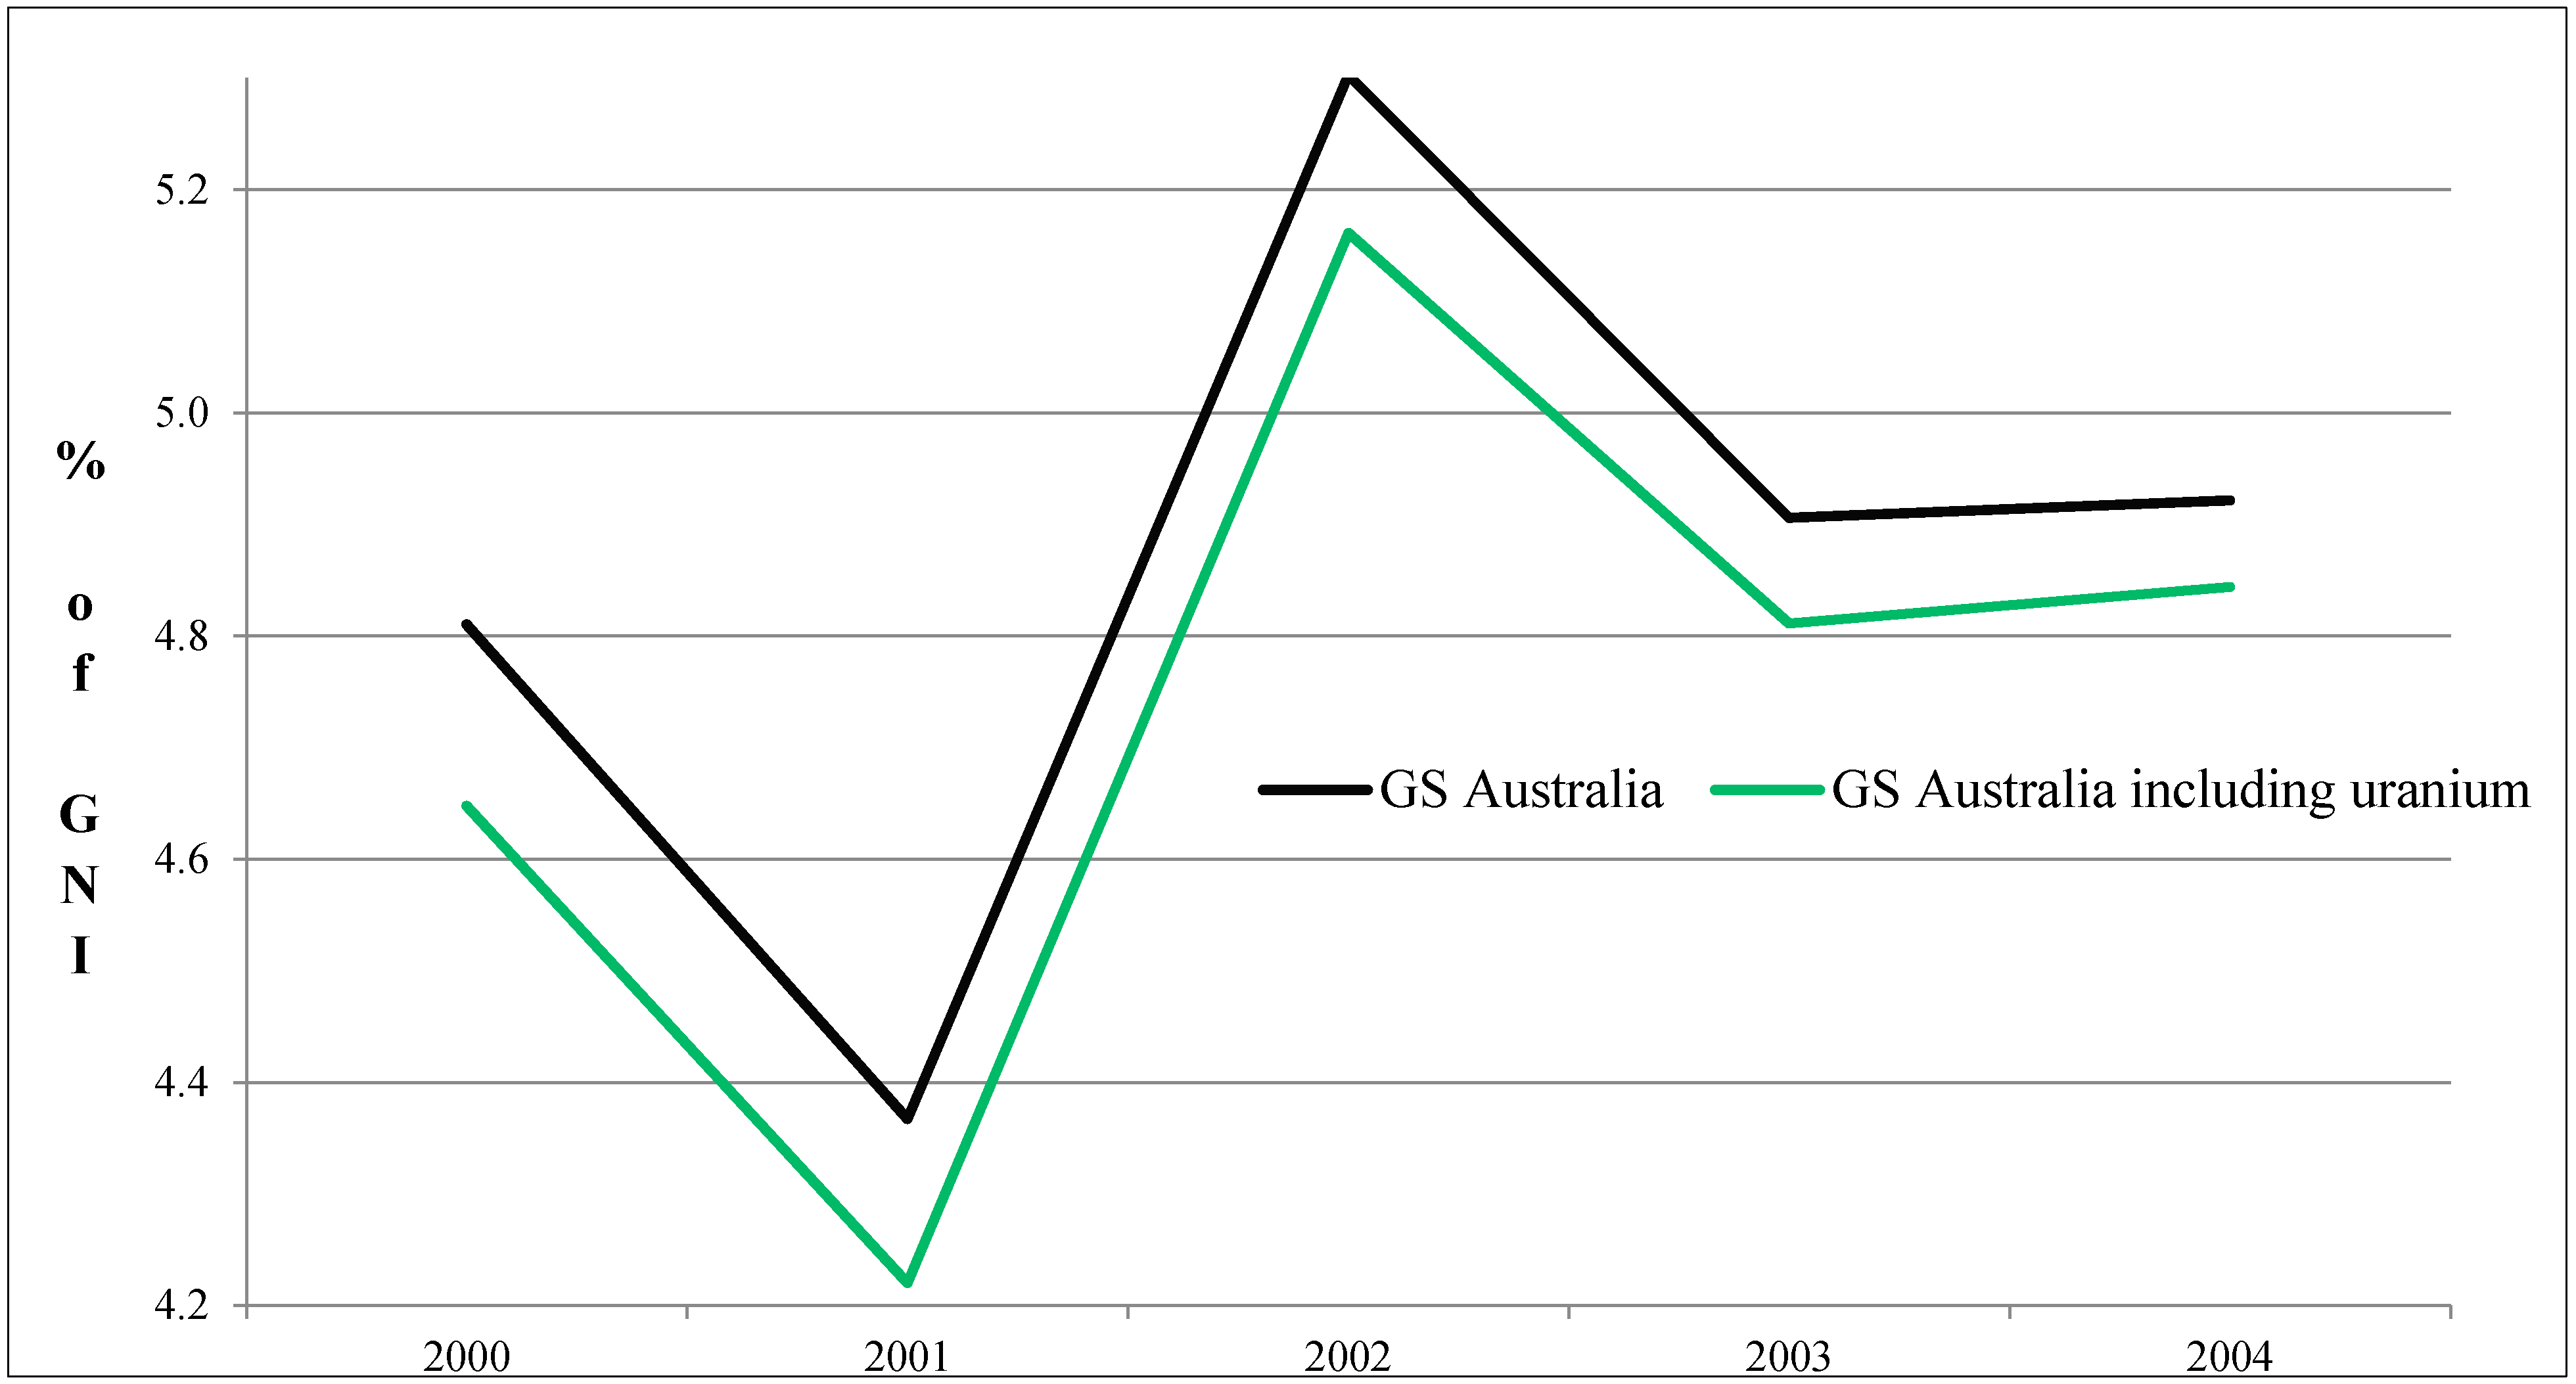
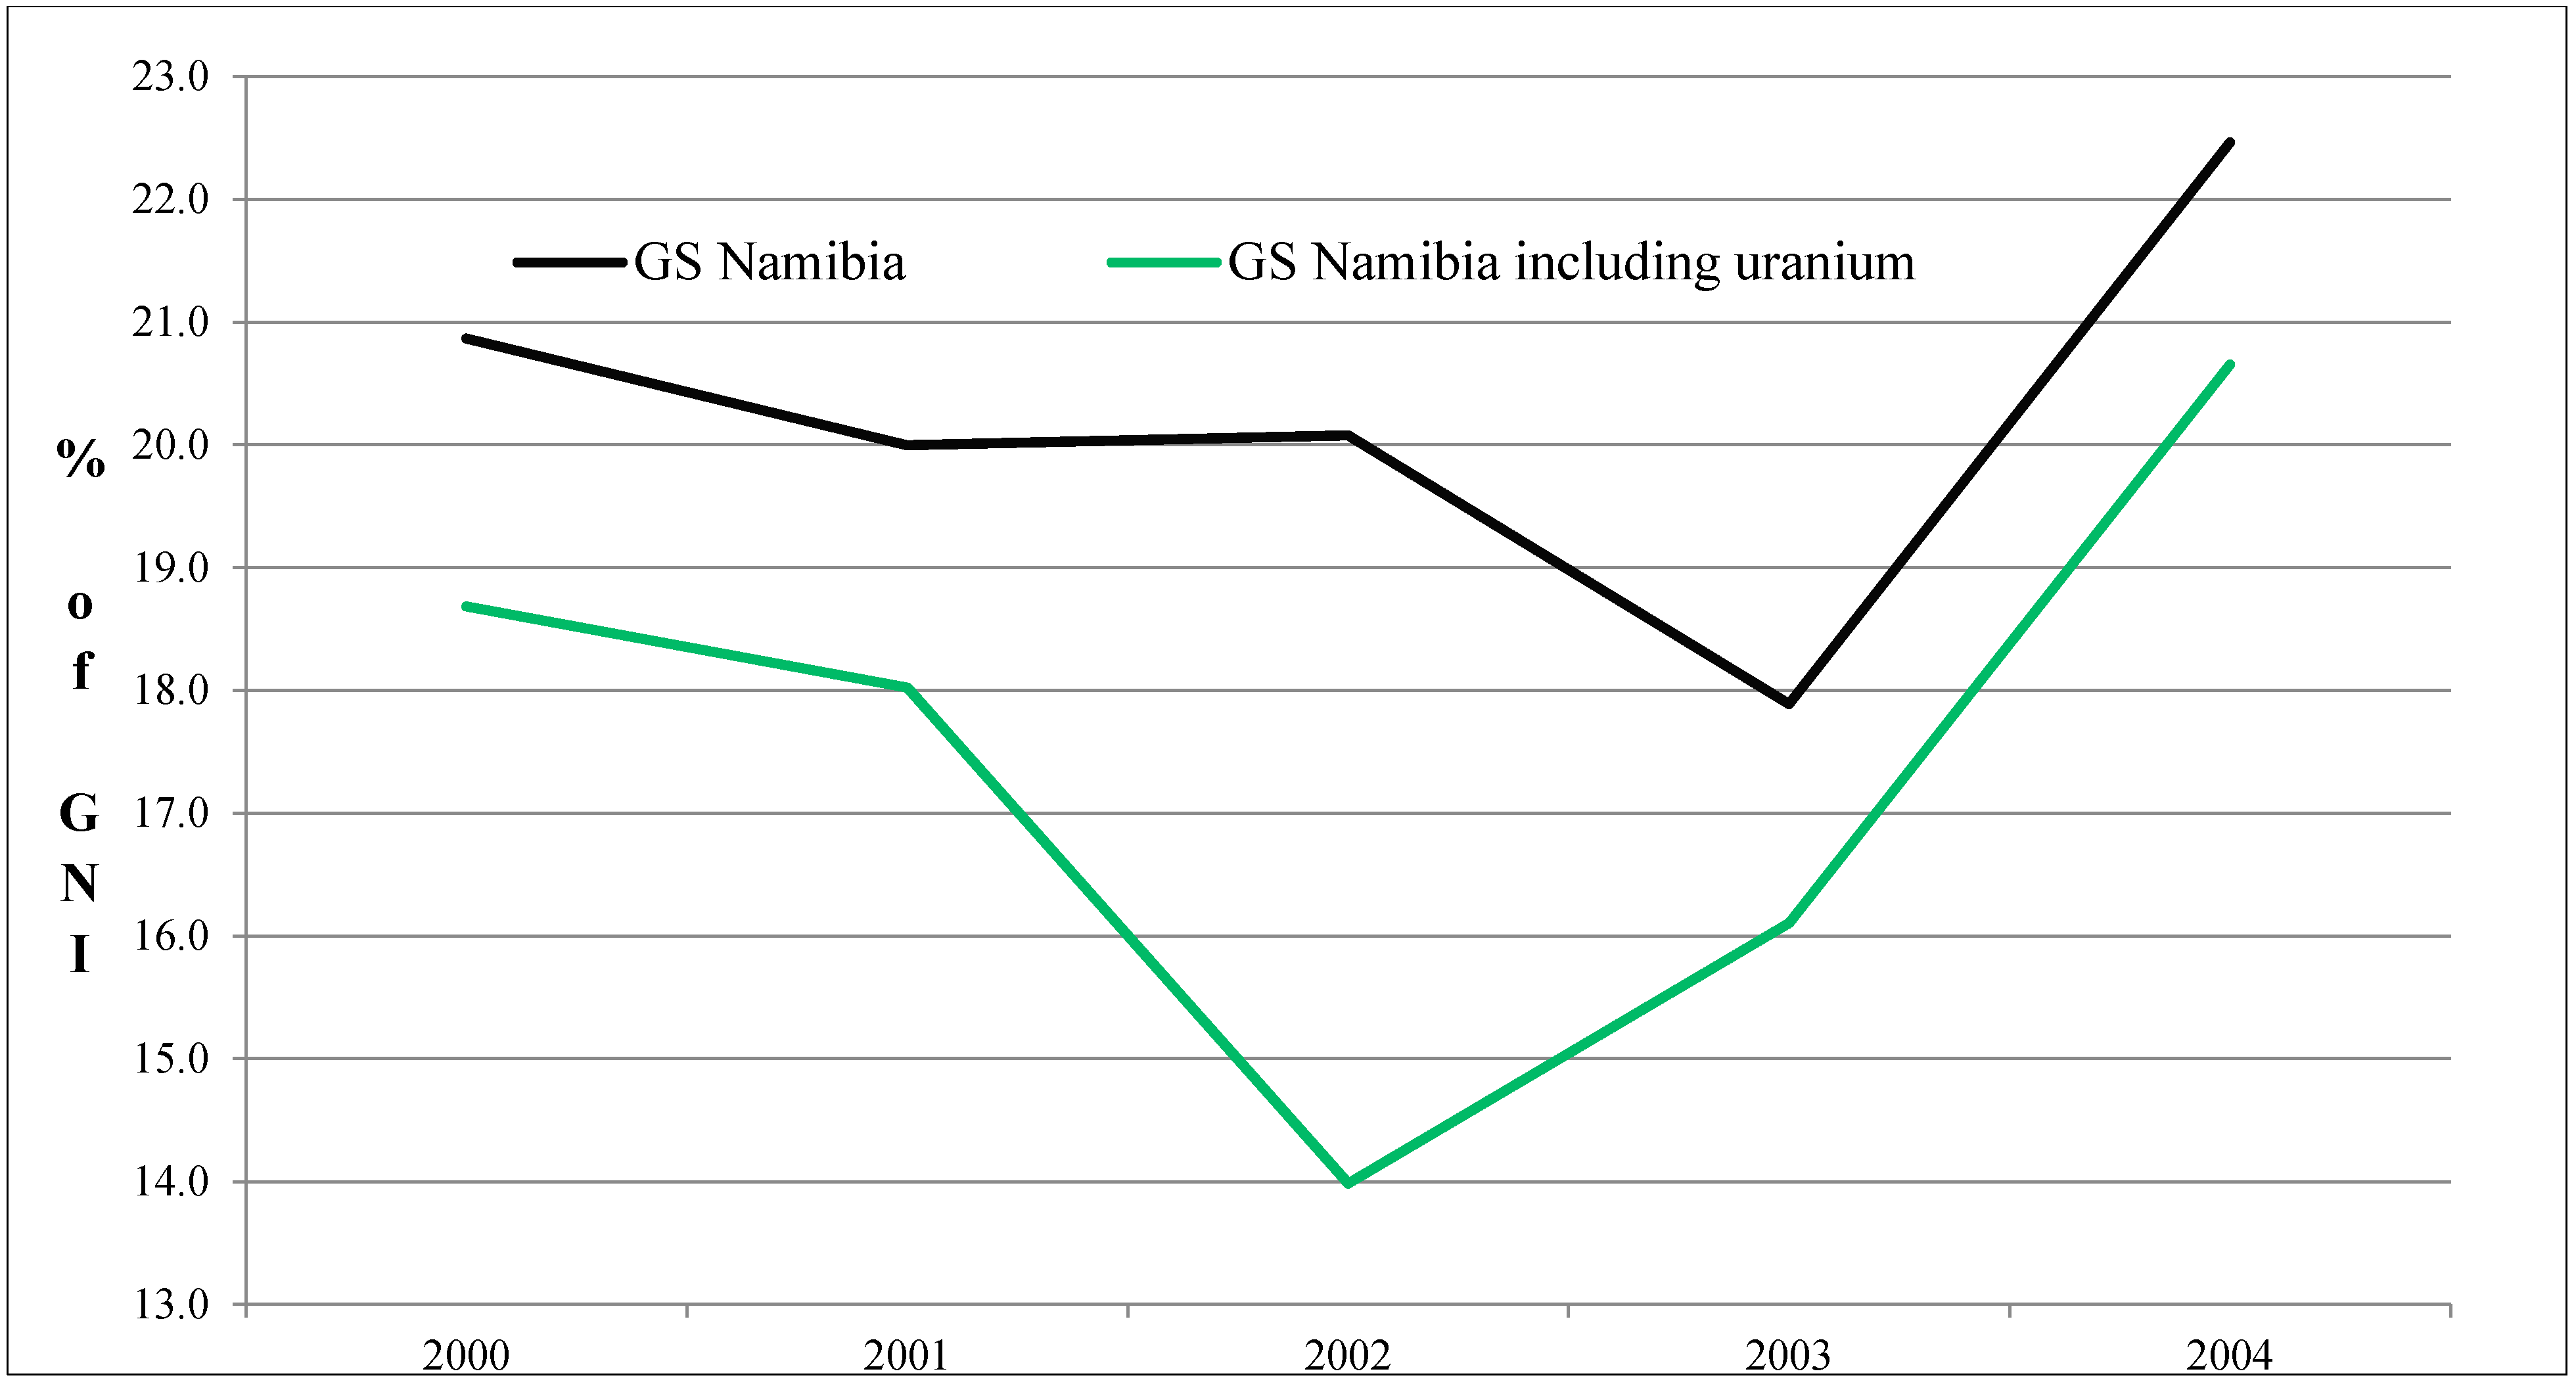
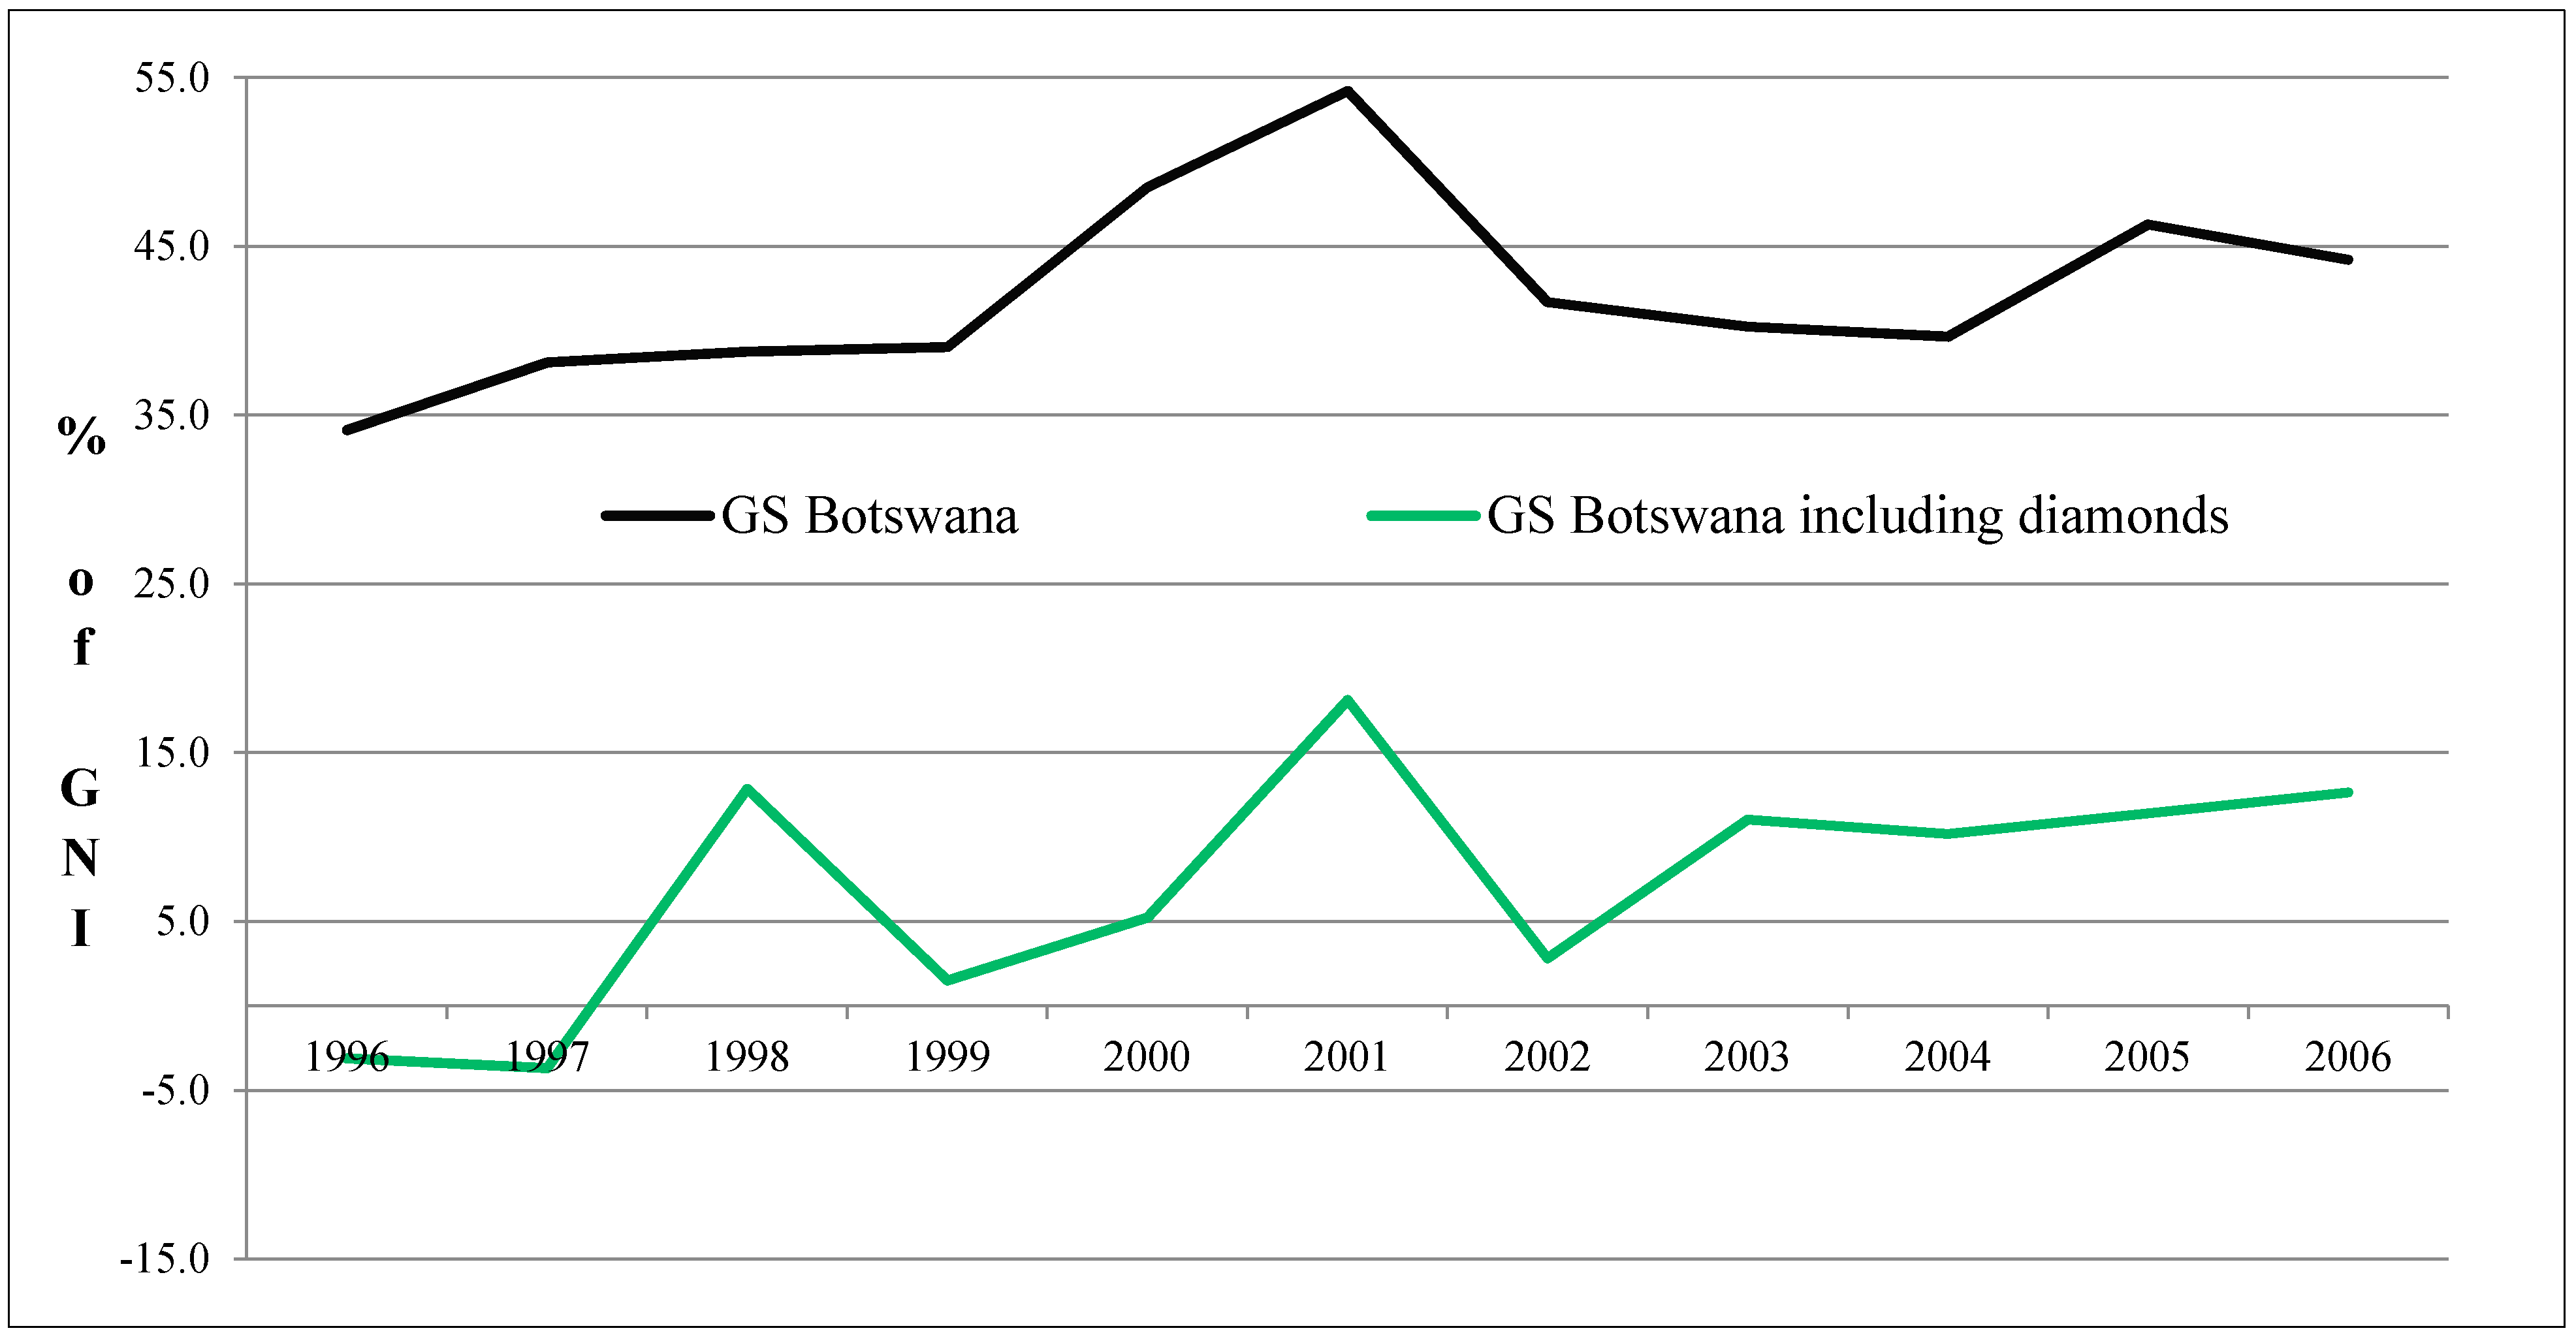
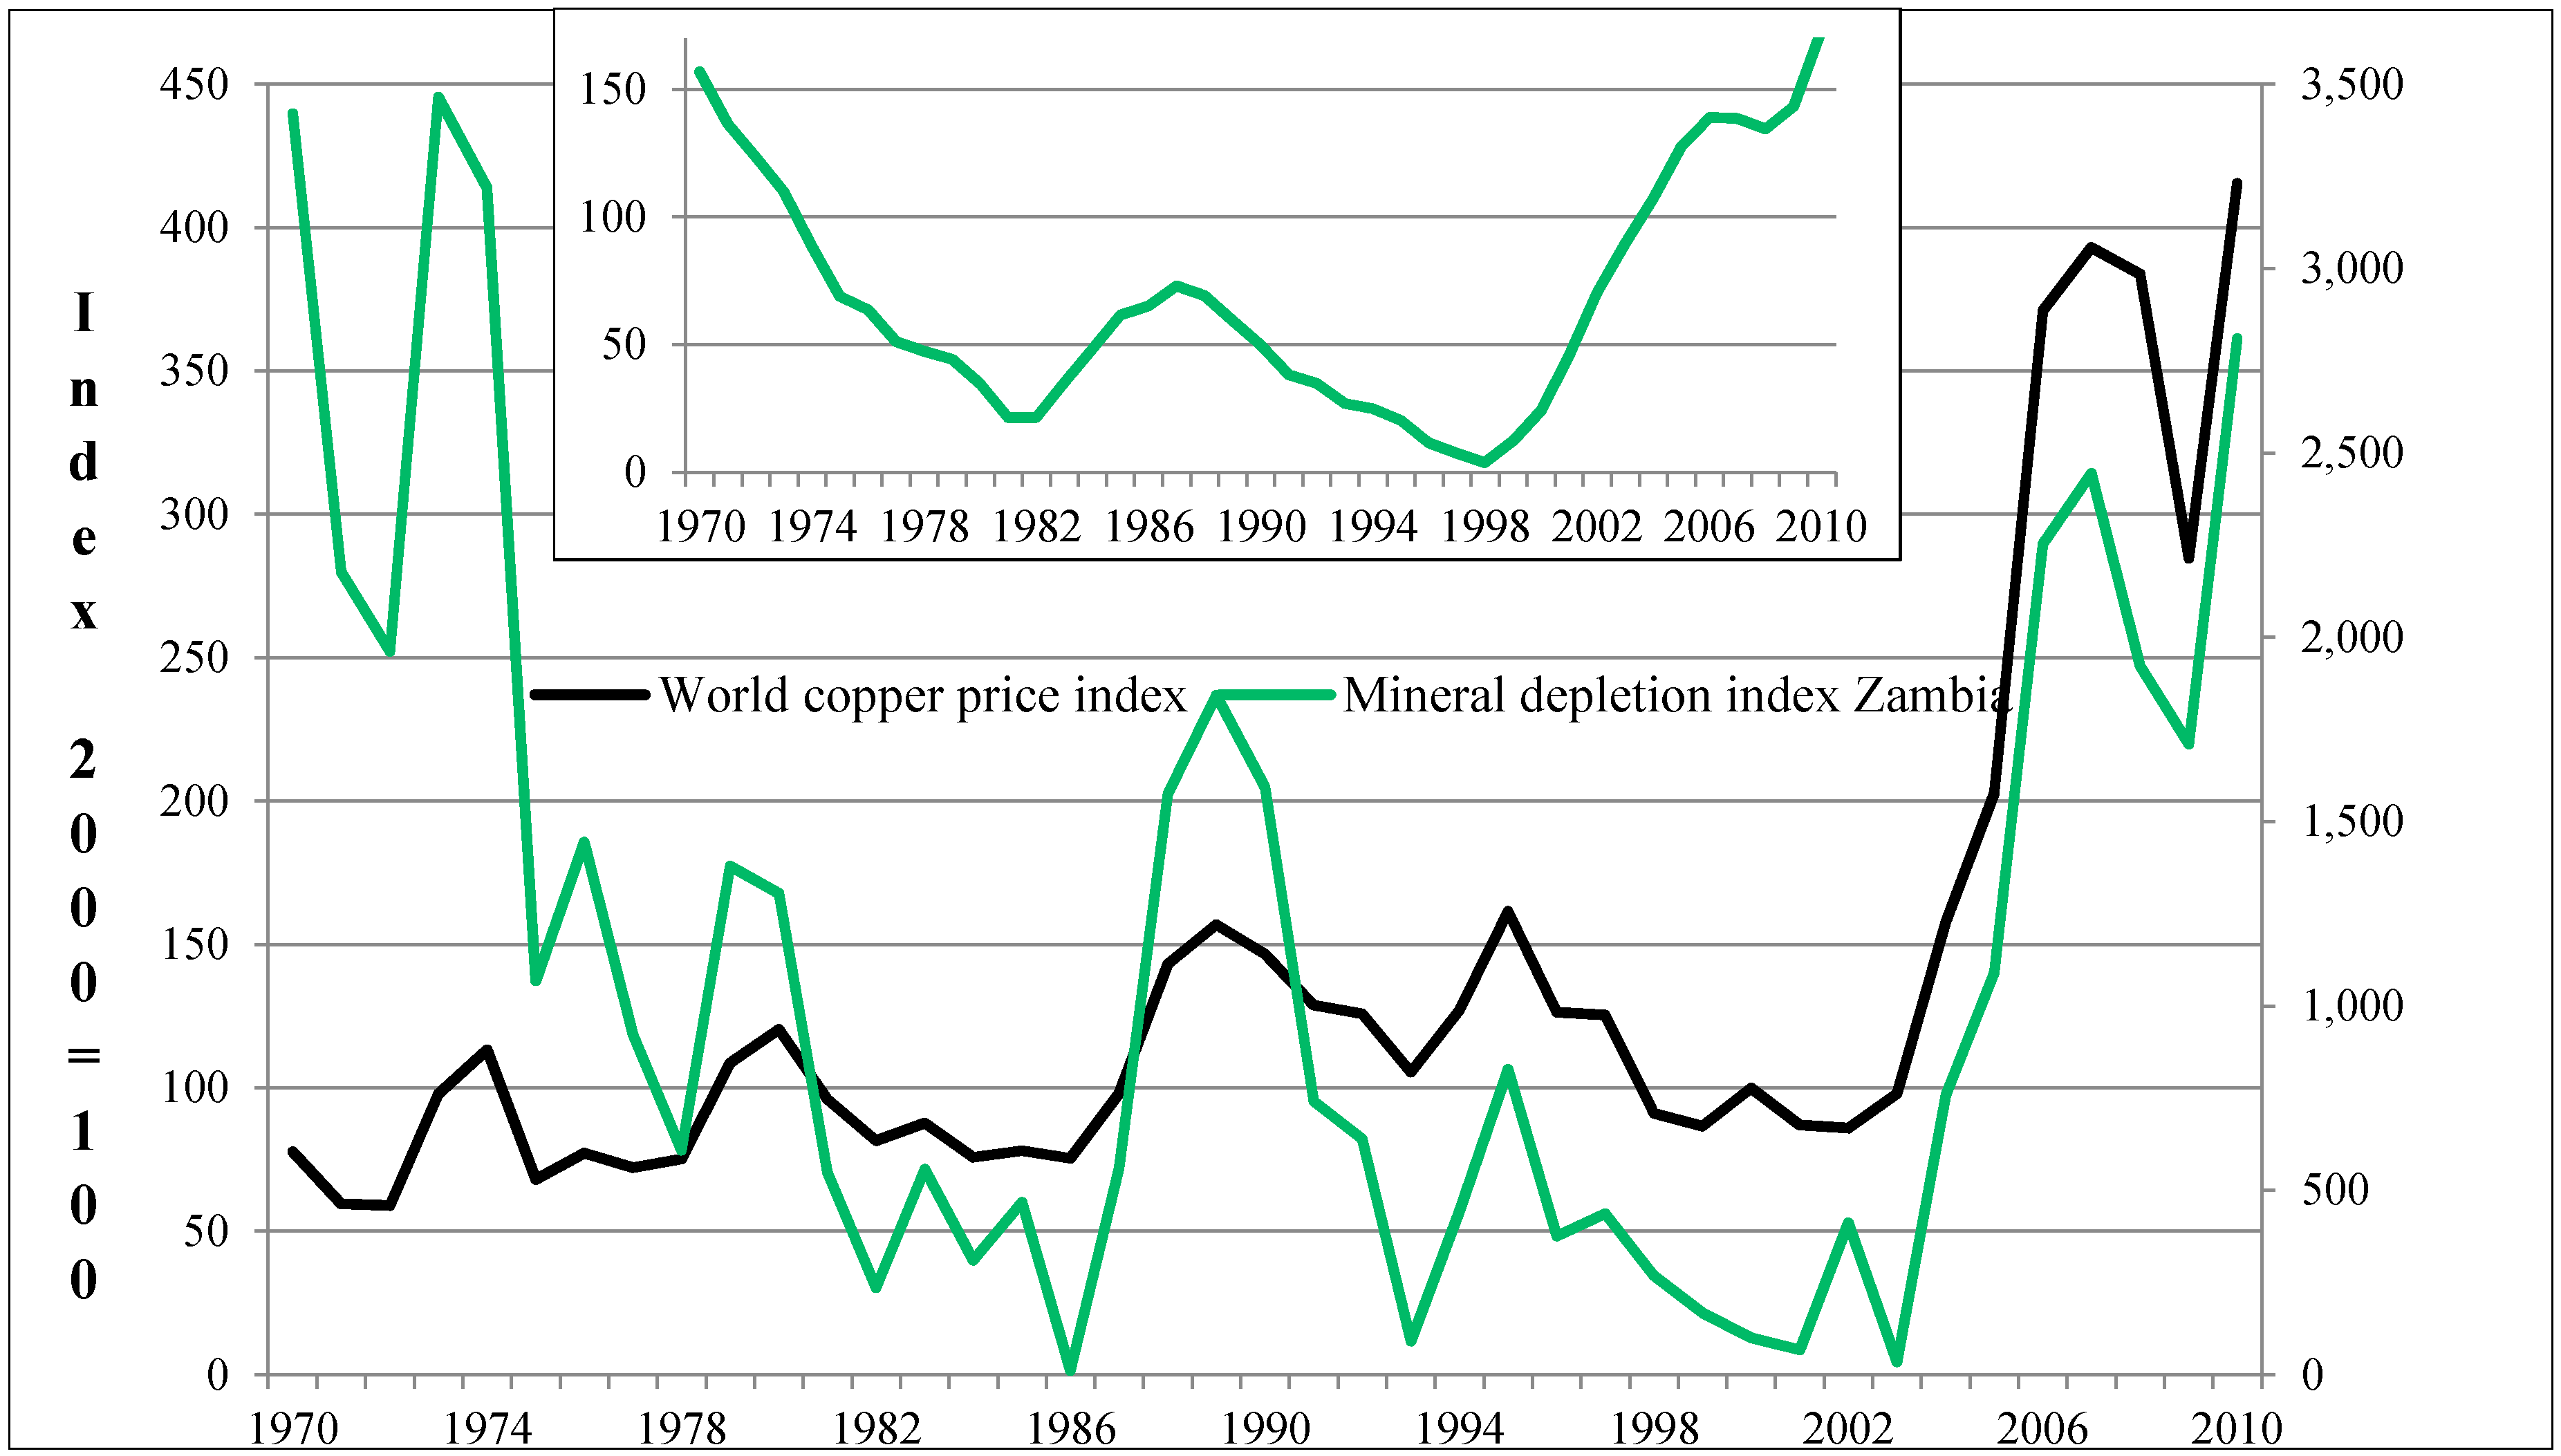
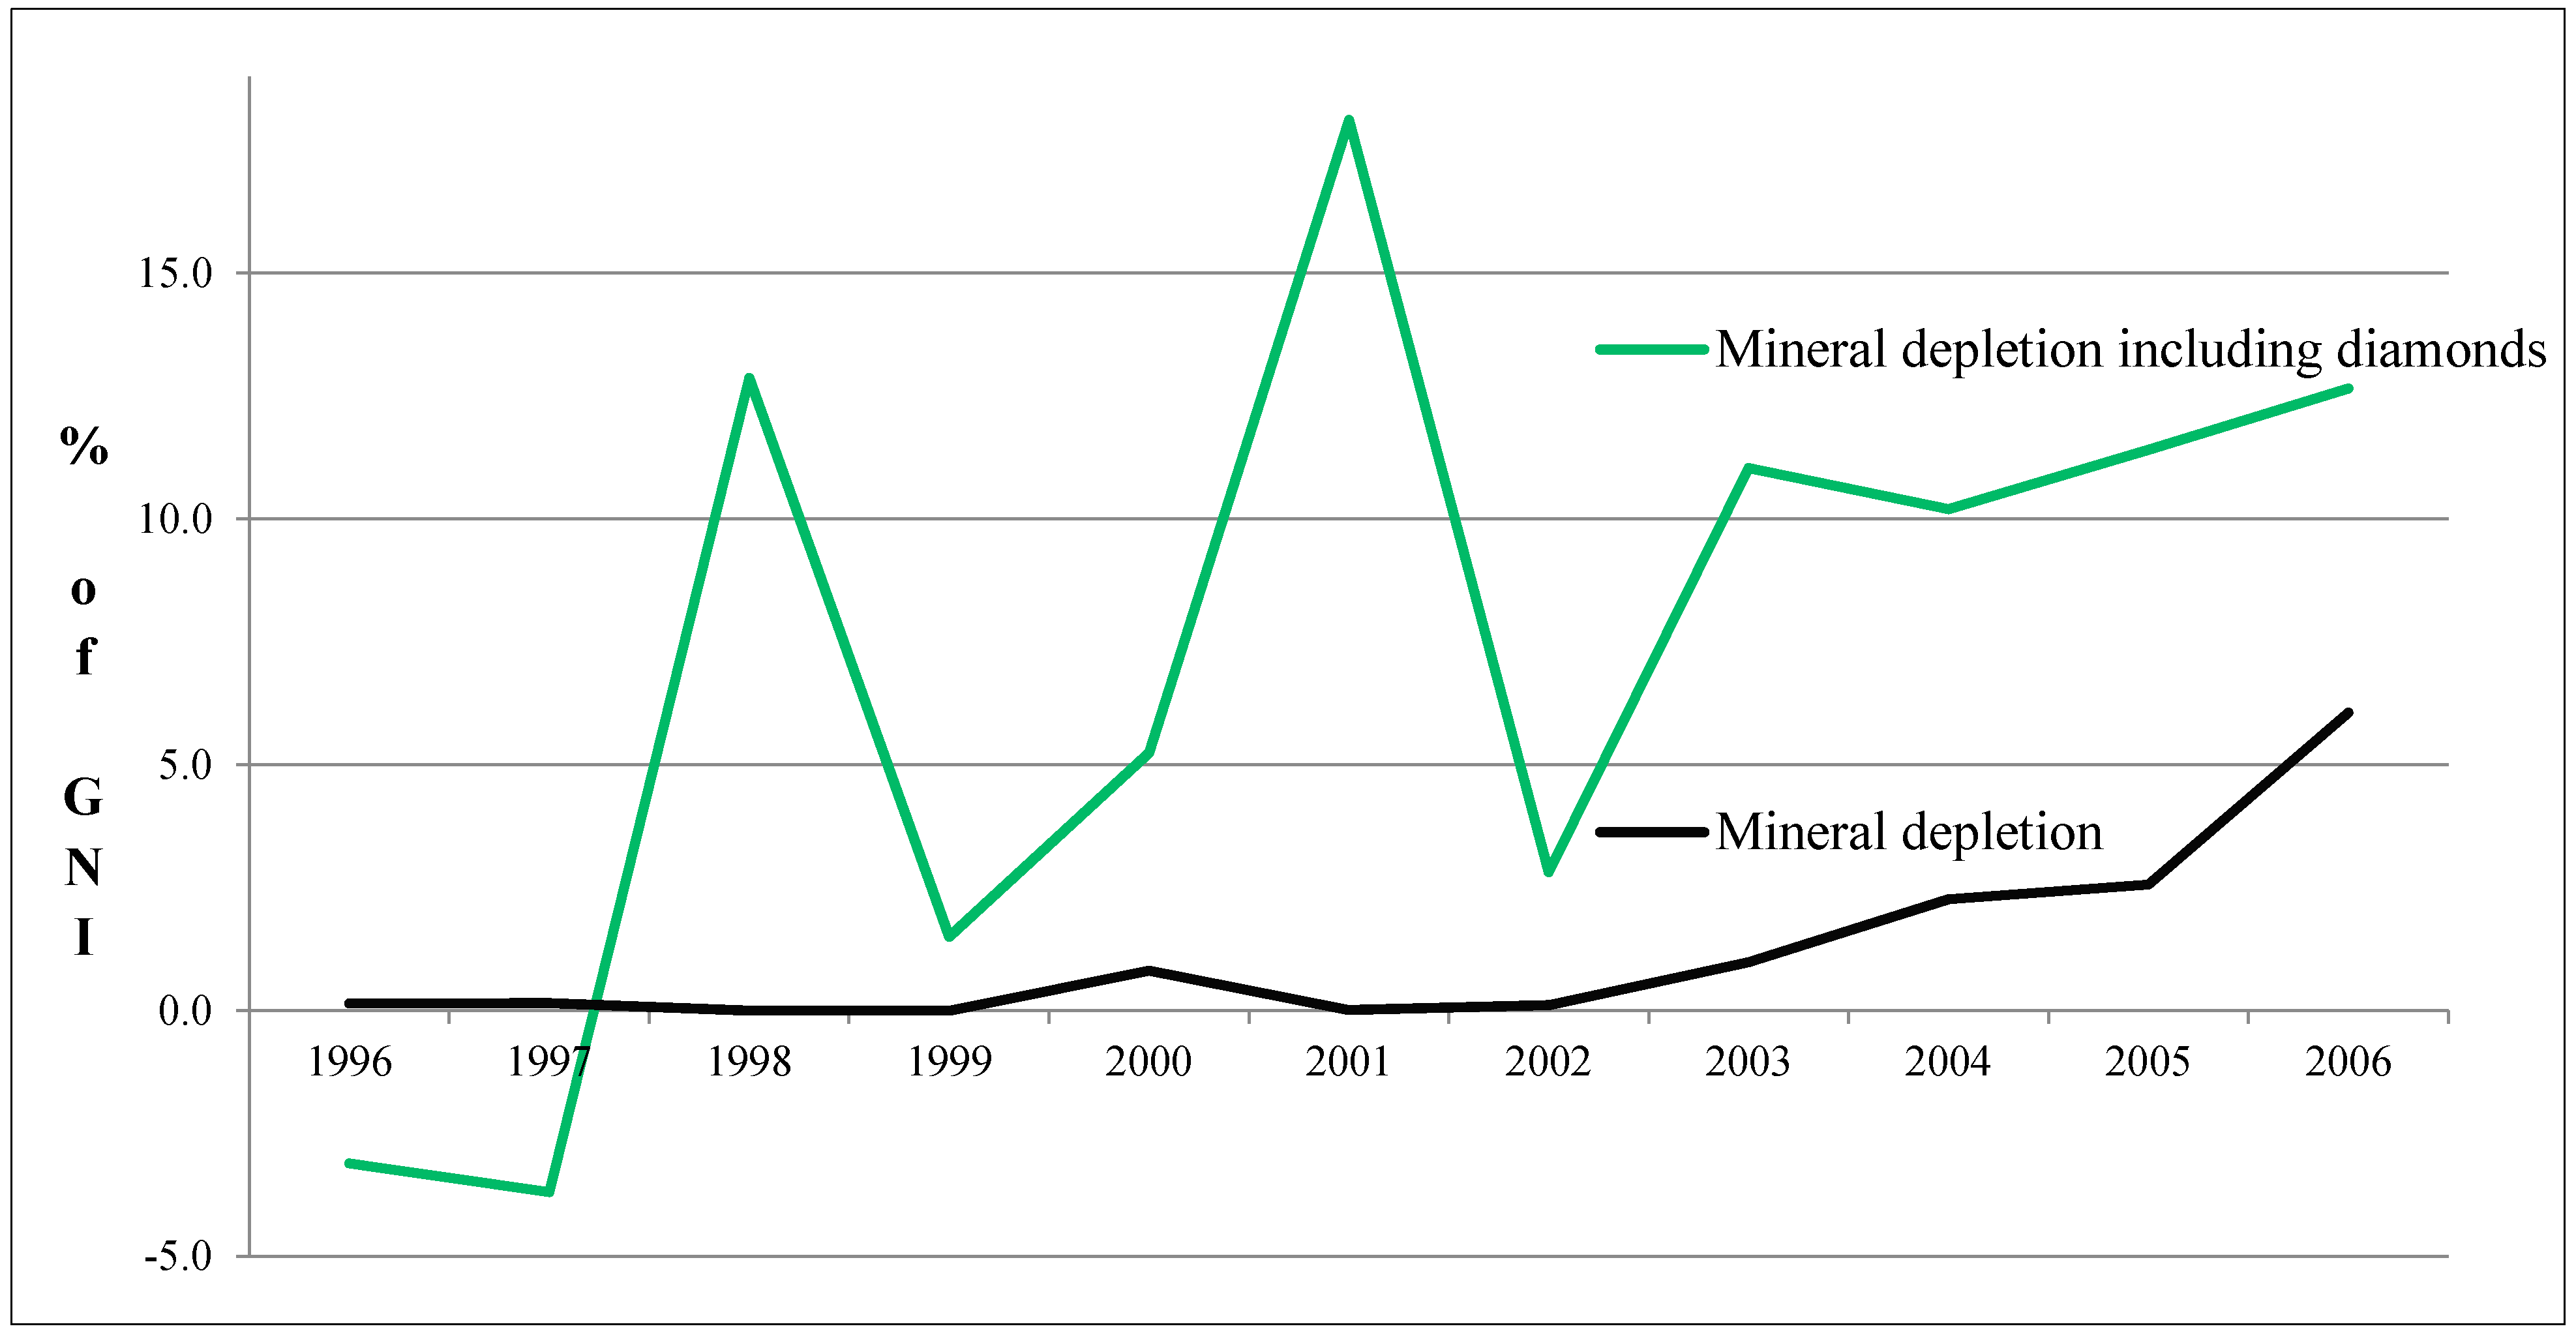
4.6.2. Metal and Mineral Depletion

Rents from metal and mineral depletion include the substances bauxite, copper, gold, iron, lead, nickel, phosphate, silver, tin and zinc calculated in the same manner as the aforementioned cases. To date, the following are omitted due to lack of sufficient data: platinum, chromium, molybdenum, fluorite, barytes, diamonds, natural abrasives, natural graphite and natural crystal. For most of these resources the Industrial Commodity Statistics Database provides US$ values for their production. Obtaining cost information remains more difficult. Most of these resources are depleted in significant amounts in a very limited number of countries. Since the same data problematic occurs as above, the merits of a survey of these resources should be discussed.
Platinum-group metals are only produced in 13 countries, which make them insignificant on a global scale but important for the GS of individual countries. For example, palladium, which had a weighted world market price of US$381 per troy ounce in 2008 and an insignificant world production value of around US$2 billion, is an important rent source for Russia (ca., US$1 billion of the country’s total metal and mineral rents of around US$13 billion) and South Africa (ca., US$890 million out of total rents of US$7 billion).
Diamonds especially serve as an important natural resource for countries such as Angola, Botswana, the Democratic Republic of Congo, Namibia, the Russian Federation, and South Africa [38]. However, there is no world market price for diamonds and production costs are difficult to obtain. Figure 14 and Figure 15 show the only example I was able to extract: The inclusion of diamond rents into the GS of Botswana between 1996 and 2006.
Figure 14. Mineral depletion of Botswana with and without diamonds between 1996 and 2006 (Own calculation and illustration with data from World Bank [53,54,107], the Bank of Botswana [108] and the Central Statistics Office of Botswana [109]).
Sustainability 07 04146 g014
Botswana’s GNI increases on average over this period due to higher diamond extraction rates and therefore growing resource rents which are not subtracted in GS. If I include diamond rents, GS decreases drastically. As this example shows, the GS rates of all six diamond producers is lacking an important component of natural capital, leading to an incorrect estimation of the changing wealth of these countries. For Botswana, GS could not seriously be seen as an indicator for “weak” sustainability without including rents from diamonds. As Figure 15 shows, in 2001, the official GS rate of Botswana even crossed the 50% mark. No other country has ever reached this threshold, and Botswana would not have been the exception, had the rents from diamond depletion been considered in the calculation. Botswana’s Central Statistics Office at least partially provides the data one would need to calculate the rents in Equation (12) for future research on the GS rate of the country.
Figure 15. GS of Botswana with and without diamonds between 1996 and 2006. (Own calculation and illustration with data from World Bank [53,54,107], the Bank of Botswana [108] and the UN Comtrade Database [110]).
Sustainability 07 04146 g015
For the benefit of countries that deplete natural resources to this extent, it would be important to include these values for δKN. If it is not possible to extract this data to achieve cross-sectional global or regional averages, national statistical offices, as in the case of Botswana, could at least provide approximate values for δKN to more realistically present their GS rates.

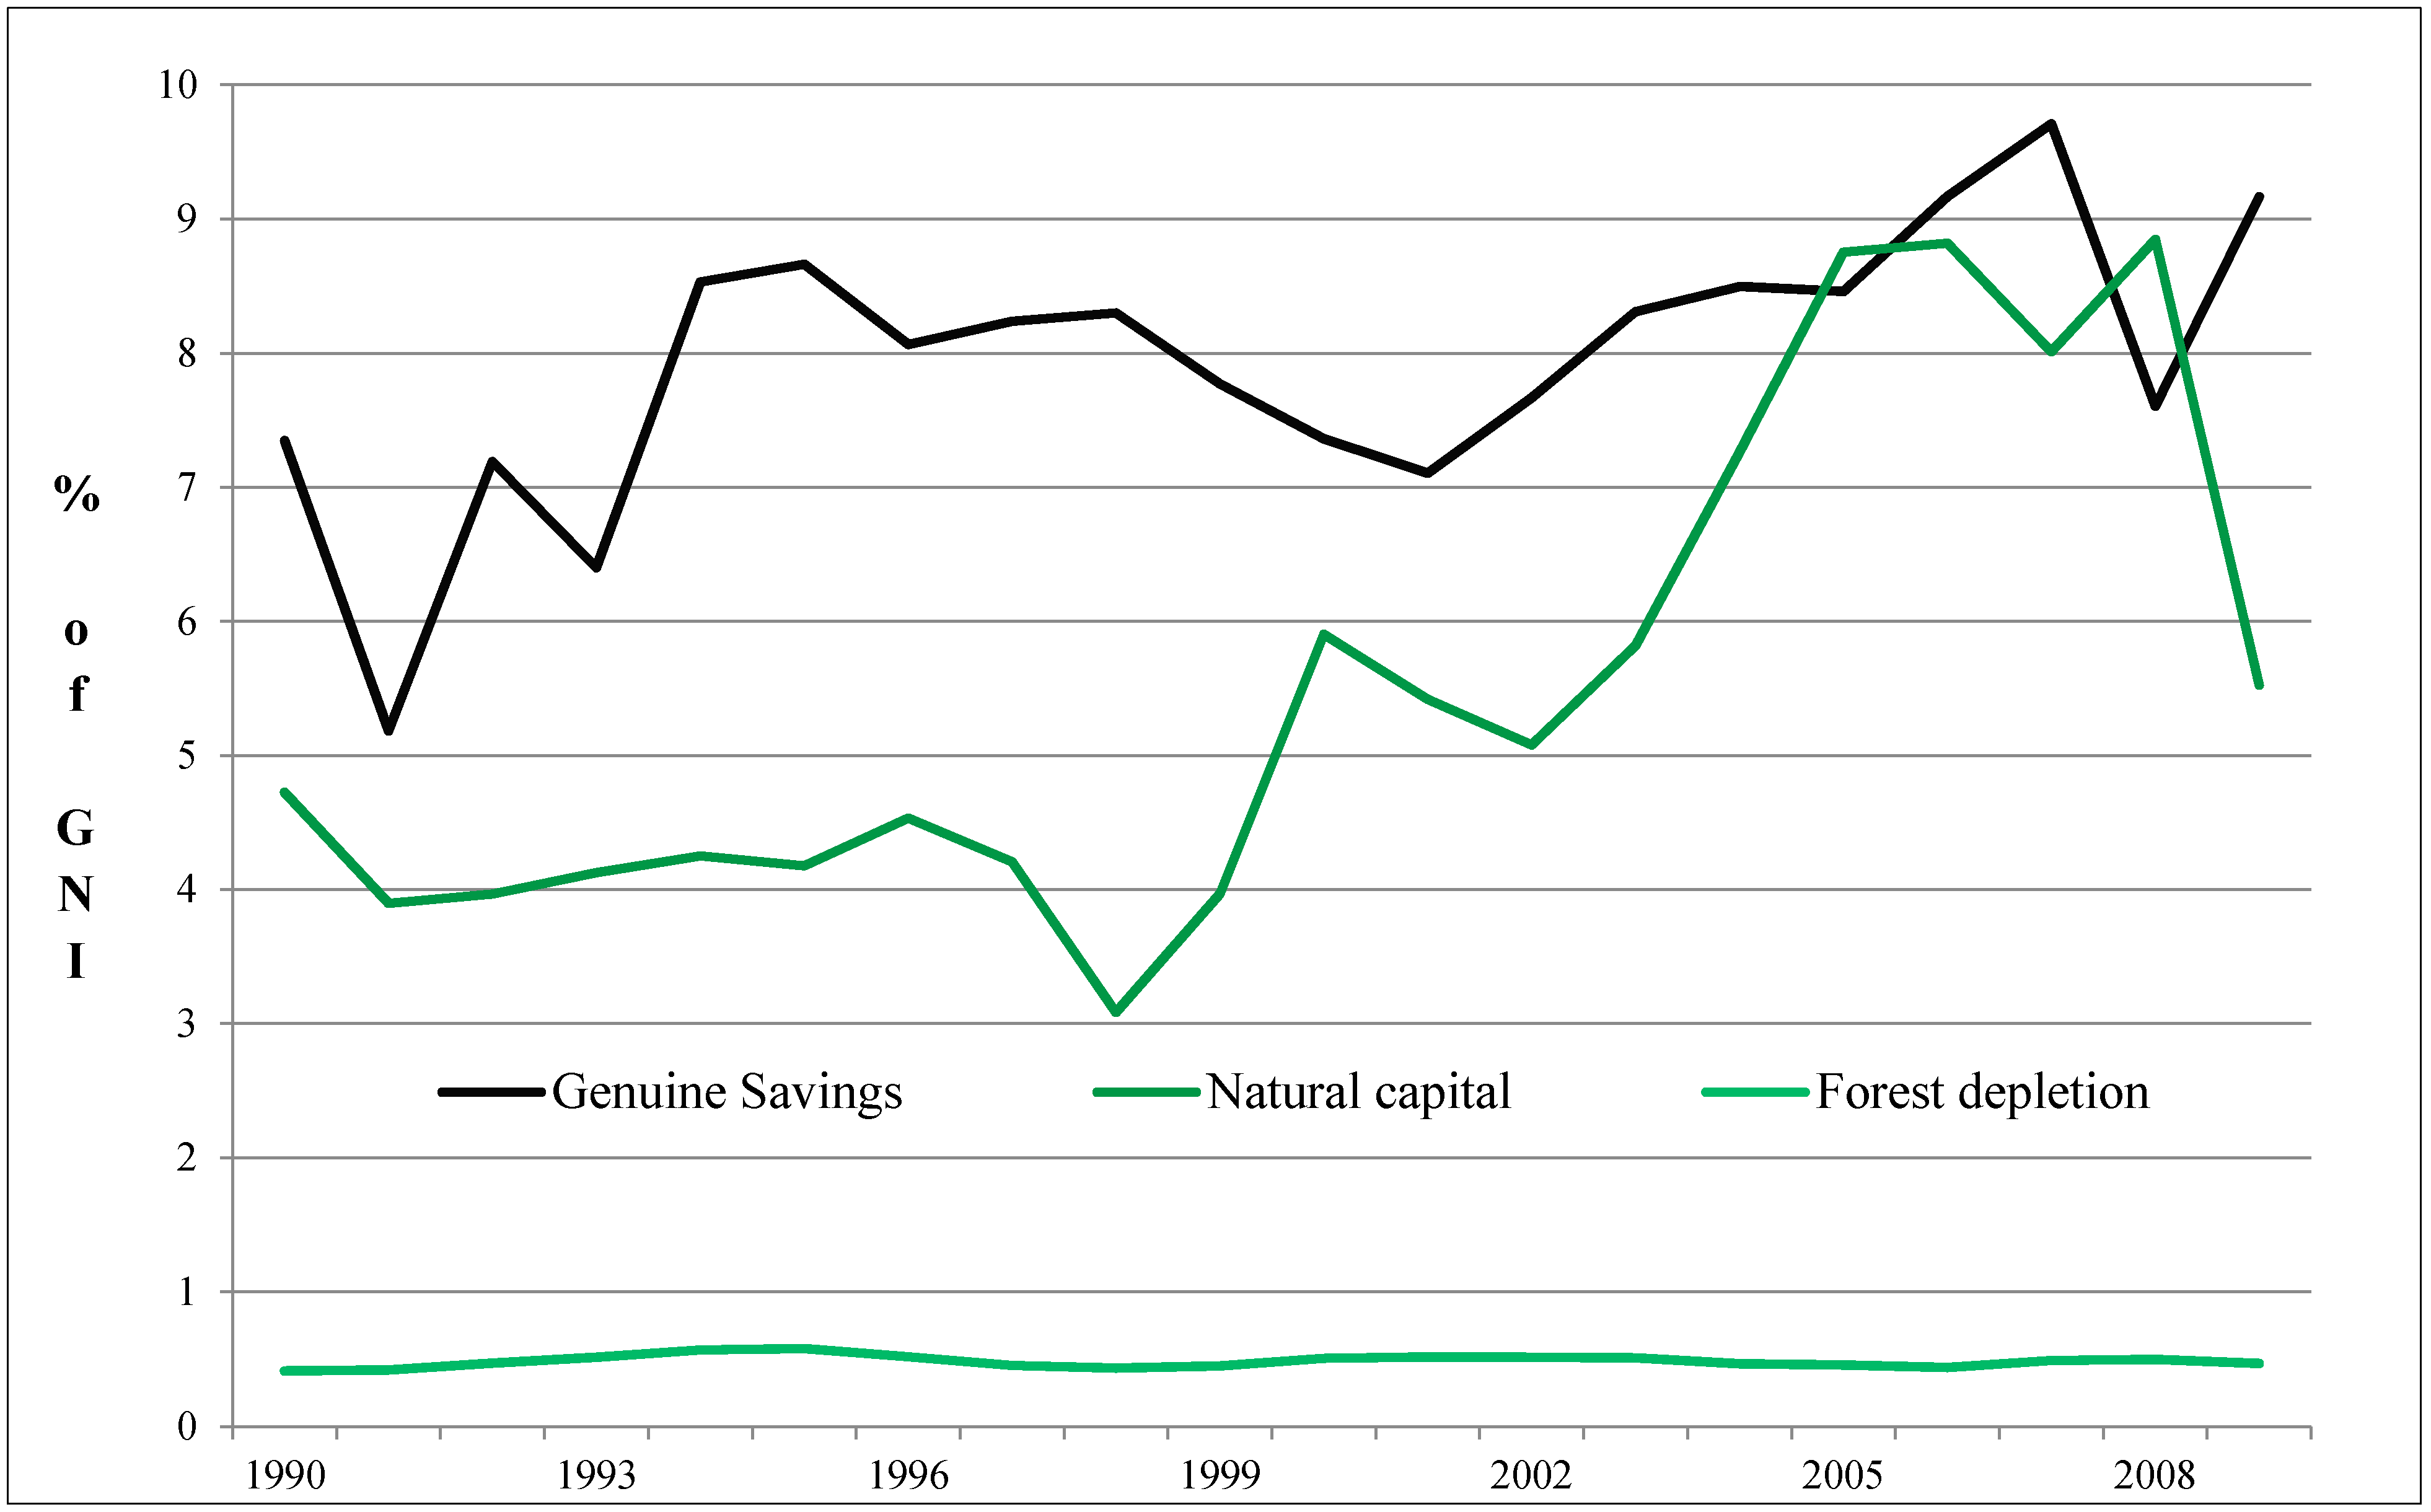
4.6.3. Net Forest Depletion

Carlowitz’s “Sylvicultura Oeconomica” [3], the first publication using the concept of sustainability, examined sustainable forestry with the clear rule of limiting depletion to a level below the new growth of timber resources. In the GS method of the World Bank, wood is the only renewable resource included. The Bank subtracts the present discounted value of net forest depletion (NFD):
N F D = ( r o u n d w o o d   p r o d u c t i o n i n c r e m e n t ) × P × r e n t a l   r a t e
If the first part in brackets is negative (positive growth rate) it is not included in GS (rather it is set to zero) [52]. The World Bank [53,54,107] principally argues that growth that is greater than harvesting should be a positive calculation component of natural capital, but that most of this growth is in economically forested areas which are farmed for later depletion and therefore do not signify a real increase in natural capital [39].
I argue otherwise. Despite the relative insignificance of timber resources on average globally, as Figure 16 shows, forests represent an important capital stock in some countries. Examples such as Burundi or Guinea in Figure 17 show that for some countries net forest depletion makes a noticeable difference in their GS rates (altogether, more than 15 countries deplete forest resources for more than 5% of their GNI). For the GS of these countries, this renewable resource is treated the same as all other exhaustible resources discussed above.
Figure 16. Natural capital and forest depletion between 1990 and 2009 (world average). (Own calculation and illustration with data from World Bank [53,54]).
Sustainability 07 04146 g016
As long as forest depletion outweighs growth, this is not critical for the calculation of GS. However, from the point where reforestation outnumbers depletion—for example by investment of rents from forest depletion in reforestation rather than infrastructure or education—this positive effect on natural capital does not factor into the current calculation. As a result, forest growth for economic reasons does not increase the natural capital stock, and if these are used to earn more rents from forest depletion in the future, the rents are again subtracted from GS. Therefore, in the worst possible situation rents from forest depletion are subtracted twice without factoring in the replenished stock.
As Figure 16 shows, the proportion of forest depletion was only around 0.5% globally in the 1990s and 2000s. In the same decades, the share of forest in the total land area increased by more than 0.5% in almost 50 countries. Obtaining data on forestation is rather difficult, but a fair indicator measuring the capital stock of a country should include this along with other renewable resources.
Figure 17. GS rates of Burundi and Guinea with and without forest depletion between 1990 and 2010 (Own calculation and illustration with data from World Bank [53,54]).
Sustainability 07 04146 g017
As an overall issue in the GS calculation, it is not possible to include the net changes of other forms of renewable natural capital on an annual basis due to the lack of data [39]. The net depletion of fresh water or land resources, soil erosion, and other factors such as biodiversity and fish stocks most likely significantly influence the natural capital stock of enough countries to include it in their GS rates [38]. The World Bank [39] includes selected components of natural capital that it is able to measure in the inventory of the total capital stock of over 120 countries, although it is not yet included on an annual basis. Building on Merlo and Croitoru [111], the Bank for example attributes US$129 per hectare in industrialized countries and US$27 in developing countries per annum for “(n)ontimber forest benefits such as minor forest products, hunting, recreation, and watershed protection” [39].
Fisheries especially provide a significant wealth stock for some countries. In Bangladesh, for example, the gross output from fisheries accounts for 3.9% of GDP, nearly 2% in Senegal, and over 4% in Vietnam. In Figure 17 I have shown the difference in GS rates of Guinea when excluding net forest depletion, whereas the GS of its neighboring countries would be greatly affected by the inclusion of rents from fisheries. According to the Fisheries and Aquaculture Department of the FAO [112,113], the net exports of fish products from Guinea-Bissau amount to US$5.8 million (in 1999) and those of Sierra Leone stand at US$9.7 million (in 2006).
These figures include additional income from net exports of the fishing industry. Production costs have not been subtracted and there is no data on the recovery of the fish stock. However, these two countries provide representative examples for the problem this creates: The GNI of Guinea-Bissau reached US$210 million (in 1999) and that of Sierra Leone amounted to US$1.8 billion (in 2006), therefore income from fisheries accounted for 2.8% and 0.5% of GNI respectively, while GS rates were negative.
The argument that fish stocks are mobile and not only difficult to measure but also difficult to assign to an individual country, is similar to the criticism of the inclusion of transboundary pollution. In the next section, I discuss the inclusion in the GS rate of damages by air pollution. The World Bank deducts air pollution from the GS of the emitting and not the affected country. The same discussion and arguments could apply to mobile resource stocks such as fish.

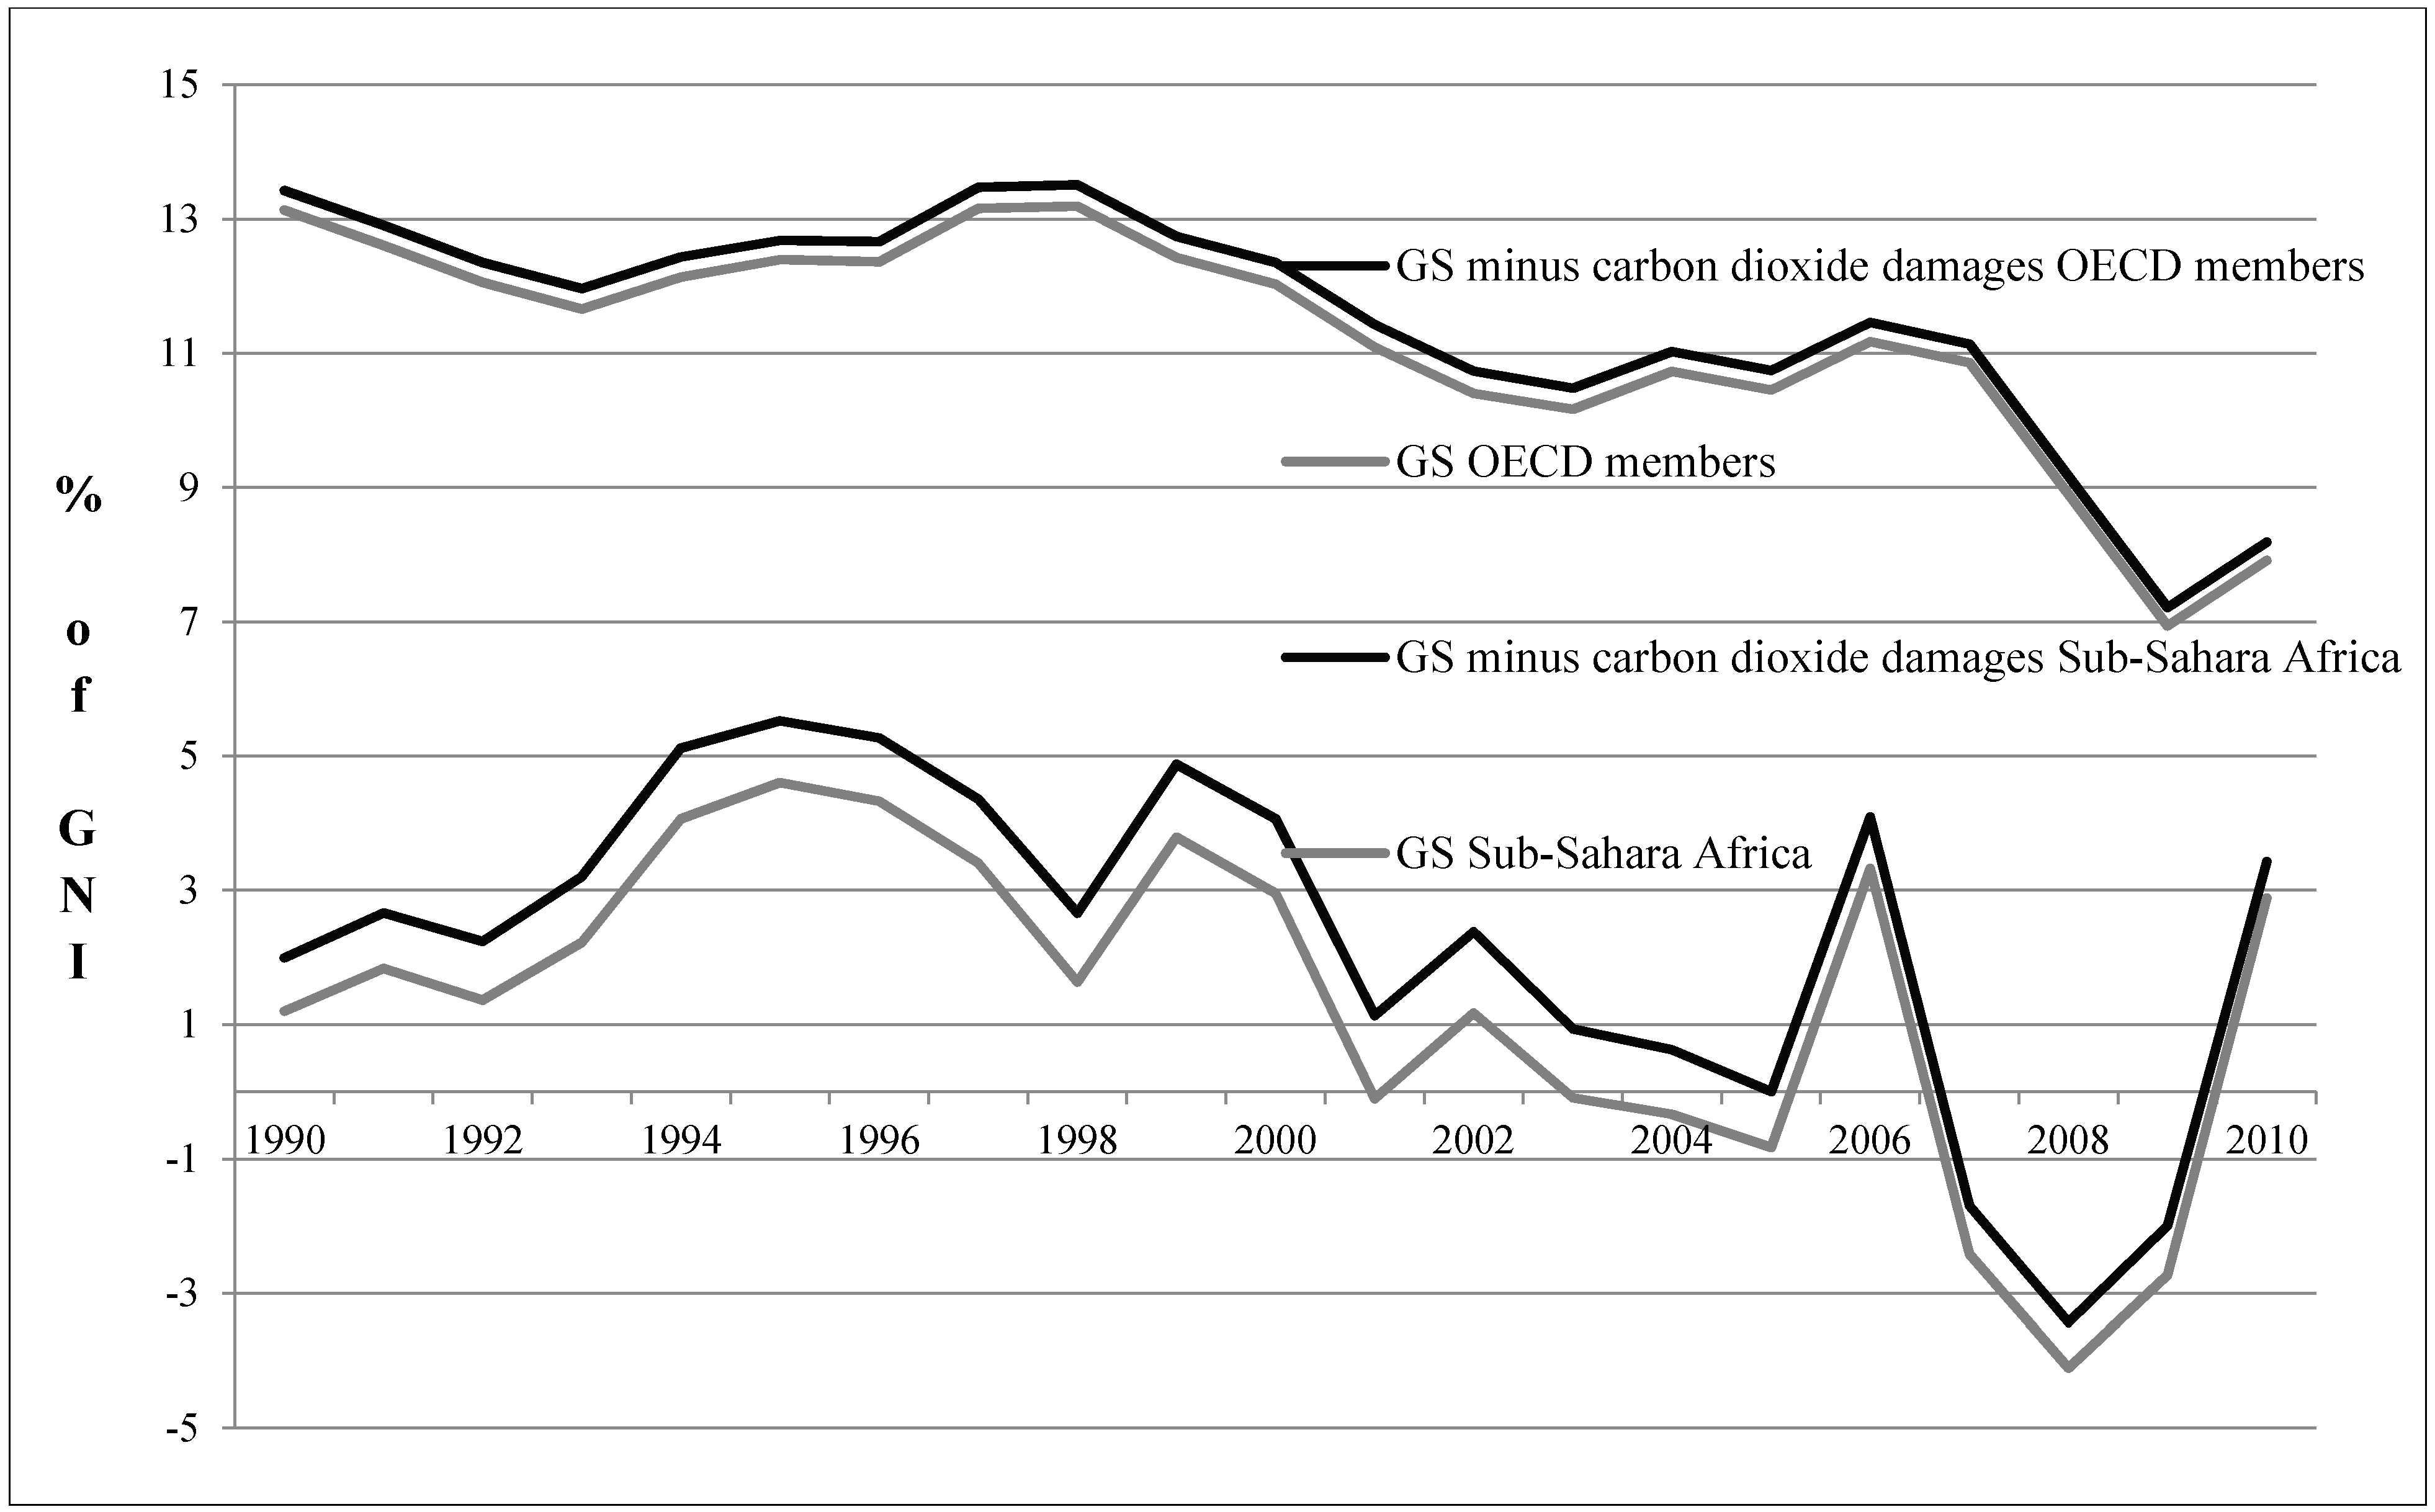
4.6.4. Air Pollution Damages

In Equations (7) and (14), I define total air pollution damages as social costs which negatively influence all other forms of capital and denote it as δNK. Hamilton [41] and Hamilton and Atkinson [65] define these negative influences, and thereby implicitly δNK, using abatement or defensive expenditures and argue that these are investments that “should be deducted in order to arrive at the measure of economic welfare” [41]. However, two decades after the first publications on GS only damages from carbon dioxide and particulate emissions are included. Marginal costs from CO2 damages are estimated at US$20 per ton of carbon (the unit damage in 1995 U.S. dollars) and particulate emission damage is estimated as the willingness to pay defensive expenditures to avoid mortality attributable to PM10 [38,39,53,54,107].
Dietz and Neumayer [1,2] criticize the lack of data on damages from other forms of pollution, such as sulphur dioxide or water contamination. Atkinson and Hamilton [35] provide a number of authors [114,115,116,117,118,119] that analyze possibilities to measure other forms of air and water pollution as environmental degradation. Pearce and Atkinson [37] or Hamilton and Clemens [36] address the depletion of natural capital. In these studies, sulfur dioxide (SO2), particulate matter (PM) and ground-level ozone (O3), nitrogen oxides (NOX), non-methane volatile organic compounds and carbon monoxide are shown as percentages of GNI.
In the case of the UK, the inclusion of air pollutants would lower the GS rate in 2000 by 10% [35]. Ferreira and Moro [120] show that through the inclusion of SO2 and NOX in Ireland’s GS rate for the decade between 1995 and 2005, only two years remain positive. They conclude that this is disturbing since SO2 and NOx values in Ireland are low relative to other countries.
Thus, the ongoing discussion on the inclusion of pollution damages in the calculation of GS should include a detailed survey on pollutants and the possibilities to express them in monetary terms. Similar to the discussion above on energy and mineral resources as well as the depletion of forests or other renewable parts of a countries natural capital, it should be possible to include a certain level of pollution damages as social costs. Otherwise, GS only appears as an imperfect and fragmented attempt to fill a theoretical model with real data that includes extractable data and excludes all other considerations.
Ferreira and Vincent [78] consider carbon dioxide as causing global damage and not depleting the natural capital of the emitting country, however it is rare to find a fundamental critique of the decision to include damages from air pollution in an indicator measuring a country’s specific capital stock. Cross-border pollution is discussed in literature by Dietz and Neumayer [1,2] and Neumayer [21], among others. However, it does not receive significant attention. The common opinion—also by the World Bank itself [38,39]—is that the “polluter pays principle” applies to the calculation of GS rates. The metadata description of the World Bank [121] defines the present value of “the marginal social cost per unit multiplied by the increase in the stock of carbon dioxide (…) (as) global damage to economic assets and to human welfare over the time the unit of pollution remains in the atmosphere”. Pollution in the atmosphere follows to a certain extent the argument by Ferreira and Vincent [78] that carbon dioxide causes global damages by reducing the performance of the atmosphere as a natural (or social) capital stock from which these services result. One could ask which global damage results from pollution and distribute it between countries based on their size or proportion of global income, but to date there is no suggestion that includes a practical solution to this problem.
If one looks at the case of resource-abundant countries that suffer from the so-called Resource Curse, negative GS rates not only show that the exporting country is not investing the rents from natural resource depletion well enough. They also implicitly demonstrate that the importing consumers do not adjust for the extra pressure on the natural capital of the depleting country, with the exception of paying the world market price of the resource (at least in the calculation method of GS, as seen in Equations (12) and (13)). There are arguments that importing countries should somehow be debited for the depletion of natural capital of exporting countries. In addition, in the same line of argumentation, transboundary pollution is especially seen as damage that should be adjusted within the GS calculation [65].
The “polluter pays principle” is a sound way to hold countries responsible for the damage they cause to global capital, and here I explicitly refer to total rather than natural capital. However, GS is an indicator for “weak” sustainability in terms of capital formation within countries. Resource-dependent and exporting countries should use their extra income from depleted natural capital to invest more in physical and human capital [1,2] or renewable natural capital, as proposed above. In addition, while the measurement of CO2 emissions especially seems a simple proxy for environmental offenses by individual countries, there are other methods, such as carbon footprints, to further approximate environmental damage.
Therefore, I hold the opinion that an indicator measuring the development of the total capital stock of a country should only measure the stock within the country and not transboundary pollution damages, which reduce natural capital on a different level than the depletion of sellable natural resources. If it were possible to individually measure the loss of depletion rents, for example, from the negative influence of Polish emissions on Swedish forests, then one could discuss this theoretical problem on another level. However, since the calculation of GS rates can only use assumptions about the social costs a polluting country causes, GS does not include depletion of natural capital within a country but rather assigns a debt based on global damages.
However, Figure 18 shows GS rates using the example of OECD members and those of Sub-Saharan Africa with and without carbon dioxide damages. In the case of OECD countries, the differences are insignificant. The difference for Sub-Saharan Africa is higher than for the OECD countries since emissions have greater weight at a lower level of GS. Nevertheless, even this difference can be considered insignificant in terms of the broader results GS shows. I would suggest that the World Bank [121] provide a version of GS within its “World Development Indicators” with and without emission damages or other environmental degradation that goes beyond classical resource depletion. This would allow users to decide between a lean, capital-based version and one including abatement costs.
Figure 18. GS rates of OECD members and Sub-Sahara Africa with and without carbon dioxide damages between 1990 and 2010. (Own calculation and illustration with data from World Bank [53,54]).
Sustainability 07 04146 g018

5. Conclusions

As stated in the introduction, this paper intends to provide an overview of the theoretical and methodological discussion on GS as the most important and developed indicator for “weak” sustainability. I discuss this indicator critically and suggest possible modifications.
In Section 3, I explain the calculation method in detail and recommend denoting the damages from air pollution independently from other forms of natural capital depletion by δNK. Based on my observations, there is a clear difference between the depleted natural capital δKN within a country and transboundary pollution damages δNK which are only ascribed to the emitting country even though parts of this pollution contribute to capital depletion on a global scale. I would also suggest a separation of exhaustible and renewable natural capital, in the case that factors beyond the value of net forest depletion are included. If growth of renewable natural capital exceeds depletion, it could then show a positive effect of re-investment of rents from natural capital in further natural capital and not only other forms. The substitution of non-renewable resources with renewable resources would then also provide a positive effect on GS, similar to investments in physical or human capital. This would therefore serve as a more accurate indicator for countries acting more responsibly than others.
In Section 4, I begin with a discussion spearheaded by various authors about the difference between total and per capita GS. I argue alongside Hamilton [68,73] that the World Bank could use Equation (17) to calculate and present per capita GS until yearly values of wealth stocks are available. Similar to the calculation of the usual indicators GDP/GNI, calculations could be modified to divide total GS by midyear population as a starting point. Additionally, I suggest a “weak” sustainability index in Equation (18) which includes GS and population growth and would provide a simple inclusion for the World Bank in its “World Development Indicators” [53,54,121].
In Section 4.3, I discuss variable ToT within the context of continuously changing world market prices of “exported” natural capital and “imported” consumption and capital goods. While most authors, such as Sachs and Warner [82], come to the conclusion that increasing ToT positively influence a country’s income, I follow Boos and Holm-Müller which show theoretically [85] and empirically [84] that δKNKP changes in the same direction as a country’s ToT. However, while it is an important point that ToT and GS demonstrate a negative relationship, the most important problem is their joint volatility and the resulting uncertainties. I recommend flattening the variable δKN by using five-year averages for the calculated rents in Equation (12) to adjust GS rates for the extreme volatility of natural resource prices.
In Section 4.4 and Section 4.5, I discuss the subtraction of consumption from GNI. I suggest surveying and discussing durable consumption goods that could be considered positive investments in physical capital rather than negative parts of the GS calculation. However, until a detailed survey has been conducted at least a certain percentage could be removed from consumption for goods that are more investment-oriented than consumption-driven. In the case of current education expenditures, the World Bank deducts 10% for investments in school buildings and the like; the same could be done for total consumption. Additionally, I suggest a discussion of the exclusion of military and other defensive investments whose contribution to sustainable development is at least subject to discussion.
After reducing GNI by consumption and the depreciation of physical capital, the World Bank adds current education expenditures as an indicator for investment in human capital. I briefly discuss the depreciation of human capital in countries where the life expectancy lies below the international retirement age of 65. However, since I follow the argument that education expenditures used for the calculation of GS rates tend to underestimate real investments in human capital, this serves to substantiate the argument that health expenditures also increase KH. I show that the inclusion of health expenditures would increase KH and therefore average global GS by almost 5% for the years 2003 to 2007.
After adjusting for education expenditures the World Bank subtracts the rents of natural resources and damages by air pollution to indicate depletion of natural capital. To more completely capture natural capital, I propose the inclusion of natural resources such as peat, uranium or diamonds, and I show their influence on the GS of individual countries. In particular, the inclusion of diamond rents in the GS of Botswana stands out in these examples, since the country’s GS would decrease by an average of 33% of GNI between 1996 and 2006. However, the example of uranium in Namibia or Niger also serves as a remarkable reminder that the GS calculation misses natural resources important for the capital stock of some countries. The World Bank concedes this gap of exhaustible natural resources in KN and aims to continuously extend it [38,39]. Simultaneously, I suggest including renewable parts of natural capital the World Bank is able to calculate, and allow for positive values if the renewed share is higher than the depleted portion.
The inclusion of air pollution is discussed from two viewpoints: on the one hand considering a broader base of pollution damages than only CO2 and PM10, or on the other hand concentrating on pure natural resource depletion and excluding emissions completely. While the first is mostly investigated by the World Bank itself, the discussion as to whether the GS calculation should include pollution damages is mainly carried out outside the Bank. Aside from consideration of carbon dioxide emissions as causing global damage or only depleting the natural capital of a single emitting country, I request a discussion on the merits of including emissions. I argue that GS is an indicator for “weak” sustainability in terms of capital formation within countries with the purpose of showing the handling and re-investment of extra income from depleted natural capital. Therefore, I hold the opinion that an indicator measuring the development of the total capital stock should only measure the real stock excluding pollution damages, which reduce natural capital on a different level than the depletion of sellable natural resources. Since this discussion is not likely to reach consensus promptly if ever, I suggest that the World Bank [121] provide a version of GS with and without emissions damages. Therefore, I hold the opinion that an indicator measuring the development of the total capital stock of a country should only measure the stock within the country and not transboundary pollution damages, On the whole, I recommend more detailed research on the relationship between the Resource Curse and GS rates of resource-dependent countries that suffer most from volatile world market prices, as knowing more about the determinants influencing GS could help to extend its applicability.
However, none of these arguments provide an overarching answer. In contrast, this paper should serve as a call to discuss these topics more thoroughly. GS is by far the most developed and discussed indicator to measure sustainability in monetary terms and could therefore serve as a complement to other common economic indicators. The calculation method for GDP is also constantly discussed and in the case of the European Union even adapted recently. What prevents us from using GS (in the two different versions) as an additional indicator for the state of the world and have it one day as a headline indicator next to a country’s GDP?

Acknowledgments

The author wishes to thank Karin Holm-Müller from the Institute for Food and Resource Economics at the University of Bonn for the supervision of this research project.

Author Contributions

Adrian Boos is responsible for the research design, literature and data analysis, and drafting of the manuscript.

Conflicts of Interest

The author declares no conflict of interest.

References

  1. Dietz, S.; Neumayer, E. Genuine Savings: A critical analysis of its policy-guiding value. Int. J. Environ. Sustain. Dev. 2004, 3, 276–292. [Google Scholar] [CrossRef]
  2. Dietz, S.; Neumayer, E. A critical appraisal of genuine savings as an indicator of sustainability. In Sustainable Development Indicators in Ecological Economics. Current Issues in Ecological Economics; Lawn, P., Ed.; Edward Elgar: Cheltenham, UK, 2006; pp. 117–138. [Google Scholar]
  3. Carlowitz, H.C. Sylvicultura Oeconomica, 2nd ed.; Kessel: Leipzig, Germany, 2009. [Google Scholar]
  4. Malthus, T. An Essay on the Principle of Population; J. Johnson: London, UK, 1798. [Google Scholar]
  5. Rao, P.K. Sustainable Development; Blackwell: Malden, MA, USA, 2000; pp. 1–30. [Google Scholar]
  6. Elliott, J.A. An Introduction to Sustainable Development, 3rd ed.; Routledge: London, UK, 2006; pp. 7–43. [Google Scholar]
  7. Rogers, P.P.; Jalal, K.F.; Boyd, J.A. An Introduction to Sustainable Development; Earthscan: London, UK; Sterling, VA, USA, 2008; pp. 20–41. [Google Scholar]
  8. Meadows, D.H. The Limits to Growth, a Report for the Club of Rome’s Project on the Predicament of Mankind; Universe Books: New York, NY, USA, 1972. [Google Scholar]
  9. Dasgupta, P.; Heal, G. The Optimal Depletion of Exhaustible Resources. Rev. Econ. Stud. 1974, 41, 3–28. [Google Scholar] [CrossRef]
  10. Solow, R.M. Intergenerational Equity and Exhaustible Resources. Rev. Econ. Stud. 1974, 41, 29–45. [Google Scholar] [CrossRef]
  11. Solow, R.M. The Economics of Resources or the Resources of Economics. Am. Econ. Rev. 1974, 64, 29–45. [Google Scholar]
  12. Stiglitz, J. Growth with Exhaustible Natural Resources: Efficient and Optimal Growth Paths. Rev. Econ. Stud. 1974, 41, 123–137. [Google Scholar] [CrossRef]
  13. Pezzey, J. Sustainability: An Interdisciplinary Guide. Environ. Values 1992, 1, 321–362. [Google Scholar] [CrossRef]
  14. Hartwick, J.M. Intergenerational Equity and the Investing of Rents from Exhaustible Resources. Am. Econ. Rev. 1977, 67, 972–974. [Google Scholar]
  15. Harris, J.M. A Survey of Sustainable Development. Social and Economic Dimensions; Island Press: Washington, DC, USA, 2001. [Google Scholar]
  16. Atkinson, G.; Dietz, S.; Neumayer, E. Handbook of Sustainable Development; Elgar: Cheltenham, UK, 2008. [Google Scholar]
  17. Pezzey, J.; Toman, M.A. The economics of sustainability: A Review of Journal Articles. In Discussion Paper 02–03; Resources for the Future: Washington, DC, USA, 2002. [Google Scholar]
  18. World Commission on Environment and Development. Our Common Future; Oxford University Press: Oxford, UK; New York, NY, USA, 1987. [Google Scholar]
  19. Baker, S. Sustainable Development; Routledge: London, UK; New York, NY, USA, 2006. [Google Scholar]
  20. Bell, S.; Morse, S. Sustainability Indicators. Measuring the Immeasurable? 2nd ed.; Earthscan: London, UK; Sterling, VA, USA, 2008. [Google Scholar]
  21. Neumayer, E. Weak versus Strong Sustainability: Exploring the Limits of Two Opposing Paradigms, 3rd ed.; Edward Elgar: Cheltenham, UK, 2010. [Google Scholar]
  22. Pearce, D.W.; Markandya, A.; Barbier, E. Blueprint for a Green Economy; Earthscan: London, UK, 1989. [Google Scholar]
  23. Daly, H.E. Steady-State Economics, 2nd ed.; Earthscan: London, UK, 1992. [Google Scholar]
  24. Ayres, R.U. On the practical limits to substitution. Ecol. Econ. 2007, 61, 115–128. [Google Scholar] [CrossRef]
  25. Hartwick, J.M. Investing returns from depleting renewable resource stocks and intergenerational equity. Econ. Lett. 1978, 1, 85–88. [Google Scholar] [CrossRef]
  26. Hartwick, J.M. Natural resources, national accounting and economic depreciation. J. Public Econ. 1990, 43, 291–304. [Google Scholar] [CrossRef]
  27. Hartwick, J.M. Notes on Economic Depreciation of Natural Resource Stocks and National Accounting. In Approaches to Environmental Accounting, Proceedings of the IARIW Conference on Environmental Accounting; Franz, A., Stahmer, C., Eds.; Physica: Heidelberg, Gemany, 1993; pp. 167–198. [Google Scholar]
  28. Hartwick, J.M. Constant Consumption Paths in Open Economies with Exhaustible Resources. Rev. Int. Econ. 1995, 3, 275–283. [Google Scholar] [CrossRef]
  29. Solow, R.M. On the Intergenerational Allocation of Natural Resources. Scan. J. Econ. 1986, 88, 141–149. [Google Scholar] [CrossRef]
  30. Solow, R.M. Sustainability: An Economist’s Perspective. In Eighteenth J. Steward Johnson Lecture to the Marine Policy Center; Woods Hole Oceanographic Institution: Woods Hole, MA, USA, 14 June 1991; pp. 179–187. [Google Scholar]
  31. Solow, R.M. An almost practical step toward sustainability. Resour. Policy 1993, 19, 162–172. [Google Scholar] [CrossRef]
  32. Hartwick, J.M. What would Solow Say? J. Natl. Resour. Policy Res. 2009, 1, 91–96. [Google Scholar] [CrossRef]
  33. Hartwick, J.M. Sustainable consumption programs. In Handbook of Environmental Accounting; Aronsson, T., Lofgren, K.G., Eds.; Edward Elgar Publishing: Northhampton, MA, USA, 2010; pp. 207–236. [Google Scholar]
  34. Costanza, R.; Daly, H.E. Natural Capital and Sustainable Development. Conserv. Biol. 1992, 6, 37–46. [Google Scholar] [CrossRef]
  35. Atkinson, G.; Hamilton, K. Progress along the path: Evolving issues in the measurement of genuine saving. Environ Resour. Econ. 2007, 37, 43–61. [Google Scholar] [CrossRef]
  36. Hamilton, K.; Clemens, M. Genuine Savings Rates in Developing Countries. World Bank Econ. Rev. 1999, 13, 333–356. [Google Scholar] [CrossRef]
  37. Pearce, D.W.; Atkinson, G.D. Capital theory and the measurement of sustainable development: An indicator of “weak” sustainability. Ecol. Econ. 1993, 8, 103–108. [Google Scholar] [CrossRef]
  38. World Bank (Ed.) Where is the Wealth of Nations? Measuring Capital for the 21st Century; World Bank: Washington, DC, USA, 2006.
  39. World Bank (Ed.) The Changing Wealth of Nations. Measuring Sustainable Development in the New Millennium; World Bank: Washington, DC, USA, 2011.
  40. Hamilton, K. Green adjustments to GDP. Resour. Policy 1994, 20, 155–168. [Google Scholar] [CrossRef]
  41. Hamilton, K. Pollution and Pollution Abatement in the National Accounts. Rev. Income Wealth 1996, 42, 13–33. [Google Scholar] [CrossRef]
  42. Pearce, D.; Hamilton, K.; Atkinson, G. Measuring sustainable development: Progress on indicators. Environ. Dev. Econ. 1996, 1, 85–101. [Google Scholar] [CrossRef]
  43. Atkinson, G.; Dubourg, R.; Hamilton, K.; Munasinghe, M.; Pearce, D.; Young, C. Measuring Sustainable Development: Macroeconomics and Environment; Edward Elgar: Cheltenham, UK, 1997. [Google Scholar]
  44. Atkinson, G. Re-thinking Economic Progress. World Econ. 2000, 1, 153–166. [Google Scholar]
  45. Hartwick, J.M. “Net Investment” and Sustainability. Natl. Resour. Model. 2003, 16, 145–160. [Google Scholar] [CrossRef]
  46. Dietz, S.; Neumayer, E.; Soysa, I. Corruption, the resource curse and genuine saving. Environ. Dev. Econ. 2007, 12, 33–53. [Google Scholar] [CrossRef] [Green Version]
  47. Hamilton, K.; Atkinson, G.; Pearce, D. Genuine Savings as an Indicator of Sustainability; CSERGE Working Paper GEC 97–03 GEC97; GSERGE: Norwich, UK, 1997. [Google Scholar]
  48. Hartwick, J.M.; Long, N.V.; Tian, H. On the Peaking of Consumption with Exhaustible Resources and Zero Net Investment. Environ. Resour. Econ. 2003, 24, 235–244. [Google Scholar] [CrossRef]
  49. Hamilton, K.; Atkinson, G. Wealth, Welfare and Sustainability: Advances in Measuring Sustainable Development; Edward Elgar Publishing Limited: Cheltenham, UK, 2006. [Google Scholar]
  50. Pezzey, J. One-sided sustainability tests with amenities, and changes in technology, trade and population. J. Environ. Econ. Manag. 2004, 48, 613–631. [Google Scholar] [CrossRef]
  51. Hamilton, K. Genuine Savings as a Sustainability Indicator. In Frameworks to Measure Sustainable Development. An OECD Expert Workshop; OECD, Ed.; OECD: Paris, France, 2000; pp. 65–77. [Google Scholar]
  52. Bolt, K.; Matete, M.; Clemens, M. Manual for Calculating Adjusted Net Savings; World Bank: Washington, DC, USA, 2002. [Google Scholar]
  53. World Bank (Ed.) World Development Indicators 2012; World Bank: Washington, DC, USA, 2012.
  54. World Development Indicators. Available online: http://data.worldbank.org/data-catalog/world-development-indicators (accessed on 16 November 2014).
  55. Fankhauser, S. The economic costs of global warming damage: A survey. Glob. Environ. Change 1994, 4, 301–309. [Google Scholar] [CrossRef]
  56. Soysa, I.; Bailey, J.; Neumayer, E. Free to Squander? Democracy and Sustainable Development, 1975–2000. In Global Environmental Change and Human Security; Matthew, R.A., Ed.; MIT Press: Cambridge, UK, 2010; pp. 262–289. [Google Scholar]
  57. Neumayer, E. Weak versus Strong Sustainability. Exploring the Limits of Two Opposing Paradigms; Edward Elgar: Cheltenham, UK, 1999. [Google Scholar]
  58. Neumayer, E. Weak versus Strong Sustainability: Exploring the Limits of Two Opposing Paradigms, 2nd ed.; Edward Elgar: Cheltenham, UK, 2003. [Google Scholar]
  59. Beckerman, W. ‘Sustainable Development’: Is it a Useful Concept? Environ. Values 1994, 3, 191–209. [Google Scholar] [CrossRef]
  60. Beckerman, W. How would you Like your ‘Sustainability’, Sir? Weak or Strong? A Reply to my Critics. Environ. Values 1995, 4, 169–179. [Google Scholar] [CrossRef]
  61. Jacobs, M. Sustainable Development, Capital Substitution and Economic Humility: A Response to Beckerman. Environ. Values 1995, 4, 57–68. [Google Scholar]
  62. Daly, H.E. On Wilfred Beckerman’s Critique of Sustainable Development. Environ. Values 1995, 4, 49–55. [Google Scholar] [CrossRef]
  63. Neumayer, E. Scarce or abundant? The Economics of Natural Resource Availability. J. Econ. Surv. 2000, 14, 307–335. [Google Scholar] [CrossRef] [Green Version]
  64. Simpson, R.D.; Toman, M.A.; Ayres, R.U. Scarcity and Growth Revisited: Natural Resources and the Environment in the New Millennium; Resources for the Future: Washington, DC, USA, 2005. [Google Scholar]
  65. Hamilton, K.; Atkinson, G. Air pollution and green accounts. Valuing air pollution damage. Energy Policy 1996, 24, 675–684. [Google Scholar] [CrossRef]
  66. Hamilton, K.; Hartwick, J.M. Investing exhaustible resource rents and the path of consumption. Can. J. Econ. 2005, 38, 615–621. [Google Scholar] [CrossRef]
  67. Hamilton, K.; Bolt, K. Genuine saving as an indicator of sustainability. In Handbook of Sustainable Development; Atkinson, G., Dietz, S., Neumayer, E., Eds.; Edward Elgar: Cheltenham, UK, 2008. [Google Scholar]
  68. Hamilton, K. Sustaining Economic Welfare: Estimating Changes in Total and Per Capita Wealth. Environ. Dev. Sustain. 2003, 5, 419–436. [Google Scholar] [CrossRef]
  69. Dasgupta, P. Human Well-being and the Natural Environment; University Press: Oxford, UK; New York, NY, USA, 2001. [Google Scholar]
  70. Arrow, K.J.; Dasgupta, P.; Goulder, L.H.; Mumford, K.J.; Oleson, K. Sustainability and the measurement of wealth. Environ. Dev. Econ. 2012, 17, 317–353. [Google Scholar] [CrossRef]
  71. Dasgupta, P. Valuing Objects and Evaluating Policies in Imperfect Economies. Econ. J. 2001, 111, 1–29. [Google Scholar] [CrossRef]
  72. Dasgupta, P.; Mäler, K.G. Wealth as a Criterion for Sustainable Development; University of Cambridge and Beijer International Institute of Ecological Economics: Stockholm, Sweden, 2001. [Google Scholar]
  73. Hamilton, K. Sustaining per Capita Welfare with Growing Population: Theory and Measurement; Paper Presented at the Second World Congress of Environmental and Resource Economists. World Bank: Washington, DC, USA, 2002. Available online: http://econweb.ucsd.edu/~carsonvs/papers/681.doc (accessed on 8 April 2015).
  74. Arrow, K.J.; Dasgupta, P.; Mäler, K.G. The genuine savings criterion and the value of population. Econ. Theory 2003, 21, 217–225. [Google Scholar] [CrossRef]
  75. Arrow, K.J.; Dasgupta, P.; Goulder, L.; Daily, G.; Ehrlich, P.; Heal, G.; Levin, S.; Mäler, K.G.; Schneider, S.; Starrett, D.; et al. Are We Consuming Too Much? J. Econ. Perspect. 2004, 18, 147–172. [Google Scholar] [CrossRef]
  76. Arrow, K.J.; Bensoussan, A.; Feng, Q.; Sethi, S.P. The genuine savings criterion and the value of population in an economy with endogenous fertility rate. In Optimal Control of Age-Structured Populations in Economy, Demography, and the Environment, Routledge Explorations in Environmental Economics No. 29; Boucekkine, R., Hritonenko, N., Yatsenko, Y., Eds.; Routledge: London, UK; New York, NY, USA, 2010; pp. 20–44. [Google Scholar]
  77. Hamilton, K. Testing Genuine Savings; World Bank Policy Research Work. Paper; World Bank: Washington, DC, USA, 2005. [Google Scholar]
  78. Ferreira, S.; Vincent, J.R. Genuine Savings: Leading Indicator of Sustainable Development? Econ. Dev. Cult. Change 2005, 53, 737–754. [Google Scholar] [CrossRef]
  79. Vincent, J.R.; Panayotou, T.; Hartwick, J.M. Resource Depletion and Sustainability in Small Open Economies. J. Environ. Econ. Manag. 1997, 33, 274–286. [Google Scholar] [CrossRef]
  80. Asheim, G.B. Hartwick’s Rule in Open Economies. Can. J. Econ. 1986, 19, 395–402. [Google Scholar] [CrossRef]
  81. Sefton, J.A.; Weale, M.R. The net national product and exhaustible resources: The effects of foreign trade. J. Public Econ. 1996, 61, 21–47. [Google Scholar] [CrossRef]
  82. Sachs, J.D.; Warner, A.M. Natural Resource Abundance and Economic Growth. Available online: http://www.cid.harvard.edu/ciddata/warner_files/natresf5.pdf (accessed on 8 April 2015).
  83. Neumayer, E. Does the “Resource Curse” hold for Growth in Genuine Income as Well? World Dev. 2004, 32, 1627–1640. [Google Scholar] [CrossRef]
  84. Boos, A.; Holm-Müller, K. The Relationship between the Resource Curse and Genuine Savings: Empirical Evidence. J. Sustain. Dev. 2013, 6, 59–72. [Google Scholar] [CrossRef]
  85. Boos, A.; Holm-Müller, K. A theoretical overview of the relationship between the resource curse and genuine savings as an indicator for “weak” sustainability. Natl. Resour. Forum 2012, 36, 145–159. [Google Scholar] [CrossRef]
  86. Boos, A.; Holm-Müller, K. The Zambian Resource Curse and its influence on Genuine Savings as an indicator for “weak” sustainable development. Environ. Dev. Sustain. 2015, in press. [Google Scholar]
  87. Hamilton, K.; Atkinson, G.; Pearce, D. Savings Rules and Sustainability: Selected Extensions; World Bank: Washington, DC, USA; London, UK, 1998. [Google Scholar]
  88. Haber, S.; Menaldo, V. Do Natural Resources Fuel Authoritarianism? A Reappraisal of the Resource Curse. Am. Polit. Sci. Rev. 2011, 105, 1–26. [Google Scholar] [CrossRef]
  89. Proops, J.L.R.; Atkinson, G.; Schlotheim, B.F.v.; Simon, S. International trade and the sustainability footprint: A practical criterion for its assessment. Ecol. Econ. 1999, 28, 75–97. [Google Scholar] [CrossRef]
  90. Daly, H.E.; Cobb, J.B. For the Common Good: Redirecting the Economy toward Community, the Environment, and a Sustainable Future; Beacon Press: Boston, MA, USA, 1994; ISBN 978-0807047057. [Google Scholar]
  91. Cobb, C.W.; Cobb, J.B. The Green National Product: A Proposed Index of Sustainable Economic Welfare; University Press of America: Lanham, MD, USA, 1994. [Google Scholar]
  92. Stockhammer, E.; Hochreiter, H.; Obermayr, B.; Steiner, K. The index of sustainable economic welfare (ISEW) as an alternative to GDP in measuring economic welfare. The results of the Austrian (revised) ISEW calculation 1955–1992. Ecol. Econ. 1997, 21, 19–34. [Google Scholar] [CrossRef]
  93. Castaneda, B.E. An index of sustainable economic welfare (ISEW) for Chile. Ecol. Econ. 1999, 28, 231–244. [Google Scholar] [CrossRef]
  94. Neumayer, E. The ISEW—Not an Index of Sustainable Economic Welfare. Soc. Indic. Res. 1999, 48, 77–101. [Google Scholar] [CrossRef] [Green Version]
  95. Lawn, P.A. A theoretical foundation to support the Index of Sustainable Economic Welfare (ISEW), Genuine Progress Indicator (GPI), and other related indexes. Ecol. Econ. 2003, 44, 105–118. [Google Scholar] [CrossRef]
  96. Lawn, P.A. An assessment of alternative measures of sustainable economic welfare. In Sustainable Development Indicators in Ecological Economics. Current Issues in Ecological Economics; Lawn, P., Ed.; Edward Elgar: Cheltenham, UK, 2006; pp. 139–165. [Google Scholar]
  97. Robinson, J.A.; Torvik, R. White elephants. J. Public Econ. 2005, 89, 197–210. [Google Scholar] [CrossRef]
  98. López Córdova, E.; Olmedo, A. International Remittances and Development. Existing Evidence, Policies and Recommendations; Institute for the Integration of Latin America and the Caribbean: Buenos Aires, Argentina, 2006. [Google Scholar]
  99. National Accounts: A Practical Introduction. Studies in Methods Handbook of National Accounting; United Nations (Ed.) Series F, No. 85; United Nations Publication: New York, NY, USA, 2003.
  100. OECD (Ed.) Measuring Capital: OECD Manual. Measurement of Capital Stocks, Consumption of Fixed Capital and Capital Services; OECD Publications Service: Paris, France, 2001.
  101. United Nations (Ed.) Links between Business Accounting and National Accounting. Studies in Methods; Handbook of National Accounting, Series F, No. 76; United Nations publication: New York, NY, USA, 2000.
  102. Jacobs, M. The Green Economy: Environment, Sustainable Development, and the Politics of the Future; Pluto Press: London, UK, 1991. [Google Scholar]
  103. O’Sullivan, A.; Sheffrin, S.M. Economics, Principles in Action; Pearson/Prentice Hall: Boston, MA, USA, 2007. [Google Scholar]
  104. Mincer, J. Schooling, Experience, and Earnings; National Bureau of Economic Research: New York, NY, USA, 1974. [Google Scholar]
  105. Mankiw, N.G. Brief Principles of Macroeconomics, 5th ed.; South-Western Cengage Learning: Mason, OH, USA, 2008. [Google Scholar]
  106. International Labour Organization (Ed.) Setting Social Security Standards in a Global Society; Social Security Policy Briefings, Paper 2; ILO Publications: Geneva, Switzerland, 2008.
  107. World Bank (Ed.) Africa Development Indicators 2014; World Bank: Washington, DC, USA, 2014. Available online: http://databank.worldbank.org/data/views/variableselection/selectvariables.aspx?source=africa-development-indicators#s_a (accessed on 16 November 2014).
  108. Statistics. Bank of Botswana: Gaborone, 2014. Available online: http://www.bankofbotswana.bw/index.php/content/2009110615029-other-data-sources (accessed on 16 November 2014).
  109. Central Statistics Office (Ed.) Sector Statistics Trade. In In Central Statistics Office: Gaborone, 2014. Available online: http://www.cso.gov.bw/index.php/sector-statistics/trade (accessed on 16 November 2014).
  110. UN Cometrade Database. Data. Available online: http://comtrade.un.org/data/ (accessed on 16 November 2014).
  111. Merlo, M.; Croitoru, L. (Eds.) Valuing Mediterranean Forests: Towards Total Economic Value; CABI Publishing: Wallingford, Germany, 2005.
  112. Food and Agriculture Organization of the United Nations (Ed.) Fishery and Aquaculture Country Profiles: The Republic of Guinea-Bissau; FAO: Rome, Italy, 1999. Available online: ftp://ftp.fao.org/FI/DOCUMENT/fcp/en/FI_CP_GW.pdf (accessed on 16 November 2014).
  113. Food and Agriculture Organization of the United Nations (Ed.) Fishery and Aquaculture Country Profiles: The Republic of Sierra Leone; FAO: Rome, Italy, 2006. Available online: http://www.fao.org/fishery/facp/SLE/en#CountrySector-Overview (accessed on 16 November 2014).
  114. Markandya, A.; Hunt, A.; Mason, P. Valuing Damages for Green Accounting Purposes: The GARPII Approach; FEEM Nota di Lavoro No. 93.2000; Foundazione Eni Enrico Mattei (FEEM): Milan, Italy, 2000. [Google Scholar]
  115. Hartridge, O.; Pearce, D.W. Is UK Agriculture Sustainable? Environmentally Adjusted Economic Accounts for UK Agriculture; CSERGE-Economics: London, UK, 2001. [Google Scholar]
  116. AEA Technology (Ed.) An Evaluation of the Air Quality Strategy; Report to the Department for Environment, Food and Rural Affairs (DEFRA): London, UK, 2004.
  117. World Bank (Ed.) World Development Indicators 2005; World Bank: Washington, DC, USA, 2005.
  118. Department for Environment, Food and Rural Affairs (DEFRA) (Ed.) Digest of Environmental Statistics; DEFRA: London, UK, 2005.
  119. Kunnas, J.; McLaughlin, E.; Hanley, N.; Oxley, L.; Greasley, D.; Warde, P. How Environmental Pollution from Fossil Fuels can be included in measures of National Accounts and Estimates of Genuine Savings. Stirl. Econ. Discuss. Paper 2012, 16, 1–28. [Google Scholar]
  120. Ferreira, S.; Moro, M. Constructing genuine savings indicators for Ireland, 1995–2005. J. Environ. Manag. 2011, 92, 542–553. [Google Scholar] [CrossRef]
  121. World Bank (Ed.) World Development Indicators 2014; World Bank: Washington, DC, USA, 2014. Available online: http://databank.worldbank.org/data/views/variableSelection/selectvariables.aspx?source=world-development-indicators (accessed on 16 November 2014).

