Article

Dual-Level Material and Psychological Assessment of Urban Water Security in a Water-Stressed Coastal City

1
State Key Laboratory of Water Environment Simulation, School of Environment, Beijing Normal University, Beijing 100875, China
2
Institute for Energy, Environment and Sustainable Communities, University of Regina, Regina Saskatchewan, SK S4S 0A2, Canada
*
Author to whom correspondence should be addressed.
Sustainability 2015, 7(4), 3900-3918; https://doi.org/10.3390/su7043900
Submission received: 30 November 2014 / Revised: 18 March 2015 / Accepted: 26 March 2015 / Published: 2 April 2015

Abstract

:
The acceleration of urbanization and industrialization has been gradually aggravating water security issues, such as water shortages, water pollution, and flooding or drought disasters and so on. Water security issues have become a great challenge to urban sustainable development. In this context, we proposed a dual-level material and psychological assessment method to assess urban water security. Psychological security coefficients were introduced in this method to combine material security and residents’ security feelings. A typical water-stressed coastal city in China (Dalian) was chosen as a case study. The water security status of Dalian from 2010 to 2012 was analysed dynamically. The results indicated that the Dalian water security statuses from 2010 to 2012 were basically secure, but solutions to improve water security status and solve water resource problems are still required. This dual-level material and psychological assessment for urban water security has improved conventional material assessment through the introduction of psychological security coefficients, which can benefit decision-making for urban water planning, management and protection.

1. Introduction

Water is a critical resource because water shortages and poor quality water threaten human lives [1]. The acceleration of urbanization and industrialization have gradually been aggravating water resource problems. An estimated 80% of the world’s population faces a high-level water security or water-related biodiversity risk [2]. Globally, water security is negatively affected by factors that include climatic and hydrological conditions, population growth, increased per-capita water use, pollution and the over-abstraction of groundwater. Severe water shortages, river pollution and frequent water-related hazards (e.g., floods and droughts) are resulting in, or will soon result in, negative effects at all levels of human society. In metropolitan centres, advanced management of water security problems is needed to meet human and environmental needs by providing sufficient water quantity and quality at the right time and place [3].

1.1. Review of Urban Water Security
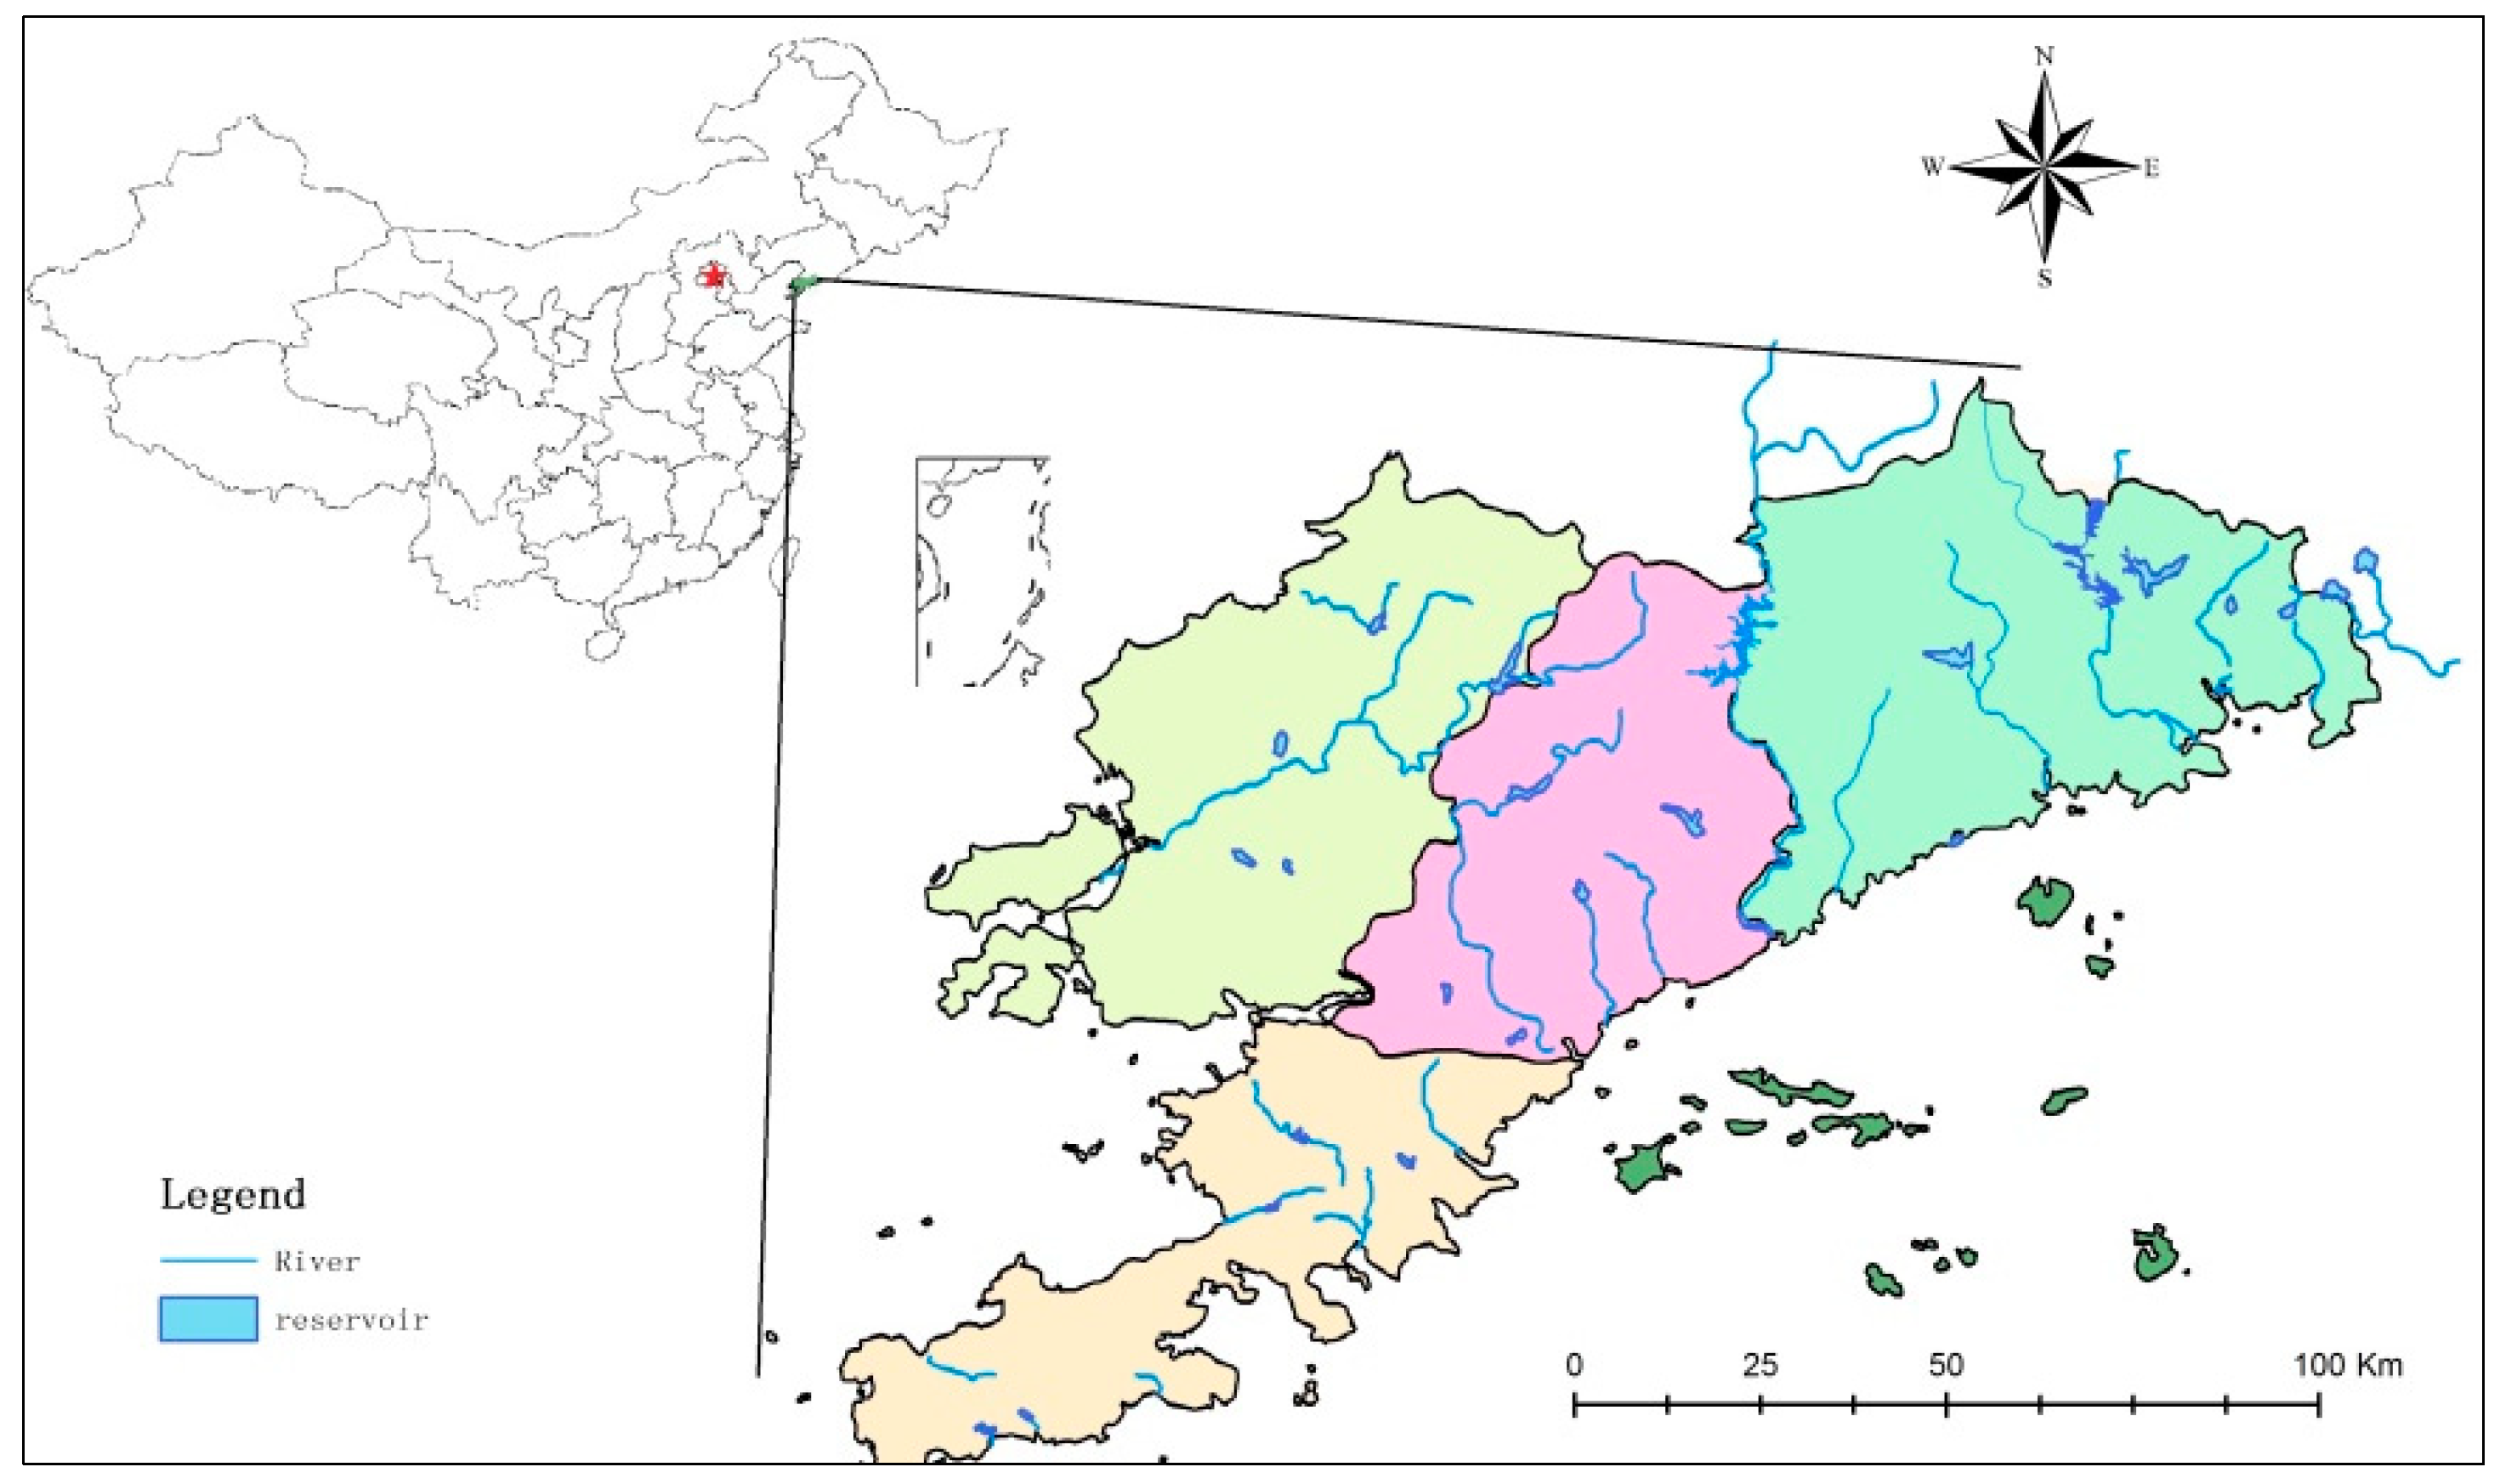
Ensuring urban water security under a changing environment will be the greatest challenge for water resource managers in the near future [4], especially in water-stressed coastal cities that suffer greatly from seawater intrusion issues, which aggravate water shortages and pollution.
These days, water security issues have attracted a great deal of attention. Multiple definitions of this concept exist. At the Second World Forum in 2000, the Global Water Partnership introduced an integrative definition of water security that considered the access and affordability of water as well as human needs and ecological health [5]. Since then, a growing number of scholars and policymakers have adopted the term, and discussed water security problems with their own considerations [6,7]. Water security implies the need for baseline requirements for water resource management in a watershed on a continuous basis and demands access to adequate quantities of acceptable quality of water for both humans and the environment.
Urban water security plays an important role in the sustainable development of urban social-economies [8]. Most human beings live in cities [9], and the interaction between people and the environment in urban settings is highly complex [10]. Different individuals react differently to threats or risks, and when urban water security is evaluated, the psychological feelings and preferences of people should be taken into consideration.
Water security is a complicated concept, and it covers many aspects such as resources, the environment and society. Water security is the combination of water resource security, water environment security and water ecology security. When the boundary of water security is limited in a people-oriented city region, we should take full account of citizens’ psychological security feelings. For city dwellers, urban water security means that people have consistent and sufficient water supplies to satisfy their normal drinking patterns and livelihoods, with standard water quality coupled with the lowest possible rates of urban flooding, and that farmlands, industries and the environment can share sufficient water resources with high efficiency to reach sustainable development goals [11,12]. Water security is a relative status and also a subjective feeling about an objective concept. Urban water security should not only ensure objective urban water safety but also eliminate human insecurity and anxiety, which means that people living in a city should feel that both their urban water quality and quantity are safe and without water-related risk [13]. However, most evaluations of water security have ignored people’s feelings and preferences about water security, which are the main social factors connected with managing water ecosystems [14,15,16].
Nowadays, psychometric procedures are widely used to elicit quantitative judgments of perceived risk, acceptable risk, and perceived benefit, which were put forward by Fischhoff et al. in 1978 [17]. The basic concept was using a questionnaire survey to learn people’s risk perceptions and preferences, and then quantifying it using mathematical statistics method. The questionnaire survey method has been widely used to obtain and quantify people’ subjective perceptions and feelings [18,19].
In this study, we proposed a dual-level material and psychological assessment method for supporting the assessment of urban water security, based on the combination of material security indicators and the psychological security coefficient that can be used for reflecting residents’ perceptions on security in the terms of material and psychological aspects.

1.2. Study Area

Dalian is a typical water-stressed coastal city in China, located in the south of the Liaodong Peninsula (Figure 1), covering an area of 12,573.85 km2 and with a population in 2010 of 6.69 million [20]. The map of Dalian was drawn by the authors using ArcGIS software based on an administrative division map of China from the Computer Network Information Centre on the Chinese Academy Sciences website [21].
Figure 1. Location of study area Dalian, China.
Sustainability 07 03900 g001
As the Northeast Asian International Shipping Centre, the biggest coastal port city in the north-eastern part of China, the economy of Dalian is rapidly developing, and its urbanization process is continuously accelerating. With the developing economy, though, many water-related problems have appeared in Dalian. It is dealing with a serious water shortage. Its gross quantity of water resources is 3.3 billion m3, and the quantity of per capita water resources in 2010 was only 566 m3, only roughly 1/16 of the world average (2100 m3) [22]. According to the integrated planning of sustainable water resources utilization in Dalian city by Dalian Water Affairs Bureau in 2012, with the current water usage efficiency and water engineering facilities, it is estimated that Dalian’s water shortage in 2030 would be 1.8 × 10⁹ m³, and the rate of water scarcity would be 79.5%. In addition, limited exploitation potential and severe sea water intrusion problems aggravate the water shortage and pollution [23]. These issues will cause insecurity in Dalian and hinder its ecological construction, so it is urgently necessary to employ an integrated assessment method and establish a set of indicators to evaluate urban water security, to help policy makers improve water management.

2. Materials and Methods

This study proposed a new evaluation method, which integrates physical water security concerns and the people’s feelings about the situation, in order to make a crucial and reasonable assessment of urban water security to provide decision-makers with choices between suitable scenarios for urban water planning.

2.1. Definition of Urban Water Security

Here, urban water security is defined as a persistent condition in a limited urban region under which water ecosystems can ensure the adequate access, safety, and affordability of water to meet minimum livelihood standards and human feelings of psychological security. On one hand, urban water security is an objective concept; on the other hand, urban water security is a personal feeling of city dwellers [16].
Accordingly, the connotations of urban water security can be divided into two aspects: (1) physical water resource security, which we call material security; (2) people’s feelings about current water status, namely psychological security. Many scholars claim that the water security problem is a fairly broad question, and it involves natural indices, social-economic indices, eco-environment indices and so on. Here, we employed the concept of material water security to denote the natural property of water security, reflecting water resource security in the city to ensure stability of water systems and to safeguard people’s basic living and industrial demands and requirements, which can be considered a part of the general water security concept. We mainly focused on three aspects: water quantity, water quality and risk. Here, risk refers to water-related disasters, such as flooding, droughts and so on. In the city, flooding has been a critical and serious water resource problem affecting the sustainable development of the economy and livelihoods. Material water security is part of conventional water security. Psychological security denotes people’s feelings and preferences about physical water resource security, and reflects their degree of satisfaction about the current status of water security. Psychological security is based on individual will and preferences and varies with changes in the external environment. When at different economic conditions and living styles, citizens’ psychological security feelings and preferences about physical security status are different [24]. Material security can be obtained through a physical water security assessment system and indicator data collection from certain statistical yearbooks and relevant bulletins. To quantify citizens’ psychological security, we proposed the concept of a psychological security coefficient and employed a questionnaire survey method to obtain data and quantify it.

2.2. Index System Establishment

We selected three index layers and 12 indicators to reflect the basic urban water security status in a water-stressed coastal city. Generally speaking, the following indicators can be divided into two categories: indicators that denote a better condition when their values are larger, namely, “positive indicators,” and indicators that denote a better condition when their values are smaller, namely, “negative indicators.” A specific assessment index system and indicator category is shown in Table 1.
Table 1. Urban water security assessment index system.
Target layer (A)Criteria layer (B)Index layer (C)Indicator category
Urban water security assessmentWater quantity (B1)Water resources per capita (C1, m3)Positive
Water resources utilization rate (C2, %)Negative
Other water supply proportion (C3, %)Positive
Rate of rejuvenated water reuse (C4, %)Positive
Water penetration rate (C5, %)Positive
Water quality (B2)Water quality standard-reaching rate of drinking water sources (C6, %)Positive
Ratio of the river length with water quality in Class III to the total assessed river length (C7, km/km)Positive
Rate of class I~IV groundwater quality reaching standard (C8, %) Positive
Ratio of seawater intrusion area to the administrative area (C9, hm2/hm2) Negative
Waste water treatment rate (C10, %) Positive
The risk (B3)Ratio of the population influenced by flooding to the total population (C11, %) Negative
Ratio of the water reserved in dams at the end of the year to the total water utilization (C12, m3/m3)Positive
Note: in the last line, “positive” means that when the indicator value is larger, the urban water security condition is better; and “negative” means that when the indicator value is smaller, the urban water security condition is better.
The three index layers include the target layer (A), criteria layer (B) and index layer (C). Here, the target layer is our final goal: the urban water security assessment (UWS). According to the definition, we should ensure a sufficient quantity, standard quality and persistent status (without water-related risk) to be water secure. The criteria layer is divided into three aspects: water quantity (B1), water quality (B2) and the risk (B3). Detailed indicators are explained in the following section.

2.2.1. Water Quantity Index

The index system is the physical condition of security that allows water resources to meet basic regulations and standards according to the surrounding environment. We will show the index according to the three aspects of the criteria layer.
First, for water quantity, the sufficient degree was measured from five basic indicators: water resources per capita (C1, m³), water resources utilization rate (C2, %), other water supply proportions (C3, %), rate of rejuvenated water reuse (C4, %) and water penetration rate (C5, %). Water resources per capita (C1) show the amount of total water resources in the study area and reflect the population carrying capacity of water resources. The utilization rate of water resources (C2) is the ratio of annual water consumption of the city to total water resources, which reflects the present utilization situation of water resources. It is a good reflection of the degree of water resource utilization and exploitation. Except for local water resources, the utilization rate of other water sources is also an important indicator of the water supply potential. How to develop and use other water sources has been a hot topic in supplementing local water sources, especially in Dalian, a city suffering a severe water shortage.
In recent years, reclaimed water and seawater have been two main other sources used to supply water in Dalian [25,26]. Therefore the indicators of other water supply proportion (C3) and rate of rejuvenated water reuse (C4) are used in this study. For the study area, C3 means the ratio of reclaimed water usage and seawater desalination supply to total water supply. The rate of rejuvenated water reuse (C4) reflects the current rejuvenated water usage condition, which is beneficial for the remission of urban water shortages. The last indicator is the water penetration rate (C5), which is the ratio of the non-agricultural population with tap water use to the total population, reflecting the access to and affordability of tap water for the non-agricultural population in the town.

2.2.2. Water Quality Index

For residents, the basic water quality indicator is the water quality standard-reaching rate of drinking water sources (C6, %). In addition to concerns about water quantity, we are also concerned about water quality in regard to the city’s water sources: surface water (river) and groundwater. According to the Environmental quality standards for surface water (GB3838-2002), river water class III can be used for drinking and class IV is only suitable for industrial use and other purposes that do not involve the liquid coming into contact with skin [27]. Therefore, the river water quality can be shown by the ratio of river length with class I~III water quality to the total river length (C7, km/km). According to the Quality standard for ground water (GB/T 14848-93), there are many items to check the quality of groundwater [28]. Class I−III groundwater can be used for drinking, and class IV groundwater is suitable for industrial use and irrigation, but can also be used for drinking after treatment. By looking up relevant statistics, we find that minerals are the main excessive chemicals in Dalian groundwater, caused by over-exploitation and seawater intrusion [29,30]. We selected a standard rate of class I−IV groundwater quality (C8, %) to check the groundwater quality. Currently, in coastal cities, sea water intrusion is an important water issue, exacerbating water shortages and causing groundwater pollution. We use the C9 (hm2/hm2) ratio of the seawater intrusion area to the total administrative area to show the current seawater intrusion degree. The C10 (%) wastewater treatment rate reflects the water quality treatment capability of a city.

2.2.3. The Risk Index

Indicators regarding risk (the water-related risk) involve critical and pointed urban water problems, such as city flooding. With the development of the economy and the acceleration of urbanization, the structure of urban land use is changing and the area of impervious roads is expanding. In the context of climate change, rainfall becomes more irregular, and more rainwater flows through impervious roads and is wasted without being harvested and utilized. Urban flooding is becoming an urgent and critical problem affecting people’s normal lifestyles and it exacerbates urban water shortage and water pollution. Thus, we use the indicator rate of the population affected by flooding (C11, %) to reflect the urban water-related risk degree. The ratio of the water reserved in dams at the end of year to the total water utilization (C12, m3/m3) was used as an indicator of the ability to control or mitigate these disasters.

2.3. Urban Water Security Assessment

2.3.1. Psychological Security Coefficient

The psychological security coefficient (F) is meant to better mirror the conflict between citizens’ feelings of safety and references to actual urban water resource availability and accessibility. It is a measure reflecting the ratio of the actual water resource environment and the citizens’ safety concerns. For the city population, the whole psychological security of a given study area is affected by their surrounding environment, including changes in city importance, the economy, politics and culture. Thus for a given city with a certain population and with the same background, psychological security does not change substantially. Here, we set the hypothesis that the psychological security coefficient does not change substantially in a short time if the economy, politics and culture did not experience huge changes. Because we conducted the assessment of Dalian from 2010–2012, which is the nearest time for which data is available in the context of the Twelfth Five-Year Plan, we can define the coefficient F as a constant during the study year, and the actual water supply and security status is the average of these years. Figures indicating the water quantity, water quality and the risk are different.
In the following section, F is the generalization of the coefficients Fqt, Fql and Fr. Thus, in our research, according to the criteria layer, we separately reflect the citizens’ feeling of safety coefficient for water quantity, water quality and water-related risk with the indicators of Fqt, Fql and Fr. For the calculation of Fqt, we use the ratio of domestic water consumption to the water quota for domestic use that is acceptable for a citizen’s normal life; Fql is the ratio of the drinking water quality standard to the drinking water quality standard that residents can accept in daily life; Fr is the ratio of the amount of flooding time that residents can endure to the actual flooding occurrence in the study area. In this case, the flooding time indicator is a negative indicator. Thus, coefficient F (including Fqt, Fql and Fr.) is always more than 0, but it has different meanings when it is greater than, less than or equal to the constant 1:
When F = 1, it means that the actual urban water security status of this element can meet the psychological safety demand, which is at the equilibrium state;
When F > 1, it means that the actual urban water security status of this element is good enough to meet and even greater than the psychological safety demand standard, and the assessment score of this element will be greater than before the assessment;
When 0 < F < 1, it means that the actual urban water security status of this element is not good enough to meet the psychological safety demand standard and the assessment score of this element will be less than before the assessment. It also tells us that we should do more to solve and improve the situation to achieve harmony with people's safety demands.
We obtained the real residents’ water safety feeling standard and specific data for F using an urban water security assessment questionnaire survey. The questionnaire was designed to obtain the standard line of water resource supply that people can accept while feeling safe and satisfied, namely, the sufficient water consumption volume, clear and standard water quality and acceptable risk degree (disaster frequency). Given that our questionnaire was designed for residents, we selected three specific elements, which were based on the following principles: intuitive, common, quantifiable, easy to answer, comparable and calculable. Water quantity is indicated by the daily domestic water consumption availability. Water quality is shown by drinking water to an abnormal degree, and flooding frequency is the reflection of the degree of water-related risk. Based on the three aspects, we selected three scenarios, and each scenario was divided into several levels to let participants select the appropriate level they can accept and feel safe.
These three scenarios are “the lowest number of times it is acceptable to bathe every week,” “annual drinking water problem occurrence times” and “urban flooding frequency during the flood season,” which can be transformed into water quantity, water quality and the risk condition. These three indices were quantified and divided into four or five levels according to their happening times. Components were asked to mark the proper level of problem occurrences according to their lifestyle and mental security demands. Specific questionnaire table were as follows (Table 2).
Table 2. People’s psychological security standard questionnaire design.
Alternative level (k)Lowest number of times acceptable to bathe every weekWhether you can accept or notAnnual drinking water problem occurrence timesWhether you can accept or notUrban flooding frequency during the flood seasonWhether you can accept or not
1[0, 2] (10, +∞) (10, +∞)
2(2, 4] (5, 10] (5, 10]
3(4, 6] (4, 5] (4, 5]
4(6, +∞) (0, 3] (0, 3]
5 0 0
Here, we designed the questionnaire to get the data for bathing times with one week as a period, so that the respondents could understand and answer questions easier. In the calculation of Fqt, we can transform the bathing time every week to daily domestic water consumption per capita; bathing time is used as the numerator and the domestic water quota is used as the denominator. The calculation equations of Fqt are as follows:
F q t = n k r k c λ 7 Q
Where, nk is the average alternative bathing times for the kth level of Table 2, rk is the rate of people who chose the kth level to be their psychological security standard, c is the average water consumption for each bathing per capita, unit L, λ is the ratio of average water consumption for every bathing to total domestic consumption per capita per day, and Q is the water quota for domestic consumption per capita per day. k = 1, 2, 3, 4, and accordingly nk = 1, 3, 5, 7.
For the calculation of Fql and Fr, both the data of the numerator and denominator were obtained from the questionnaire, and for the availability and uniformity, we gave different levels different scores from 0−1, while the score per level for the numerator and denominator were consistent. The basic principle is to multiply scores for each given level and its ratio of population who choose this level to total questionnaire respondents.

2.3.2. Urban Water Security Assessment Model

Urban water security (UWS) indices were calculated using the weighted average method, with the following equations:
W q t = F q t j = 1 5 V j R j
W q l = F q l j = 6 10 V j R j  
W r = F r j = 11 12 V j R j
U W S = α W q t + β W q l + γ W r  
Where Wqt, Wql and Wr are, respectively, water quantity , water quality and the risk index of urban water security; Vj is the normalized element value of the jth water security indicators; Rj is the weight of the jth water security indicator; Fqt, Fql, and Fr are respectively the psychological security coefficients for water quantity, water quality and the risk; α, β, γ are respectively the weights of water quantity, water quality and the risk; UWS is the urban water security index with the combination of material and psychological security assessment; and j = 1, 2…, 12.
From this equation, we can see that the introduction of the psychological security coefficient F is appropriate to adjust and revise general water security without the consideration of citizens’ psychological feelings. The value of this variable indicates the gap between the current water status and peoples’ mental security feelings, and it would appropriately adjust the assessment score and make the result better or worse.

2.3.3. Data Collection and Normalization

Here, we took a typical water-stressed coastal city in China (Dalian) as a case study. By looking up the statistics and literature, we obtained the water security assessment indicator data of Dalian from 2010–2012 (Table 2). Data sources included the Dalian Water Resources Bulletin, Dalian statistical yearbook, Disaster Bulletin and some authoritative reports on the Internet.
Having obtained all of the data, we normalized the data to eliminate the effects of different properties and dimensions. The score of the material security indices could be normalized using the efficacy coefficient method.
For a positive indicator, the normalization equation is:
V i j = ( X i j X j min ) / ( X j max X j min )
For a negative indicator, the normalization equation is:
V i j = 1 - ( X i j X j min * ) / ( X j max * X j min * )
Where vij is the efficacy coefficient of year i and indicator j; xij is the actual value of year i and indicator j; xjmax and xjmin are the upper and lower bounds. In a practical evaluation, a value 10% lower than the maximum value of a quantitative indicator is considered to be its upper bound and a value 10% higher than the minimum value of a quantitative indicator is considered to be its lower bound [4].
We conducted a questionnaire survey about Dalian urban water security. In order to analyse the result according to the distribution character and population traits, we made a survey plan before we carried out the questionnaire survey. The plan made clear the survey population and survey areas. The survey population should include at least 30% female or 30% male; 20% older people and 20% children; 20% high income and 20% low income. We also designed questions in the questionnaire related to the weights among water quantity, water quality and the risk index: “Of the following items, which do you think has a greater effect on the assessment of water security?” According to the questionnaire results, we obtained their weight rates.
The survey was taken in four crowded districts (Zhongshan District, Xigang District, Shahekou District and Ganjingzi District) of Dalian to assess its water security status from the perspective of the residents. In each district we sent out about 80 questionnaires by face-to-face communication. The survey area covered different functional zones of the city, which can represent people with living conditions, lifestyles and education levels, including: (1) living zones, where urban river quality problems were severe and many citizens lived there for a long time; (2) greening zones, for example the park, crowded with people and convenient for communicating with city dwellers; (3) teaching zones, for example schools and Dalian Library, where respondents were always highly educated and could give more objective answers and deeper thinking; and (4) high and new technology zones, with many company staff. Finally we sent out 315 questionnaires and obtained 275 valid questionnaires (valid return rate is 87.3%).
The questionnaire content was divided into three parts: basic information, water security status survey and the security demand determination. The first part was designed to determine basic information about the residents answering the questionnaire. The second part was to determine the current security status of water in Dalian and to let residents choose water resource indicators that they found more critical. The third part of the questionnaire was set to assess the psychological security perception of the criteria layer of the assessment index: water quantity, water quality and the risk, designed for the calculation of psychological security coefficients.
According to our survey, about 95.1% of total respondents had lived in Dalian for more than half a year, which matched the condition of resident population, and they were familiar with Dalian’s water security status. A total of 96.4% of them had high school degrees or beyond, ensuring the outcomes were effective enough. As to their occupations, 35% respondents were students, 30% were company staff, 10% teachers, 10% worked in administrative institutions, 10% were workers and 5% had retired.

2.3.4. Indicator Weight Calculation

Generally, methods to determine indicator weights can be divided into two or three methods: subjective or objective determination, or a combination thereof. The analytic hierarchy process (AHP) is a widely-used method for multi criteria decision support based on the hierarchical decomposition of objectives, evaluation of preferences through pair wise comparisons, and subsequent aggregation into global evaluations [31,32]. Based on mathematics and psychology, it has been widely applied to decision making in various areas. Some scholars employed questionnaire surveys to determine the importance of assessment elements in the study area to make assessment indicators and results more targeted and accurate [16,33].
The indicator weights of the criteria and index layers were calculated using the AHP method and integrating the willingness of residents, which was obtained via their questionnaire voting results. We have designed questions in the questionnaire related to the weights among water quantity, water quality and the risk index: “Of the following items, which do you think have a greater effect on the assessment of water security?” Options are quantity, water quality and the risk. According to the questionnaire results, we got their weight rates. According to the questionnaire results, we found that approximately 20% of the respondents chose water quantity, 60% chose water quality and 20% chose the risk. This provides the weights for water quantity, water quality and the risk, 0.20, 0.60 and 0.20, respectively.
Finally, we asked 8 scholars in the water resource field to measure the importance rate between every two indicators in the same criteria layer, got the average and formalized them as integers. According to the 1 to 9 scale method, we made comparisons of all of the indicators in each criteria layer and then used AHP method to determine the weights. An indicator importance matrix was constructed based on MATLAB software to calculate the weight and check the consistency, and CR values less than 0.1 indicated that the results all passed the consistency test. All of the data from Dalian for 2010–2012, including the normalized data and their weights, are shown in Table 3.
Table 3. Urban water security assessment data and weights for Dalian, China from 2010–2012.
IndicatorWeightsOriginal data of different yearsNormalized data of different years
201020112012201020112012
Water quantity (B1) 0.20 *Water resources per capita (C1, m³) 0.3542511.6569.8493.00.370.690.27
Water resources utilization rate (C2, %)0.354239.3542.3855.150.840.720.22
Other water supply proportion (C3, %)0.16327.09.29.20.180.760.76
Rate of rejuvenated water reuse (C4, %)0.04844038420.480.320.65
Water penetration rate (C5, %)0.0800100100100111
Water quality (B2) 0.60 *Water quality standard-reaching rate of drinking water sources (C6, %)0.3800100100100111
Ratio of the river length with water quality in Class III to the total assessed river length(C7, km/km)0.094860.368.785.70.150.360.79
Rate of class I~IV groundwater quality reaching standard (C8, %)0.202493.387.587.50.610.370.37
Ratio of seawater intrusion area to the administrative area (C9, hm2/hm2)0.12675.15.25.30.590.510.43
Waste water treatment rate (C10, %)0.196290.495.0595.10.390.590.59
The risk (B3) 0.20 *Ratio of the population influenced by flooding and flooding to the total population (C11, %)0.833310.51.46.30.100.990.51
Ratio of the water reserved in dams at the end of the year to the total water utilization (C12, m3/m3)0.166797.487.091.40.660.300.45
Date source: * p < 0.1, values of indicator C1–C12 are from Dalian statistical yearbook 2010–2012 [20,34,35], and Dalian Water Resources Bulletin 2010–2012 [25,26,36].

2.3.5. Comprehensive Assessment

After data standardization in this study, UWS ranged from 0 to 1 and water security assessment indicators were classified into five levels (Table 4): (1) Secure; (2) Marginally Secure; (3) Basically Secure; (4) Marginally Insecure; and (5) Insecure.
Table 4. Urban water security (UWS) assessment classification standard.
UWS LevelUWSFeatures
Level 1: Secure0.8 ≤ UWS < 1.0Urban water system status is at good condition, it can continuously provide people sufficient water quantity and standard water quality, and people feel no worry about their water environment and are free of water-related risk.
Level 2: Marginally secure0.6 ≤ UWS < 0.8Urban water system status is secure, water shortage and pollution problems are not apparent.
Level 3: Basically secure0.4 ≤ UWS < 0.6Urban water system status is disturbed, sometimes water problems happen, but it is rather bearable by people.
Level 4: Marginally insecure0.2 ≤ UWS < 0.4Urban water system is not at good condition, water shortage and pollution problems happen, and people feel not safe about their water environment.
Level 5: Insecure0 ≤ UWS < 0.2Urban water system is seriously destroyed, water shortage and pollution is rather serious, people frequently feel water-related risk and the water environmental cannot support their normal life, and urban water environment urgently needs to be improved.
The maximum value of UWS is 1, which indicates that the urban water system is in the best condition; it can continuously provide people sufficient water quantity and standard water quality (including surface water, groundwater and other water sources), and people feel no anxiety about their water environment and are free of water-related risk. The minimum value of UWS is 0, which indicates that the urban water system is almost destroyed, water shortages and pollution are very serious, people frequently feel water-related risk, and the water environment cannot support their normal life.

3. Results and Discussion

3.1. Results

3.1.1. Results of the Psychological Coefficient F

After completion of the survey, data were collected and calculated and averaged for relevant assessment indicators. According to the questionnaire results, the average acceptable time of bathing and frequency of drinking water problems were one week. In the calculation of Fqt, bathing time is used as the numerator and the domestic water quota is used as the denominator (per capita per day 120 L), according to the Liaoning Industry Water Quota (DB21/T1237-2008). The ratio of average water consumption for every bathing to total domestic consumption per capita per day was set 30% [37].
For the calculation of Fql, both the data of the numerator and denominator were obtained from the questionnaire. Different from the above, Fr was the ratio of the urban flooding frequency that residents can endure to the actual occurrences in Dalian; the denominator was obtained from the Dalian Water Resources Bulletin from 2010–2012.
From the calculations, we obtained the results of Dalian residents’ psychological security coefficients Fqt, Fql and Fr. The results of the psychological security coefficients are shown in Table 5.
Here, the results of the Fq, Fqu and Fr of Dalian are all less than 1, which means that in recent years there has still been a gap between the current water security status of Dalian and residents’ mental security standards and that they are not always consistent with each other. In this research, the differences are more apparent in terms of water quantity and water-related risk.
Table 5. Results of residents’ psychological security coefficient Fq, Fqu and Fr of Dalian, China.
IndicesFqtFqlFr
Data0.490.950.42
Note: Fqt, Fql and Fr are psychological security coefficients for water quantity, water quality and the risk.

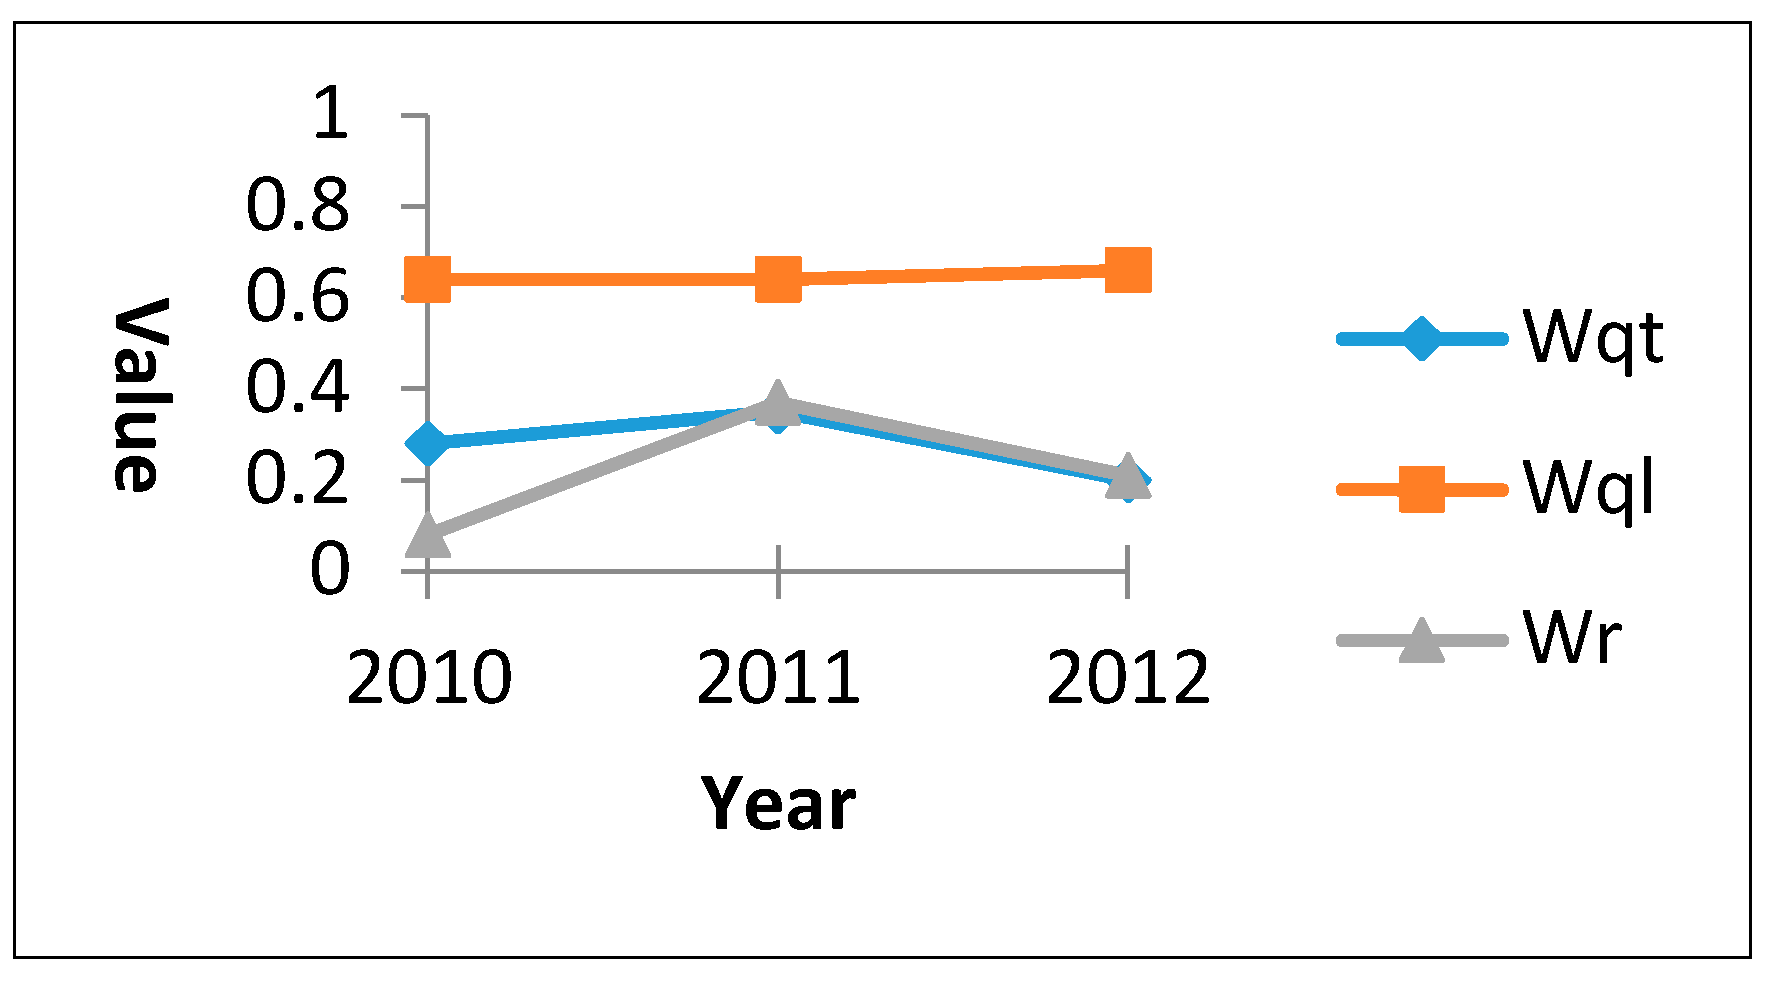
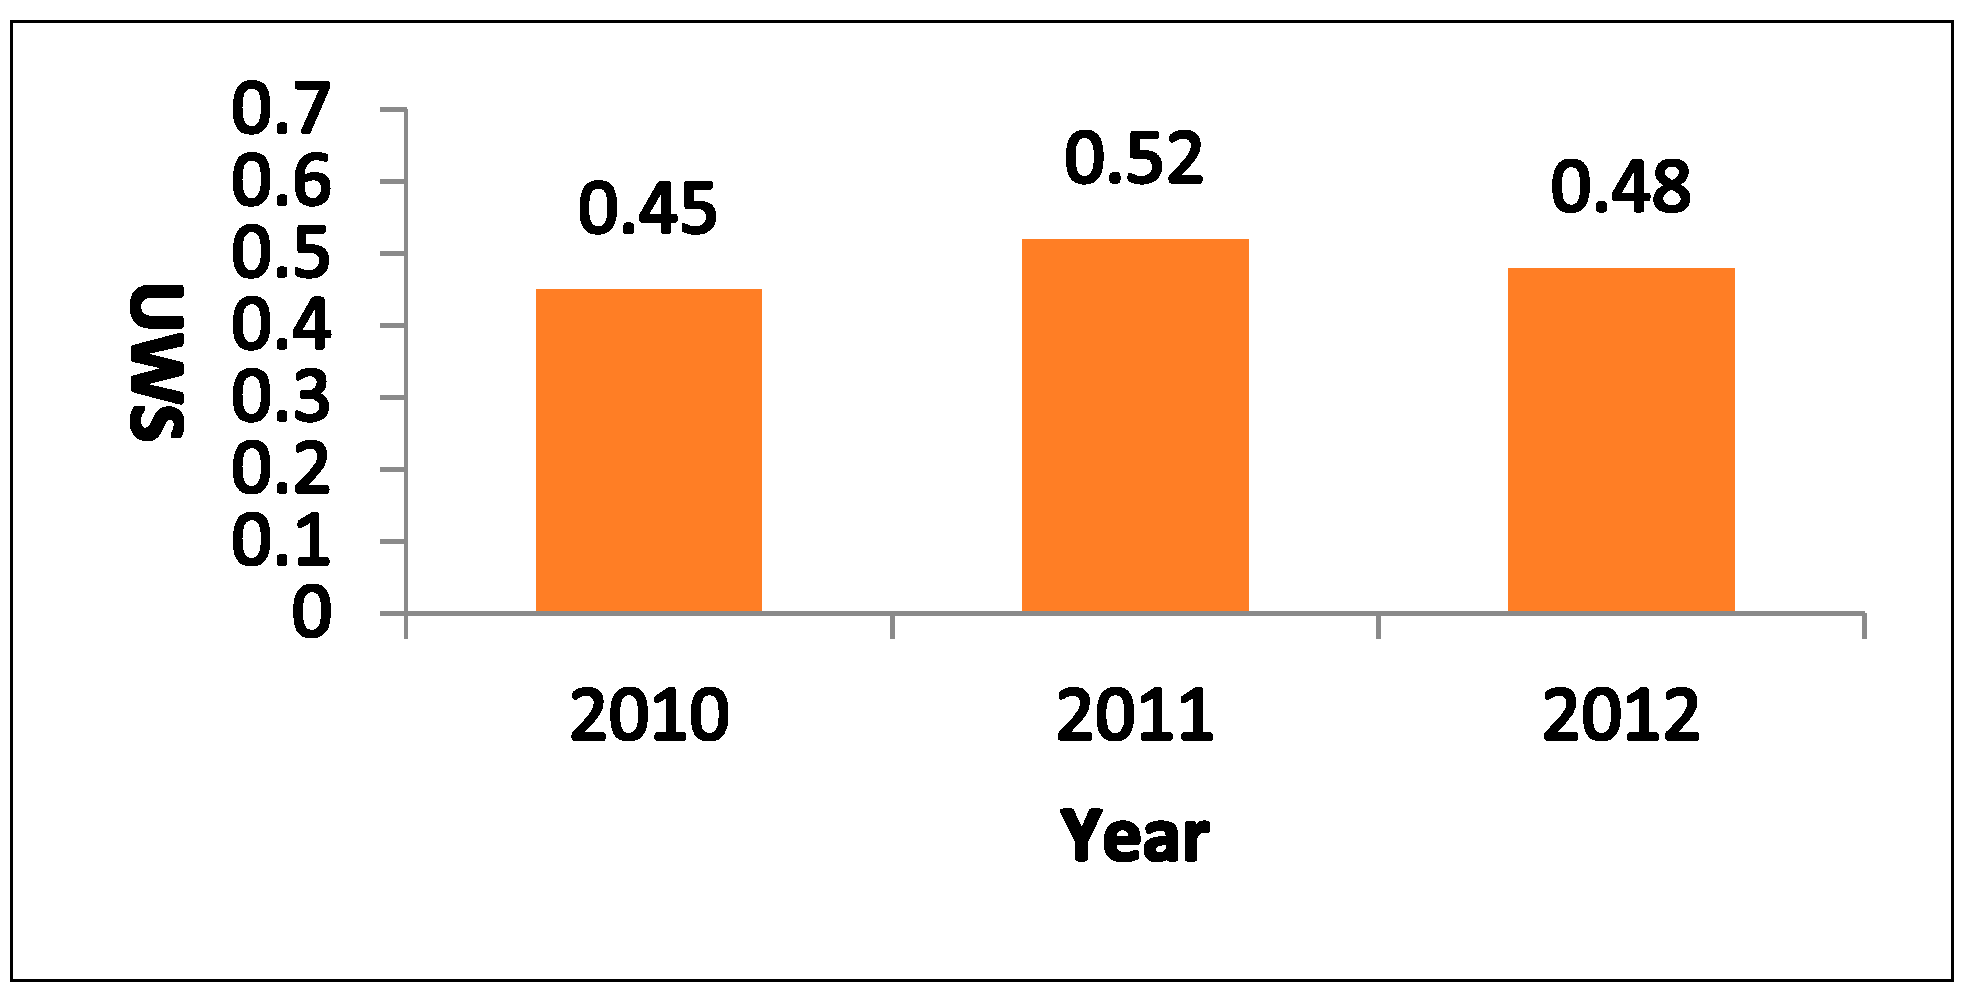
3.1.2. Results of Dalian Urban Water Security

From the above assessment model and Equations (2)–(5), the final urban water security assessment result of Dalian from 2010–2012, including the water quantity, water quality and the risk results, are shown in Table 6. We can see that the assessment results of Dalian urban water security were 0.45, 0.52 and 0.48, respectively. According to Table 3, the statuses of 2010, 2011 and 2012 are all at the basically secure level (0.4 ≤ UWS < 0.6), meaning that its urban water system is disturbed, and sometimes water problems occur, but they are bearable for people.
Table 6. Urban water security assessment results of Dalian, China from 2010–2012.
IndicesWqtWqlWrUWS
Year20100.280.640.080.45
20110350.640.370.52
20120.200.660.210.48
Note: UWS is the urban water security assessment index; Wqt, Wql and Wr are respectively the index of urban water security for water quantity, water quality and the risk.
There is a small water security status fluctuation during these years, with a rise from 2010–2011, and a decline from 2011–2012 (Figure 2). Figure 3 shows the separate element assessment results of Dalian. During these three years, the assessment results of water quality did not substantially change and the variation of water quantity and risk are nearly consistent with the assessment results of overall urban water security, with a rise from 2010–2011 and a decline from 2011–2012, especially the risk, which is the same as the overall assessment tendency but has a very low score. In comparison, we find that the water resources per capita for 2011 (569.8 m³) were apparently more than those of 2010 (511.6 m³) and 2012 (493 m³). In terms of the risk, in August 2012, the Biliu River reservoir, one of the biggest reservoirs in Dalian, suffered a huge flood that affected nearly 20,000 people.
Generally speaking, the Dalian urban water security statuses in recent years are stable at an overall status level of “basically secure”; water resource problems are not apparent but sometimes occur, and the results are consistent with other assessments of Dalian water security [38]. In thinking about the sustainable development of the city and that people’s mental demands will increase with the development of the economy, we should also further study Dalian water resources and find solutions to improve its water status.
Figure 2. Dalian urban water security assessment (UWS) results from 2010–2012.
Sustainability 07 03900 g002
Figure 3. Separate element assessment result of Dalian, China from 2010–2012. Wqt, Wql and Wr separately represent the water quantity, water quality and the risk of urban water security.
Sustainability 07 03900 g003

3.2. Discussion

In this research, we combined material security and residents’ psychological security for an urban water security assessment. Because the psychological security coefficient is the coefficient to reflect psychological perceptions and preferences, it involves subjectivity and uncertainty. We obtained the subjective feelings in the questionnaire and then quantified them to introduce the coefficient into conventional and objective assessment. The variable psychological feelings caused uncertainty. Because our calculation used the average in each level of each element, it may also have some uncertainty and fluctuation, but it can generally represent residents’ feelings and show the gap between objective security status and people’s subjective demand for more comfortable lifestyles and internal satisfaction. In addition, residents’ psychological security feelings change with the development of a city’s economy and changes in their culture and ideology. When a city develops rapidly and residents become more prosperous, their lifestyles will change and their living requirements will be higher, causing a deep imbalance between water demand and supply.
From the questionnaire survey, we found that residents care deeply about the security of their surroundings and the resources that they rely on to live. They demand water resources or other resources and would like to see no security problems. The frequency of water-related problems that they can bear is low. Occurrences of water-related issues will cause insecurity for residents. There is a great need to place more attention on resident security feelings when studying urban water security.
From the water security assessment, we can see that other basic indicator results are fair, but the natural water resources are rather scarce. Dalian is short on water resources, which is typical for a coastal district. Based on a current water conservancy project, we are urgently looking for more potential unconventional water resources. Currently, scholars and engineers now pay more attention to alternative water sources. There are several possible alternative water sources: long distance water transfer, wastewater recycling, sea water desalinization and rainwater harvesting. Sea water desalinization may be a good method to increase water resources for coastal cities by transforming sea water to fresh water resources, if the technology improves and becomes less costly. Among the other options, rainwater harvesting has its own advantages because it is convenient and easy to carry out [39,40]. The potential benefits that accrue from rainwater harvesting are a decrease in demand for potable water from centralized water sources, reduction in runoff into urban storm water systems and a reduced risk of overflow from storm events. Having been harvested and treated, rainwater can be reused for irrigation, toilet flushing, cleaning roads and some ecological purposes [4,41,42,43].
In fact, rainwater harvesting has been studied in many countries as a way of promoting potable water savings [44,45]. Considering the environmental conditions of Dalian, its rainfall distribution is uneven, both annually and seasonally. Affected by its monsoon climate, rainfall in winter is rare, but is intense in summer. In a normal year, the rainfall of the most abundant four months can account for approximately 63%−77% of the total rainfall. Rain usually occurs in the form of storm water. Therefore, constructing some facilities for rainwater collection in Dalian is meaningful and operable. Additionally, the sloping ground surface of Dalian makes it more possible and convenient to harvest rainwater. There is great potential in studying Dalian rainwater utilization and conducting harvesting projects to combat its water resource shortage.

4. Conclusions

In this research, a dual-level material and psychological assessment method was proposed for supporting the assessment of urban water security. This method was based on the combination of material security indicators and psychological security coefficients that can be used for reflecting residents’ perceptions on security in terms of material and psychological aspects. Thus, this method improved upon conventional methods by recognizing the mental component through the introduction of psychological coefficients. The method was then demonstrated in a water-stressed coastal city. The results indicated that Dalian’s water security statuses from 2010–2012 were at the “basically secure” level and that there is a great need to find solutions to improve its water security status. The psychological security coefficients for Dalian were less than 1, which demonstrates that the current water status is not consistent with residents’ psychological security feelings. To improve the water system and urban sustainable development, we should consider water security problems more comprehensively with regard to the residents’ psychological feelings. Water security refers not only to sufficient water quantity and standard water quality but also to the persistent function of water ecosystems. The basic rule is that all human activities should be restrained without exceeding the ecosystem capacity.

Acknowledgments

This work was funded by the National Science and Technology Pillar Program, China (No. 2012BAC05B02), the Fund for Innovative Research Group of the National Natural Science Foundation of China (Grant No. 51121003) and New Century Excellent Talents in University (NCET) (NCET-13-0064).

Author Contributions

Linyu Xu designed the study, reviewed all of the previous research studies and gave direct instructions. Yajing Huang performed the research, analysed the data, and wrote the data calculation and discussion. Hao Yin collected the original data and wrote the indicator establishment; Yanpeng Cai helped conduct the questionnaire survey and took part in research discussion, paper writing and revising; and Zhifeng Yang provided important ideas and methodology direction and suggestions and revised the overall paper. All of the authors read and approved the final manuscript.

Conflicts of Interest

The authors declare no conflict of interest.

References

  1. Kujinga, K.; Vanderpost, C.; Mmopelwa, G.; Wolski, P. An analysis of factors contributing to household water security problems and threats in different settlement categories of Ngamiland, Botswana. Phys. Chem. Earth Part A/B/C 2014, 67, 187–201. [Google Scholar] [CrossRef]
  2. Vörösmarty, C.J.; McIntyre, P.B.; Gessner, M.O.; Dudgeon, D.; Prusevich, A.; Green, P.; Glidden, S.; Bunn, S.E.; Sullivan, C.A.; Liermann, C.R.; et al. Global threats to human water security and river biodiversity. Nature 2010, 467, 555–561. [Google Scholar] [CrossRef] [PubMed]
  3. Bichai, F.; Smeets, P.W. Using QMRA-based regulation as a water quality management tool in the water security challenge: Experience from the Netherlands and Australia. Water Res. 2013, 47, 7315–7326. [Google Scholar] [CrossRef] [PubMed]
  4. Wang, X.; Zhang, J.; Shamsuddin, S.; Xia, X.; He, R.; Shang, M. Catastrophe theory to assess water security and adaptation strategy in the context of environmental change. Mitig. Adapt. Strateg. Glob. Chang. 2014, 19, 463–477. [Google Scholar] [CrossRef] [Green Version]
  5. Cook, C.; Bakker, K. Water security: Debating an emerging paradigm. Glob. Environ. Chang. 2012, 22, 94–102. [Google Scholar] [CrossRef]
  6. Grey, D.; Sadoff, C.W. Sink or swim? Water security for growth and development. Water Policy. 2007, 9, 545–571. [Google Scholar] [CrossRef]
  7. Zeitoun, M. The global web of national water security. Global Policy 2011, 2, 286–296. [Google Scholar] [CrossRef]
  8. Zhao, S.; Chen, J.; Weng, Y. Research on urban water security evaluation based on unascertained measure model. In Proceedings of the Fourth International Conference on Engineering Management and Service Sciences, Seoul, Korea, 24–26 November 2009; pp. 620–623.
  9. Schläpfer, M.; Bettencourt, L.M.A.; Grauwin, S.; Raschke, M.; Claxton, R.; Smoreda, Z.; West, G.B.; Ratti, C. The scaling of human interactions with city size. J. Royal Soc. Interface 2014, 11, 15888–15893. [Google Scholar] [CrossRef]
  10. Goudie, A.S. The Human Impact on the Natural Environment: Past, Present, and Future; John Wiley & Sons: Hoboken, NJ, USA, 2013. [Google Scholar]
  11. Shi, Z.; Liu, X. Concept and Connotation of Urban Water Security. J. China Hydrol. 2008, 5, 24–27. (In Chinese) [Google Scholar]
  12. Farrelly, M.; Brown, R. Rethinking urban water management: Experimentation as a way forward? Glob. Environ. Chang. 2011, 21, 721–732. [Google Scholar] [CrossRef]
  13. Chen, J.; Xia, L; Wang, H.; Jin, Q.; Zhao, S. Research on urban water security early-warning based on support vector machines. J. Adv. Inf. Sci. Service Sci. 2012, 4, 191–199. [Google Scholar]
  14. Shi, Z.; Liu, X.; Huang, Y.; Fang, S. Evaluation Method for Urban Water Safety Based on Law of Diminishing Marginal Utility. J. Hydraulic Eng. 2010, 5, 545–552. (In Chinese) [Google Scholar]
  15. Xu, L.; Li, Z.; Song, H.; Yin, H. Land-Use Planning for Urban Sprawl Based on the CLUE-S Model: A Case Study of Guangzhou, China. Entropy 2013, 15, 3490–3506. [Google Scholar] [CrossRef]
  16. Xu, L.; Yin, H.; Li, Z.; Li, S. Land Ecological Security Evaluation of Guangzhou, China. Int. J. Environ. Res. Public Health. 2014, 11, 10537–10558. [Google Scholar] [CrossRef] [PubMed]
  17. Fischhoff, B.; Slovic, P.; Lichtenstein, S.; Read, S.; Combs, B. How safe is safe enough? A psychometric study of attitudes towards technological risks and benefits. Policy Sci. 1978, 9, 127–152. [Google Scholar] [CrossRef]
  18. Huang, L.; Sun, K.; Ban, J.; Bi, J. Public perception of blue-algae bloom risk in Hongze Lake of China. Environ. Manag. 2010, 45, 1065–1075. [Google Scholar] [CrossRef]
  19. Koehler, J.; Dreijerink, L.; van Poll, R. Exploring the risk information gap. Research into information supply and information demand of different parties concerned. Safety Sci. 2009, 47, 554–560. [Google Scholar] [CrossRef]
  20. China Statistics Bureau. Dalian Statistical Yearbook 2011; China Statistics Press: Beijing, China, 2011. (In Chinese)
  21. Computer Network Information Center, Chinese Academy of Sciences. Available online: Http://www.cnic.cas.cn/zcfw/sjfw/gjkxsjjx/ (accessed on 2 October 2014). (In Chinese)
  22. Zhao, K. Water resources protection existing problems and countermeasures in Dalian city. Water Resour. Hydropower Northeast. 2013, 5, 27–29. (In Chinese) [Google Scholar]
  23. Yu, B.; Xu, L. Assessment of sustainable development of urban water ecosystems in Dalian. Resour. Sci. 2014, 12, 2578–2583. (In Chinese) [Google Scholar]
  24. Schneier, B. The Psychology of Security, in Progress in Cryptology–AFRICACRYPT 2008; Springer: Berlin, Germany, 2008; pp. 50–79. [Google Scholar]
  25. Dalian Water Affairs Bureau, Dalian Water Resources Bulletin 2010. Available online: Http://www.swj.dl.gov.cn/html/2011-05/11290.html (accessed on 12 May 2011).
  26. Dalian Water Affairs Bureau, Dalian Water Resources Bulletin 2011. Available online: Http://www.swj.dl.gov.cn/html/2012-03/12221.html (accessed on 11 March 2012). (In Chinese)
  27. Ministry of Environmental Protection of the People’s Republic of China, Environmental quality standards for surface water. Available online: http://kjs.mep.gov.cn/hjbhbz/bzwb/shjbh/shjzlbz/200206/t20020601_66497.htm (accessed on 1 June 2002). (In Chinese)
  28. Ministry of Environmental Protection of the People’s Republic of China, Quality standard for ground water. Available online: http://kjs.mep.gov.cn/hjbhbz/bzwb/shjbh/shjzlbz/199410/t19941001_66500.htm (accessed on 1 October 1994). (In Chinese)
  29. Shi, L.; Jiao, J. Seawater intrusion and coastal aquifer management in China: A review. Environ. Earth Sci. 2014, 72, 2811–2819. [Google Scholar] [CrossRef]
  30. Wang, X. Groundwater resources situation and protection measures in Dalian city. Water Resour. Hydropower Northeast. 2013, 5, 54–56. (In Chinese) [Google Scholar]
  31. Durbach, I.; Lahdelma, R; Salminen, P. The analytic hierarchy process with stochastic judgements. Eur. J. Oper. Res. 2014, 238, 552–559. [Google Scholar] [CrossRef]
  32. Ishizaka, A; Labib, A. Review of the main developments in the analytic hierarchy process. Expert Syst. Appl. 2011, 38, 14336–14345. [Google Scholar]
  33. Zhou, X.; Yang, Z.; Xu, L. Eco-security Monitoring Index System for Urban Development Zone. Procedia Environ. Sci. 2010, 2, 1199–1205. [Google Scholar] [CrossRef]
  34. China Statistics Bureau. Dalian Statistical Yearbook 2012; China Statistics Press: Beijing, China, 2012. (In Chinese)
  35. China Statistics Bureau. Dalian Statistical Yearbook 2013; China Statistics Press: Beijing, China, 2013. (In Chinese) [Google Scholar]
  36. Today is the World Water Day and Dalian Water Affairs released Bureau Dalian Water Resources Bulletin 2012. Available online: http://dalian.dlxww.com/content/2013-03/22/content_606823.htm (accessed on 22 March 2013).
  37. Chu, J.; Chen, J.; Wang, C. Simulation and analysis on mechanisms of urban households water use. Environ. Sci. 2007, 2, 273–278. (In Chinese) [Google Scholar]
  38. Zhang, G.; Wang, X.; Jing, F. Dalian’s water security based on fuzzy mathematical model. Resour. Ind. 2011, 13, 56–60. (In Chinese) [Google Scholar]
  39. Zhang, X.; Hu, M.; Chen, G.; Xu, Y. Urban rainwater utilization and its role in mitigating urban waterlogging problems—A case study in Nanjing, China. Water Resour. Manag. 2012, 26, 3757–3766. [Google Scholar] [CrossRef]
  40. Mahmoud, S.H.; Mohammad, F.S.; Alazba, A.A. Determination of potential runoff coefficient for Al-Baha Region, Saudi Arabia using GIS. Arabian J. Geosci. 2014, 7, 2041–2057. [Google Scholar] [CrossRef]
  41. Jones, M.P.; Hunt, W.F. Performance of rainwater harvesting systems in the southeastern United States. Resour. Conserv. Recycl. 2010, 54, 623–629. [Google Scholar] [CrossRef]
  42. Ward, S.; Memon, F.A.; Butler, D. Performance of a large building rainwater harvesting system. Water Res. 2012, 46, 5127–5134. [Google Scholar] [CrossRef] [PubMed]
  43. Jepson, W. Measuring ‘no-win’ waterscapes: Experience-based scales and classification approaches to assess household water security in colonias on the US–Mexico border. Geoforum 2014, 51, 107–120. [Google Scholar] [CrossRef]
  44. Imteaz, M.A.; Adeboye, O.B.; Rayburg, S.; Shanableh, A. Rainwater harvesting potential for southwest Nigeria using daily water balance model. Resour. Conserv. Recycl. 2012, 62, 51–55. [Google Scholar] [CrossRef]
  45. Rahman, A.; Keane, J.; Imteaz, M.A. Rainwater harvesting in Greater Sydney: Water savings, reliability and economic benefits. Resour. Conser. Recycl. 2012, 61, 16–21. [Google Scholar] [CrossRef]

