
The Environmental, Social, Governance, and Financial Performance Effects on Companies that Adopt the United Nations Global Compact


Abstract
:1. Introduction
2. Global Compact Features, Literature Review, and Hypotheses
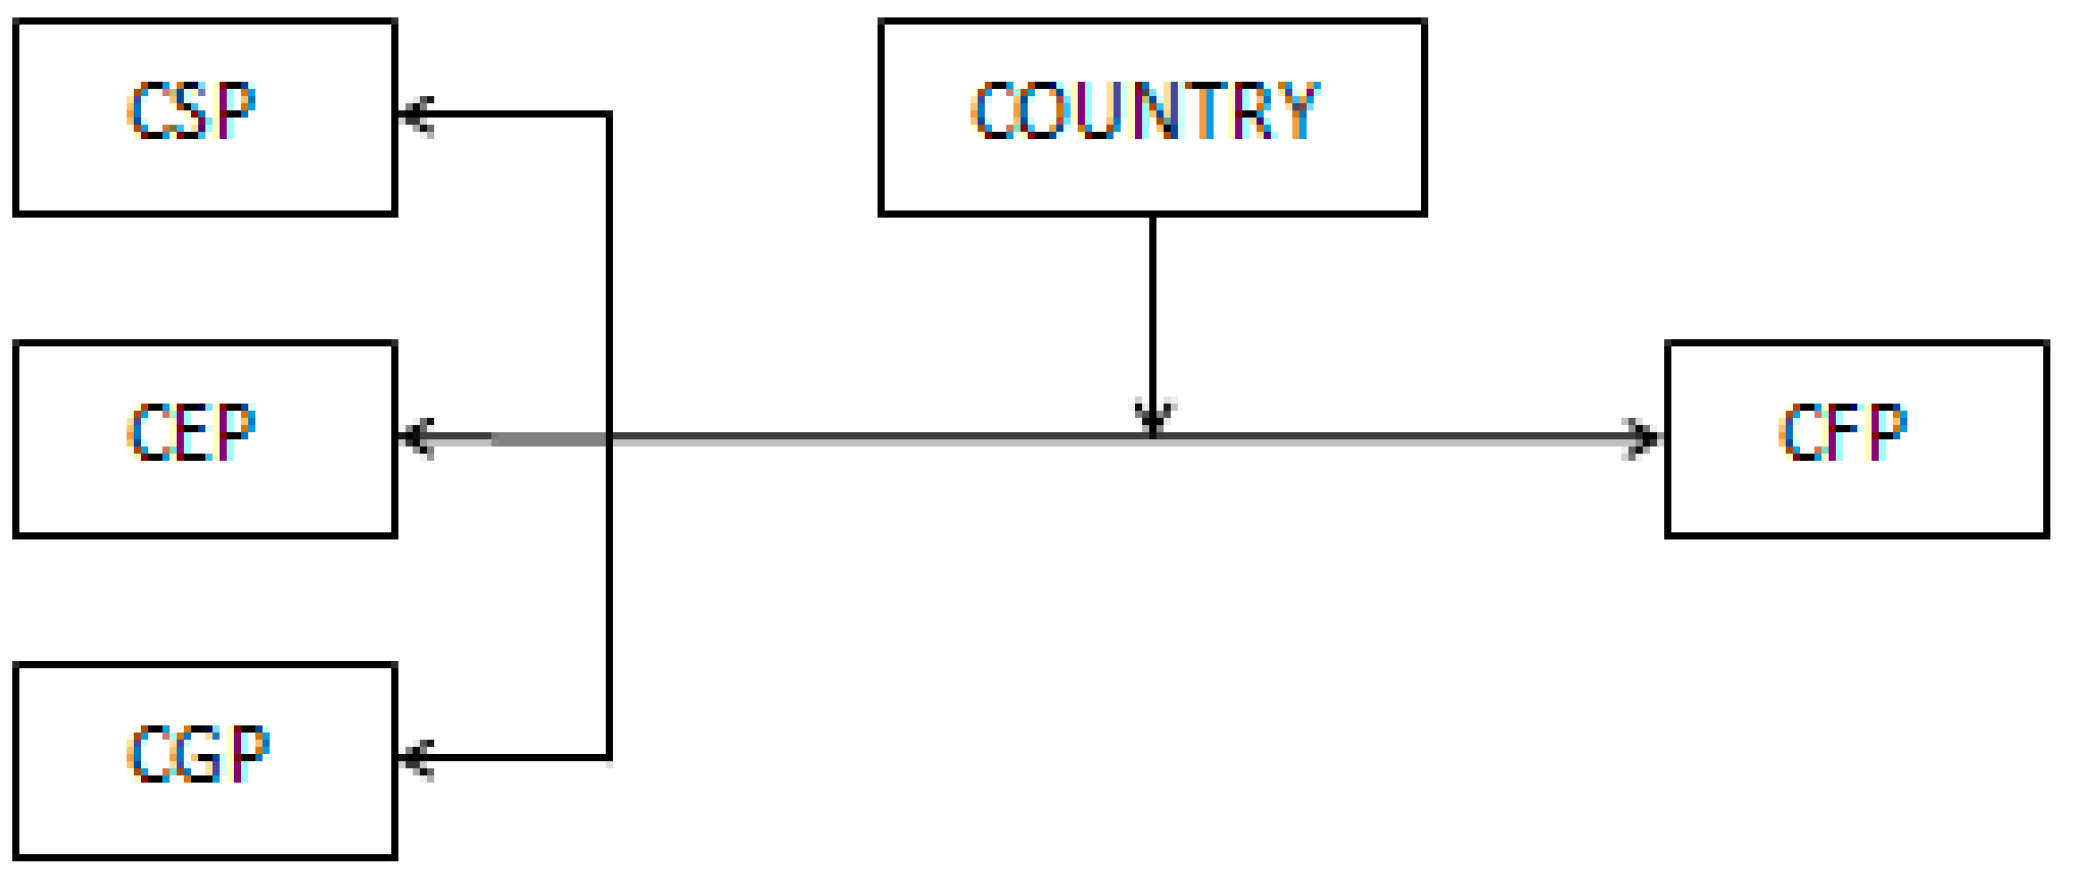
2.1. The UNGC and Its Impact on Companies’ ESG Performance
2.2. Bidirectional Linkages between ESG and Financial Performances of Companies Committed to the UNGC
2.3. The Role of Country as a Moderator Variable
3. Sample, Data, and Method
- CSP: measures a company’s capacity to generate trust and loyalty in its workforce, customers, and society, through its use of best management practices. It is a reflection of the company’s reputation, which is a key factor in determining its ability to generate long-term value. This composite index results from a weighted score of the company’s strengths and weakness on indicators related to: (a) product responsibility, (b) community, (c) human rights, (d) diversity and opportunity, (e) employment quality, (f) health and safety and (g) training and development.
- CEP: measures a company’s impact on living and non-living natural systems, including the air, land, and water, as well as complete ecosystems. It reflects the extent to which a company uses best management practices to avoid environmental risks and capitalize on environmental opportunities. This composite index results from a weighted score of the company’s strengths and weaknesses on indicators related to: (a) emission reduction, (b) product innovation, and (c) resource consumption reduction.
- CGP: measures a company’s systems and processes, which ensure that its board members and executives act in the best interests of its long-term shareholders. It reflects a company’s capacity, through its use of best management practices, to direct and control its rights and responsibilities through the creation of incentives. This composite index results from a weighted score of the company’s strengths and weaknesses on indicators related to: (a) board functions, (b) board structure, (c) compensation policy, (d) vision and strategy, and (e) shareholder rights.

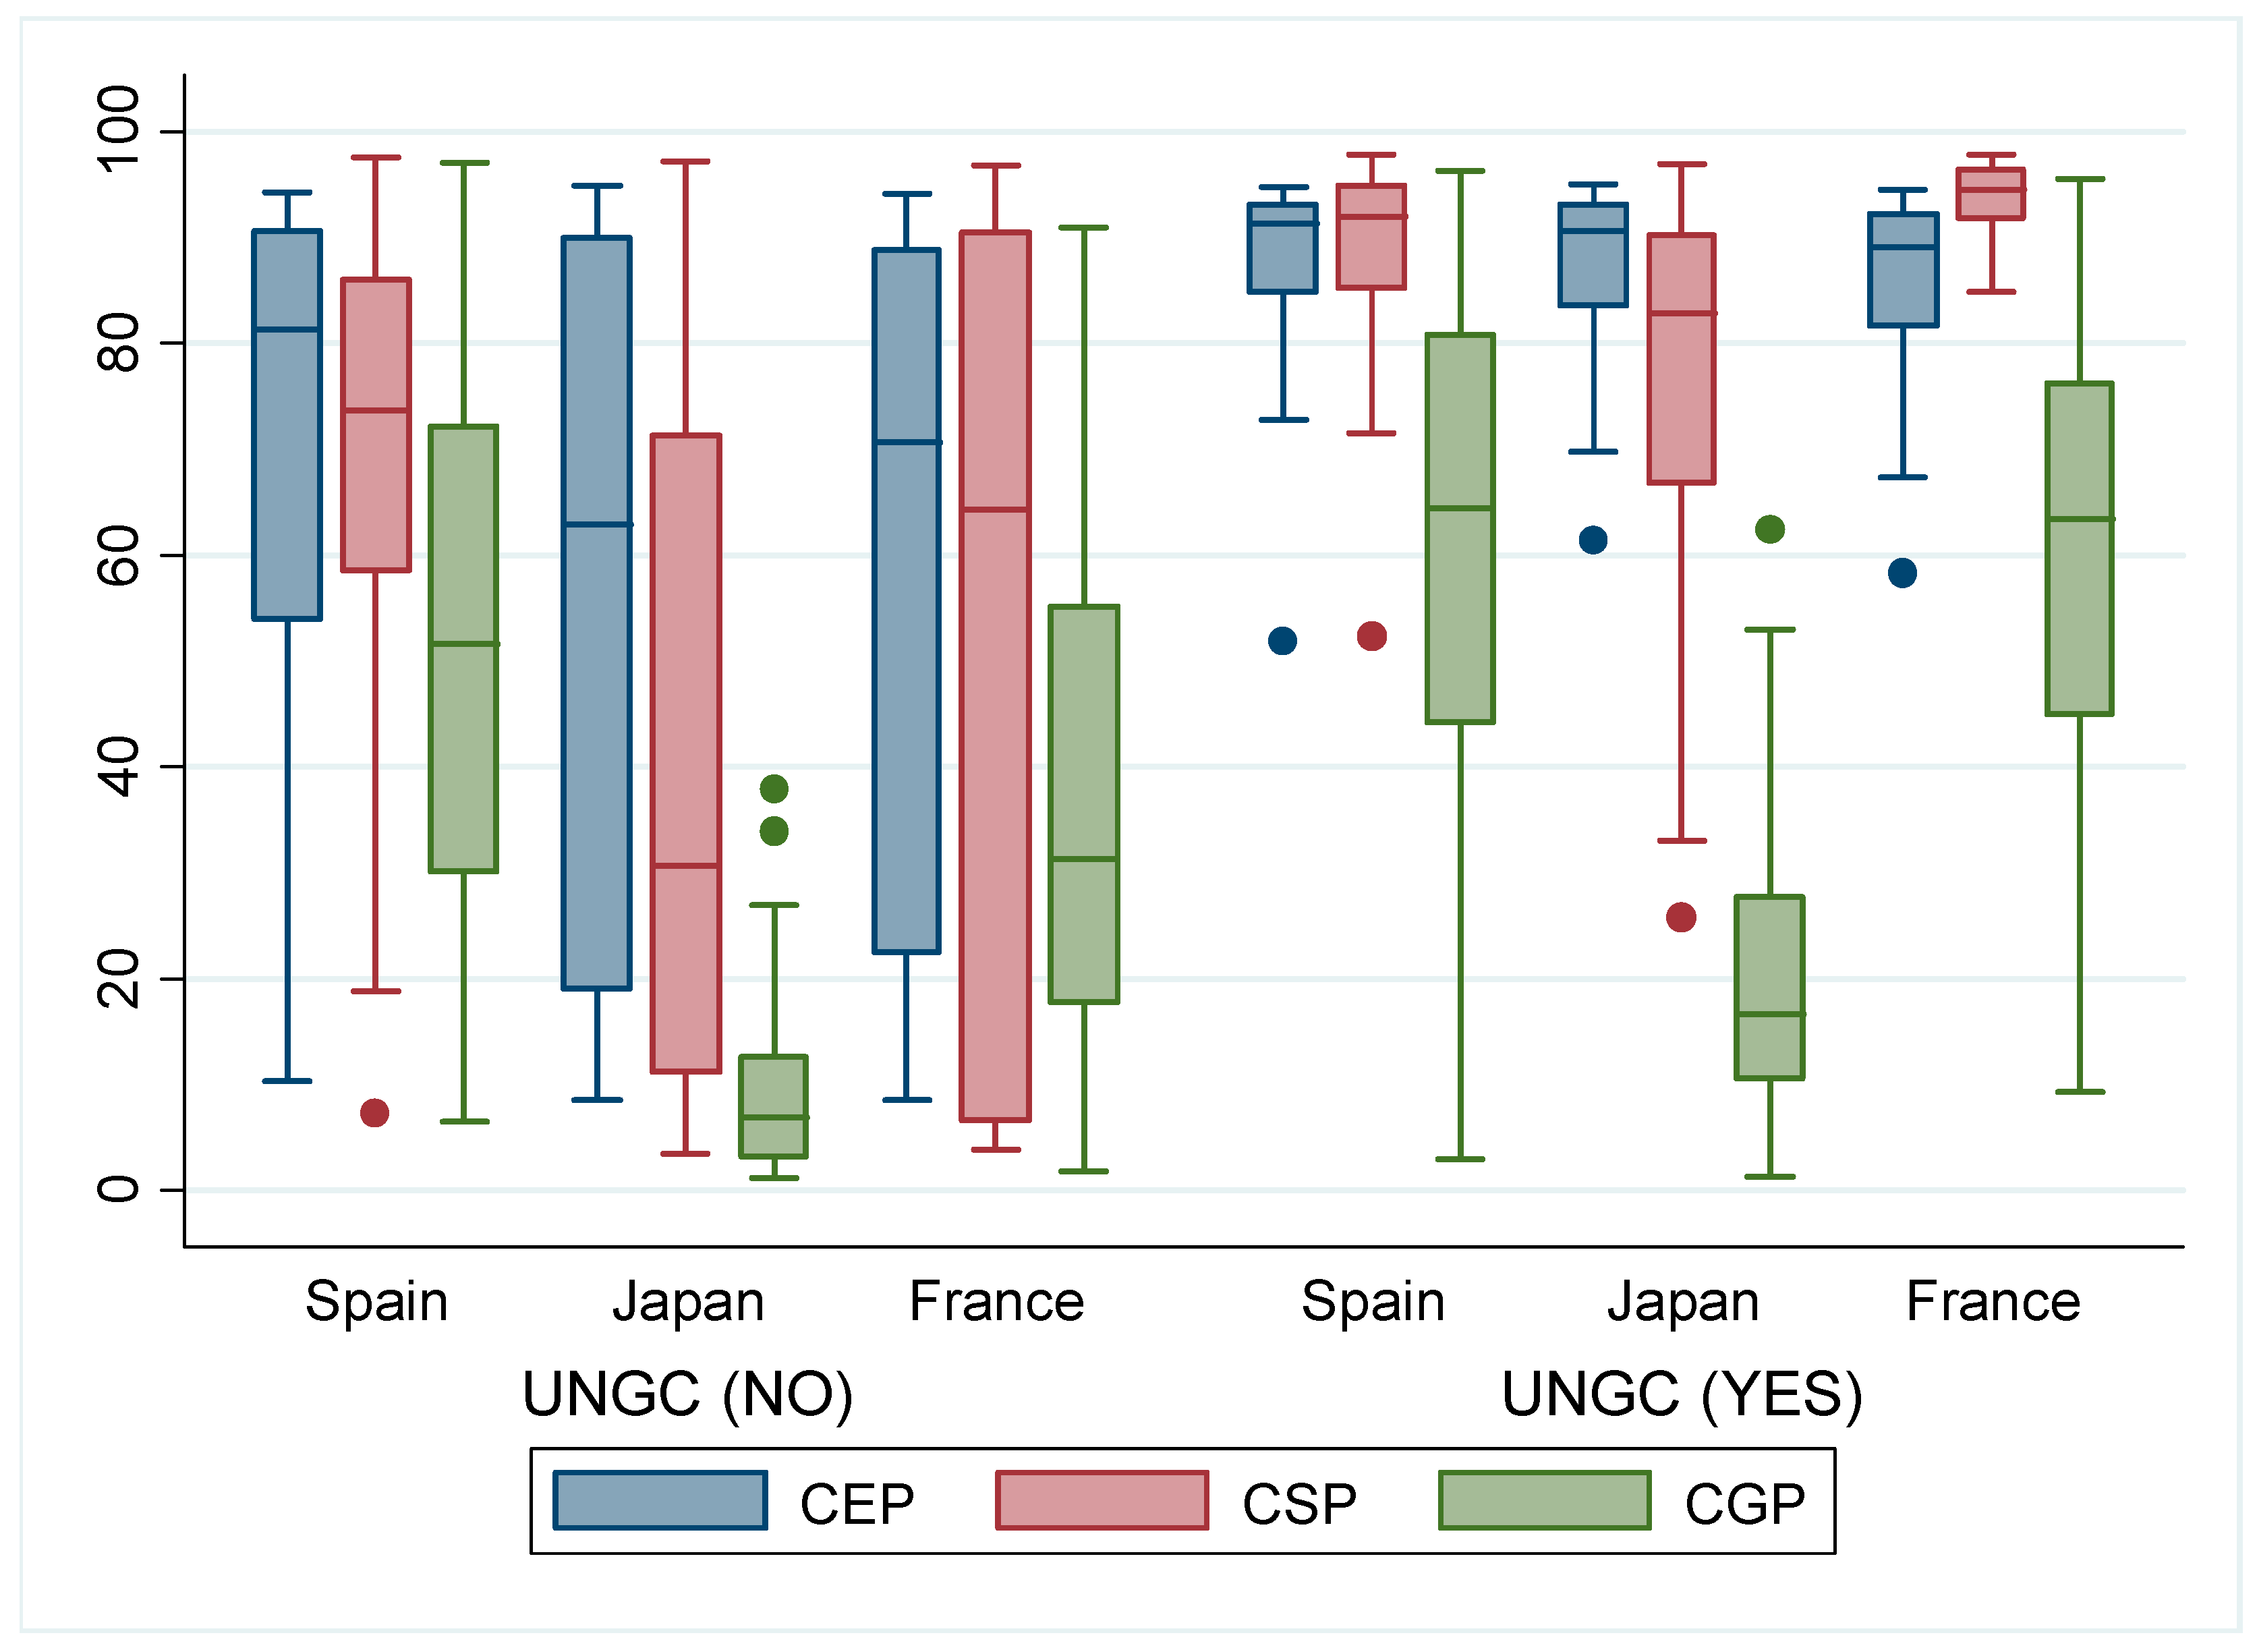
4. Results and Discussion

| Mean | SD | CEP | CSP | CGP | TQ | ROA | Size | Leverage | R&D intensity | UNGC | |
|---|---|---|---|---|---|---|---|---|---|---|---|
| CEP | 66.25 | 31.26 | 1 | ||||||||
| CSP | 56.64 | 33.57 | 0.773 | 1 | |||||||
| CGP | 23.42 | 24.91 | 0.400 | 0.555 | 1 | ||||||
| TQ | 1.224 | 0.658 | 0.097 | 0.007 | 0.077 | 1 | |||||
| ROA | 2.984 | 5.393 | 0.098 | 0.034 | 0.042 | 0.411 | 1 | ||||
| Size | 19.61 | 2.309 | 0.086 | −0.017 | −0.433 | −0.311 | −0.132 | 1 | |||
| Leverage | 1.255 | 1.102 | 0.016 | 0.022 | 0.014 | −0.006 | −0.043 | −0.032 | 1 | ||
| R&D intensity | 3.535 | 3.535 | 0.156 | 0.188 | 0.113 | 0.233 | −0.055 | −0.134 | −0.019 | 1 | |
| UNGC | 0.500 | 0.478 | 0.323 | 0.451 | 0.419 | −0.002 | −0.004 | −0.124 | 0.033 | 0.049 | 1 |

| CSP | CEP | CGP | ||||||||||
|---|---|---|---|---|---|---|---|---|---|---|---|---|
| Constant | 62.78 *** (14.007) | 32.45 *** (12.629) | 58.93 *** (14.861) | 33.65 *** (13.447) | 52.06 *** (12.203) | 29.65 *** (11.582) | 51.69 *** (12.572) | 34.59 *** (11.976) | 61.98 *** (12.042) | 42.23 *** (10.23) | 59.02 *** (12.45) | 45.04 *** (10.34) |
| UNGC | 34.35 *** (2.796) | 31.57 *** (2.931) | 23.96 *** (2.573) | 20.25 *** (2.614) | 19.52 *** (1.813) | 17.41 *** (1.979) | ||||||
| Financial controls | ||||||||||||
| Size | −0.433 (0.677) | 0.675 (0.606) | 0.889 (0.590) | 1.724 (0.555) | −4.700 *** (0.431) | −4.118 *** (0.394) | ||||||
| Leverage | 5.7 × 10⁻⁶ (0.0005) | 1.1 × 10⁻⁶ (0.0005) | 7.5 × 10⁻⁶ (0.0005) | 3.9 × 10⁻⁶ (0.0005) | 9.3 × 10⁻⁶ (0.0003) | 3.5 × 10⁻⁶ (0.0003) | ||||||
| R&D intensity | 0.672 *** (0.161) | 0.691 *** (0.157) | 0.410 (0.142) | 0.437 *** (0.139) | −0.033 (0.108) | −0.026 (0.106) | ||||||
| L1 size | −0.088 (0.720) | 0.815 (0.647) | 1.059 * (0.609) | 1.682 *** (0.576) | −4.460 *** (0.469) | −3.999 *** (0.437) | ||||||
| L1 leverage | −0.0006 (0.0008) | −0.0007 (0.0008) | −0.0003 (0.0007) | −0.0004 (0.0007) | 0.0001 (0.0006) | 0.0001 (0.0006) | ||||||
| L1 R&D intensity | 0.577 *** (0.182) | 0.601 *** (0.177) | 0.363 ** (0.158) | 0.393 ** (0.156) | 0.056 (0.122) | 0.065 (0.119) | ||||||
| Non-financial controls | ||||||||||||
| Consumer cyclicals | −3.892 (5.308) | −4.657 (4.602) | 1.331 (5.384) | −0.183 (4.727) | −6.562 (4.618) | −7.067 (4.239) | −0.388 (4.536) | −1.345 (4.215) | 2.474 (3.349) | 1.979 (2.982) | 3.525 (3.492) | 2.688 (3.192) |
| Consumer non-cyclicals | −9.672 (6.685) | −14.11 ** (5.809) | −6.992 (6.848) | −12.52 ** (6.032) | −16.35 *** (5.816) | −19.43 *** (5.35) | −14.29 ** (5.769) | −17.82 *** (5.379) | 3.978 (4.219) | 1.422 (3.765) | 5.435 (4.442) | 2.364 (4.073) |
| Energy | 12.120 (8.903) | 4.111 (7.751) | 10.253 (9.112) | 4.177 (8.028) | 4.682 (7.746) | −0.858 (7.138) | 1.741 (7.679) | −2.132 (7.157) | 17.13 *** (5.620) | 12.54 ** (5.024) | 15.82 *** (5.913) | 12.47 ** (5.421) |
| Financials | −26.24 ** (12.786) | −21.47 * (11.164) | −1.847 (21.614) | −9.024 (18.965) | −33.14 *** (11.129) | −29.79 *** (10.261) | −25.46 (18.205) | −29.97 * (16.913) | 3.671 (8.095) | 6.245 (7.253) | 15.48 (14.02) | 11.47 (12.80) |
| Healthcare | −1.990 (7.777) | −3.659 (6.787) | 0.388 (7.647) | −1.682 (6.767) | −11.36 * (6.769) | −12.63 ** (6.239) | −10.17 (6.459) | −11.63 * (6.029) | 1.225 (4.925) | 0.279 (4.409) | 1.065 (4.973) | −0.064 (4.570) |
| Industrials | 0.110 (5.108) | −4.142 (4.442) | 3.797 (5.131) | −0.901 (4.524) | 0.529 (4.444) | −2.410 (4.091) | 4.297 (4.323) | 1.311 (4.034) | 4.382 (3.223) | 1.922 (2.877) | 4.285 (3.328) | 1.712 (3.055) |
| Technology | −3.046 (6.200) | −6.989 (5.387) | 0.641 (6.154) | −4.204 (5.426) | −6.312 (5.394) | −9.099 * (4.9615) | −3.563 (5.187) | −6.718 (4.837) | 4.004 (3.914) | 1.741 (3.492) | 4.779 (3.993) | 2.115 (3.664) |
| Telecomm. Services | 8.204 (11.798) | 3.616 (10.237) | 5.220 (12.092) | 3.169 (10.608) | −6.065 (10.265) | −9.285 (9.429) | −9.830 (10.185) | −11.15 (9.460) | 14.83 ** (7.446) | 12.19 * (6.633) | 9.368 (7.842) | 8.254 (7.163) |
| Utilities | 4.873 (8.359) | 1.863 (7.257) | −2.682 (8.664) | −4.280 (7.606) | 3.313 (7.273) | 1.244 (6.683) | −0.269 (7.299) | −1.312 (6.783) | 11.24 ** (5.277) | 9.572 ** (4.704) | 6.921 (5.620) | 6.094 (5.136) |
| Time effects | ||||||||||||
| 2009 | 2.822 *** (0.757) | 2.890 *** (0.755) | 2.196 *** (0.666) | 2.244 *** (0.666) | 1.799 *** (0.515) | 1.835 *** (0.514) | ||||||
| 2010 | 3.131 *** (0.753) | 3.169 *** (0.751) | −0.105 (0.711) | 0.030 (0.709) | 3.188 *** (0.663) | 3.218 *** (0.662) | 0.771 (0.623) | 0.797 (0.623) | 5.132 *** (0.512) | 5.154 *** (0.512) | 2.861 *** (0.481) | 2.882 *** (0.480) |
| 2011 | 5.332 *** (0.756) | 5.343 *** (0.755) | 2.259 *** (0.710) | 2.279 *** (0.709) | 4.489 *** (0.665) | 4.503 *** (0.665) | 2.133 *** (0.623) | 2.150 *** (0.623) | 4.913 *** (0.515) | 4.920 *** (0.514) | 2.691 *** (0.480) | 2.701 *** (0.480) |
| 2012 | 3.847 *** (0.753) | 3.787 *** (0.752) | 0.825 (0.712) | 0.828 (0.711) | 3.850 *** (0.663) | 3.802 *** (0.663) | 1.552 ** (0.624) | 1.558 ** (0.624) | 1.293 ** (0.513) | 1.250 ** (0.512) | −1.039 ** (0.481) | −1.038 ** (0.481) |
| 2013 | 4.996 *** (0.766) | 4.861 *** (0.764) | 2.122 *** (0.726) | 2.146 *** (0.724) | 4.329 *** (0.674) | 4.217 *** (0.674) | 2.285 *** (0.637) | 2.232 *** (0.637) | 1.218 ** (0.521) | 1.185 ** (0.520) | −1.412 *** (0.491) | −1.454 *** (0.490) |
| TQ | ROA | CSP | CEP | CGP | |
|---|---|---|---|---|---|
| Constant | 2.154 *** (0.229) | 14.10 *** (3.142) | 65.04 *** (13.534) | 58.23 *** (12.234) | 65.34 *** (13.936) |
| L1 CEP | 0.0423 *** (0.0061) | 0.034 *** (0.002) | |||
| L1 CSP | 0.0157 ** (0.0064) | −0.004 (0.014) | |||
| L1 CGP | 0.0009 (0.0007) | 0.013 *** (0.004) | |||
| L1 TQ | 2.822 ** (1.189) | −0.498 (1.568) | 0.160 (0.612) | ||
| L1 ROA | 0.159 * (0.085) | 0.163 ** (0.084) | 0.058 (0.041) | ||
| Financial controls | |||||
| L1 size | −0.429 *** (0.010) | −0.279 * (0.144) | 2.322 ** (1.024) | 2.250 ** (0.873) | −3.154 *** (0.478) |
| L1 leverage | 2 × 10⁻⁶ (9 × 10⁻⁷) | −0.0001 *** (0.00001) | −0.0004 (0.0009) | −0.0004 (0.0007) | −0.0006 (0.0004) |
| L1 R&D intensity | −0.005 (0.004) | −0.198 *** (0.070) | 0.698 *** (0.220) | 0.615 *** (0.192) | 0.014 (0.112) |
| Non-financial controls | |||||
| Consumer cyclicals | −0.065 (0.093) | −1.305 (1.200) | 0.318 (6.077) | −0.231 (5.487) | −1.103 (2.937) |
| Consumer non-cyclicals | 0.289 *** (0.106) | 1.089 (1.361) | −25.11 *** (8.310) | −28.18 *** (7.504) | −6.884 * (3.893) |
| Energy | −0.063 (0.125) | 0.078 (1.616) | 6.915 (11.44) | 1.225 (10.34) | 11.595 ** (5.736) |
| Financials | −0.215 (0.283) | −4.446 (3.576) | −33.38 (29.46) | −34.93 (26.60) | 0.541 (6.735) |
| Healthcare | 0.654 *** (0.132) | 4.793 *** (1.740) | −2.330 (8.921) | −14.31 * (8.066) | −1.893 (4.497) |
| Industrials | −0.051 (0.086) | −0.932 (1.098) | −3.616 (5.927) | 2.876 (5.352) | −0.521 (2.899) |
| Technology | 0.046 (0.101) | −1.929 (1.294) | −4.332 (7.264) | −8.820 (6.561) | 1.008 (3.568) |
| Telecomm. Services | 0.293 (0.182) | 1.255 (2.370) | 5.500 (14.04) | −11.01 (12.68) | 6.638 (7.060) |
| Utilities | −0.081 (0.141) | −0.617 (1.857) | −9.875 (9.847) | −4.282 (8.893) | 3.248 (4.786) |
| Time effects | |||||
| 2010 | −0.008 (0.024) | −1.407 *** (0.455) | 0.992 (0.972) | 0.456 (0.894) | 3.930 *** (1.150) |
| 2011 | −0.099 *** (0.024) | −0.866 * (0.455) | 2.992 *** (0.940) | 3.129 *** (0.865) | 4.030 *** (1.063) |
| 2012 | −0.085 *** (0.023) | −1.655 *** (0.448) | 0.622 (0.946) | 1.542 * (0.870) | −0.577 (1.065) |
| 2013 | −0.007 (0.024) | −1.863 *** (0.447) | 2.265 ** (0.978) | 2.289 ** (0.900) | −1.895 * (1.108) |
| TQ | ROA | CSP | CEP | |
|---|---|---|---|---|
| Constant | 2.345 *** (0.301) | 12.02 *** (2.734) | 63.82 *** (12.622) | 55.91 *** (12.066) |
| L1 CEP | 0.0253 *** (0.0045) | 0.019 *** (0.002) | ||
| L1 CEP * France | 0.0004 (0.0623) | 0.0014 (0.0402) | ||
| L1 CEP * Japan | 0.1235 *** (0.0034) | −0.026 *** (0.0001) | ||
| L1 CSP | 0.0124 *** (0.0014) | |||
| L1 CSP * France | −0.018 *** (0.0001) | |||
| L1 CSP * Japan | −0.035 *** (0.0001) | |||
| L1 CGP | 0.0125 *** (0.003) | |||
| L1 CGP * France | 0.0023 (0.0475) | |||
| L1 CGP * Japan | 0.0157 *** (0.0003) | |||
| L1 TQ | 1.429 *** (0.734) | |||
| L1 TQ * France | 1.0184 *** (0.0023) | |||
| L1 TQ * Japan | 1.7831 *** (0.871) | |||
| L1 ROA | 0.1411 * (0.0751) | 0.2371 *** (0.024) | ||
| L1 ROA * France | 0.0026 (0.012) | 0.0001 (0.0025) | ||
| L1 ROA * Japan | 0.0021 (0.294) | 0.0991 ** (0.0510) | ||
| Financial controls effect | YES *** | YES *** | YES *** | YES *** |
| Sector effect | YES *** | YES *** | YES *** | YES *** |
| Time effect | YES *** | YES *** | YES *** | YES *** |
5. Conclusions
Acknowledgments
Author Contributions
Conflicts of Interest
References
- Rasche, A.; Waddock, S.; Mclntosh, M. The United Nations Global Compact: Retrospect and prospect. Bus. Soc. 2013, 52, 6–30. [Google Scholar] [CrossRef]
- Etzion, D.; Ferraro, F. The role of analogy in the institutionalization of sustainability reporting. Organ. Sci. 2010, 21, 1092–1107. [Google Scholar] [CrossRef]
- Gilbert, D.U.; Rasche, A. Discourse ethics and social accountability: The ethics of SA 8000. Bus. Ethics Q. 2007, 17, 187–216. [Google Scholar] [CrossRef]
- Christmann, P.; Taylor, G. Firm self-regulation through international certifiable standards: Determinants of symbolic versus substantive implementation. J. Int. Bus. Stud. 2006, 37, 863–878. [Google Scholar] [CrossRef]
- Kell, G. 12 years later: Reflections on the growth of the UN Global Compact. Bus. Soc. 2013, 52, 31–52. [Google Scholar] [CrossRef]
- Rasche, A.; Gilbert, D.U. Institutionalizing global governance: The role of the United Nations Global Compact. Bus. Ethics Eur. Rev. 2012, 21, 100–114. [Google Scholar] [CrossRef]
- Leipziger, D. The Corporate Responsibility Code Book; Greenleaf Publishing: Sheffield, UK, 2010. [Google Scholar]
- Cetindamar, D. Corporate social responsibility practices and environmentally responsible behavior: The case of the United Nations Global Compact. J. Bus. Ethics 2007, 76, 163–176. [Google Scholar] [CrossRef]
- Ottaway, M. Corporatism goes global: International organizations, nongovernmental organization networks, and transnational business. Glob. Gov. 2001, 7, 265. [Google Scholar]
- Ruggie, J.G. Reconstituting the global public domain-issues, actors, and practices. Eur. J. Int. Relat. 2004, 10, 499–531. [Google Scholar] [CrossRef]
- Arevalo, J.A.; Aravind, D.; Ayuso, S.; Roca, M. The Global Compact: An analysis of the motivations of adoption in the Spanish context. Bus. Ethics Eur. Rev. 2013, 22, 1–15. [Google Scholar] [CrossRef]
- Rasche, A. A necessary supplement: What the United Nations Global Compact is and is not. Bus. Soc. 2009, 48, 511–537. [Google Scholar] [CrossRef]
- Ählström, J. Corporate response to CSO criticism: Decoupling the corporate responsibility discourse from business practice. Corp. Soc. Responsib. Environ. Manag. 2010, 17, 70–80. [Google Scholar] [CrossRef]
- Schwartz, B.; Tilling, K. ‘ISO-lating’ corporate social responsibility in the organizational context: A dissenting interpretation of ISO 26000. Corp. Soc. Responsib. Environ. Manag. 2009, 16, 289–299. [Google Scholar] [CrossRef]
- Waddock, S.A.; Graves, S.B. The corporate social performance. Strateg. Manag. J. 1997, 18, 303–319. [Google Scholar] [CrossRef]
- Kell, G.; Levin, D. The Global Compact network: An historic experiment in learning and action. Bus. Soc. Rev. 2003, 108, 151–181. [Google Scholar] [CrossRef]
- Berliner, D.; Prakash, A. From norms to programs: The United Nations Global Compact and global governance. Regul. Gov. 2012, 6, 149–166. [Google Scholar] [CrossRef]
- Ruggie, J.G. Business and human rights: The evolving international agenda. Am. J. Int. Law 2007, 101, 819–840. [Google Scholar]
- Ruggie, J.G. Trade, sustainability and global governance. Columbia J. Environ. Law 2002, 27, 297–307. [Google Scholar]
- Soederberg, S. Taming corporations or buttressing market-led development? A critical assessment of the Global Compact. Globalizations 2007, 4, 500–513. [Google Scholar]
- Runhaar, H.; Lafferty, H. Governing corporate social responsibility: An assessment of the contribution of the UN Global Compact to CSR strategies in the telecommunications industry. J. Bus. Ethics 2009, 84, 479–495. [Google Scholar] [CrossRef]
- United Nations Global Compact. Annual Review; United Nations Global Compact Office: New York, NY, USA, 2010. [Google Scholar]
- United Nations Global Compact. Annual Review; United Nations Global Compact Office: New York, NY, USA, 2012. [Google Scholar]
- Harms, D.; Hörisch, J.; Schaltegger, S.; Windolph, S.E. International Corporate Sustainability Barometer: Introduction and Structure. In Corporate Sustainability in International Comparison; Springer International Publishing: New York, NY, USA, 2014; pp. 3–12. [Google Scholar]
- Moneva, J.M.; Ortas, E.; Álvarez, I. Exploring Sustainability in Spanish Companies. In Corporate Sustainability in International Comparison; Springer International Publishing: New York, NY, USA, 2014; pp. 167–182. [Google Scholar]
- Rhouma, A.B.; Francoeur, C.; Robin, G. International Corporate Sustainability Barometer 2012: Sustainability Management in France. In Corporate Sustainability in International Comparison; Springer International Publishing: New York, NY, USA, 2014; pp. 69–91. [Google Scholar]
- Kokubu, K.; Kitada, H.; Haider, M.B. Corporate Sustainability Barometer in Japan. In Corporate Sustainability in International Comparison; Springer International Publishing: New York, NY, USA, 2014; pp. 121–140. [Google Scholar]
- Lockett, A.; Moon, J.; Visser, W. Corporate social responsibility in management research: Focus, nature, salience and sources of influence. J. Manag. Stud. 2006, 43, 115–136. [Google Scholar] [CrossRef]
- Scholtens, B. A note on the interaction between corporate social responsibility and financial performance. Ecol. Econ. 2008, 68, 46–55. [Google Scholar] [CrossRef]
- Margolis, J.D.; Elfenbein, H.A.; Walsh, J.P. Does it Pay to be Good? A Meta-Analysis and Redirection of Research on the Relationship between Corporate Social and Financial Performance; Working paper; Harvard University: Cambridge, MA, USA, 2007. [Google Scholar]
- Orlitzky, M.; Schmidt, F.L.; Rynes, S.L. Corporate social and financial performance: A meta-analysis. Organ. Stud. 2003, 24, 403–441. [Google Scholar] [CrossRef]
- Hahn, T.; Figge, F. Beyond the bounded instrumentality in current corporate sustainability research: Toward an inclusive notion of profitability. J. Bus. Ethics 2011, 104, 325–345. [Google Scholar] [CrossRef]
- Ortas, E.; Moneva, J.M.; Álvarez, I. Sustainable supply chain and company performance: A global examination. Supply Chain Manag. Int. J. 2014, 19, 332–350. [Google Scholar] [CrossRef]
- Schaltegger, S.; Synnestvedt, T. The link between ‘green’ and economic success: Environmental management as the crucial trigger between environmental and economic performance. J. Environ. Manag. 2002, 65, 339–346. [Google Scholar]
- Berger, I.E.; Cunningham, P.; Drumwright, M.E. Mainstreaming corporate social responsibility: Developing markets for virtue. Calif. Manag. Rev. 2007, 49, 132–157. [Google Scholar] [CrossRef]
- Donaldson, T.; Preston, L.E. The stakeholder theory of the corporation: Concepts, evidence, and implications. Acad. Manag. Rev. 1995, 20, 65–91. [Google Scholar]
- Jones, T.M. Instrumental stakeholder theory: A synthesis of ethics and economics. Acad. Manag. Rev. 1995, 20, 404–437. [Google Scholar]
- Anderson, J.C.; Frankle, A.W. Voluntary social reporting: An iso-beta portfolio analysis. Account. Rev. 1980, 55, 467–479. [Google Scholar]
- Berman, S.L.; Wicks, A.C.; Kotha, S.; Jones, T.M. Does stakeholder orientation matter? The relationship between stakeholder management models and firm financial performance. Acad. Manag. J. 1999, 42, 488–506. [Google Scholar]
- Freedman, M.; Stagliano, A.J. Differences in social-cost disclosures: A market test of investor reactions. Account. Audit. Account. J. 1991, 4, 68–83. [Google Scholar] [CrossRef]
- Graves, S.B.; Waddock, S.A. Beyond built to last stakeholder relations in “Built-to-Last” companies. Bus. Soc. Rev. 2000, 105, 393–418. [Google Scholar] [CrossRef]
- Griffin, J.J.; Mahon, J.F. The corporate social performance and corporate financial performance debate: Twenty-Five years of incomparable research. Bus. Soc. 1997, 36, 5–31. [Google Scholar] [CrossRef]
- Preston, L.E. Analyzing corporate social performance: Methods and results. J. Contemp. Bus. 1978, 7, 135–150. [Google Scholar]
- Brammer, S.; Millington, A. Does it pay to be different? An analysis of the relationship between corporate social and financial performance. Strateg. Manag. J. 2008, 29, 1325–1343. [Google Scholar]
- McGuire, J.B.; Schneeweis, T.; Branch, B. Perceptions of firm quality: A cause or result of firm performance. J. Manag. 1990, 16, 167–180. [Google Scholar]
- Allouche, J.; Laroche, P. A meta-analytical investigation of the relationship between corporate social and financial performance. Revue de Gestion des Ressources Humaines 2005, 57, 18–41. [Google Scholar]
- Seifert, B.; Morris, S.A.; Bartkus, B.R. Having, giving, and getting: Slack resources, corporate philanthropy, and firm financial performance. Bus. Soc. 2004, 43, 135–161. [Google Scholar] [CrossRef]
- Freeman, R.E. Strategic Management: A stakeholder Approach; Harpercollins College Div: New York, NY, USA, 1984. [Google Scholar]
- Christmann, P. Effects of “Best Practices” of environmental management on cost advantage: The role of complementary assets. Acad. Manag. J. 2000, 43, 663–680. [Google Scholar] [CrossRef]
- Ruf, B.M.; Muralidhar, K.; Brown, R.M.; Janney, J.J.; Paul, K. An Empirical investigation of the relationship between change in corporate social performance and financial performance: A stakeholder theory perspective. J. Bus. Ethics 2001, 32, 143–156. [Google Scholar] [CrossRef]
- McGuire, J.B.; Sundgren, A.; Schneeweis, T. Corporate social responsibility and firm financial performance. Acad. Manag. J. 1988, 31, 854–872. [Google Scholar] [CrossRef]
- Choi, Y.; Yu, Y. The influence of perceived corporate sustainability practices on employees and organizational performance. Sustainability 2014, 6, 348–364. [Google Scholar] [CrossRef]
- Harrison, J.S.; John, C.H.S. Strategic Management of Organizations and Stakeholders; West Publishing Company: Minnesota, MN, USA, 1994. [Google Scholar]
- Kotter, J.P.; Heskett, J.L. Corporate Culture and Performance; Free Press: New York, NY, USA, 1992. [Google Scholar]
- Kapstein, E.B. The corporate ethics crusade. Foreign Aff. 2001, 80, 105–119. [Google Scholar] [CrossRef]
- Ribstein, L.E. Accountability and responsibility in corporate governance. Notre Dame Law Rev. 2005, 81. Article 5. [Google Scholar]
- Peloza, J. Using corporate social responsibility as insurance for financial performance. Calif. Manag. Rev. 2006, 48, 52–72. [Google Scholar] [CrossRef]
- Pan, X.; Sha, J.; Zhang, H.; Ke, W. Relationship between corporate social responsibility and financial performance in the mineral Industry: Evidence from Chinese mineral firms. Sustainability 2014, 6, 4077–4101. [Google Scholar] [CrossRef]
- Turban, D.B.; Greening, D.W. Corporate social performance and organizational attractiveness to prospective employees. Acad. Manag. J. 1997, 40, 658–672. [Google Scholar] [CrossRef]
- Hofstede, G. Culture’s Consequences; Sage Publications: Thousand Oaks, CA, USA, 1980. [Google Scholar]
- Schwartz, S.H. Cultural dimensions of values-Towards an understanding of national differences. In Individualism and Collectivism: Theoretical and Methodological Issues; Kim, U., Triandis, C., Kagitcibasi, C., Choi, S.C., Yoon, G., Eds.; Sage: Thousand Oaks, CA, USA; pp. 85–119.
- Triandis, H.C. The self and social behavior in differing cultural contexts. Psychol. Rev. 1989, 96, 506–520. [Google Scholar] [CrossRef]
- Williams, C.A.; Aguilera, R.V. Corporate social responsibility in a comparative perspective. In The Oxford Handbook of Corporate Social Responsibility; Oxford University Press: New York, NY, USA, 2008; pp. 452–472. [Google Scholar]
- Oreilly, C.A.; Chatman, J.A. Culture as social control: Corporations, cults, and commitment. Res. Organ. Behav. 1996, 18, 157–200. [Google Scholar]
- Schein, E.H. Organizational Culture and Leadership; John Wiley & Sons: San Francisco, CA, USA, 2010; Volume 2. [Google Scholar]
- Sirmon, D.G.; Lane, P.J. A model of cultural differences and international alliance performance. J. Int. Bus. Stud. 2004, 35, 306–319. [Google Scholar] [CrossRef]
- Welford, R. Corporate social responsibility in Europe, North America and Asia. J. Corp. Citizsh. 2005, 2005, 33–52. [Google Scholar]
- Maignan, I.; Ralston, D.A. Corporate social responsibility in Europe and the US: Insights from businesses’ self-presentations. J. Int. Bus. Stud. 2002, 33, 497–514. [Google Scholar] [CrossRef]
- Baughn, C.C.; Bodie, N.L.; McIntosh, J.C. Corporate social and environmental responsibility in Asian countries and other geographical regions. Corp. Soc. Responsib. Environ. Manag. 2007, 14, 189–205. [Google Scholar] [CrossRef]
- Aaronson, S.A. Corporate Responsibility in the global village: The British Role model and the American laggard. Bus. Soc. Rev. 2003, 108, 309–338. [Google Scholar] [CrossRef]
- Amann, B.; Caby, J.; Jaussaud, J.; Pineiro, J. Shareholder activism for corporate social responsibility: Law and practice in the United States, Japan, France and Spain. In The New Corporate Accountability-Corporate Social Responsibility and the Law; Cambridge University Press: Cambridge, UK, 2007. [Google Scholar]
- Aoki, M. Information, Incentives and Bargaining in the Japanese Economy: A Microtheory of the Japanese Economy; Cambridge University Press: Cambridge, UK, 1989. [Google Scholar]
- Lindenberg, E.B.; Ross, S.A. Tobin’s q ratio and industrial organization. J. Bus. 1981, 54, 1–32. [Google Scholar] [CrossRef]
- Lee, D.E.; Tompkins, J.G. A modified version of the Lewellen and Badrinath measure of Tobin’s q. Financ. Manag. 1999, 28, 20–31. [Google Scholar] [CrossRef]
- McWilliams, A.; Siegel, D. Corporate social responsibility and financial performance: Correlation or misspecification? Strateg. Manag. J. 2000, 21, 603–609. [Google Scholar] [CrossRef]
- Elsayed, K.; Paton, D. The impact of environmental performance on firm performance: Static and dynamic panel data evidence. Struct. Chang. Econ. Dyn. 2005, 16, 395–412. [Google Scholar] [CrossRef]
© 2015 by the authors; licensee MDPI, Basel, Switzerland. This article is an open access article distributed under the terms and conditions of the Creative Commons Attribution license (http://creativecommons.org/licenses/by/4.0/).
Share and Cite
Ortas, E.; Álvarez, I.; Garayar, A. The Environmental, Social, Governance, and Financial Performance Effects on Companies that Adopt the United Nations Global Compact. Sustainability 2015, 7, 1932-1956. https://doi.org/10.3390/su7021932
Ortas E, Álvarez I, Garayar A. The Environmental, Social, Governance, and Financial Performance Effects on Companies that Adopt the United Nations Global Compact. Sustainability. 2015; 7(2):1932-1956. https://doi.org/10.3390/su7021932
Chicago/Turabian StyleOrtas, Eduardo, Igor Álvarez, and Ainhoa Garayar. 2015. "The Environmental, Social, Governance, and Financial Performance Effects on Companies that Adopt the United Nations Global Compact" Sustainability 7, no. 2: 1932-1956. https://doi.org/10.3390/su7021932
APA StyleOrtas, E., Álvarez, I., & Garayar, A. (2015). The Environmental, Social, Governance, and Financial Performance Effects on Companies that Adopt the United Nations Global Compact. Sustainability, 7(2), 1932-1956. https://doi.org/10.3390/su7021932