
Facilities Design Based on Apparent Motion of Grating for Speed Reduction in Tunnel

Abstract
:1. Introduction
2. Design Theory
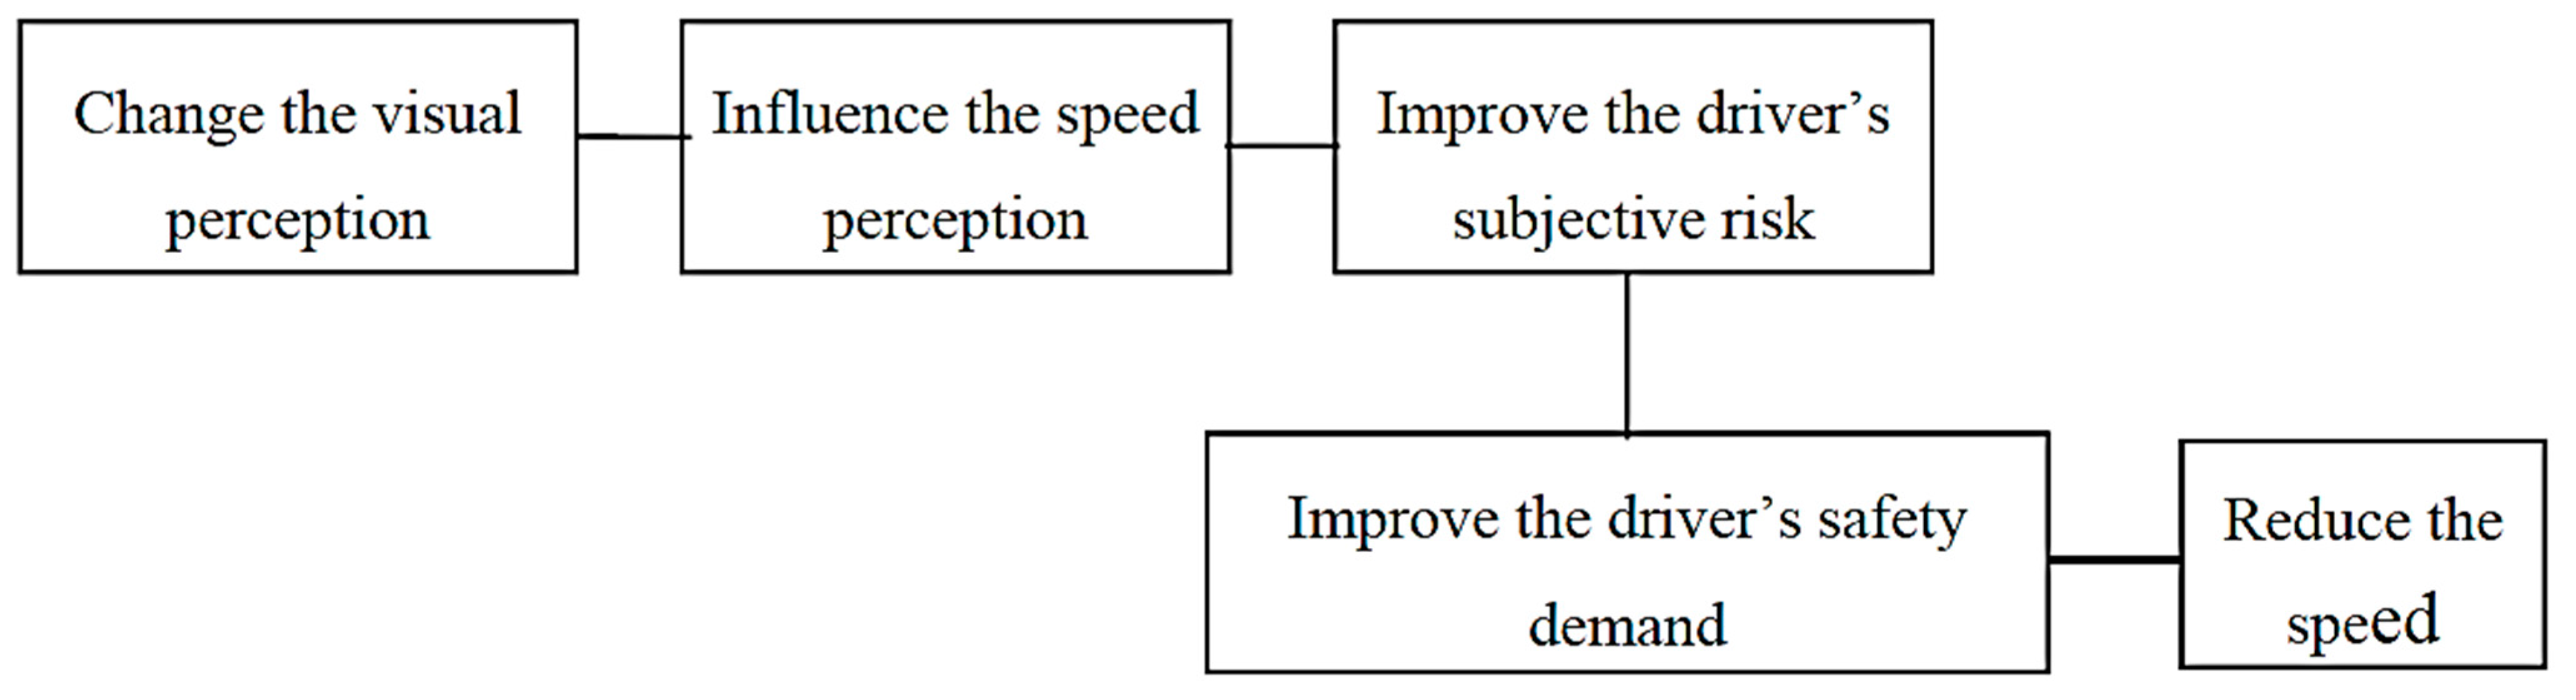
2.1. Speed Control Process

2.2. Apparent Motion
3. Experimental Section
3.1. Experiment 1: Optimal Form of Apparent Motion
3.1.1. Measurement of Optimal Form of Apparent Motion
3.1.2. Apparatus
3.1.3. Participants
3.1.4. Procedures
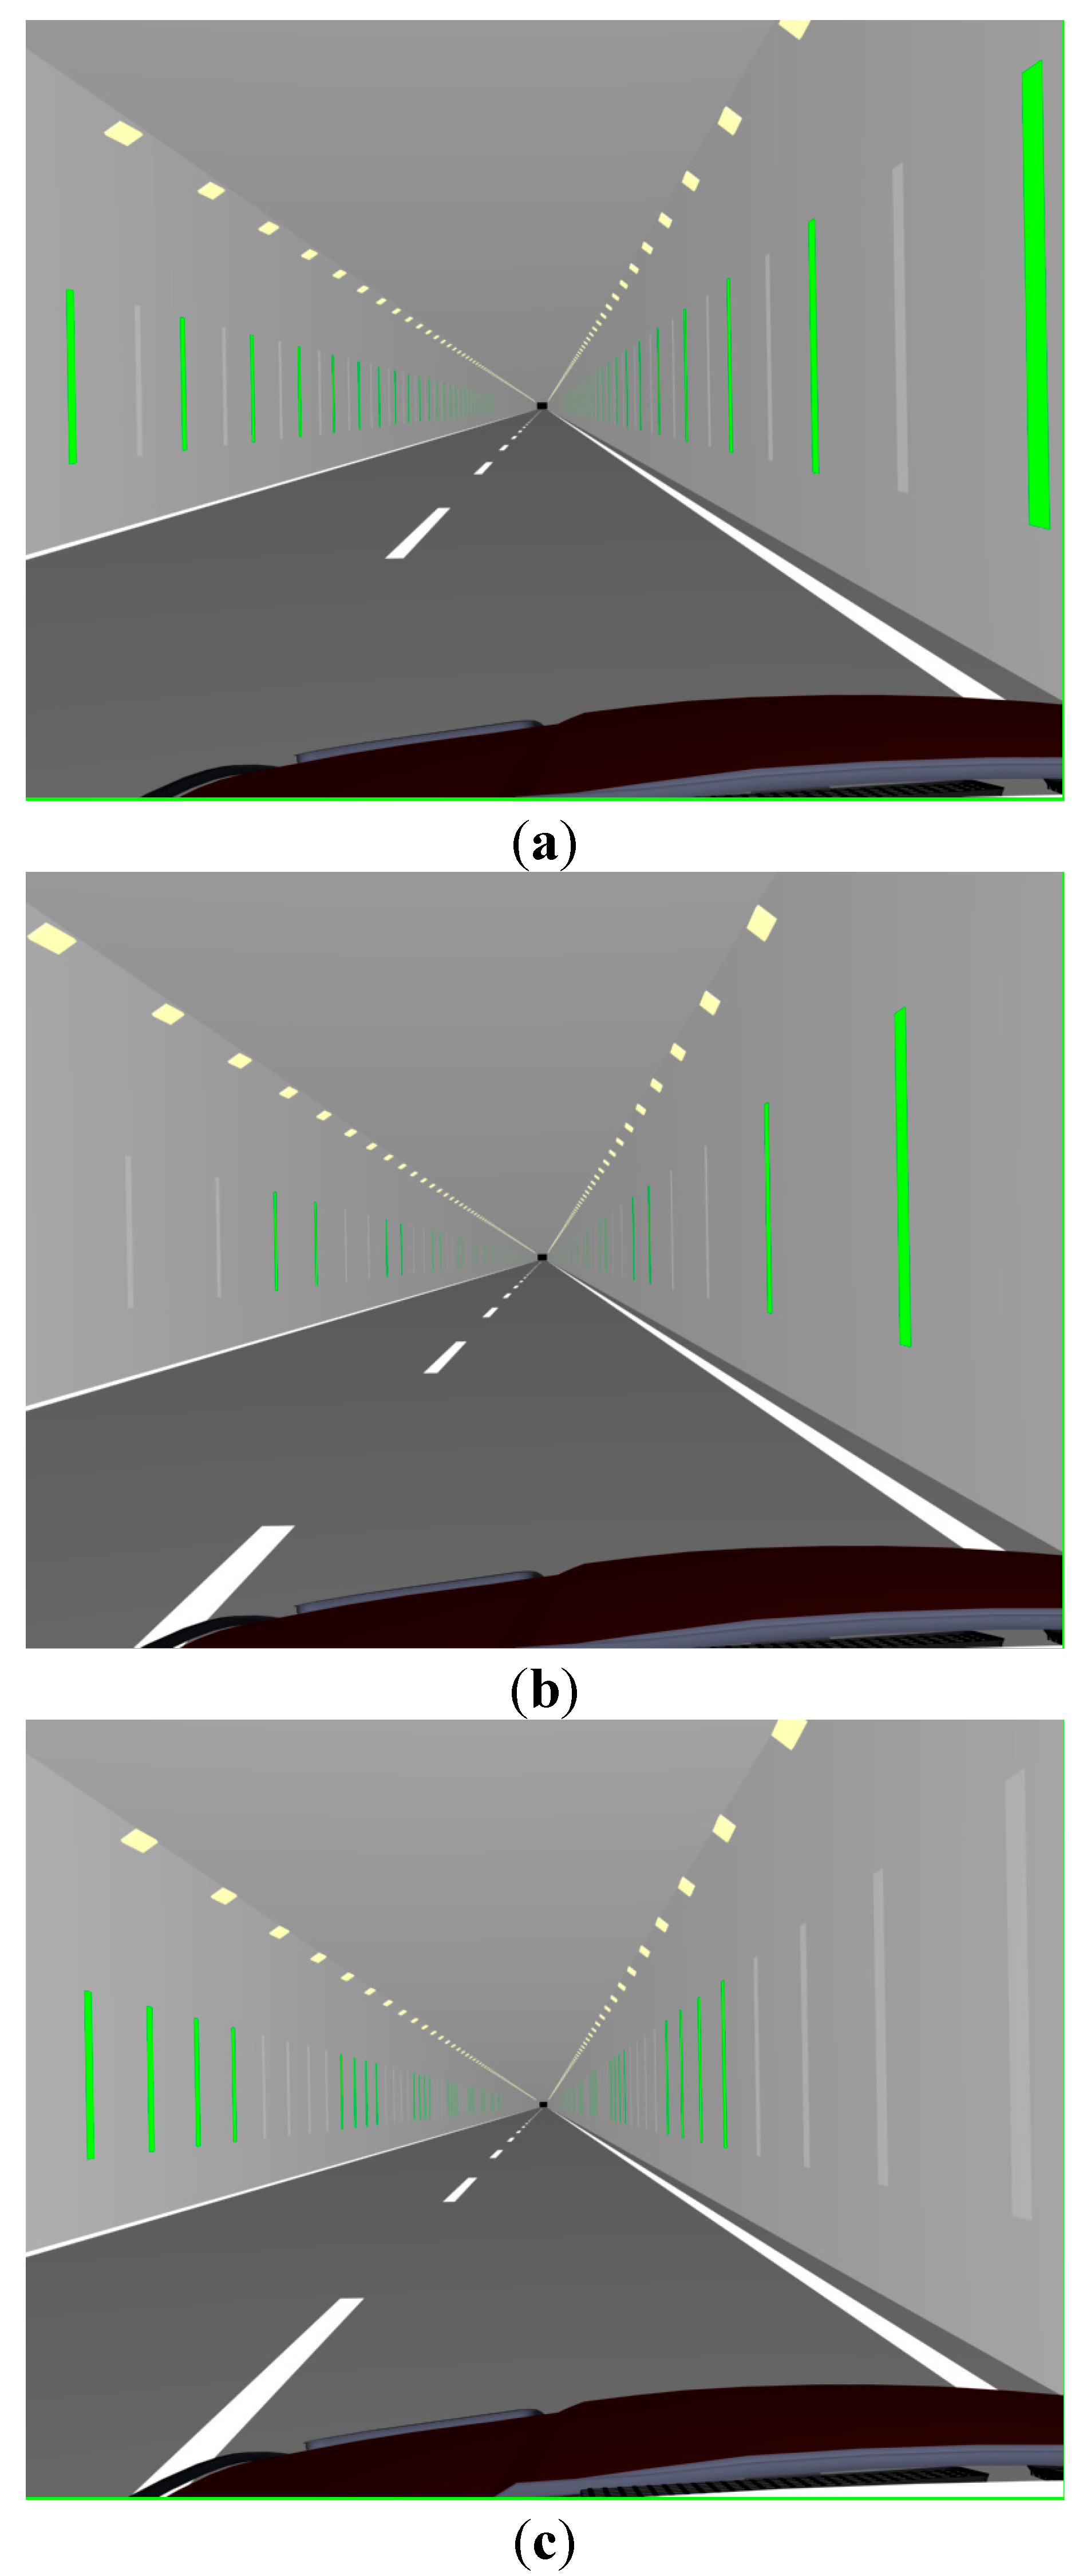
3.1.5. Experiment Scenarios

3.1.6. Results

- (1)
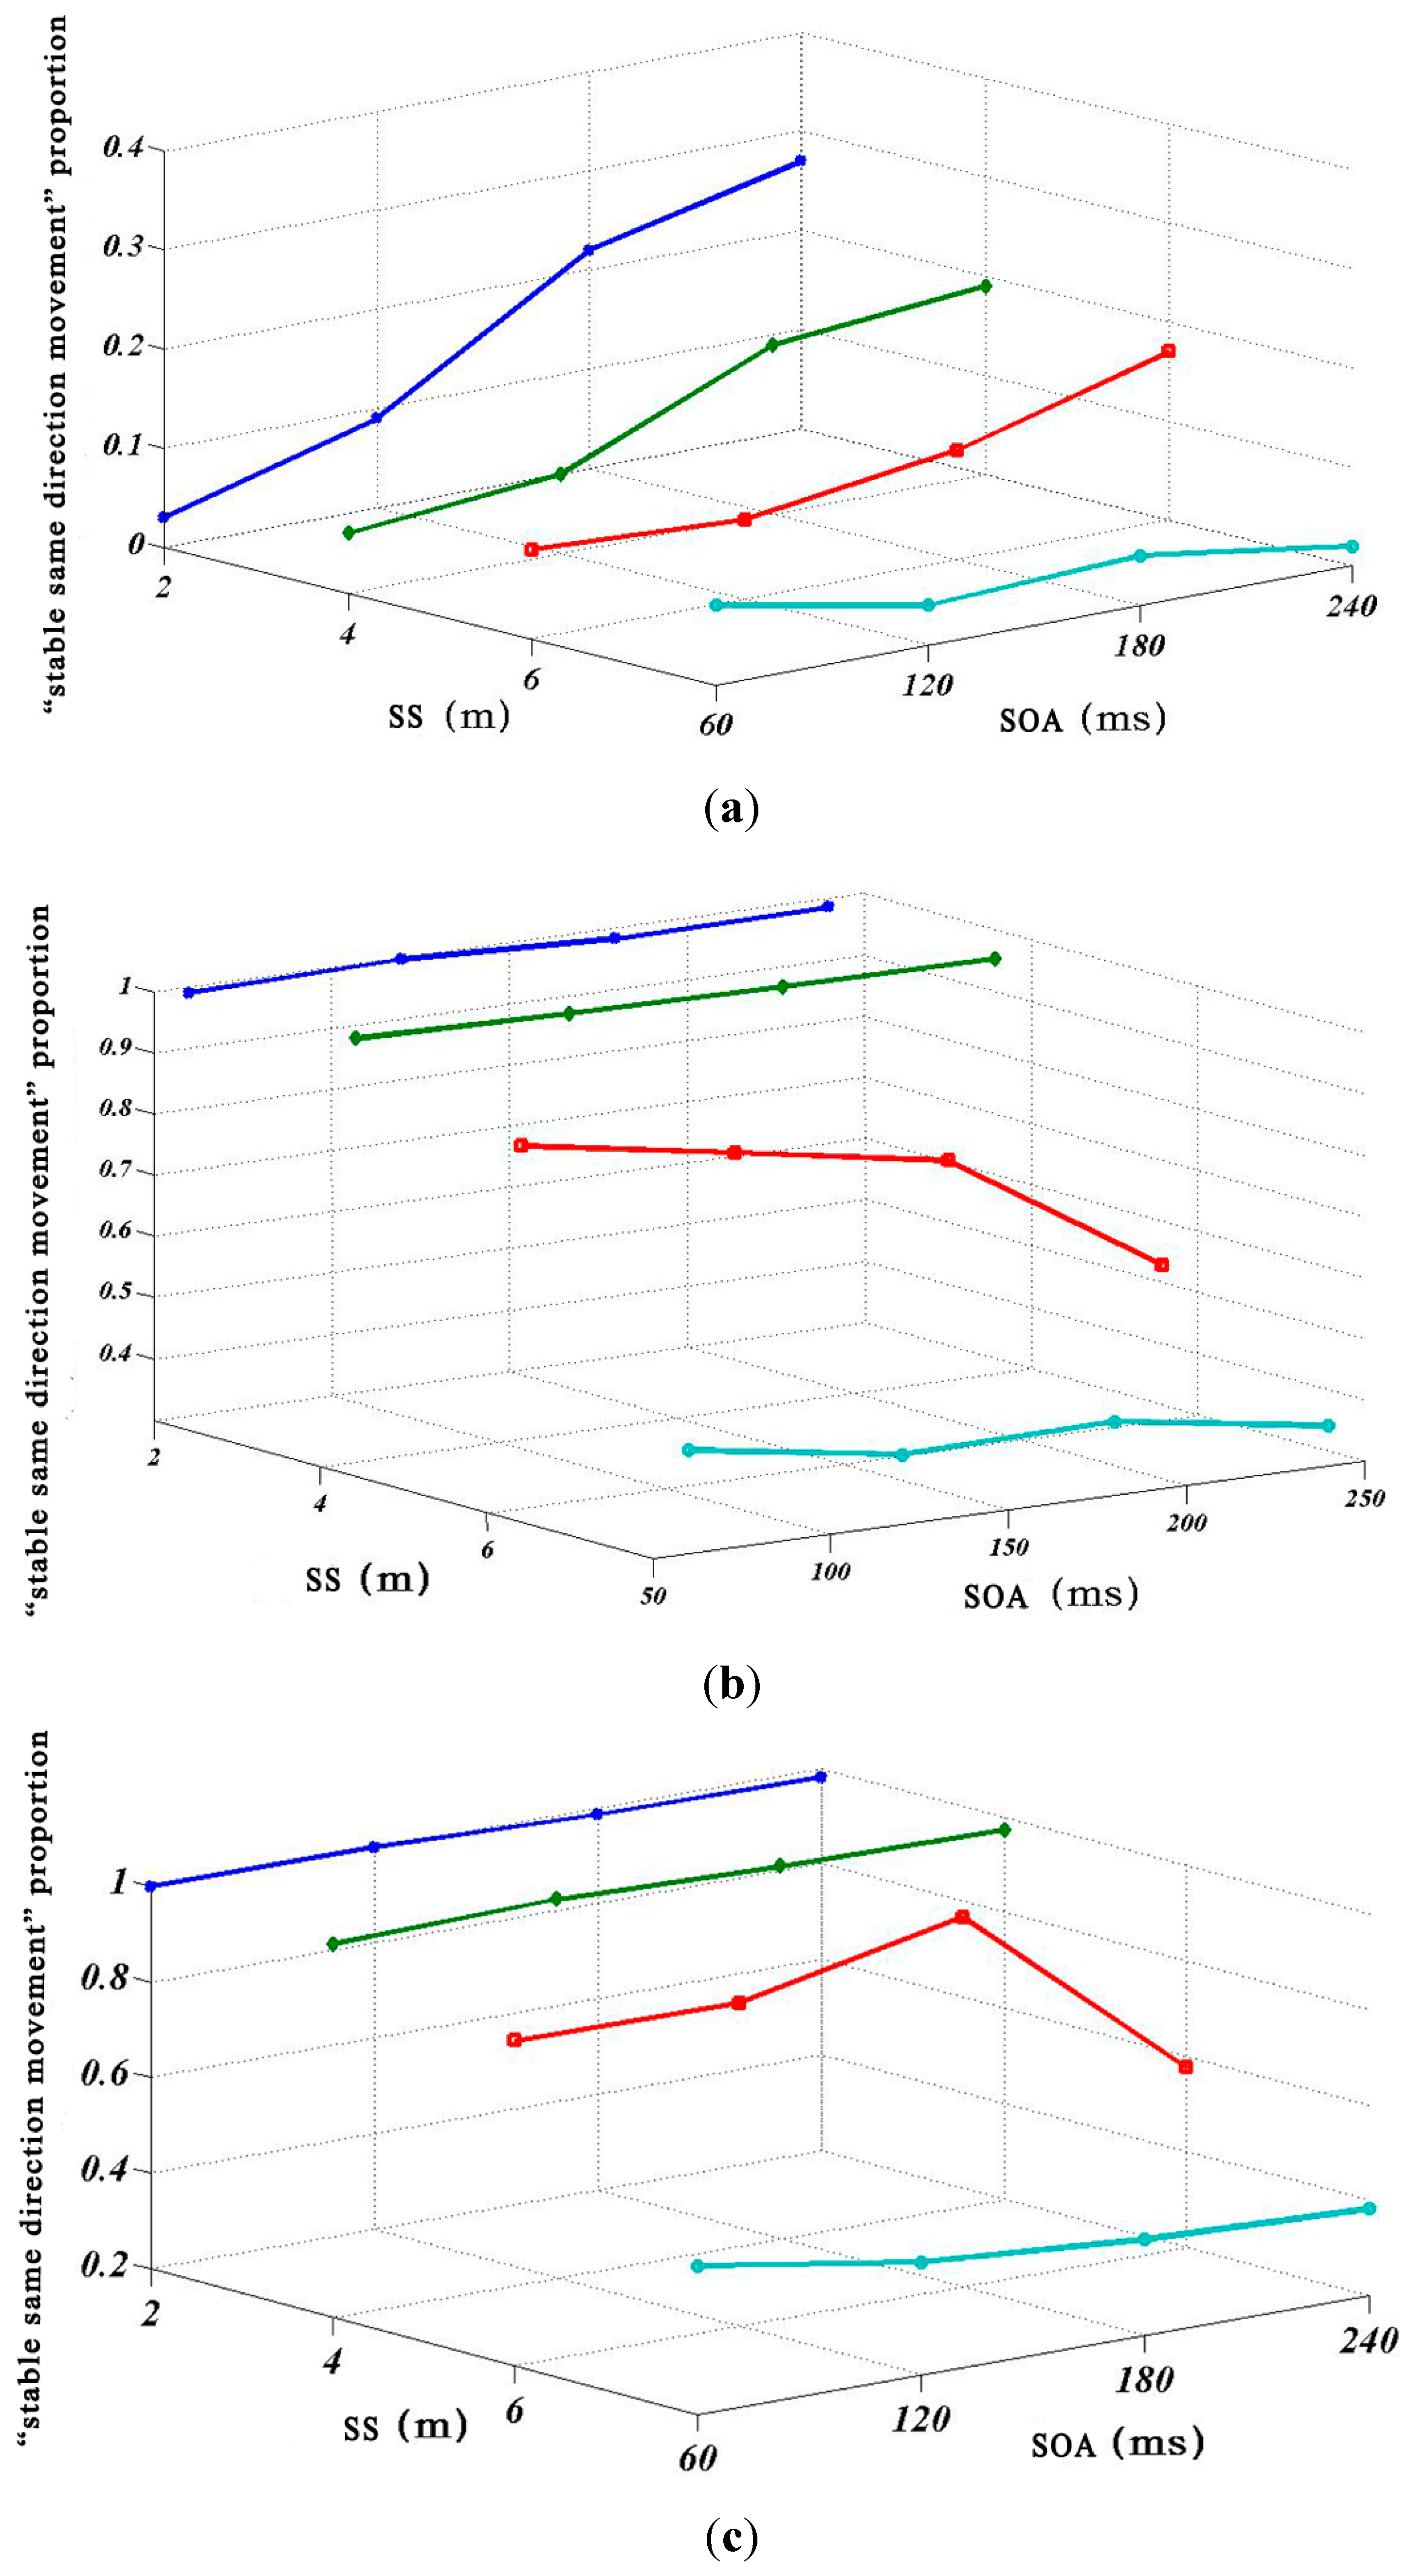
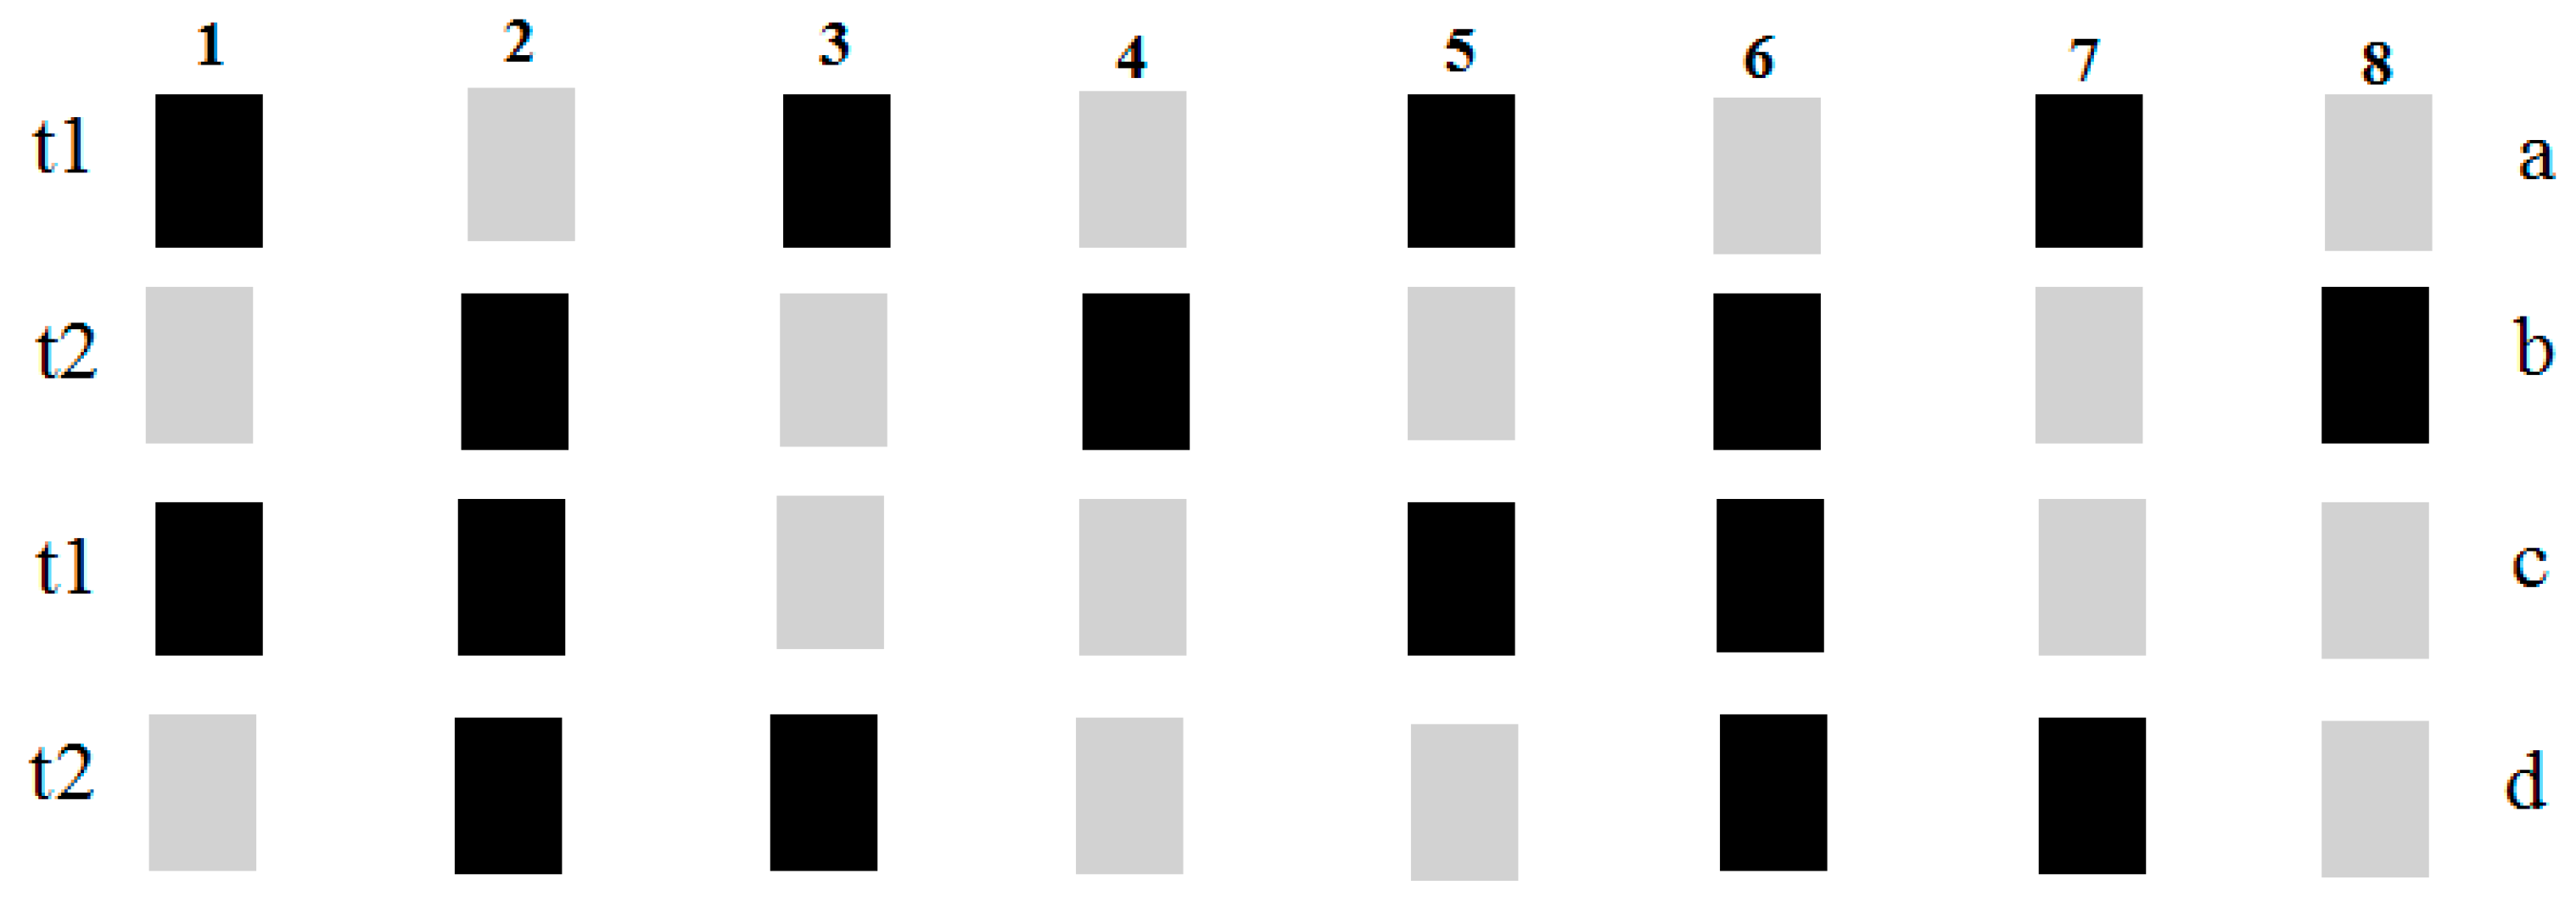
- When one bright, one dark grating was used, no matter the value of SS and the SOA, participants tended to perceived grating as “flashing” or “unstable movement”.
- (2)
- When two bright, two dark or four bright, four dark was used, with the changes of SOA and SS, participants’ perceptions of grating changed also. When the SS was 2 m or 4 m and the SOA was 60 ms, 120 ms, 180 ms or 240 ms, participants tended to perceive grating as “stable, same direction movement”. This constituted more than 95% of perceptions, which differs from the Waite Alzheimer’s experimental results. When the SS was 6 m or 8 m, the proportions reduce gradually. SS and SOA all have significant influence on apparent motion perception; the mean difference was significant at the 0.05 level using Analysis of Variance (ANOVA).
- (1)
- Layout: two bright, two dark, four bright, four dark.
- (2)
- SS: 2 m, 4 m.
- (3)
- SOA: 60 ms, 120 ms, 180 ms and 240 ms.
3.2. Experiments 2: Measurement of Driver’s Speed Perception
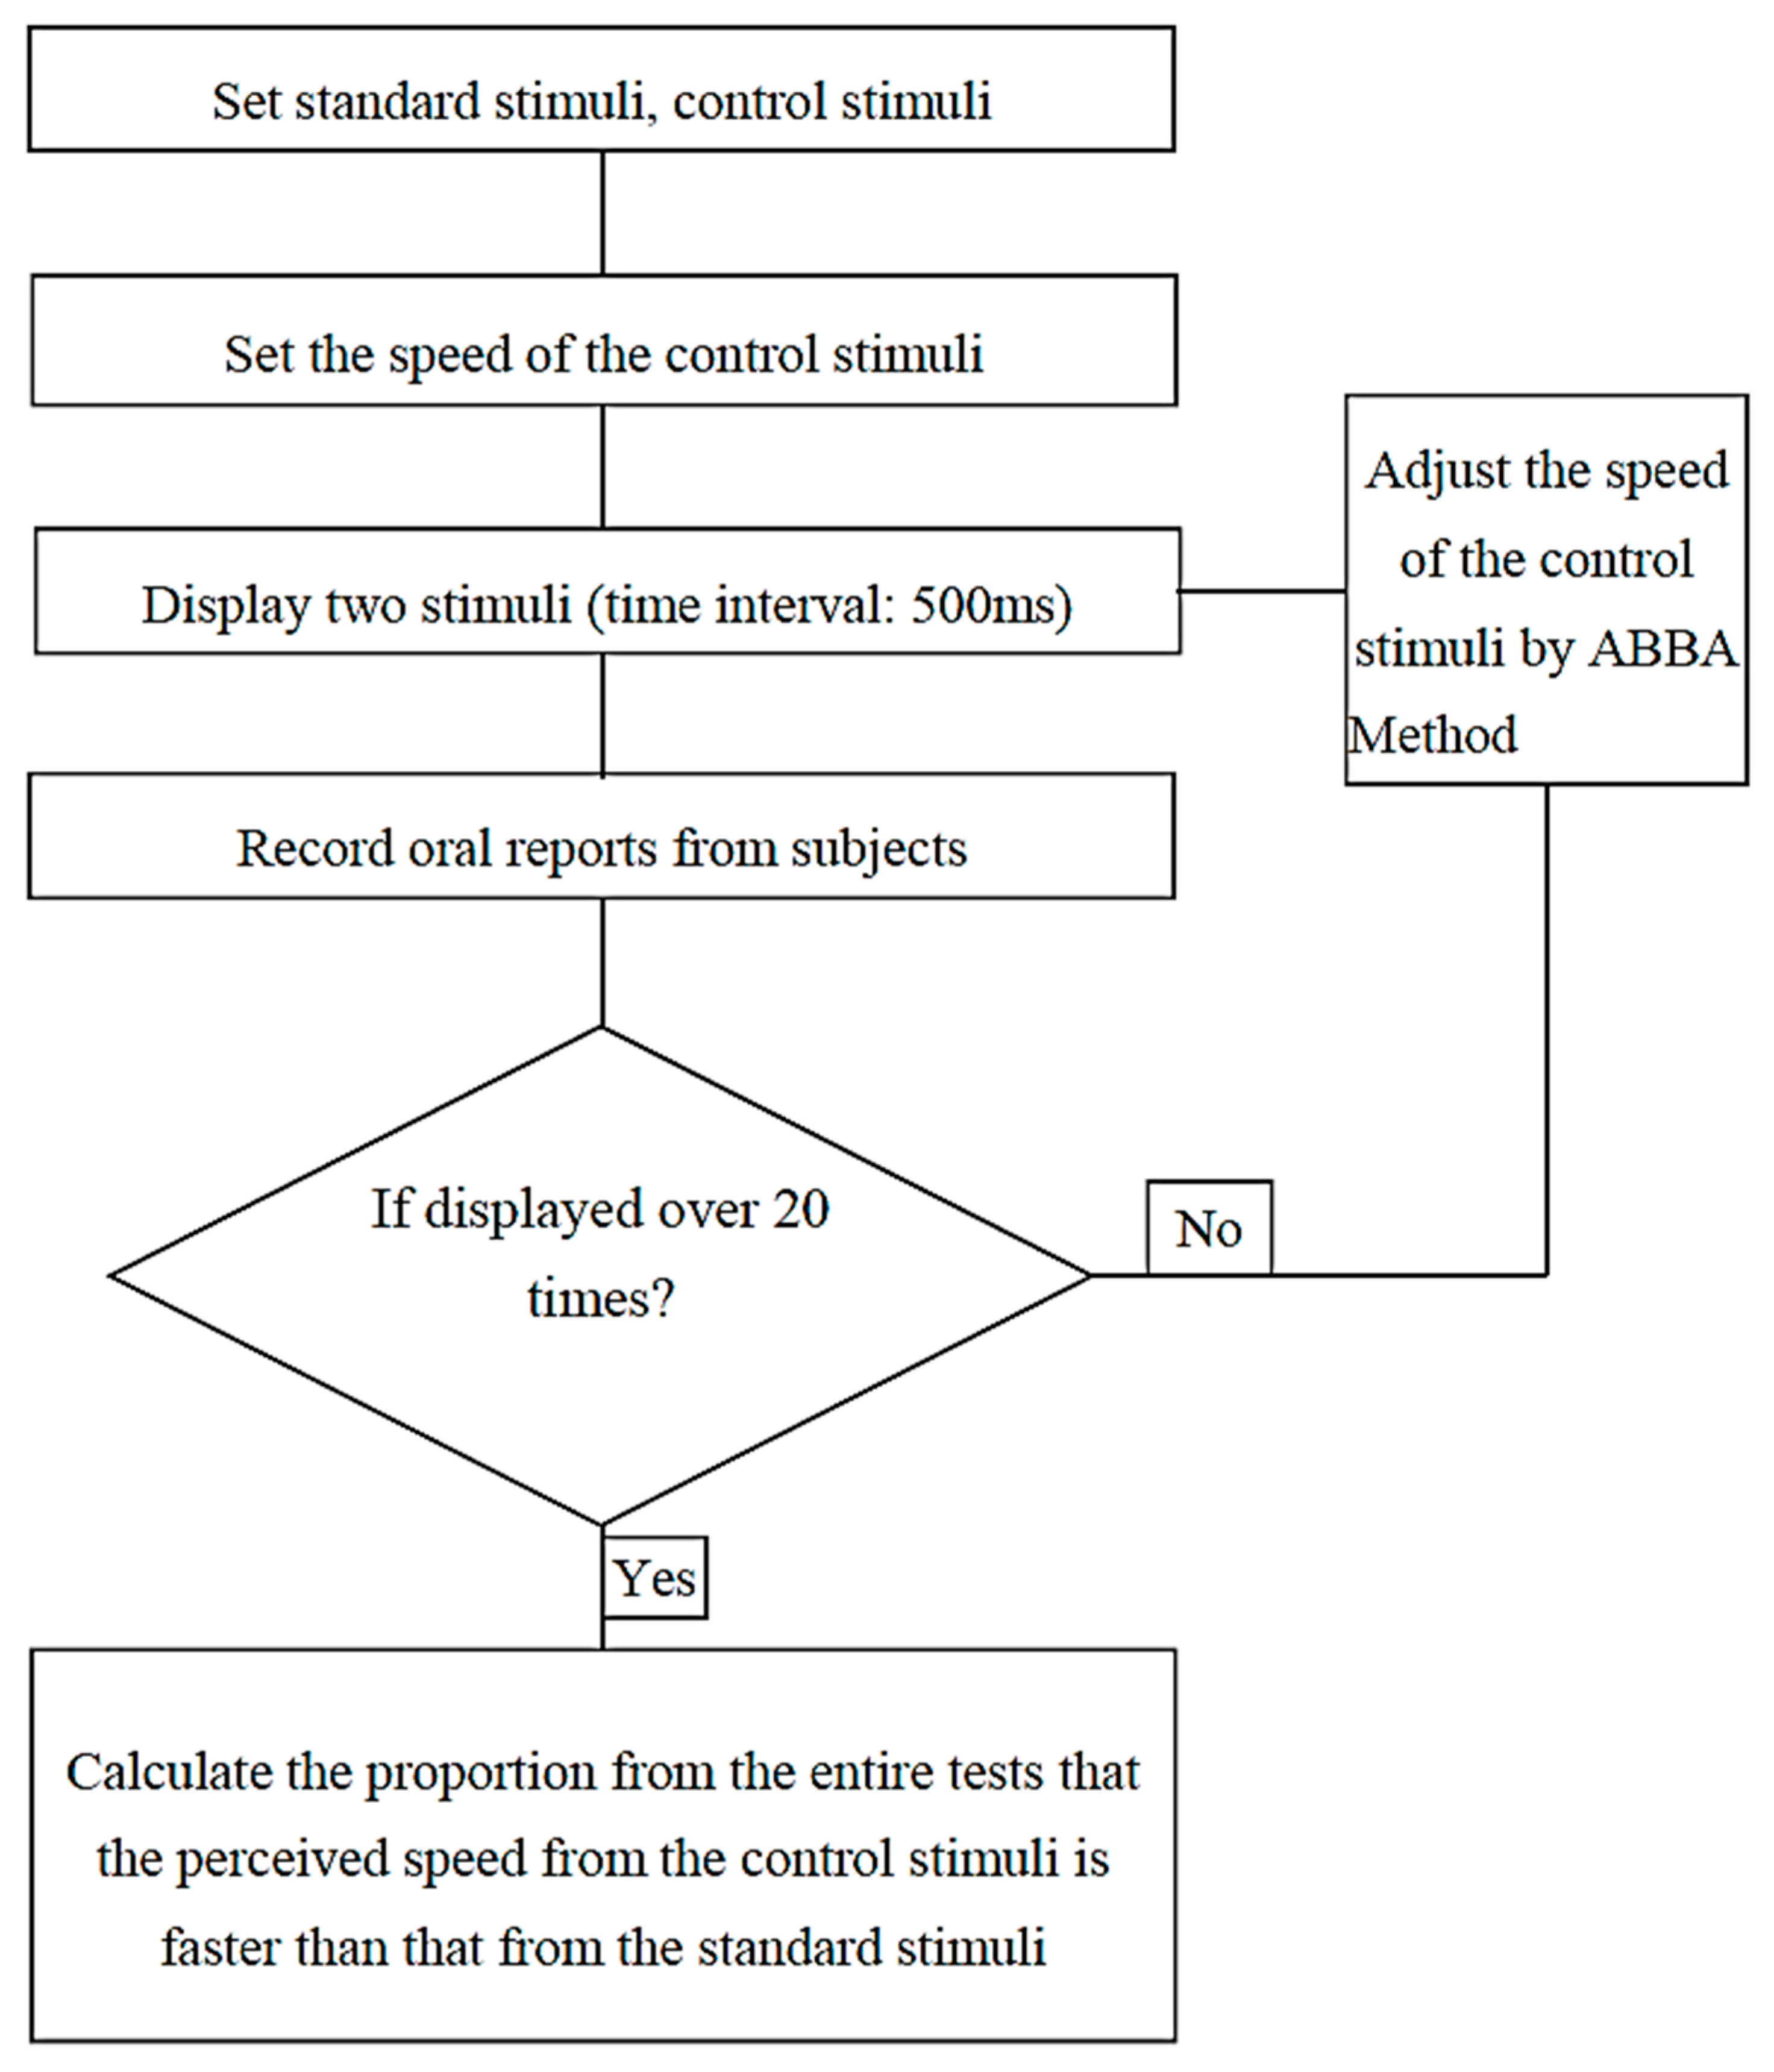
3.2.1. Index of the Driver’s Perceived Speed
3.2.2. Apparatus and Participants
3.2.3. Procedures

| The order of displaying stimuli (S-standard, C-control) | C-S | S-C | S-C | C-S |
|---|---|---|---|---|
| Speed Change of comparison stimuli | Increase | Decrease | Decrease | Increase |
Stimuli
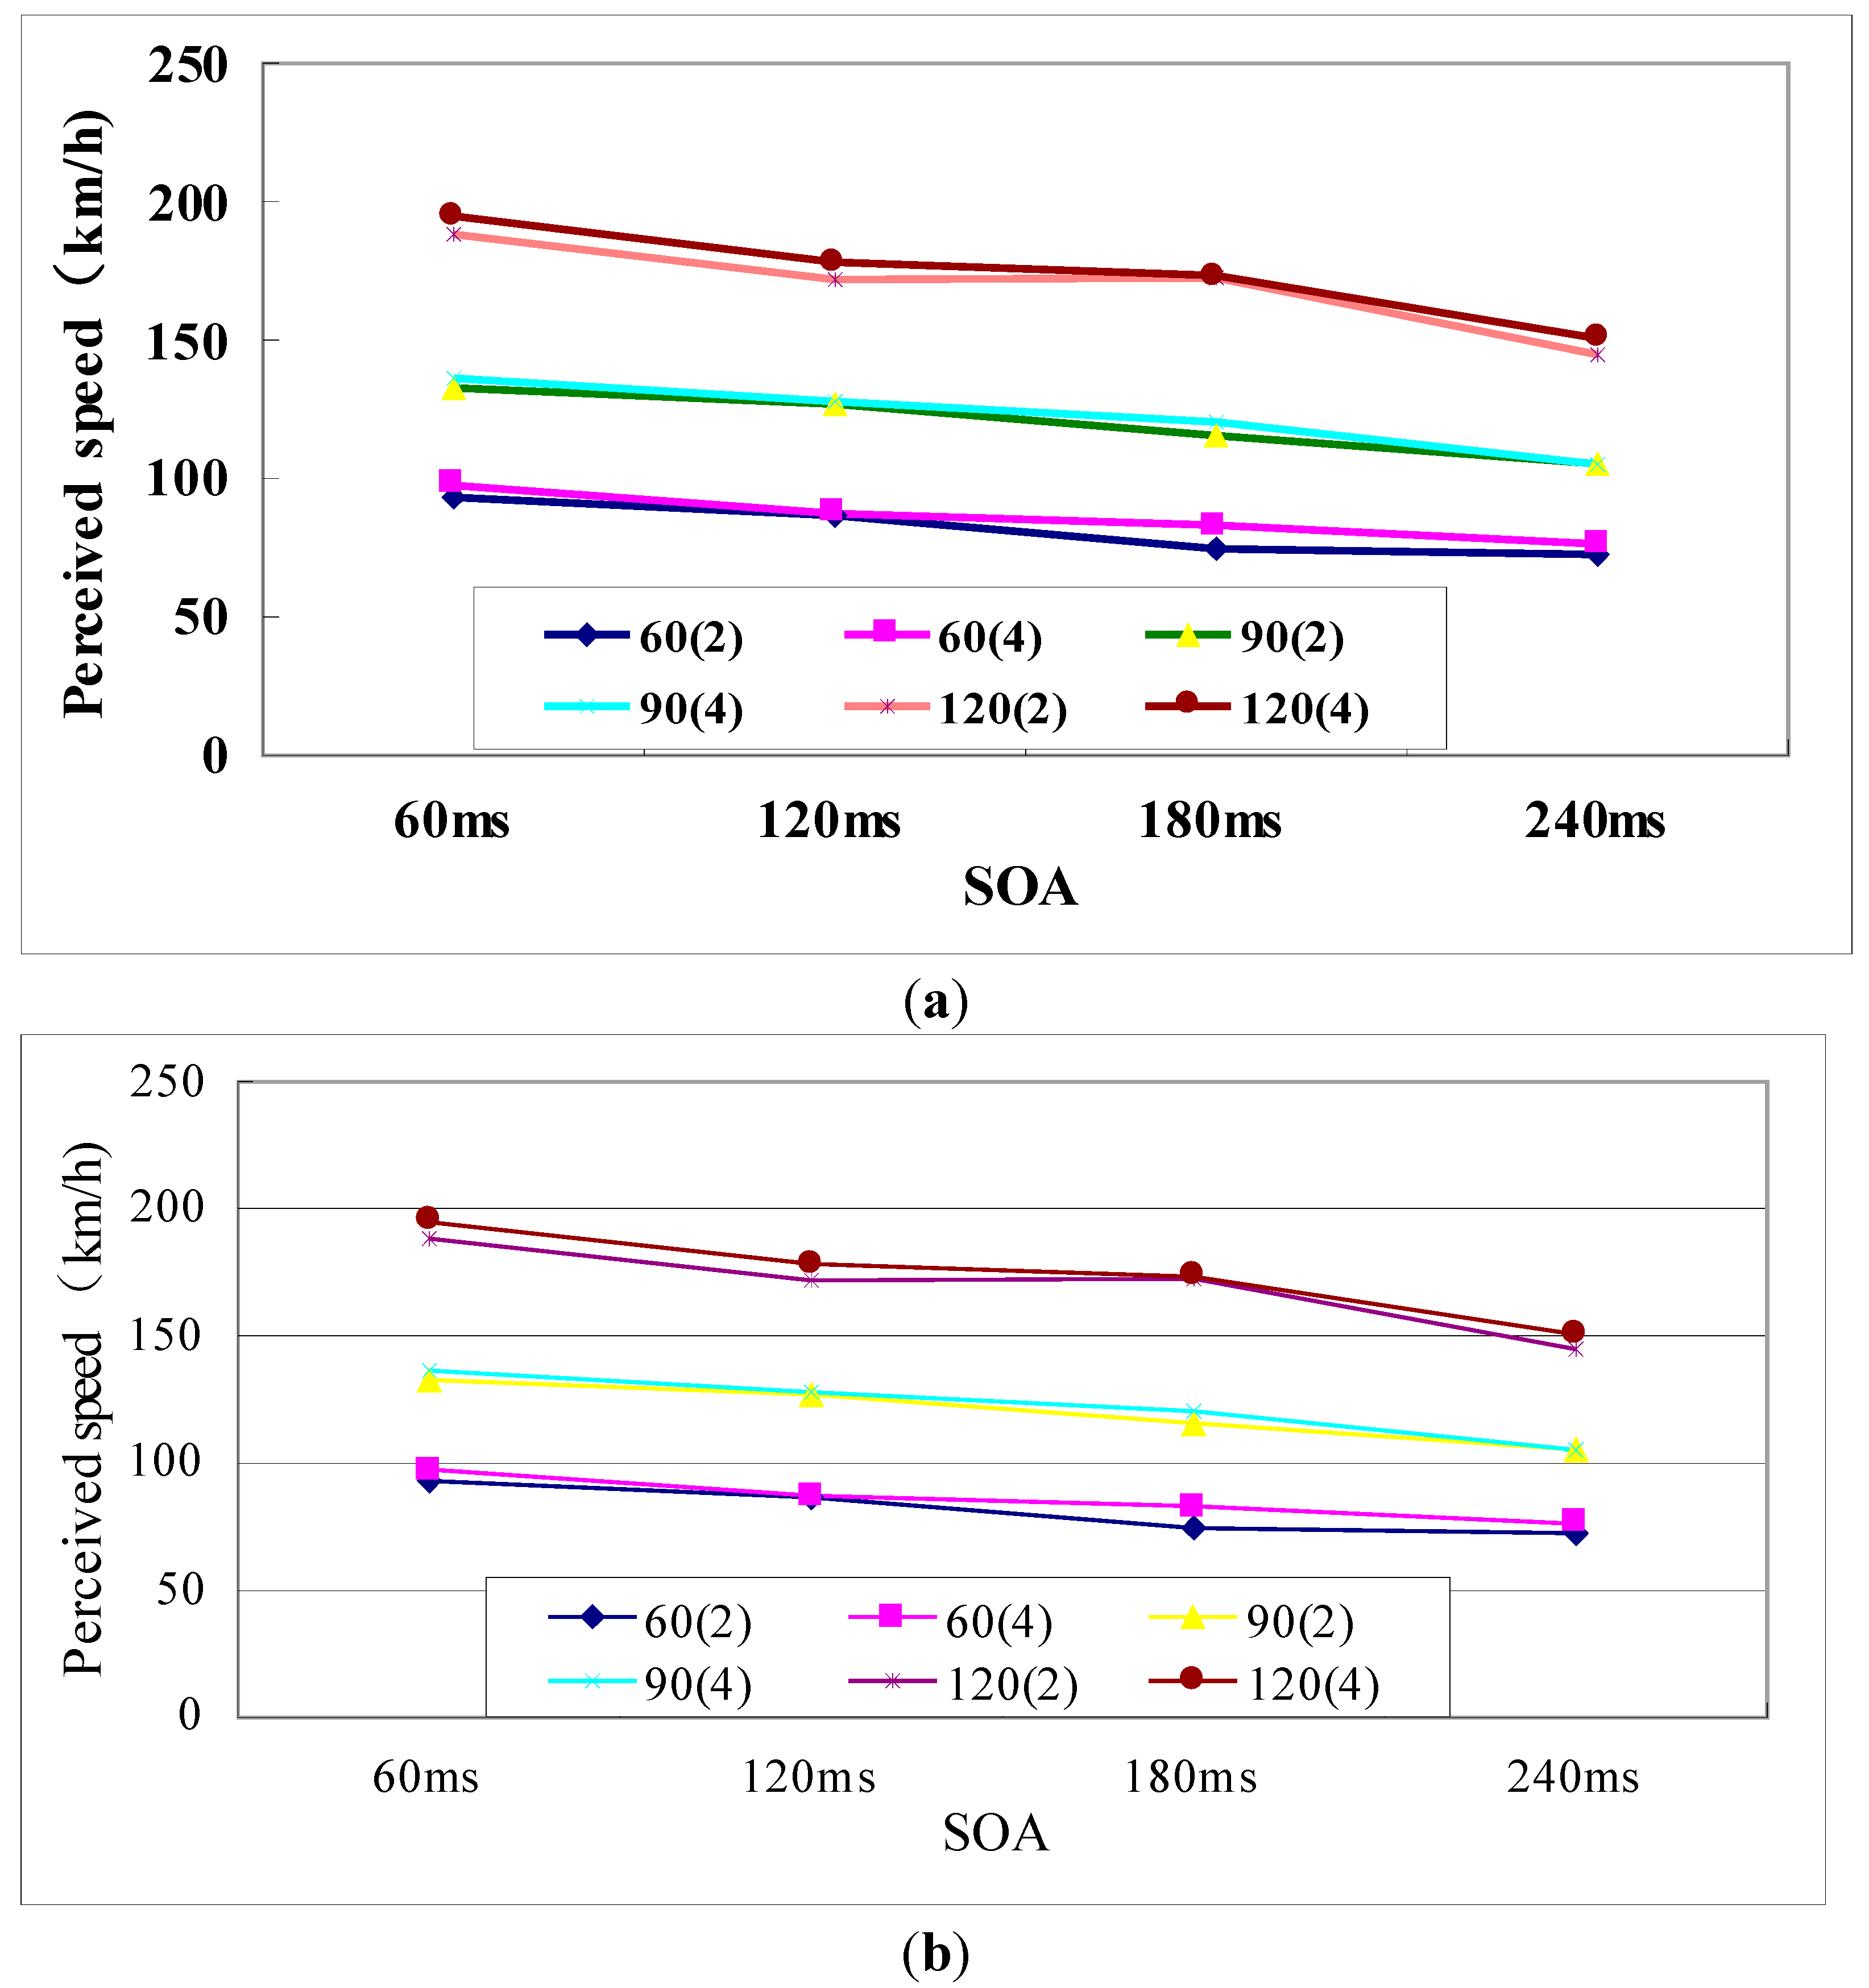
Results

4. Discussion and Conclusions
4.1. Optimal Form of Apparent Motion

4.2. Driver’s Speed Perception
| SS | 2 m | 4 m | |
|---|---|---|---|
| SOA | |||
| 60 ms | 120 | 240 | |
| 120 ms | 60 | 120 | |
| 180 ms | 40 | 80 | |
| 240 ms | 30 | 60 | |
4.3. Optimal Form for Speed Control
Acknowledgments
Author Contributions
Conflicts of Interest
References
- Ministry of Public Security of the People’s Republic of China. White Paper on Road Traffic Accident in China; China Communications Press: Beijing, China, 2011.
- Theeuwes, J. Self-Explaining Roads: An exploratory study. In Transportation Research Record: Journal of the Transportation Research Board; Transportation Research Board of the National Academies: Washington, DC, USA, 1994. [Google Scholar]
- Gepshtein, S.; Kubovy, M. The Lawful Perception of Apparent Motion. J. Vision 2007, 7, 1–15. [Google Scholar]
- Recarte, M.A.; Nunes, L.M. Perception of Speed in an Automobile: Estimation and Production. J. Exp. Psychol. Appl. 1996, 2, 291–304. [Google Scholar] [CrossRef]
- Wertheimer, M. Experimentelle Studien uber dasSehen von Bewegung. Zeitschrift fu¨r Psychologie 1912, 61, 161–265. [Google Scholar]
- Hock, H.S.; Gilroy, L.A.; Harnett, G. Counter-changing Luminance: A Non-fourier, Non-attentional Basis for the Perception of Single-element Apparent Motion. J. Exp. Psychol. Hum. Perce. Perform. 2002, 28, 93–112. [Google Scholar] [CrossRef]
- Hock, H.S.; Kogan, K.; Espinoza, J.K. Dynamic State-dependent Thresholds for the Perception of Single-element Apparent Motion: Bistability from Local Cooperativity. Perce. Psych. 1997, 59, 1077–1088. [Google Scholar] [CrossRef]
- Zhuo, Y.; Zhou, T.G.; Rao, H.Y.; Wang, J.J.; Meng, M.; Chen, M.; Zhou, C.; Chen, L. Contributions of the Visual Ventral Pathway to Long-range Apparent Motion. Science 2003, 299, 417–420. [Google Scholar] [CrossRef] [PubMed]
- Tsuda, R.; Ueno, S. Perception of Visual Apparent Movement in Central and Peripheral Vision. IEEE 1993. [Google Scholar] [CrossRef]
- Yamamoto, K.; Uchida, K.; Sagawa, Y.; Tanaka, T.; Sugie, N. Quantitative Measurements of Driver’s Motion After-Effect. Intell. Vehicle Symp. 2002, 2, 336–343. [Google Scholar]
- Shen, H.; Shimodaira, Y.; Ohashi, O. Speed-Tuned Mechanism and Speed Perception in Human Vision. Syst. Comput. Japan 2005, 36, 1718–1727. [Google Scholar] [CrossRef]
- Jäkel, F.; Wichmann, F.A. Spatial Four-alternative Forced-choice Method is the Preferred Psychophysical Method for Naïve Observers. J. Vision 2006, 6, 1307–1322. [Google Scholar] [CrossRef]
- Ruud, G.J.; Meulenbroeka Galena, G.P.; van Hulstijnb, M.; Hulstijna, W.; Bloemsaat, G. Muscular Co-contraction Covaries with Task Load to Control the Flow of Motion in Fine Motor Tasks. Biol. Psychol. 2005, 68, 331–352. [Google Scholar] [CrossRef] [PubMed]
- Anstis, S. Moving Objects Appear to Slow Down at Low Contrasts. Neural Netw. 2003, 16, 933–938. [Google Scholar] [CrossRef] [PubMed]
- Michelson, A.A. Studies in Optics; Dover Publication, Inc.: New York, NY, USA, 1995. [Google Scholar]
- Wickens, C.D.; Hollands, J. Engineering Psychology and Human Performance; Prentice Hall, Inc.: Upper Saddle River, NJ, USA, 1999. [Google Scholar]
- Denton, G.G. The Influence of Visual Pattern on Perceived Speed. Perception 1980, 9, 393–402. [Google Scholar] [CrossRef] [PubMed]
© 2015 by the authors; licensee MDPI, Basel, Switzerland. This article is an open access article distributed under the terms and conditions of the Creative Commons Attribution license (http://creativecommons.org/licenses/by/4.0/).
Share and Cite
Liu, B.; Zhu, S.; Wang, H.; Xia, J. Facilities Design Based on Apparent Motion of Grating for Speed Reduction in Tunnel. Sustainability 2015, 7, 1503-1515. https://doi.org/10.3390/su7021503
Liu B, Zhu S, Wang H, Xia J. Facilities Design Based on Apparent Motion of Grating for Speed Reduction in Tunnel. Sustainability. 2015; 7(2):1503-1515. https://doi.org/10.3390/su7021503
Chicago/Turabian StyleLiu, Bing, Shunying Zhu, Hong Wang, and Jing Xia. 2015. "Facilities Design Based on Apparent Motion of Grating for Speed Reduction in Tunnel" Sustainability 7, no. 2: 1503-1515. https://doi.org/10.3390/su7021503
APA StyleLiu, B., Zhu, S., Wang, H., & Xia, J. (2015). Facilities Design Based on Apparent Motion of Grating for Speed Reduction in Tunnel. Sustainability, 7(2), 1503-1515. https://doi.org/10.3390/su7021503