Abstract
Despite the unprecedented rate of urbanization throughout the world, human society is still facing the challenge of coordinating urban socioeconomic development and ecological conservation. In this article, we integrated socioeconomic data and spatial metrics to investigate the coupling relationship between intensive land use (ILU) system and landscape ecological security (LES) system for urban sustainable development, and to determine how these systems interact with each other. The values of ILU and LES were first calculated according to two evaluation subsystems under the pressure-state-response (PSR) framework. A coupling model was then established to analyze the coupling relationship within these two subsystems. The results showed that the levels of both subsystems were generally increasing, but there were several fluctuation changes in LES. The interaction in each system was time lagged; urban land use/cover change (LUCC) and ecosystem transformation were determined by political business cycles and influenced by specific factors. The coupling relationship underwent a coordinated development mode from 1992–2012. From the findings we concluded that the coupling system maintained a stable condition and underwent evolving threshold values. The integrated ILU and LES system was a coupling system in which subsystems were related to each other and internal elements had mutual effects. Finally, it was suggested that our results provided a multi-level interdisciplinary perspective on linking socioeconomic-ecological systems. The implications for urban sustainable development were also discussed.
1. Introduction
Since the industrial revolution, especially following World War II, countries throughout the world have become increasingly urbanized [1]. Urbanization is a social and spatial process that is related to the transformation of land and population from rural areas to urban areas. The population in urban areas has exploded since 1950, from 746 million to 3.9 billion in 2014, accounting for 54% of the world’s population [2]. Urban land use/land cover (LULC) has experienced densification, expansion/sprawling, and shrinkage patterns under rapid urbanization [3]. Highly fragmented landscapes have been created by being overlaid with various new elements and structures, resulting in a loss of identity and functional homogeneity [4]. The continuously growing population and changing landscapes have levied increasing demands on resources and energy, posing severe challenges for ensuring human welfare while preventing an increasing loss of soil, habitats, resources, and biodiversity in urban ecosystems [5].
The landscape in our paper is conceived as ecosystems nested in a hierarchy of spatial scales [6]. The landscape ecosystem includes geographic, volumetric, layered segments of earth [7,8], and provides a range of benefits to sustain human livelihoods and improve the quality of life through urban ecosystem services [9,10,11]. They are commonly divided into four categories: provisioning services, regulating services, habitat or supporting services and cultural services [10,12]. The Condition and Trends Working Group of Millennium Ecosystem Assessment reported that 60% of ecosystem services are being degraded or used unsustainably [13]. For example, dense transportation networks results in increased air pollution [14], anthropogenic sealing of soils leads to urban heat island effects [15,16], and the loss of green space causes public health issues [17,18]. Therefore, discovering the effects of urban land use on the ecosystems and quantifying the relationships between urban land dynamics and landscape ecological security are important for effective urban planning and environmental protection policy making for sustainable urban development [19].
Modern urban development and planning pay attention to smart growth [20,21], compact development [22,23], and multifunctional intensive land use [24,25,26,27]. They are regarded as the connotation of intensive land use [28]. More researches on evaluating intensive land use (ILU) degree have been conducted since ILU issue became a key work of China’s land resource management departments in 2006. However, the evaluation only focused on the socioeconomic outcome of land use. There is an increasing awareness of the need to improve the efficiency of urban land use without incurring expenses in the protection of ecosystems [29].
Rapid urban growth, as the most obvious land transformation, contributes to heterogeneous landscapes of high spatial-temporal diversities. Urban landscape ecology has explored the links and relationships among the ecosystems and species that make up this complex matrix and the associated human activities [30,31]. The environmental and ecological problems of the landscape changes resulting from urbanization are significant [32,33]. The study of Su et al. (2012) [34] reported that landscape fragmentation, configuration, and diversity could significantly impair the provision of ecosystem services. However, to date, less attention has been paid to the impact of urban land use on the ecological security. Increasing concerns on urban landscape ecological security (LES) have become the priority development strategies for reconfiguration of urban socioeconomic-ecological systems to help secure their material and ecological reproduction [35].
Given the importance of urban land use and its long-term multiple effects on landscape ecosystem, research on evaluating the effects of ILU and LES has been greatly emphasized [36]. Then, a demand oriented approach of implementing the sustainability concept is considered to support urban land use and landscape ecosystem. The search for sustainable urbanization can therefore be pursued in two dimensions [37]: first, focusing on the ILU of urban socioeconomic systems, which means enhancing the efficiency and optimizing the allocation of land use for sustainable socioeconomic development [38]; and second, considering measures to avoid reducing the quality of urban ecosystems and remaining LES [39,40,41]. Still, the consequent merging of these two interest-oriented approaches has taken place only to a minor extent. Therefore, coupling ILU and LES becomes important and could bring an achievement in balancing socioeconomic systems and ecological systems in urban areas. The combination of approaches to coupling ILU and LES and identifying the coupling relationship between ILU and LES could provide practical application for urban sustainability.
The core urban area of Hangzhou, a highly urbanized area in southeastern China, was used as a case study. In this paper, ILU and LES evaluation systems were established under the pressure-state-response (PSR) framework and integrated socioeconomic data with spatial metrics to explore the urban socioeconomic-ecological system changes and their coupling relationship during 1992–2012. The ILU system and LES system were coupled into one compound system supported by a coupling model. Specifically, landscape metrics that are commonly used in landscape ecology analysis were integrated as indicators of the state criterion level for assessing LES degree. The metrics were calculated based on the interpreted multi-temporal remotely sensed imagery from 1992 to 2012. The overall goal of this study was to improve the understanding of the coupling relationship between ILU and LES, which represent socioeconomic systems and ecological systems in urban areas, respectively. In addition, the paper aimed to contribute to fundamental knowledge for identifying potential ecological impacts and decision-making toward sustainable urbanization.
2. Materials and Methods
2.1. Study Area
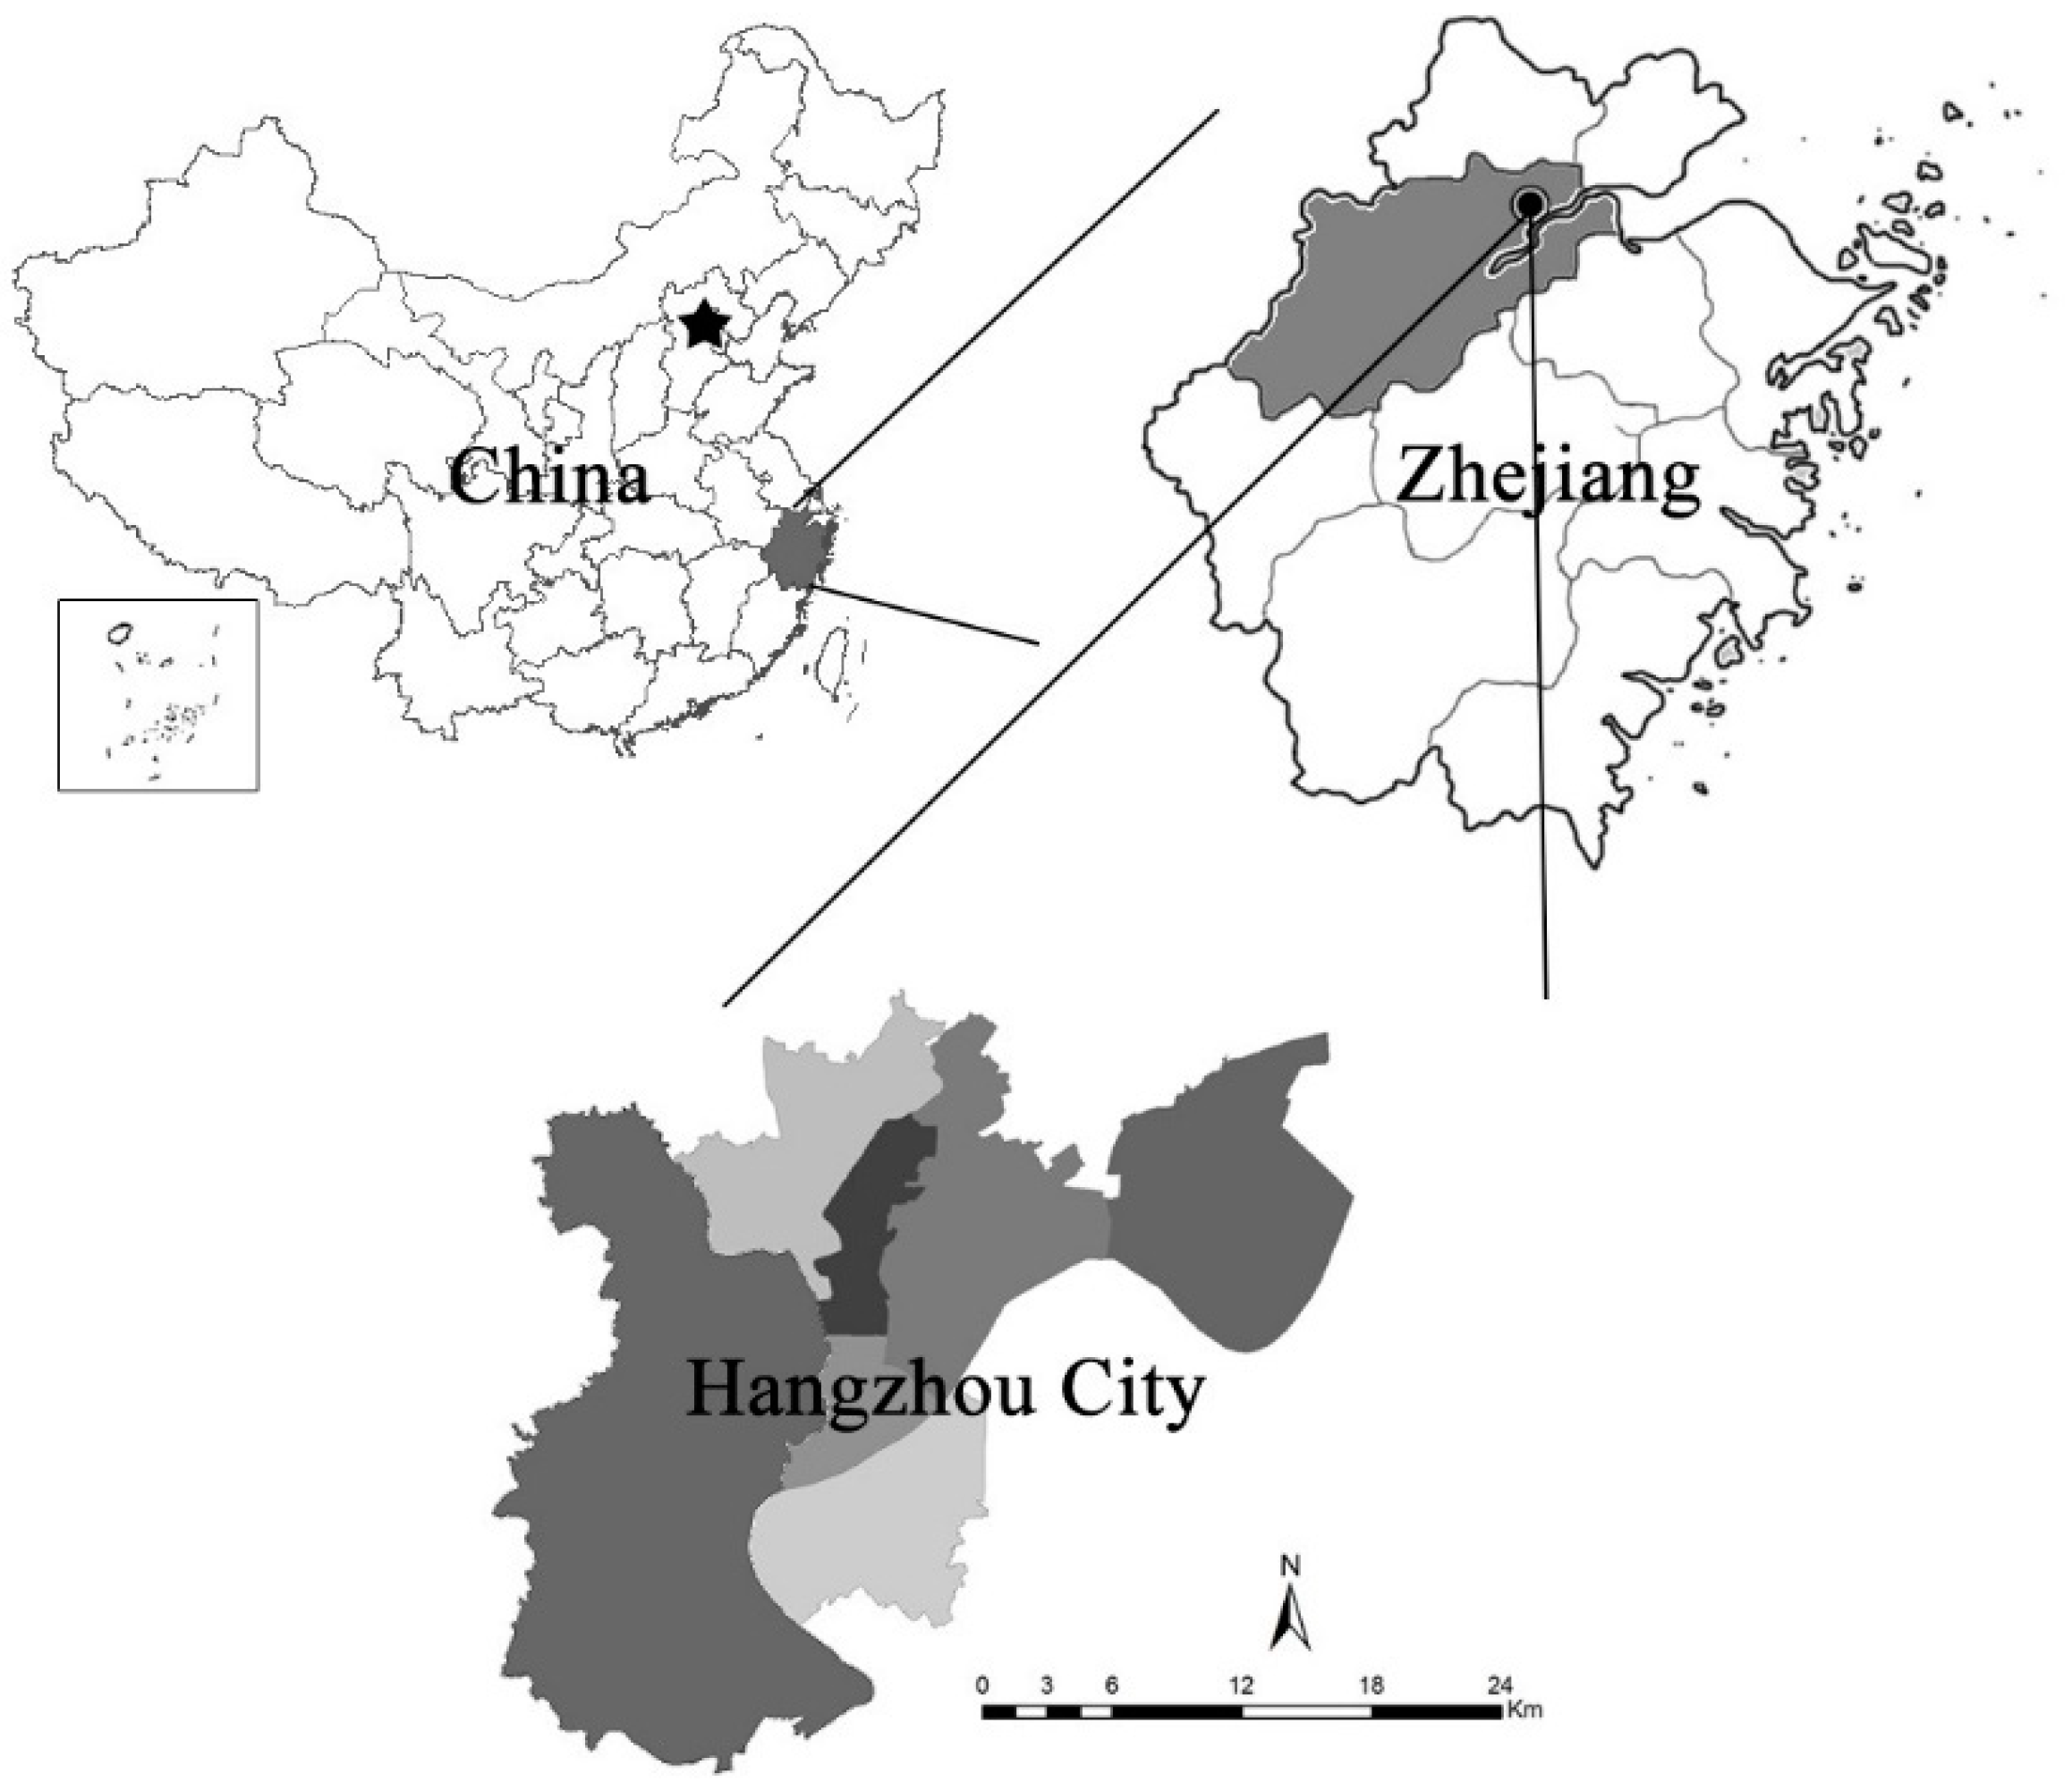
This study focused on the core urban area of Hangzhou, which we defined as Hangzhou City (Figure 1). Since early 1992, Hangzhou City has undergone a tremendous land transformation from an agricultural area to an urban area. By the end of 2012, its local gross domestic product per capita was approximately 15,826 US dollars. The permanent population of Hangzhou City rose from 1.36 million in 1992 to 2.32 million in 2012, and the built-up area has increased from 90.00 km2 to 295.08 km2 since 1992. The transformation of spatial structures and relocation of urban elements have greatly impacted the city’s ecological environment.

Figure 1.
Location of the study area: the core urban area of Hangzhou.
Figure 1.
Location of the study area: the core urban area of Hangzhou.
2.2. Data Sources and Pre-Processing
Natural science data and socioeconomic data were selected for this study. Remotely sensed data to be pre-processed were used to retrieve urban LULC information. Five data sets of multispectral Landsat MSS/TM/ETM+ images with ancillary data were interpreted to calculate landscape metrics, which were used for LES state evaluations. Socioeconomic data, e.g., statistical yearbooks, government work reports and ecological conservation-related planning and research reports were integrated to assess the degree of ILU and LES.
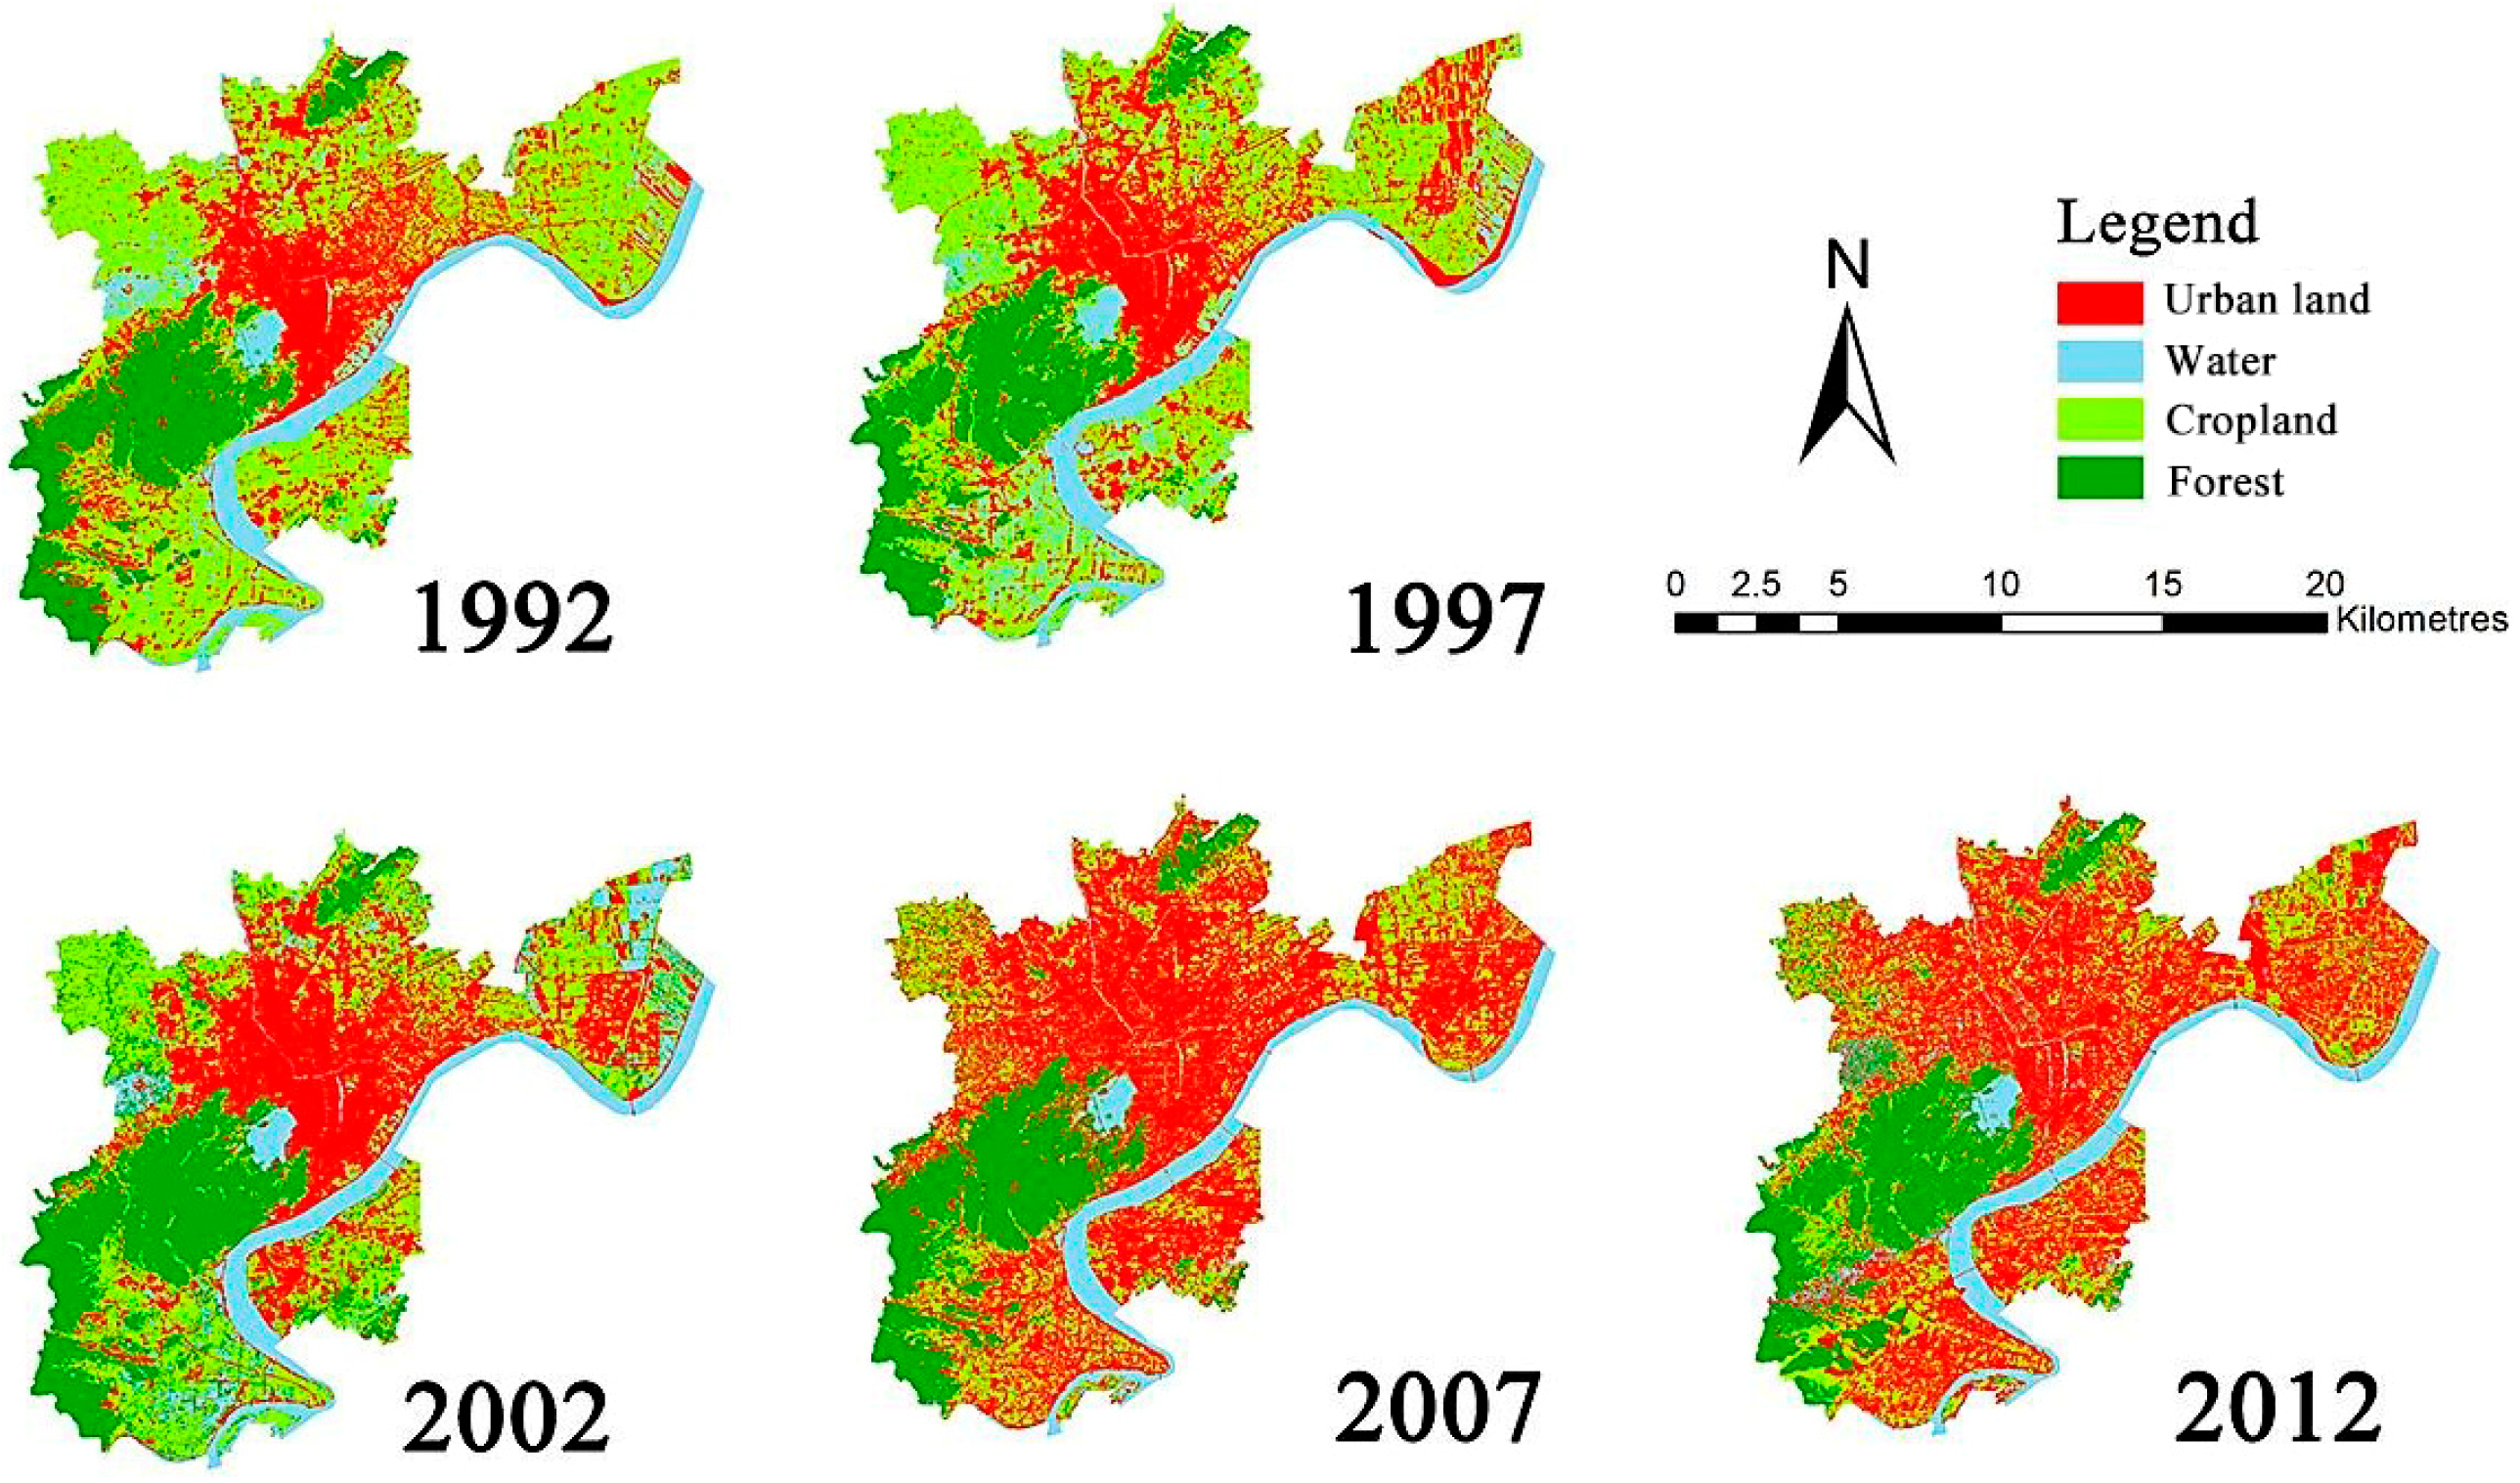
Land use/cover changes (LUCC) information for the study area was interpreted from Landsat images acquired on 7 June 1992; 4 May 1997; 11 June 2002; 8 May 2007; and 19 July 2013, with maximum likelihood-based supervised classification by ENVI 5.0. The SLC-off products of Landsat 7 in 2012 did not meet our needs; therefore, we used Landsat 8 images in 2013 as a replacement. A classification scheme of four land types (urban land, water, cropland, and forest) was categorized for the following reasons. First, the selected four types represented the dominant landscape ecosystem and reflected the land use intensity in our study area; second, the resolution of Landsat images is limited for more detailed land types [42]; and third, the calculation of ecosystem service values (ESV) for the LES state level was based on specific value coefficients for LULC types in China (see more detailed information in Section 2.3.1.1). The overall classification accuracy of the five images is 85.12, 84.24, 87.33, 82.24, and 90.28, respectively, which meets the classification requirements, and their Kappa coefficients are 0.833, 0.827, 0.865, 0.811, and 0.834, respectively. The interpreted land use data were then transferred to a 30 m × 30 m raster grid cell in ArcGIS 10.0 (Figure 2). Each cell is considered a homogenous unit for any given factor. The grid maps were then used to calculate the landscape metrics using Fragstats 4.2.

Figure 2.
Land use/land cover change maps of Hangzhou City from 1992–2012.
Figure 2.
Land use/land cover change maps of Hangzhou City from 1992–2012.
2.3. Model Description and Methodology
2.3.1. Evaluation Systems for ILU and LES
The paper applied a PSR framework, which was first proposed by Rapport and Friend in 1979 and later fully developed by the Organization for Economic Cooperation and Development (OECD) against the background of encountering environmental issues in their economic context. The PSR framework could be highly capable of showing information to end users in a causal way by differentiating between causes, effects, and human responses to control the extent of anthropogenic impacts on nature [43,44,45,46], which contributes linkages among human activities (the Pressure), the state of the environment (the State), and the societal and economic responses (the Response) to environmental changes [47]. The framework is a hierarchical and holistic model in which indicators of social, economic, environmental, and ecological characteristics can be adopted.
In this paper, we applied the PSR framework for evaluating ILU (the socioeconomic system) and LES (the ecological system). According to the PSR model, the evaluation system consists of three levels: the objective level, criterion level, and indicator level. The objective level is the expected evaluation output, that is, the ILU degree level and LES degree level. The criterion level, which aims to present the criteria for objective derivation, consists of three important components: pressure, state, and response. The indicator level is composed of all indicators describing pressure, state, and response at the criterion level. The hierarchical framework of the PSR model allows the evaluation system to be clearly understood and easily implemented.
2.3.1.1. Development of the Evaluation System
There is no universal set of indicators that should apply to all regions or countries. In principle, the selection of indicators for evaluation should be policy-relevant, understandable, easily available, and measurable [48]. The indices in this article were purposely selected to be complementary rather than redundant with each other, and the whole set reflects most aspects of the evaluation. In establishing the evaluation system for ILU (Table 1) and LES (Table 3), we referred to the results of previous ILU [49] and LES [50,51,52,53,54] related research.
(1) Evaluation system for ILU
The index system for evaluating the degree of ILU has already been fully developed by many researchers [55,56]. In this paper, population density (X1) and urban land expansion elasticity (X2) were selected as pressure indicators, which represent the effects of human activities on urban land use. The built-up area per person (X3), structure area per person (X4), fiscal revenue per square meter (X5), and output value of secondary and tertiary industry per square meter (X6) were selected as state indicators, which represent the physical and economic intensity of land use. The investment in fixed assets per square meter (X7) and employees per square meter (X8) were selected as response indicators, which represent the human-induced responses of intensive land use.
In particular, the indicator urban land expansion elasticity (X2) was developed by the Chinese Academy of Urban Planning and Design (CAUPD) to assess the relationship between urban land and urban population growth. This indicator is expressed in Equation (1) [57].
where AL (i) is the annual rate of urban land growth of city i, and AP (i) is the annual rate of urban population growth of city i.

Table 1.
Evaluation system f (L) for urban intensive land use (ILU).
| Objective Level | Criterion Level | Indicator Level | Unit | Description |
|---|---|---|---|---|
| ILU System f (L) (1.00) | Pressure (0.09) | X1: Population density (0.02) | p/km2 | Effects of human activities on urban land use. |
| X2: Urban land expansion elasticity (0.07) | N/A | |||
| State (0.70) | X3: Built-up area per person (0.12) | p/m2 | The physical and economic intensity of land use | |
| X4: Structure area per person (0.15) | p/m2 | |||
| X5: Fiscal revenue per square meter (0.03) | Yuan/m2 | |||
| X6: Output value of secondary and tertiary industry per square meter (0.40) | Yuan/m2 | |||
| Response (0.21) | X7: Investment in fixed assets per square meter (0.19) | Yuan/m2 | Human-induced response to intensive land use | |
| X8: Employees per square meter (0.02) | p/m2 |
Continuous data were acquired from Hangzhou statistical yearbooks from 1992 to 2012 [58].
(2) Evaluation system for LES
Based on the PSR framework, an index system for the LES was suggested with three dimensions and seven factors (Table 3).
Dramatic LUCC under rapid urbanization have transformed the configuration of landscape patterns, leading to the degeneration of urban ecosystem services. In urban areas, construction areas have been the main factor that exerts pressure on the ecological security. Therefore, we selected the city development intensity index (Y1), which is commonly used to characterize the status of the intensity of human activity in urban areas [41], as the pressure indicator of LES. The intensity index for each block was calculated by using Equation (2).
where TAi is the total area of city i and CLi is the urban construction land in city i in a specific monitoring period.
Landscape structure, function, and resilience were defined as the foundational traits of landscape ecosystem [12]. In consideration of the variability of statistical robustness in the historical data and the difficulty of acquiring historical data in our research area, LULC data from remotely sensed images were more consistent, objective and easily accessible compared to socioeconomic data. Six landscape metrics that have been generally applied for analyzing the related features of ecosystems [41] were therefore included in the state index. The contagion index (CONTAG) (Y2), Shannon’s diversity index (SHDI) (Y3), and the landscape shape index (LSI) (Y4) were selected for characterizing landscape structure security; ESV (Y5) was adopted as an indicator for landscape function security and was calculated according to the percentage of landscape (PLAND) metric. The splitting index (SPLIT) (Y6) was regarded as the indicator for landscape ecological resilience. All the landscape metrics were calculated at landscape scale.
It is known that most ecosystems on the earth have been converted to another type of land cover, which can be characterized by land use type [9]. Costanza’s [59] ecosystem service values assessment model was applied to calculate the indicator Y5 (ESV) according to Equation (3).
where ESV denotes the total values of ecosystem services, and Ak and VCk represent the area and value coefficients for proxy biome type “k”, respectively. The proxy biomes were not perfectly matched with the LULC types in most cases [60]. Xie [61] revised Costanza’s ecosystem services assessment model and classified ecosystem service values into nine categories for the terrestrial systems of China. The ESV of every hectare of each land use category was then assigned based on the nearest equivalent ecosystems. There were few grassland regions and unused areas in Hangzhou’s core urban area (grassland and unused land occupied less than 0.05% of the total area from 1992 to 2012); therefore, the land use category was reclassified into urban land, water, cropland, and forest. We referred to the comparable ecosystem service research results for Hangzhou City [62], where our study area was contained. The adjusted value coefficients for four LULC categories are shown in Table 2. ESVs were then calculated according to Equation (3).
Table 2.
Ecosystem service value coefficients for land use/cover type Unit: Yuan/hm2.
| Cropland | Forest | Water | Urban land | |
|---|---|---|---|---|
| Gas regulation | 885.0 | 3097.0 | 0 | 0 |
| Climate regulation | 1575.2 | 2389.1 | 407 | 0 |
| Water reservation | 1062.1 | 2831.5 | 18,033.2 | 0 |
| Soil formation and protection | 2584.0 | 3450.9 | 8.8 | 0 |
| Waste treatment | 2902.7 | 1159.2 | 16,086.6 | 0 |
| Biodiversity conservation | 1256.4 | 2884.6 | 2203.3 | 0 |
| Food production | 1770.0 | 88.5 | 88.5 | 0 |
| Raw materials | 177.2 | 2300.6 | 8.8 | 0 |
| Recreation and culture | 18.6 | 1132.6 | 3840.2 | 0 |
| Total | 12,231.2 | 19,334 | 40,676.4 | 0 |
At the landscape response level, the degree of the implementation of ecological conservation was selected. Zoning and construction land regulation have been common policy instruments in China’s land use planning and are designed to regulate construction land against agricultural, forest, and conservation reserve lands. This paper integrated the percentage of landscape, zoning and regulation areas for ecological conservation with ancillary data, such as ecological function zoning planning, wetland conservation planning, and ecological city planning, as a comprehensive approach to evaluating the degree of implementation of ecological conservation. We consulted local researchers and urban administrators with the Delphi method [63].
2.3.1.2. Multi-Criteria Evaluation
The standard deviation of a standardized method was adopted to make the data more comparable within the required standardization of indicators and data lines.
In the ILU system, we applied the entropy method to determine the weights of indicators. The entropy method was an objective weights assignment method for fuzzy synthetic evaluation [64], which was first applied in thermodynamics and then was introduced into the information management discipline by Shannon (1948) [65] for the expression of information or uncertainty. At present, the entropy method has been applied in urban ecosystems research regarding issues such as water management, energy utilization, landscape analysis, and the quality of economic growth [66,67,68,69]. Previous studies have demonstrated that this method can be used effectively for performance evaluation based on a group of indicators by properly determining the weightings of evaluation indicators [70]. In particular, Chinese scholars have conducted many intensive land use studies [71,72] using the entropy method when the government put forward the ILU issue since 2006. Meanwhile, all data for the indicators in ILU systems are collected by official statistical yearbooks. In this context, we applied the entropy method and referred to research results of the fully developed indicators of ILU systems (Table 1).
In the LES system, we applied Delphi and analytic hierarchy process (AHP) to determine the weights of indicators in the LES system. Delphi and AHP are subjective weighting methods. Weights are mainly determined by the experts’ knowledge and experience. Because the evaluation indices of LES system were from a combination of landscape metrics, socioeconomic data, and fuzzy information, evaluation required a comprehensive understanding of the connotation and denotation of the LES system. Thus, we consulted with landscape ecologists and economic geographers to create an integrated Delphi and AHP method for weights assignment (Table 3).
A multi-criteria evaluation (MCE) method has been demonstrated to be applicable for evaluating spatial criteria with standardized data [73] for decision-making analysis regarding land use suitability [41]. We integrated MCE and the weighted linear combination (WLC) method to calculate the values of ILU and LES for the entire research area [74]. These values were calculated according to Equation (4):
where S is the score for each system; r represents the weight of pressure, state, and response at the criterion level; W is the weight of each indicator; and P is the normalized value of each indicator.
Table 3.
Evaluation system f (E) for urban landscape ecological security (LES).
| Objective Level | Criterion Level | Indicator Level | Unit | Description |
|---|---|---|---|---|
| LES system f(E) (1.00) | Pressure (0.20) | Y1: City development intensity (0.20) | N/A | Effects on landscape in urban areas |
| State (0.50) | Y2: Contagion index (0.11) | N/A | Indicating landscape structure security | |
| Y3: Shannon’s diversity index (0.26) | N/A | |||
| Y4: Landscape shape index (0.03) | N/A | |||
| Y5: Ecosystem service values (0.40) | Yuan/hm2 | Calculated by PLAND; Indicating landscape function security | ||
| Y6: Splitting index (0.20) | N/A | Indicating landscape ecological resilience | ||
| Response (0.30) | Y8: Implementation degree of ecological conservation (0.30) | N/A | Human-induced response to landscape ecosystem |
Data for Y1 and Y5 were acquired from interpreted LULC information (1992, 1997, 2002, 2007, 2012), and supplementary data between 1992 and 2012 were collected from official land use data [75]; discrete data (1992, 1997, 2002, 2007, 2012) of Y2, Y3, Y4, and Y6 were transformed for continuous data (1993–1996, 1998–2001, 2003–2006, 2008–2011) according to the support vector machine algorithm [76]. Data for Y8 were integrated from government work reports [77], other ecological conservation planning, and research reports [78] with the Delphi method.
2.3.2. The Coupling Model for Analyzing Compound Socioeconomic-Ecological Systems
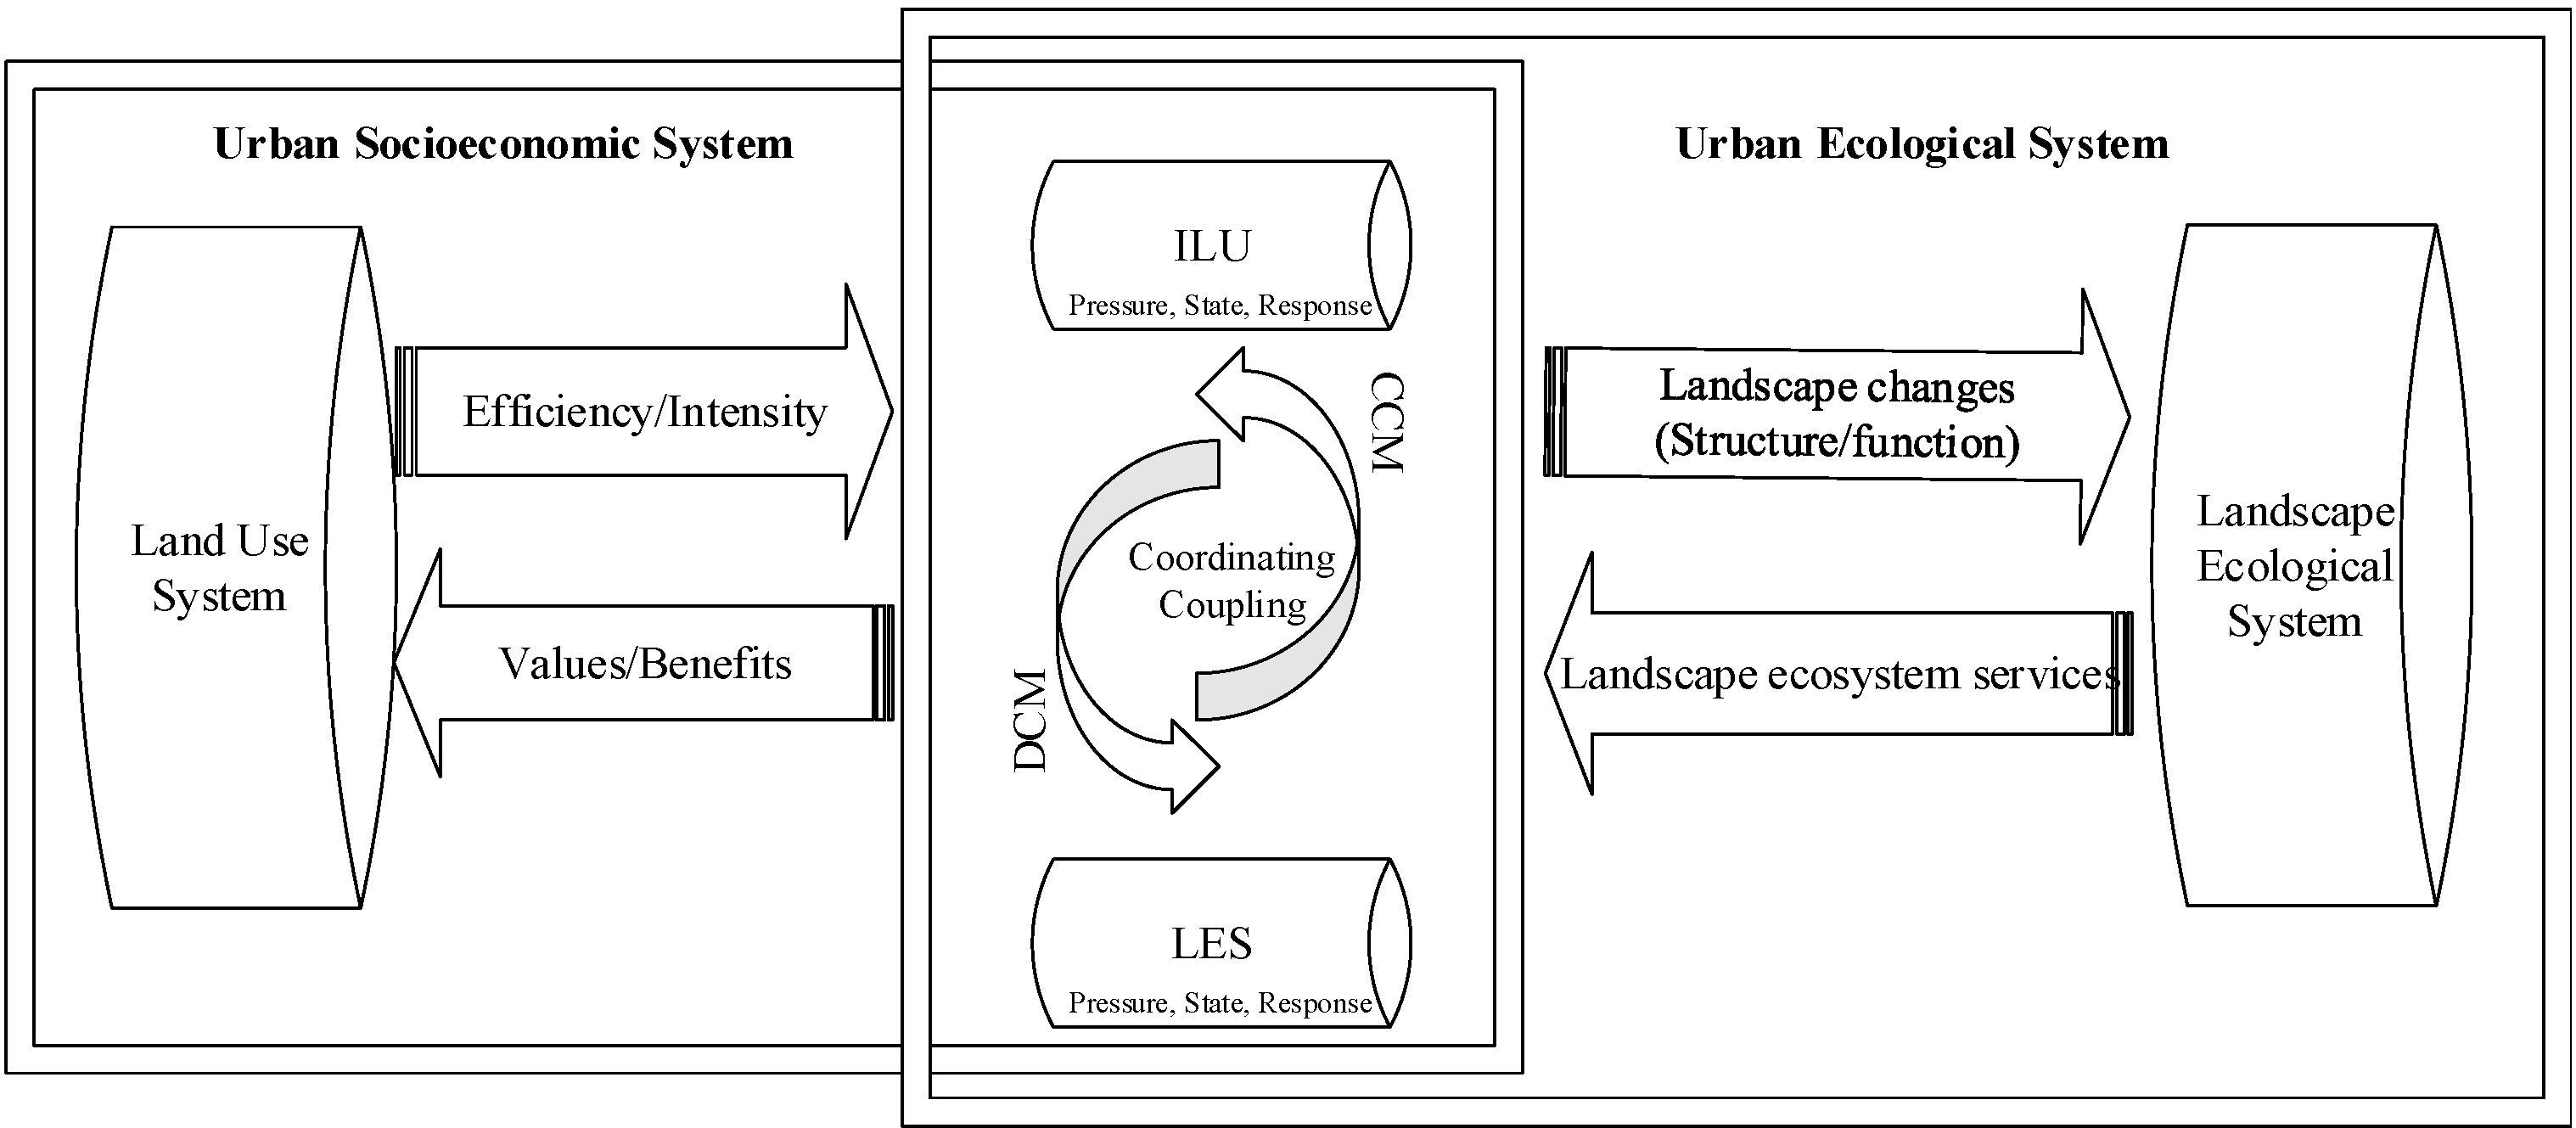
Coupling is a concept from electronics physics [79] that describes the degree of interaction within systems or between elements. Researchers have coupled city systems and ecological systems to analyze the dynamic development process in which socioeconomic factors and ecological elements are mutually symbiotic or restrained [80,81]. We developed a framework for analyzing socioeconomic-ecological systems (Figure 3) that consists of two sub models, including a coupling coordination model (CCM) and a dynamic coupling model (DCM).
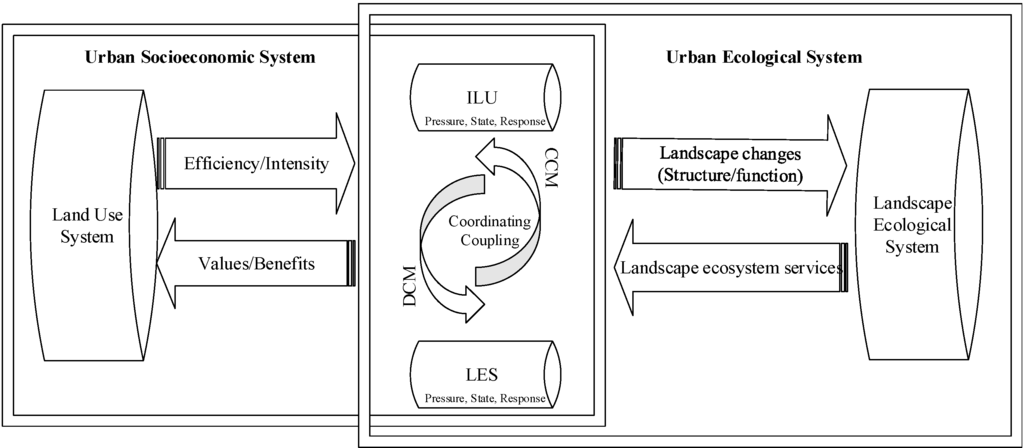
Figure 3.
Analytical framework for coupling urban land use and ecological environments.
Figure 3.
Analytical framework for coupling urban land use and ecological environments.
2.3.2.1. The Coupling Coordination Model
The CCM degree was the indicator used to estimate the coordinated state between the ILU and LES systems. The coordination degree was dependent on the dispersion between f (L) and f (E), which showed that the coordination degree increases when dispersion decreases. CCM has been developed [82] and can be expressed in Equation (5):
where C is the coordination degree; f (L) and f (E) are the composite score of ILU and LES, respectively; k is the adjusted coefficient, which takes the general value of two. The value of C ranges from zero to one, with one indicating the most coordinated state.
2.3.2.2. The Dynamic Coupling Model
On the basis of synergetic theory, we knew that the development process of the compound socioeconomic-ecological system depends on the control variates f (L) and f (E), which would achieve orderly development through self-organizing [83]. The DCM degree represented the extent of the synergistic effect between ILU and LES, and it indicated the development trend of the compound system.
The processes of ILU and LES systems were both nonlinear, and the evolution equation is as follows:
where f is the nonlinear function of xi.
The stability of motion in nonlinear systems mainly depends on the first-order characteristic root [84]. Thus, we took the Taylor series expansion at the origin point, and removed the higher-order terms
. The general function F was shown as follows:
where x is the elements of subsystems, and a represents the weight of each element.
Subsystems f (L) and f (E) were integrated into one compound system according to general system theory [85]. The evolution equations of the compound system can be expressed as follows:
where A and B are the conditions of evolution for each subsystems.
The compound system was under the influence of A and B, and the rate of evolution could be expressed as follows:
Changes in VA and VB in each subsystem resulted in synchronized change to the compound system. Thus, we established a rectangular coordinate system to analyze V, where V was the evolution rate of the compound system. VA and VB were regarded as the control variates, with V = f (VA, VB). The DCM degree can be analyzed through the condition of V, and the trajectory of V can be shown as an oval (Figure 4). V is the angle between VA and VB, which can be calculated as follows:
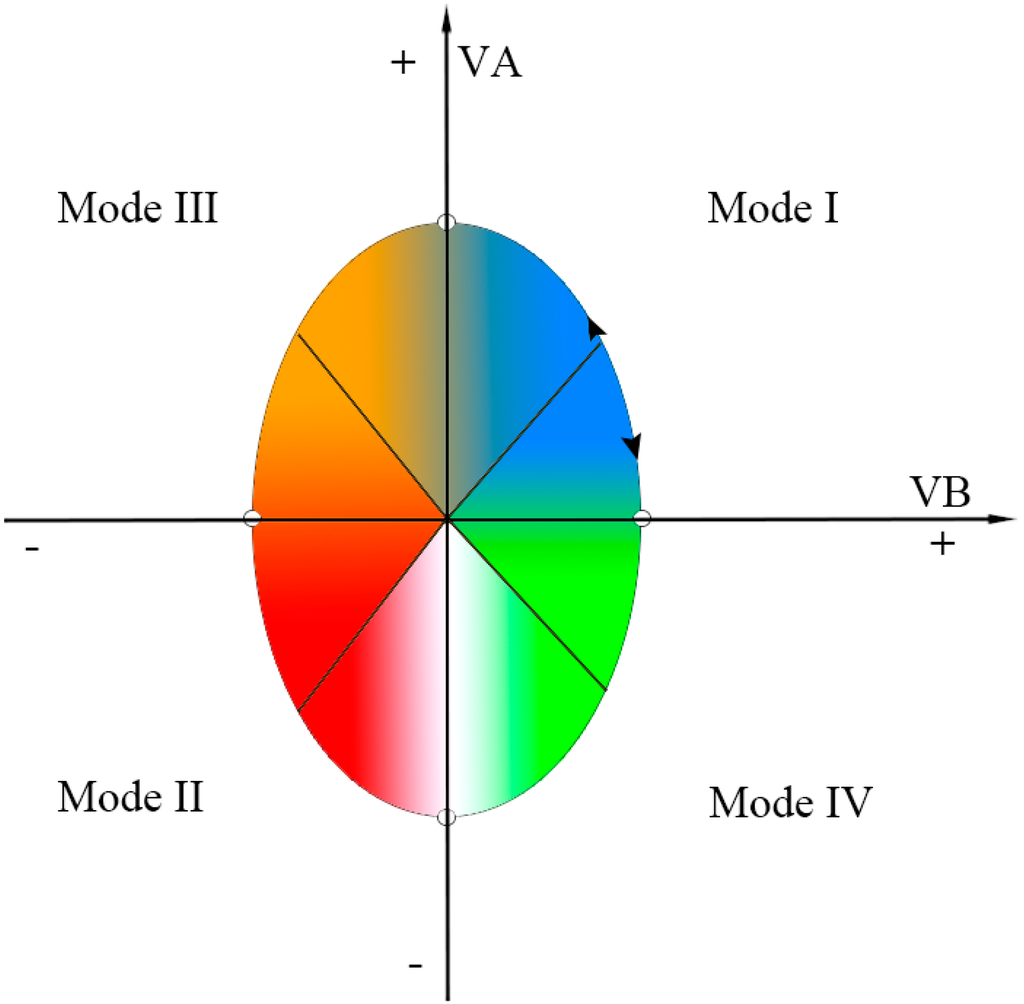
Figure 4.
The evolution trajectory of the coupling relationship.
Figure 4.
The evolution trajectory of the coupling relationship.

The radian measure of
was transformed into the angle degree for visual analysis. In sum, the evolutionary process of coupling relationship can be divided into four modes (Table 4):
- Mode I: Coordinated development. The value of ranges from 0° to 90°, VA and VB are both in the positive direction, and the two subsystems are under synergetic effect. In such mode, the ILU system collaborates with the LES system, land is in an intensive use trend, the security level is increasing, and the city is under sustainable development.
- Mode II: Restrained degeneration. The value of ranges from −180° to −90°, VA and VB are both in the negative direction, and the two subsystems are under a synergetic effect. However, the ILU system and LES system restrain each other. Land is under extensive use and damages the LES level; LES is unsafe and brings negative effects on the ILU system.
- Mode III: Extreme parasitism. The value of ranges from 90° to 180°, VA is in the positive direction, while VB is in the negative, and the two subsystems are under antagonistic effects. In such mode, land is under intensive use at the cost of decreasing LES; the urban landscape ecosystem would be degenerated and bring adverse effects on the urban socioeconomic system.
- Mode IV: Original symbiosis. The value of ranges from 0° to −90°, VA is in the negative direction, while VB is in the positive, and the two subsystems are under antagonistic effect. Since human activities are in low frequency, the land use system and landscape ecosystem are in their original status. Land is under extensive use without much anthropic development, while LES is at a low level and increasing naturally.
Table 4.
Summary of the coupling relationship modes.
| Effect | Mode | Direction(VA,VB) | Angle degree | Radian |
|---|---|---|---|---|
| Synergetic | I: Coordinated development | (+, +) | 0° < α < 90° | (0, 1.57) |
| II: Restrained degeneration | (−, −) | 90° < α < 180° | (1.57, 3.14) | |
| Antagonistic | III: Extreme parasitism | (+, −) | −180° < α < −90° | (−3.14, −1.57) |
| IV: Original symbiosis | (−, +) | −90° < α < 0° | (−1.57, 0) |
+ denotes positive effect, − represents negative effect; VA and VB are the evolution rates of the ILU system and the LES system, respectively.
3. Results and Discussion
3.1. Changes in the ILU and LES Systems
3.1.1. Results of ILU and LES
The Hangzhou core urban area underwent tremendous changes both in land use and landscape ecosystem from 1992 to 2012. Values of ILU and LES were calculated under two PSR-based evaluation systems (Figure 5).
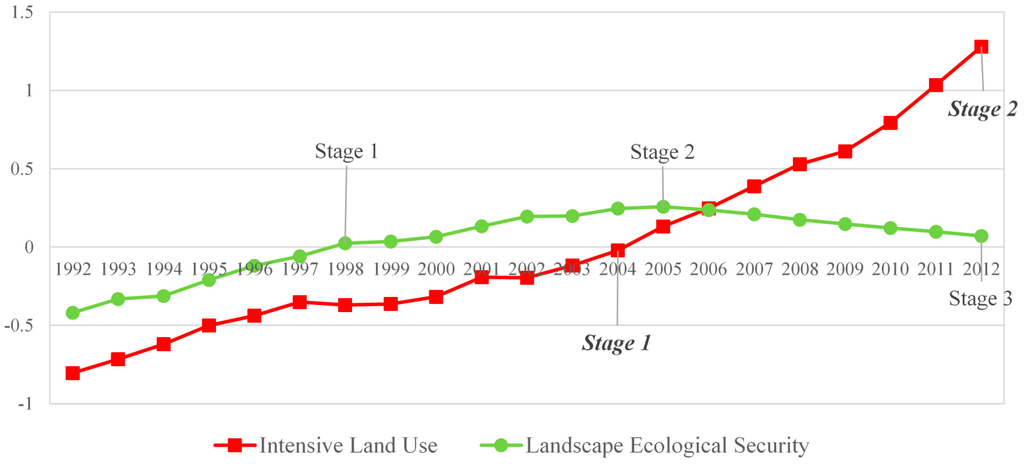
Figure 5.
Values and development stages of the ILU (intensive land use) and LES (landscape ecological security) systems.
Figure 5.
Values and development stages of the ILU (intensive land use) and LES (landscape ecological security) systems.

As observed in the change curve of ILU in Figure 5, the values of ILU kept increasing continuously throughout the period 1992–2012, reflecting the increasingly intensive land use in our study area. We found that values in 2004 changed from negative to positive, which demonstrated that land use patterns changed from extensive use (Stage 1) to intensive use (Stage 2). In addition, the slope of the curve in the later eleven years (2001–2012) was steeper than it was in the first ten years (1992–2001), which indicated that different rates of land use occurred. Two contrasted evolution speeds between the two stages implied that more rapid urbanization has taken place in this area since 2001.
As shown in Figure 5, there were several fluctuation changes in LES. The LES evolution process was divided into three stages. In Stage I (1992–1998), the values increased from negative values to positive values, demonstrating that the landscape ecosystem was improving during these years. In Stage II (1998–2005), the values continued steadily in the positive section, signifying that LES was in a good condition. In Stage III (2005–2012), the values nearly dropped to zero, which illustrated that there was degeneration in the landscape ecosystem due to the severe impacts and disturbances from human activities.
3.1.2. Analysis of ILU and LES Changes
A detailed analysis was conducted to understand the underlying factors and mechanisms of ILU and LES in the Hangzhou core urban area. Figure 6 and Figure 7 reveal the deconstructed information from the criterion levels of the ILU and LES systems.
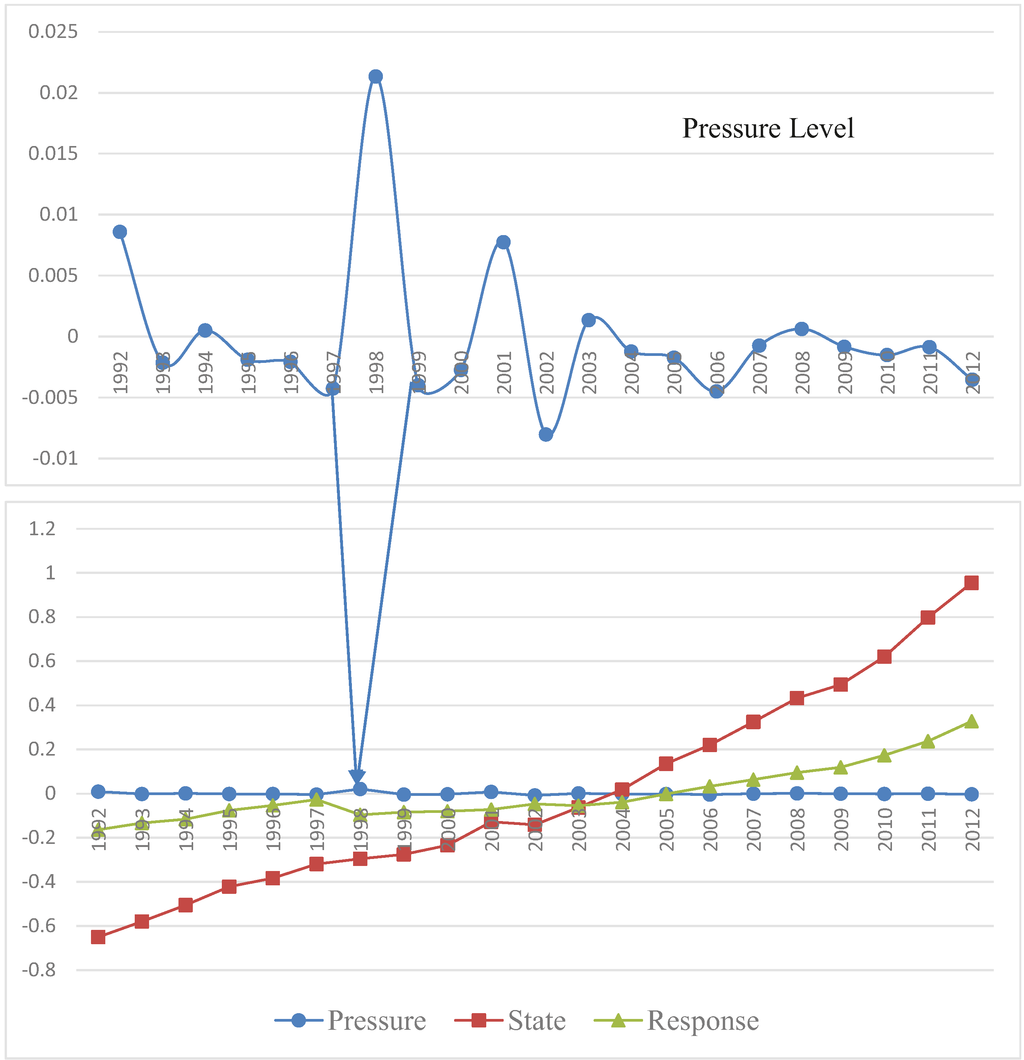
Figure 6.
Deconstructed analysis of pressure-state-response (PSR) levels of the ILU system.
Figure 6.
Deconstructed analysis of pressure-state-response (PSR) levels of the ILU system.

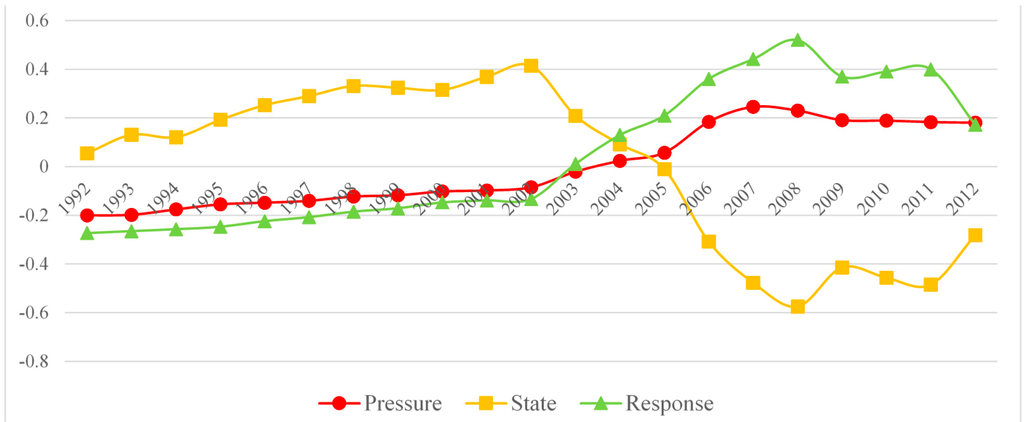
Figure 7.
Deconstructed analysis of PSR levels of the LES system.
Figure 7.
Deconstructed analysis of PSR levels of the LES system.

The pressure, state, and response values of the ILU system are shown in Figure 6. The ILU system in our research area has experienced a shift from extensive use pattern to intensive use pattern during 1992–2012. As time went on, land was subject to increasingly intensive use. The ILU system was mainly driven by factors at the state level. Pressures of ILU had limited impacts on the system, although the pressure level itself was sensitive to anthropogenic influences. Land became used more efficiently and values increased because more response effects took place.
The pressure level remained stable and even from 1992 to 2012 in general, revealing that the population growth and built-up area expansion were within the capacity of the urban system. However, there are two peaks in 1998 and 2001, which are mainly caused by the sudden increase in built-up areas after the administrative regional adjustments in 1996 and 2001. It should be noted that the former regional adjustment plan was permitted by the central government at the end of 1996, although it was not carried out the municipal government until 1998, whereas the latter adjustment was permitted by the central government at the beginning of 2001 and was carried out in the same year.
The state level grew drastically revealing that the city has been suffering from great land use intensity during the 21-year period. Encouraged by Hangzhou municipal government, built-up areas, including residential land, industrial land, and educational land have been converted from other land categories. To date, Hangzhou core urban area has set three Economic and Technological Development Zones (Hangzhou Economic and Technological Development Area (1993); Hangzhou Hi-tech Industry Development Zone (2002); Hangzhou Qianjiang Economic Development Area (2006)), which contributed large amounts of land intensity, population growth, and economic output [86].
The response score evolved steadily and grew rapidly after 2004, which implied that land use in the research area was changing from extensive to intensive, patterns and that more fixed assets and employee were invested in every land use. Although the government has set several Economic and Technological Development Zones and college towns, capital and employees would not be invested and attracted until fundamental facilities and public services were completed.
The pressure, state, and response values of the LES system are shown in Figure 7. The urban landscape ecosystem has been suffering from continual pressure from city development since 1992. In particular, the pressure level was maintained at a low level from 1992 to 2003 but underwent an intense increase in pressure from 2003 to 2012. The state of the ecosystem was improving until 2002, when it began to decrease to its lowest point in 2008, from which we concluded that the urban landscape ecosystem improved in the initial period under human activities, but was degenerated by high pressure in the later period. During the period from 1992 to 2003, response values were negative, which indicated that there was little response from human society to protect the urban landscape ecosystem, but after 2003, the local government took its first steps toward ecological conservation and ecosystem protection. Construction of Eco-City (2002), Ecological Function Zoning Planning (2008), and Ecological Civilization Construction (2011) were put forward by Hangzhou municipal government continually.
In sum, the landscape system had its own capacity and resilience; it continued to provide high values of ecosystem services and was not degraded until it was placed under high external pressure. External effects from humans became greater as urbanization developed. Though ecological responses had appeared to protect the ecosystem from being destroyed, the landscape ecosystem was degraded under accumulated pressure and was difficult to restore.
3.2. The Coupling Relationship between ILU and LES
3.2.1. Results of CCM and DCM within the ILU and LES Integrated System
The coupling development mode is displayed in Figure 8 for explicit analysis. The coupling relationship between ILU and LES in the Hangzhou core urban area was in Mode I (coordinated development). The angle degrees ranged from 20.05° to 84.44°, which indicated that land use and landscape security were in coordinated development. There was a trend in which the coupling relationship would evolve to Mode III (extreme parasitism), which implied that the two subsystems would be under antagonistic effects. Land would be intensively used but at the cost of decreasing LES; the urban landscape ecosystem would be degraded and bring adverse effects to the urban socioeconomic system.
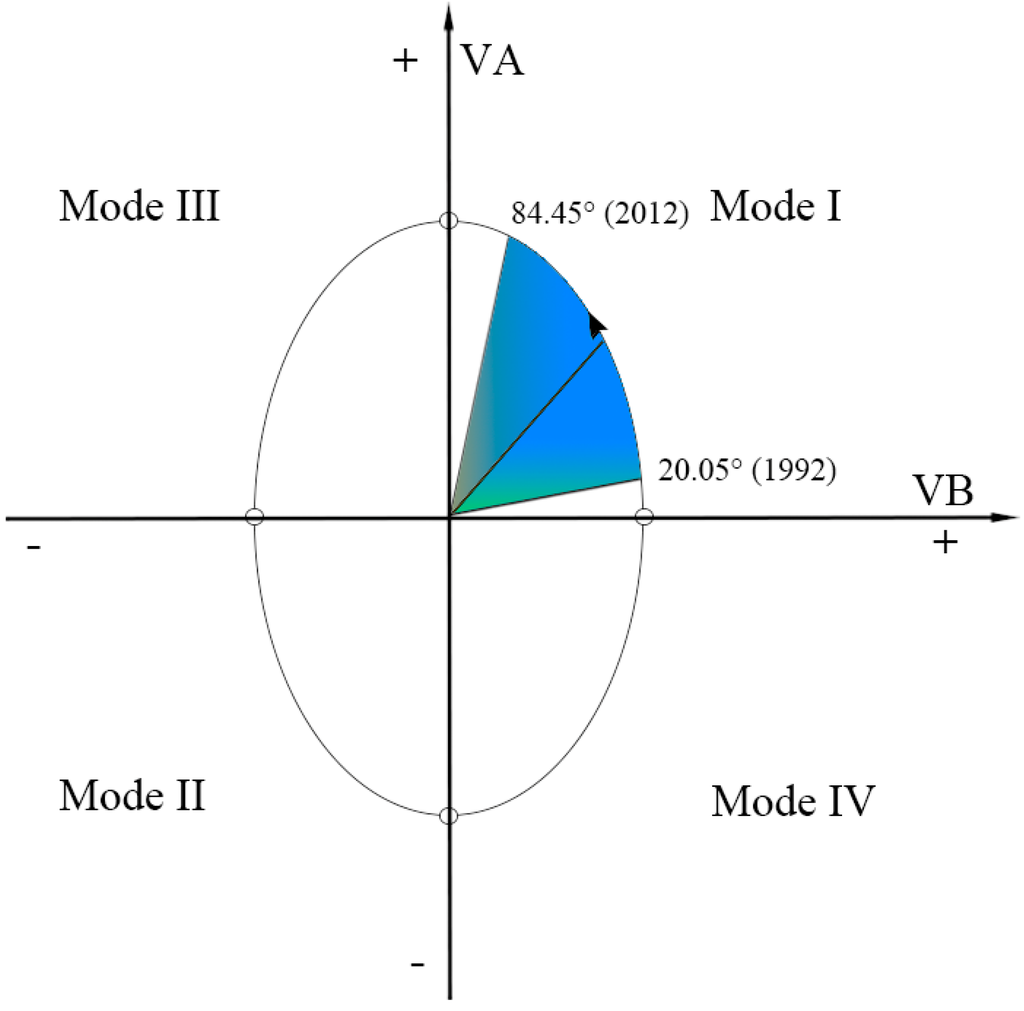
Figure 8.
Coupling development mode of the Hangzhou core urban area.
Figure 8.
Coupling development mode of the Hangzhou core urban area.

Although there is only Mode I in our research area over the past 21 years of the study period, there were several interesting findings in the changing curves. For a comprehensive analysis, we integrated the CCM degree and the DCM degree into one graph, and the values were standardized and are shown in Figure 9. As observed, we divided the whole process into three stages:
In Stage 1 (1992–2002), the CCM degree decreased from 1.00 to 0.52, and the DCM degree ranged from 0.35 to 0.97. In this period, the coordination degree was decreasing, which indicated a certain level of antagonistic effects between the land use system and the landscape ecosystem. The original and stable urban ecosystem became disturbed by human-induced activities as rapid urbanization occurred all across China. Land use might bring several negative impacts, but the impacts were within the tolerance of the urban ecosystem elasticity. However, the increasing DCM degree reflected that the entire compound system experienced a positive trend, and the two subsystems followed under coordinated development.
In Stage 2 (2002–2007), the CCM degree began to increase from 0.52 to 0.87, and the DCM degree ranged from 0.82 to 0.97. Clearly, we found that the CCM began increasing during this period, which implied that the urban ecosystem adapted to the intensive land use after 11 years. In addition, the increasing DCM degree indicated that both subsystems were under synergetic effects and collaborating together. Urban socioeconomic activities promoted the urban ecological system, and the urban ecosystem brought high-value services to human society.
In Stage 3 (2007–2012), the DCM degree increased from 0.97 to 1.47, which was above 1.00; and the CCM degree reached its highest point, 0.99, in 2011. Though the development process was still in a coordinated mode, the CCM degree began to decrease in the year 2011, and there seemed to be lightly discordant or limiting factors. The DCM degree above 1.00 implied that land was under quite intensive use in this period. The development trend seemed to lead the whole compound system into Mode III (extreme parasitism). The two subsystems were under antagonistic effects under this scenario, which means that land was used at the cost of decreasing LES; meanwhile, the urban landscape ecosystem was degraded, with adverse effects, which restricted the development of the land use system.
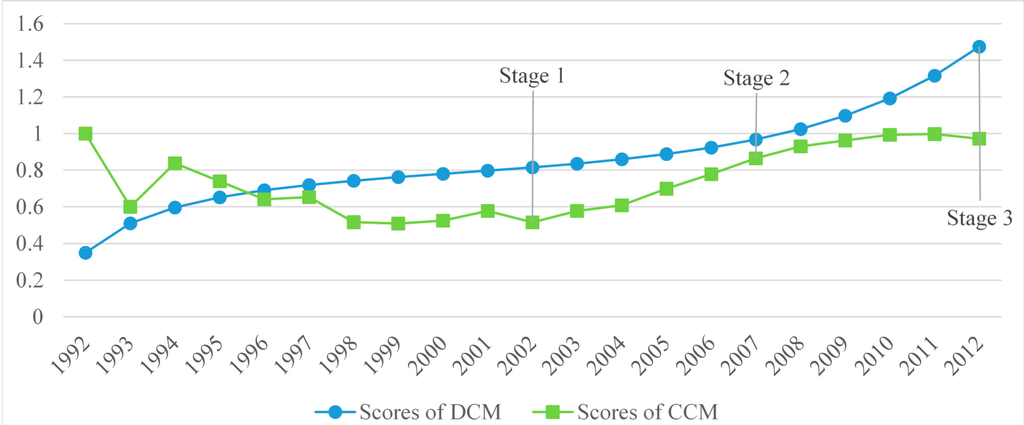
Figure 9.
Coupling coordination model (CCM) and dynamic coupling model (DCM) degrees of the compound system.
Figure 9.
Coupling coordination model (CCM) and dynamic coupling model (DCM) degrees of the compound system.

3.2.2. Discussion of the Coupling Relationship of the Integrated ILU and LES System
The coupling system generally maintained a stable condition, but the threshold values in each subsystem could evolve [87]. Both the ILU and LES systems had their own stability as systems and were not easily affected by external factors. For example, the factors of the ILU system, rather than external factors, drove the ILU system. In addition, threshold values existed in both of the subsystems, but they could be altered under overloaded or improved forces. It is commonly accepted that in the first period of urbanization, land is less developed, and the landscape ecosystem is in its original state. As urbanization spreads, land use brings efficiency and benefits to human society, but it is limited by technical, economic, and political factors. Similarly, the development of the landscape ecosystem provides human value and wealth but is restricted by the resilience, adaptability, and transformability of socioeconomic-ecological systems [88]. Both of the subsystems would be affected by overloaded forces, and the coupling system would then circulate and evolve through trajectories of different modes. The stability and evolution imply that there was potential for the regulation and optimization of the coupling system.
The ILU and LES integrated system was a coupling system in which subsystems were related to each other and internal elements had mutual effects. At the macro level, the intensity of land use was closely associated with urban landscape security. For example, in our study case, proper land use improved the landscape ecological security level at first, whereas drastic land use caused adverse impacts on LES in the later period (Figure 5). This result reflected the correlation between the urban socioeconomic system and the urban landscape ecosystem. At the micro level, elements of different subsystems had mutual effects. For example, the elements and condition of the urban ecosystem were driven by the physical and economic intensity of land use, which led to ecosystem process changes and impacts on the services provided by the landscape ecosystem; in addition, the implementation of ecological conservation from the LES system regulated land allocation and configuration in the ILU system. It is therefore necessary to optimize land use and improve landscape ecosystems to coordinate the coupling system for urban sustainability.
3.3. Methodological Discussion
Linking urban socioeconomic systems with urban ecosystems for sustainable urbanization is a major challenge. It is emphasized that a comprehensive understanding of the spatial dimensions of natural resource use has parallels with concepts and data related to ecological dynamics and requires a sophisticated understanding of urban ecosystems [89,90]. The methodology employed in this paper provided the initial step in the direction of integrating analytical and participatory assessment framework for urban sustainability. The research involved integrated evaluation models targeted at the aspects of the ILU system that represented the allocation and configuration of land resources and the aspects of the LES system as well that reflected urban ecological dynamics. The evaluation models can monitor and diagnose the information of states and dynamics both in urban socioeconomic systems and ecological systems. However, indicators in the two evaluation systems could still be improved by referring to an optimal theoretical background rather than being derived from pragmatic considerations [9]. For example, we calculated ecosystem service values by multiplying ecosystem value coefficients by the area of different land use types. However, the ecosystem value coefficients were revised at the regional level. Determining how to downscale the coefficients more suitably for the local study area should be discussed in future studies.
The coupling models developed in this paper provided a holistic view for identifying how to balance socioeconomic and ecological environments under rapid urbanization. The CCM degree could diagnose whether the two subsystems are developing in a coordinated way; and the DCM degree indicated the extent of synergistic effects between ILU and LES, reflecting the development trend of the compound system. The four coupling modes (coordinated development, restrained degeneration, extreme parasitism, and original symbiosis) described an evolution trajectory for urban socioeconomic-ecological system development. Although only one coupling mode in our research area provided explanation for the evolution process, from the trajectory we can understand the interaction and evolution process and thus contribute fundamental knowledge to decision-making. However, different case studies including the other modes could provide a complementary understanding of socioeconomic-ecological systems for urban sustainability. In addition, further researches could be conducted to simulate the interactive relationships under different scenarios of land use and landscape planning. A further system dynamics study could help understand the processes and consequences of separate factors and driving mechanisms.
3.4. Implications for Urban Sustainable Development
Socioeconomic development and ecological stability are two main considerations in the process of urbanization. Particularly in developing countries with large populations, the conflicts and trade-offs between these considerations have become a common focus throughout the world [91]. Planning and managing urban development for sustainability depend on knowledge of the underlying driving forces, mechanism and process [92], which involves spatial patterns of land uses that are socially and economically beneficial, as well as the conservation and development of natural resources [90]. City planners, economists and resource managers therefore need advanced methods and a comprehensive knowledge of the cities under their jurisdiction to make the informed decisions necessary to guide sustainable development in rapidly changing urban environments [93].
In this paper, two systems were established for evaluating land use level and landscape ecological security, which represent urban socioeconomic system and ecological system, respectively. The ILU evaluation system was orientated by urban land use planning factors, which were officially collected by statistical bureau. The ILU evaluation could thus provide administrative effectiveness and guide urban land use planning. The LES evaluation system was consist of landscape metrics and local ecological conservation policies. The system could therefore be used to indicate and diagnose the performance and problems. The system could also provide sustainable principles of urban development framework for local government. Specially, applying landscape metrics in LES, which has been demonstrated great contribution on operational efficiency for urban planning [93,94], would likely be useful in addressing the ecological dimension of urban land use planning. In addition, policy factors in response levels of the LES system were also included.
Besides, as many urban development policies did not include explicit targets, which made the evaluation difficult. Determining whether the polices have been effective in accomplishing their goals requires clarity regarding the goals and objectives [95]. This research on coupling relationships between intensive land use and landscape ecological security provided a multi-level interdisciplinary perspective that linked socioeconomic systems with ecological systems. The interaction between ILU and LES systems was detected by coupling models. The evolution trajectory of the coupling system provided explicit goals to help frame the operational objectives for local administrators.
4. Conclusions
This paper highlighted the coupling relationship between ILU and LES in the Hangzhou core urban area for understanding of the synergistic effects, interdependencies and trade-offs between urban socioeconomic and ecological systems. Socioeconomic data, landscape ecology concepts, and an integrated metrics approach were evaluated under a PSR framework by using a coupling model that provided multidimensional analysis to evaluate the coupling degree and to diagnose problems. The results of ILU and LES analysis showed that levels of both subsystems were increasing generally, but there were several fluctuation changes in LES. The interaction in each system was time lagged, and urban LUCC and ecosystem transformations were determined by political business cycles and influenced by specific factors. Economic cycles, the migration of populations, and political movements can lead to volatility in urban land use and ecosystems. The division of phases, for example, was strongly related to the change in administrative regions that occurs every five years with the reappointment period of government that takes place in China.
From the findings of the coupling results, it was concluded that the coupling system maintained a stable condition and underwent evolving threshold values. The ILU and LES integrated system was a coupling system in which subsystems were related to each other and internal elements had mutual effects. However, Mode II (restrained degeneration), Mode III (extreme parasitism) and Mode IV (original symbiosis) did not appear in our research area. As urbanization rapidly spreads throughout the world, raising awareness of ILU and LES should be emphasized. In China the government plays the key role in the allocation and utilization of land resources and institutionally dominates decision making for land use planning, public investments, and ecological conservation for sustainability [95]. However, the government expects public participation, such as efforts of non-governmental organizations (NGOs), to balance economic development and ecosystem protection. Therefore it is suggested that further detailed studies on the comprehensive characterization of the ILU and long-term mechanisms of monitoring and forecasting LES should be carried out for decision-making regarding urban sustainable development.
Acknowledgments
The research was supported by National Social Science Foundation of China (13AZD012), and the State Scholarship Fund of China (201306320003). The paper was completed also with support from the Center for International Earth Science Information Network (CIESIN), the Earth Institute, Columbia University, New York, NY, USA. We would like to thank Robert S. Chen of CIESIN for his help for the research. We also would like to thank reviewers for their suggestions and comments for revising the paper and Elisabeth Sydor of CIESIN for her editing assistance.
Author Contributions
Cifang Wu and Xiaoteng Cen developed the original idea and contributed to the conceptual framework. Xiaoteng Cen wrote the paper and was responsible for data collection, process and analysis. Xiaoshi Xing interpreted remotely sensed data for landscape pattern information and helped on GIS data analysis. Ming Fang, Zhuoma Garang and Yizhou Wu provided guidance and improving suggestions. All authors have read and approved the final manuscript.
Conflicts of Interest
The authors declare no conflict of interest.
References
- Boserup, E. Population and Technological Change: A Study of Long-Term Trends; University of Chicago Press: Chicago, IL, USA, 1981; p. 255. [Google Scholar]
- United Nations. World Urbanization Prospects: The 2014 Revision; Highlights (ST/ESA/SER.A/352); United Nations: New York, NY, USA, 2014; Volume 1. [Google Scholar]
- Haase, D.; Frantzeskaki, N.; Elmqvist, T. Ecosystem Services in Urban Landscapes: Practical Applications and Governance Implications. Ambio 2014, 43, 407–412. [Google Scholar] [CrossRef] [PubMed]
- Antrop, M. Landscape change and the urbanization process in Europe. Landsc. Urban Plan. 2004, 67, 9–26. [Google Scholar] [CrossRef]
- Haase, D.; Kabisch, N.; Haase, A. Endless urban growth? On the mismatch of population, household and urban land area growth and its effects on the urban debate. PLoS One 2013, 8, e66531. [Google Scholar] [CrossRef] [PubMed]
- Rowe, J.S.; Sheard, J. Ecological land classification: A survey approach. Environ. Manag. 1981, 5, 451–464. [Google Scholar] [CrossRef]
- Rowe, J.S. The ecosystem approach to forestland management. For. Chron. 1992, 68, 222–224. [Google Scholar] [CrossRef]
- Rowe, J.S. The level-of-integration concept and ecology. Ecology 1961, 42, 420–427. [Google Scholar] [CrossRef]
- De Groot, R.S.; Alkemade, R.; Braat, L.; Hein, L.; Willemen, L. Challenges in integrating the concept of ecosystem services and values in landscape planning, management and decision making. Ecol. Complex. 2010, 7, 260–272. [Google Scholar] [CrossRef]
- TEEB-The Economics of Ecosystems and Biodiversity. TEEB Manual for Cities: Ecosystem Services in Urban Management. Available online: http://www.teebweb.org/publication/teeb-manual-for-cities-ecosystem-services-in-urban-management (accessed on 18 September 2014).
- Burkhard, B.; Petrosillo, I.; Costanza, R. Ecosystem services—Bridging ecology, economy and social sciences. Ecol. Complex. 2010, 7, 257–259. [Google Scholar] [CrossRef]
- Millennium Ecosystem Assessment. In Ecosystems and Human Well-being: Synthesis; Island Press: Washington, DC, USA, 2005.
- Hassan, R.M.; Scholes, R.; Ash, N. Ecosystems and Human Well-Being: Current State and Trends: Findings of the Condition and Trends Working Group; Island Press: Washington, DC, USA, 2005; Volume 1, p. 1. [Google Scholar]
- Elmqvist, T.; Fragkias, M.; Goodness, J.; Güneralp, B.; Marcotullio, P.J.; McDonald, R.I.; Parnell, S.; Schewenius, M.; Sendstad, M.; Seto, K.C. Urbanization, Biodiversity and Ecosystem Services: Challenges and Opportunities; Springer: Berlin, Germany, 2013. [Google Scholar]
- Foley, J.A.; DeFries, R.; Asner, G.P.; Barford, C.; Bonan, G.; Carpenter, S.R.; Chapin, F.S.; Coe, M.T.; Daily, G.C.; Gibbs, H.K. Global consequences of land use. Science 2005, 309, 570–574. [Google Scholar] [CrossRef] [PubMed]
- Scalenghe, R.; Marsan, F.A. The anthropogenic sealing of soils in urban areas. Landsc. Urban Plan. 2009, 90, 1–10. [Google Scholar] [CrossRef]
- Mitchell, R.; Popham, F. Effect of exposure to natural environment on health inequalities: An observational population study. Lancet 2008, 372, 1655–1660. [Google Scholar] [CrossRef] [PubMed]
- Tzoulas, K.; Korpela, K.; Venn, S.; Yli-Pelkonen, V.; Kaźmierczak, A.; Niemela, J.; James, P. Promoting ecosystem and human health in urban areas using Green Infrastructure: A literature review. Landsc. Urban Plan. 2007, 81, 167–178. [Google Scholar] [CrossRef]
- Zhou, K.; Liu, Y.; Tan, R.; Song, Y. Urban dynamics, landscape ecological security, and policy implications: A case study from the Wuhan area of central China. Cities 2014, 41, 141–153. [Google Scholar] [CrossRef]
- Gabriel, S.A.; Faria, J.A.; Moglen, G.E. A multiobjective optimization approach to smart growth in land development. Socio-Econ. Plan. Sci. 2006, 40, 212–248. [Google Scholar] [CrossRef]
- Miller, J.S.; Hoel, L.A. The “smart growth” debate: Best practices for urban transportation planning. Socio-Econ. Plan. Sci. 2002, 36, 1–24. [Google Scholar] [CrossRef]
- Chen, H.; Jia, B.; Lau, S. Sustainable urban form for Chinese compact cities: Challenges of a rapid urbanized economy. Habitat Int. 2008, 32, 28–40. [Google Scholar] [CrossRef]
- Howley, P. Attitudes towards compact city living: Towards a greater understanding of residential behaviour. Land Use Policy 2009, 26, 792–798. [Google Scholar] [CrossRef]
- Lau, S.; Giridharan, R.; Ganesan, S. Multiple and intensive land use: Case studies in Hong Kong. Habitat Int. 2005, 29, 527–546. [Google Scholar] [CrossRef]
- Mander, Ü.; Helming, K.; Wiggering, H. Multifunctional Land Use: Meeting Future Demands for Landscape Goods and Services; Springer: Berlin, Germany, 2007; pp. 1–13. [Google Scholar]
- Slee, B. Social indicators of multifunctional rural land use: The case of forestry in the UK. Agric. Ecosyst. Environ. 2007, 120, 31–40. [Google Scholar] [CrossRef]
- Wiggering, H.; Dalchow, C.; Glemnitz, M.; Helming, K.; Müller, K.; Schultz, A.; Stachow, U.; Zander, P. Indicators for multifunctional land use—Linking socio-economic requirements with landscape potentials. Ecol. Indic. 2006, 6, 238–249. [Google Scholar] [CrossRef]
- Zhao, X.F.; Huang, X.J.; Chen, Y.; Chen, Z.G. Research Progress in Urban Land Intensive Use. J. Nat. Resour. 2010, 11, 1979–1996. [Google Scholar]
- Butler, A.; Åkerskog, A. Awareness-raising of landscape in practice. An analysis of Landscape Character Assessments in England. Land Use Policy 2014, 36, 441–449. [Google Scholar] [CrossRef]
- Pickett, S.T.; Cadenasso, M.L.; Grove, J.M. Resilient cities: Meaning, models, and metaphor for integrating the ecological, socio-economic, and planning realms. Landsc. Urban Plan. 2004, 69, 369–384. [Google Scholar] [CrossRef]
- Haase, D.; Larondelle, N.; Andersson, E.; Artmann, M.; Borgström, S.; Breuste, J.; Gren, Å.; Gomez-Baggethun, E.; Hamstead, Z.; Hansen, R.; et al. A Quantitative Review of Urban Ecosystem Service Assessments: Concepts, Models, and Implementation. Ambio 2014, 43, 413–433. [Google Scholar] [CrossRef] [PubMed]
- Carlson, T.N.; Traci Arthur, S. The impact of land use—Land cover changes due to urbanization on surface microclimate and hydrology: A satellite perspective. Glob. Planet Chang. 2000, 25, 49–65. [Google Scholar] [CrossRef]
- Wu, K.; Ye, X.; Qi, Z.; Zhang, H. Impacts of land use/land cover change and socioeconomic development on regional ecosystem services: The case of fast-growing Hangzhou metropolitan area, China. Cities 2013, 31, 276–284. [Google Scholar] [CrossRef]
- Su, S.; Xiao, R.; Jiang, Z.; Zhang, Y. Characterizing landscape pattern and ecosystem service value changes for urbanization impacts at an eco-regional scale. Appl. Geogr. 2012, 34, 295–305. [Google Scholar] [CrossRef]
- Hodson, M.; Marvin, S. “Urban ecological security”: A new urban paradigm? Int. J. Urban Reg. Res. 2009, 33, 193–215. [Google Scholar] [CrossRef]
- Du, P.; Xia, J.; Du, Q.; Luo, Y.; Tan, K. Evaluation of the spatio-temporal pattern of urban ecological security using remote sensing and GIS. Int. J. Remote Sens. 2012, 34, 848–863. [Google Scholar] [CrossRef]
- Li, X.; Tian, M.; Wang, H.; Wang, H.; Yu, J. Development of an ecological security evaluation method based on the ecological footprint and application to a typical steppe region in China. Ecol. Indic. 2014, 39, 153–159. [Google Scholar] [CrossRef]
- Wu, C.F.; Lu, Z.W.; Yang, Z.R.; Zheng, J.E.; Feng, K. Quantitative Study of Dynamic Relationship between Urbanization and Construction Land Expansion in China. China Land Sci. 2009, 2, 18–23. [Google Scholar]
- Riitters, K.H.; Wickham, J.D.; Wade, T.G. An indicator of forest dynamics using a shifting landscape mosaic. Ecol. Indic. 2009, 9, 107–117. [Google Scholar] [CrossRef]
- Huang, J.; Wang, R.; Zhang, H. Analysis of patterns and ecological security trend of modern oasis landscapes in Xinjiang, China. Environ. Monit. Assess. 2007, 134, 411–419. [Google Scholar] [CrossRef] [PubMed]
- Li, Y.; Sun, X.; Zhu, X.; Cao, H. An early warning method of landscape ecological security in rapid urbanizing coastal areas and its application in Xiamen, China. Ecol. Model. 2010, 221, 2251–2260. [Google Scholar] [CrossRef]
- Su, S.; Jiang, Z.; Zhang, Q.; Zhang, Y. Transformation of agricultural landscapes under rapid urbanization: A threat to sustainability in Hang-Jia-Hu region, China. Appl. Geogr. 2011, 31, 439–449. [Google Scholar] [CrossRef]
- Hammond, A.L.; World, R.I. Environmental Indicators: A Systematic Approach to Measuring and Reporting on Environmental Policy Performance in the Context of Sustainable Development; World Resources Institute: Washington, DC, USA, 1995. [Google Scholar]
- Kandziora, M.; Burkhard, B.; Müller, F. Interactions of ecosystem properties, ecosystem integrity and ecosystem service indicators—A theoretical matrix exercise. Ecol. Indic. 2013, 28, 54–78. [Google Scholar] [CrossRef]
- Feld, C.K.; Sousa, J.P.; da Silva, P.M.; Dawson, T.P. Indicators for biodiversity and ecosystem services: Towards an improved framework for ecosystems assessment. Biodivers. Conserv. 2010, 19, 2895–2919. [Google Scholar] [CrossRef]
- Pinto, R.; de Jonge, V.N.; Neto, J.M.; Domingos, T.; Marques, J.C.; Patrício, J. Towards a DPSIR driven integration of ecological value, water uses and ecosystem services for estuarine systems. Ocean Coast. Manag. 2013, 72, 64–79. [Google Scholar] [CrossRef]
- Huang, H.; Kuo, J.; Lo, S. Review of PSR framework and development of a DPSIR model to assess greenhouse effect in Taiwan. Environ. Monit. Assess. 2011, 177, 623–635. [Google Scholar] [CrossRef] [PubMed]
- Niemeijer, D.; de Groot, R.S. A conceptual framework for selecting environmental indicator sets. Ecol. Indic. 2008, 8, 14–25. [Google Scholar] [CrossRef]
- Meng, Y.; Zhang, F.; An, P.; Dong, M.; Wang, Z.; Zhao, T. Industrial land-use efficiency and planning in Shunyi, Beijing. Landsc. Urban Plan. 2008, 85, 40–48. [Google Scholar] [CrossRef]
- Herold, M.; Scepan, J.; Clarke, K.C. The use of remote sensing and landscape metrics to describe structures and changes in urban land uses. Environ. Plan. A 2002, 34, 1443–1458. [Google Scholar] [CrossRef]
- Jenerette, G.D.; Wu, J. Analysis and simulation of land-use change in the central Arizona–Phoenix region, USA. Landsc. Ecol. 2001, 16, 611–626. [Google Scholar] [CrossRef]
- Luck, M.; Wu, J. A gradient analysis of urban landscape pattern: A case study from the Phoenix metropolitan region, Arizona, USA. Landsc. Ecol. 2002, 17, 327–339. [Google Scholar] [CrossRef]
- Weng, Y. Spatiotemporal changes of landscape pattern in response to urbanization. Landsc. Urban Plan. 2007, 81, 341–353. [Google Scholar] [CrossRef]
- Xu, J.; Grumbine, R.E.; Beckschäfer, P. Landscape transformation through the use of ecological and socioeconomic indicators in Xishuangbanna, Southwest China, Mekong Region. Ecol. Indic. 2014, 36, 749–756. [Google Scholar] [CrossRef]
- Wang, Y. Study on Indictors for the Assessment of Land Saving and Intensive Use. China Land Sci. 2006, 20, 24–31. [Google Scholar]
- Yang, D.; An, X. Colligation evaluation of Xi’an urban land intensive use. Econ. Geogr. 2007, 22, 111–115. [Google Scholar]
- Tan, M.; Li, X.; Xie, H.; Lu, C. Urban land expansion and arable land loss in China—A case study of Beijing-Tianjin-Hebei region. Land Use Policy 2005, 22, 187–196. [Google Scholar] [CrossRef]
- Hangzhou Municipal Statistic Bureau. Available online: http://www.hzstats.gov.cn/web/more2.aspx?id=EuvfD175mjE=&name=vdpsN636PcaolV18yOEw4A== (accessed on 18 September 2014).
- Costanza, R.; D’Arge, R.; Groot, R.D.; Farber, S.; Grasso, M.; Hannon, B.; Limburg, K.; Naeem, S.; O’Neill, R.V.; Paruelo, J. The value of the world’s ecosystem services and natural capital. Nature 1997, 387, 253–260. [Google Scholar] [CrossRef]
- Kreuter, U.P.; Harris, H.G.; Matlock, M.D.; Lacey, R.E. Change in ecosystem service values in the San Antonio area, Texas. Ecol. Econ. 2001, 39, 333–346. [Google Scholar] [CrossRef]
- Xie, G.D.; Lu, C.X.; Leng, Y.F.; Zheng, D.; Li, S.C. Ecological assets valuation of the Tibetan Plateau. J. Nat. Resour. 2003, 2, 189–196. [Google Scholar]
- Fang, M.; Wu, C.F.; Shen, X.Q.; Lv, T.G. Evolution of Ecosystem Service Value in Hangzhou. Areal Res. Dev. 2014, 33, 153–158. [Google Scholar]
- Linstone, H.A.; Turoff, M. The Delphi Method: Techniques and Applications; Addison-Wesley Reading MA: Boston, MA, USA, 1975; Volume 29. [Google Scholar]
- Zou, Z.; Yun, Y.; Sun, J. Entropy method for determination of weight of evaluating indicators in fuzzy synthetic evaluation for water quality assessment. J. Environ. Sci. 2006, 18, 1020–1023. [Google Scholar] [CrossRef]
- Shannon, C.E. A mathematical theory of communication. ACM Sigmobile Mob. Comput. Commun. Rev. 2001, 5, 3–55. [Google Scholar] [CrossRef]
- Larsen, T.A.; Gujer, W. The concept of sustainable Urban Water Management. Water Sci. Technol. 1997, 35, 3–10. [Google Scholar] [CrossRef]
- Antrop, M. Landscape change: Plan or chaos? Landsc. Urban Plan. 1998, 41, 155–161. [Google Scholar] [CrossRef]
- Balocco, C.; Grazzini, G. Thermodynamic parameters for energy sustainability of urban areas. Sol. Energy 2000, 69, 351–356. [Google Scholar] [CrossRef]
- Herrmann-Pillath, C.; Kirchert, D.; Pan, J. Disparities in Chinese economic development: approaches on different levels of aggregation. Econ. Syst. 2002, 26, 31–54. [Google Scholar] [CrossRef]
- Shemshadi, A.; Shirazi, H.; Toreihi, M.; Tarokh, M.J. A fuzzy VIKOR method for supplier selection based on entropy measure for objective weighting. Expert Syst. Appl. 2011, 38, 12160–12167. [Google Scholar] [CrossRef]
- Song, H.M.; Hou, H.P.; Zhang, S.L.; Ding, Z.Y.; Huang, J.H. Research on Evaluation of Urban Land Intensive Utilization—A Case Study in Xuzhou City. Resour. Dev. Market 2007, 23, 116–118. [Google Scholar]
- Li, Z.; Yongming, Z.; Meichen, F.; Pengtao, Z.; Yingui, C. Comparative study on intensive use of rural residential land based on principal component analysis and entropy method. Trans. Chin. Soc. Agric. Eng. 2012, 28, 235–242. [Google Scholar]
- Carver, S.J. Integrating multi-criteria evaluation with geographical information systems. Int. J. Geogr. Inf. Syst. 1991, 5, 321–339. [Google Scholar] [CrossRef]
- Sun, X.; Zhu, X.D.; Li, Y.F. Landscape ecological security assessment in rapidly urbanizing bay-area: A case study of Xiamen City, China. Acta Ecol. Sin. 2008, 28, 3563–3573. [Google Scholar]
- Hangzhou Bureau of Land and Resources. Available online: http://www.hzgtj.gov.cn:83/page/guihua/page.asp?id=858 (accessed on 18 September 2014).
- Vapnik, V.N.; Vapnik, V. Statistical Learning Theory; Wiley: New York, NY, USA, 1998; Volume 2. [Google Scholar]
- Hangzhou Municipal Government. Available online: http://www.hangzhou.gov.cn/main/zfxxgk/glgh/jhzj/index.shtml (accessed on 18 September 2014).
- Hangzhou Environmental Protection Bureau. Available online: http://www.hzepb.gov.cn/zwxx/gkml/zxgk/index_1.htm (accessed on 18 September 2014).
- Ruehli, A.E. Equivalent circuit models for three-dimensional multiconductor systems. IEEE Trans. Microw. Theory Tech. 1974, 22, 216–221. [Google Scholar] [CrossRef]
- Huang, J.C.; Fang, C.L. Analysis of coupling mechanism and rules between urbanization and eco-environment. Geogr. Res. 2003, 22, 211–220. [Google Scholar]
- Liu, Y.B.; Li, R.D.; Song, X.F. Analysis of Coupling Degrees of Urbanization and Ecological Environment in China. J. Nat. Resour. 2005, 1, 105–112. [Google Scholar]
- Liao, C.B. Quantitative judgment and classification system for coordinated development of environment and economy- A Case Study of the City Group in the Pearl River Delta. Trop. Geogr. 1999, 19, 171–177. [Google Scholar]
- Haken, H.; Graham, R. Synergetik-Die Lehre vom Zusammenwirken. Umschau Wissenschaft und Technik 1971, 6, 191–195. [Google Scholar]
- Lyapunov, A.M. The general problem of the stability of motion. Int. J. Control 1992, 55, 531–534. [Google Scholar] [CrossRef]
- Bertalanffy, L.V. General Systems Theory: Foundations, Development, Applications, Revised Edition; George Braziller: New York, NY, USA, 1976. [Google Scholar]
- Yue, W.; Liu, Y.; Fan, P. Measuring urban sprawl and its drivers in large Chinese cities: The case of Hangzhou. Land Use Policy 2013, 31, 358–370. [Google Scholar] [CrossRef]
- Li, B.J.; Wang, W.M. Coupling relationship between regional land use and eco-environment. Arid Land Geogr. 2008, 1, 142–148. [Google Scholar]
- Walker, B.; Holling, C.S.; Carpenter, S.R.; Kinzig, A. Resilience, adaptability and transformability in social—Ecological systems. Ecol. Soc. 2004, 9. Article 5. [Google Scholar]
- Pickett, S.T.A.; Cadenasso, M.L.; Grove, J.M.; Nilon, C.H.; Pouyat, R.V.; Zipperer, W.C.Ô.C. Urban Ecological Systems: Linking Terrestrial Ecological, Physical, and Socioeconomic Components of Metropolitan Areas 1. Ann. Rev. Ecol. Syst. 2001, 32, 127–157. [Google Scholar] [CrossRef]
- Leitão, A.B.; Ahern, J. Applying landscape ecological concepts and metrics in sustainable landscape planning. Landsc. Urban Plan. 2002, 59, 65–93. [Google Scholar] [CrossRef]
- Zhang, J.; Fu, M.; Zhang, Z.; Tao, J.; Fu, W. A trade-off approach of optimal land allocation between socio-economic development and ecological stability. Ecol. Model. 2014, 272, 175–187. [Google Scholar] [CrossRef]
- Klosterman, R.E. The what if? Collaborative planning support system. Environ. Plan. B 1999, 26, 393–408. [Google Scholar] [CrossRef]
- Pham, H.M.; Yamaguchi, Y.; Bui, T.Q. A case study on the relation between city planning and urban growth using remote sensing and spatial metrics. Landsc. Urban Plan. 2011, 100, 223–230. [Google Scholar] [CrossRef]
- Wu, Y.Z.; Wu, C.F.; Li, B.; Luo, W.B. Research on spatial-temporal evolution and its mechanisms for urban planning control performance: A case study on five master plans of Beijing during 1958–2004. City Plan. Rev. 2013, 7, 33–41. [Google Scholar]
- Bengston, D.N.; Fletcher, J.O.; Nelson, K.C. Public policies for managing urban growth and protecting open space: Policy instruments and lessons learned in the United States. Landsc. Urban Plan. 2004, 69, 271–286. [Google Scholar] [CrossRef]
© 2015 by the authors; licensee MDPI, Basel, Switzerland. This article is an open access article distributed under the terms and conditions of the Creative Commons Attribution license (http://creativecommons.org/licenses/by/4.0/).