Article

Typology of Cities Based on City Biodiversity Index: Exploring Biodiversity Potentials and Possible Collaborations among Japanese Cities

1
Graduate School of Human and Socio-Environmental Studies, Kanazawa University, Kakuma, Kanazawa 920-1192, Japan; E-Mail: [email protected]
2
Research Institute for Humanity and Nature, 457-4 Motoyama, Kamigamo, Kita-ku, Kyoto 603-8047, Japan
*
Author to whom correspondence should be addressed.
Sustainability 2015, 7(10), 14371-14384; https://doi.org/10.3390/su71014371
Submission received: 31 March 2015 / Revised: 15 October 2015 / Accepted: 15 October 2015 / Published: 23 October 2015
(This article belongs to the Special Issue Planning, Development and Management of Sustainable Cities)

Abstract

:
A City Biodiversity Index (CBI) has been proposed and applied at the international level to enable local municipalities and cities to manage biodiversity and ecosystem services in a sustainable manner. CBI databases are being constructed as global platforms, though the available dataset is limited. The land-use dataset is one of the datasets that can be utilized to apply the CBI on the national level in countries including Japan. To demonstrate the importance and potential of the CBI under the limitation of the available dataset, we attempted to apply the CBI to the 791 Japanese cities by using available land-use indicators, and categorized the cities based on the indicators. The focus of the CBI is self-assessment, but we propose that grouping of cities with similar profiles is possible and can serve as a basis for potential collaboration. Coordinating policies on various scales is necessary in order to enhance biodiversity on a global scale; one option is to increase collaboration among cities. As a result, we found three groups with similar characteristics amongst cities with forests, paddies, and croplands as major compositions in terms of biodiversity. These findings will contribute to policy formation and efficient information sharing for ecosystem services management.

1. Introduction: Biodiversity and Sustainability

Since 2008, more than half of the world’s population has been living in urban areas [1]. Urban population is estimated to continuously increase to 66% of the world population by 2050 [2]. Until the end of the 20th century, urbanization had not gained global attention for its impact on the conservation of natural resources and environment [3,4,5]. However, since human activities in urban areas influence the global environment by affecting the circulation of substances between urban and non-urban areas [3,6,7], urbanization is a critical issue with regard to environmental sustainability.
At present, reduction of biodiversity is considered one of the most urgent global environmental issues [8]; changes in biodiversity and ecosystem services associated with urbanization is also an important issue [9]. Biodiversity is the basis for ecosystem services and supports human activities in various aspects, including provisioning of resources [10,11,12]. Ecosystem services for urban populations are frequently obtained from outside city boundaries. These services include the regulation of climate, water, or soil. The primarily benefits are through the trade of resources [3,13,14,15]. The rapid increase in urban population might mean that more resources need to be obtained from remote areas, leading to changes in the landscape in those remote areas [16]. By this process, urbanization brings about reduction of biodiversity on a global scale.
On the other hand, the Cities and Biodiversity Outlook [9] highlighted that cities could also contribute to the enhancement of biodiversity. Cities include built-up areas, including residential blocks and paved roads, which are frequently developed among agriculture lands, forests, and other natural lands. These developments lead to the formation of complex landscapes involving mosaic of different categories of land use; in areas with such landscapes, biodiversity is relatively high [17,18,19]. Moreover, in areas surrounding cities, some areas are protected for ecosystem development. Therefore, cities and their surrounding areas can contribute to the enhancement and restoration of biodiversity. However, since recent rapid urbanization leads to landscape changes in areas that have a high potential of biodiversity [10,20,21,22], adequate managements of urbanization is necessary to preserve city biodiversity.
Global environmental communities such as the Convention on Biological Diversity (CBD) have been increasingly recognizing the loss of biodiversity caused by urbanization as an urgent issue in recent years, particularly since 2008, when the ninth meeting of Conference of the Parties (COP9) officially adopted this issue (Decision XI/28). Therefore, conservation and enhancement of biodiversity and ecosystems in cities are attracting increased attention [5,9,11,23] since they provide environmental as well as socio-economic benefits that can enhance the amenities and the quality of life for urban residents [17]. The ecosystems in a city influence the health and safety of urban populations [24], and can contribute to enhancing resilience against climate changes, natural disasters, or other security issues. In terms of city sustainability, environment, economy, and society need to be considered as the baselines [25]. In this respect, enhancement of city biodiversity is a significant task for urban societies from the viewpoint of sustainability.
Implementation of strategies for enhancement of city biodiversity requires the coordination of local governments [11,26], and the global agenda needs to be connected to local issues [27]. Therefore, accurately monitoring city biodiversity and ecosystem services is necessary [5,28]. For such monitoring, indicators to evaluate city biodiversity and ecosystem services have been developed, such as the city biodiversity index (CBI).
Further, coordinating policies at various scales is necessary in order to enhance biodiversity at a global scale. One such option is increasing collaboration among cities. For example, cities are required to collaborate, share experiences, and establish a network [5]. However, each individual city needs to maintain its own cultural, social, and environmental conditions; this might hinder the formation of such collaborations [29]. The measures and policies used in one city might not be applicable to the others because of the differences in their environmental conditions. Therefore, understanding the unique or similar characteristics of biodiversity and ecosystem services among cities is necessary; this requires comparison of their environmental conditions by using CBI to allow effective exchange of knowledge and policies among cities. However, few studies have compared the global urban biodiversity and ecosystem services by using identical indicators for quantitative measurements.
In this study, we used CBI to quantitatively categorize 791 cities in Japan and identified the common and heterogeneous characters to demonstrate the potential of the CBI by using available land-use indicators. Thus, we identified the groups of Japanese cities based on the land-use indicators. The cities in the same groups can become potential collaborators to share the experiences and knowledge of ecosystem services management, and the collaboration can contribute to the coordination of policies on different spatial scales.
Herein, we provide information regarding CBI and describe the methodologies used, including the datasets and quantifying indicators obtained using the CBI. We then characterized each identified category of cities. We also identified the challenges for urban biodiversity and ecosystem services and possible urban collaboration required for ensuring sustainability.

2. City Biodiversity Index

2.1. Evaluation of City Biodiversity

We reviewed existing literature on the methods used for evaluating biodiversity and ecosystem services for their adequate management.
The importance of biodiversity has been indicated globally; however, loss of biodiversity remains an important issue [30]. Thus, the role of cities in maintaining biodiversity has been emphasized [9]. Some databases allow the evaluation of the impact of human activities on biodiversity and ecosystem services at the macro-regional scale [31]. However, the database for city biodiversity is not yet available. For each regional scale, appropriate indicators (or adjustments) need to be designed urgently [26,29]. Definitions and baseline data, particularly for those related to ecosystem services, are missing for many municipalities.
The research related to the evaluation methods for city biodiversity can contribute to developing global data platforms [32]. The biodiversity in urban areas has been evaluated in order to enhance the quality of life [24]. Ecosystem services, excluding cultural services, are likely not active in urban areas that have a dominant built-up area. However, Larondelle and Haase [33] indicated that services related to the regulation of climate and air quality are implemented in cities. The target cities of their research included Berlin, Helsinki, Salzburg, and Stockholm. Regulating services active in urban forests include reduction of air pollution [34]. Regulation services at forested urban parks might contribute to the enhancement of ecosystem services [35]. Manes et al. [36] suggested that tree diversity significantly affected the stability of regulating services, including tropospheric ozone removal, and indicated that analyzing the functions of tree diversity for evaluation for ecosystem services in cities is necessary.
The impacts of urban activities on biodiversity have been investigated in Asian cities [37]. Gómez-Baggethun and Barton [17] indicated the type of ecosystem services that need to be managed during urban planning to enhance the quality of life and resilience. They provided a list of indicators for not only cultural services but also other types of ecosystem services.
Collecting and integrating the existing research results and methods for sharing information and knowledge across cities globally are necessary. Such integration can contribute to efficient and effective management of city biodiversity and ecosystem services. City sustainable index [38] is another major environmental indicator. However, this index does not provide direct evaluation of biodiversity [26]. Therefore, CBI is proposed as an adequate global platform [39].

2.2. Three Key Aspects of City Biodiversity Index

The CBI has three key aspects: (1) native biodiversity, (2) ecosystem service, and (3) governance and management. In all, 23 indicators have been proposed for sustainable management of city biodiversity. These three aspects are necessary to understand biodiversity in urban areas and to ensure its adequate management and conservation. First, the different types of biodiversity existing in urban areas need to be identified (native biodiversity), their importance in terms of ecosystem services needs to be evaluated (ecosystem service), and then methods for monitoring the present biodiversity situation and policies for its management need to be developed (governance and management). Indicators related to area of natural areas and number of native species (vascular plants, birds, and butterflies) are included in the native biodiversity indicators. Carbon storage and the cooling effect of vegetation, and area of parks with natural areas are ecosystem service indicators. The amount spent on biodiversity-related administration, and the status of local biodiversity strategy and action plan are indicators of governance and management. CBI consists of indicators that are organized by the collaboration of different departments in local municipalities to facilitate their communication. In addition, continued monitoring activities by CBI can motivate stakeholders to ensure the conservation of ecosystems. The indicators of CBI can be linked to targets for urban sustainability, and they can play important roles in monitoring and evaluating the strategies used by cities [26].
CBI databases are being constructed as global platforms, although they involve technical and administrative issues [26]. Technical issues include (1) collection of data for indicators, (2) establishment of spatial territories and definitions of indicators, and (3) elucidation of the different ecological background of each city. For the first issue, methods need to be developed to easily collect data by using remote sensing technology and to establish globally shared indicators. Identifying species associated with biodiversity and investigating the relationships between species and ecosystem services are essential. The species indicators are included in the CBI; however, the data of those indicators are not available in the most of the cities, excluding the major cities that have local biodiversity strategies. In the application of the CBI on the national level in Japan, the land-use indicators are limited available indicators. For the second and third issues, considering the spatial- and time-scale dependence of indicators and organizing relevant indicators for each scale are needed. Further, the administrative issues need to be addressed. Governments in cities need to collect and organize relevant data for calculating CBI indicators and facilitate policies and actions for ensuring urban sustainability by linking the indicators to targets. However, capacity shortage of city governments is the main administrative issue. These issues will be discussed in detail in Section 4.
CBI does not intend to compare cities, but attempts to evaluate them individually. Nonetheless, obtaining comparable qualitative data for the indicators of native biodiversity or ecosystem services is possible. For example, the proportion of natural areas, one of the indicators of native biodiversity, can be obtained based on remotely sensed data and can be compared globally. In addition, biodiversity and ecosystem services are strongly related to the proportion of each land use category, including natural areas and their distribution patterns in urban areas. Kadoya and Washitani [40] suggested a correlation among land-use mosaic patterns and biodiversity. Thus, the characteristics of land use in urban areas can be considered the basic information for conserving biodiversity and ecosystem services.
In this study, we attempted to comprehensively identify the characteristics of land use in municipal areas of Japanese cities, based on the proportion of natural areas and other land use categories; further, we determined the degree of land-use mixture. Next, we categorized the cities by using the land-use indicators and identified several types of cities having similar characteristics. Kadoya and Washitani [40] proposed an index that correlates with biodiversity; this index identified the degree of land-use mixture calculated based on the number of land-use categories and proportion of each existing category in a target area. We used this index to evaluate the land-use mixture. This index is mainly used in non-urban areas, but we will extend the application to urban contexts in this study.

3. Categorization of Cities According to Land-Use Indicators

We performed principal component analysis (PCA) of land-use indicators (Table 1) to determine the variables for categorization. The proportion of natural areas, including forests, shrubs, and grasslands, is one of the native biodiversity indicators in CBI. The other native biodiversity indicators are “changes in the number of native species (vascular plants, birds, and butterflies)”, “proportion of protected areas”, “proportion of invasive alien species”, “connectivity measures or ecological networks to counter fragmentation”, and “native biodiversity in built-up areas” [39]. The land-use mixture is related to biodiversity in urban regions [40]. We considered other land-use indicators (see Table 1) in addition to those related to CBI, to identify the basis of collaboration among cities with similar ecosystem characteristics. We analyzed 791 cities in Japan to provide a platform for collaboration among cities by categorizing them according to the land-use indicators related to biodiversity potentials. The species indicators are included in the CBI; however, the data of these indicators are not available in the most of the cities. To demonstrate the importance and potential of the CBI, we attempted to apply CBI to the cities by using available land-use indicators. Further consideration is given for the use of CBI as the platform for the collaboration. We used data for the Japanese cities; these cities have an administrative level called “Shi” [41]. Next, we categorized the cities based on cluster analysis by using the results of the PCA.
Table 1. Indicators for categorization of cities.
IndicatorUnit
Average of degree of land use mixture-
Proportion of forest areas%
Proportion of natural areas with vegetation excluding forest%
Proportion of paddy fields%
Proportion of cropland and other vegetation mosaic%
Proportion of built-up areas%

3.1. Data

The global land cover data can be used as land-use distribution data. The high-resolution global land cover data have been developed using recent innovative information technology, and are available freely. We used the data from GLCNMO [42], since these data have relatively high resolution––15 arc-second; further, these data have been developed based on the collaboration among institutes across several countries. In all, 20 land cover categories are included in these data. Of these, five categories each are for different kinds of forests and natural areas with vegetation excluding forests. Agricultural land covers three categories that include paddy field, cropland, and agricultural land with other vegetation mosaic. The overall classification accuracy of GLCNMO is 77.9% by 904 validation points in the world. For the PCA, we used six indicators that are shown in Table 1. These indicators were calculated for each city by using GLCNMO. In this preliminary study, we used a forest category that included different types of forest. We intend to consider the different types of forests, such as broadleaved deciduous species, broadleaved evergreen species, and conifers in the future to understand the detailed differences among cities characterized by forests. To identify more detailed categories of cities in the further research, we will need to consider shrubs and grasslands separately in the land-use category—natural areas with vegetation excluding forests.
The indicator for land-use mixture was calculated by using the method described by Kadoya and Washitani [40]. Their index is calculated based on the number of land-use categories and proportion of each existing category in a target area. It is calculated by each 6 km square grid. Kadoya and Washitani proposed the grid resolution based on the spatial scale of habitats of the plants and animals. To evaluate the land-use mixture in each city administrative boundaries, we considered the land-cover categories except built-up area as categories that enhance the degree of land-use mixture.

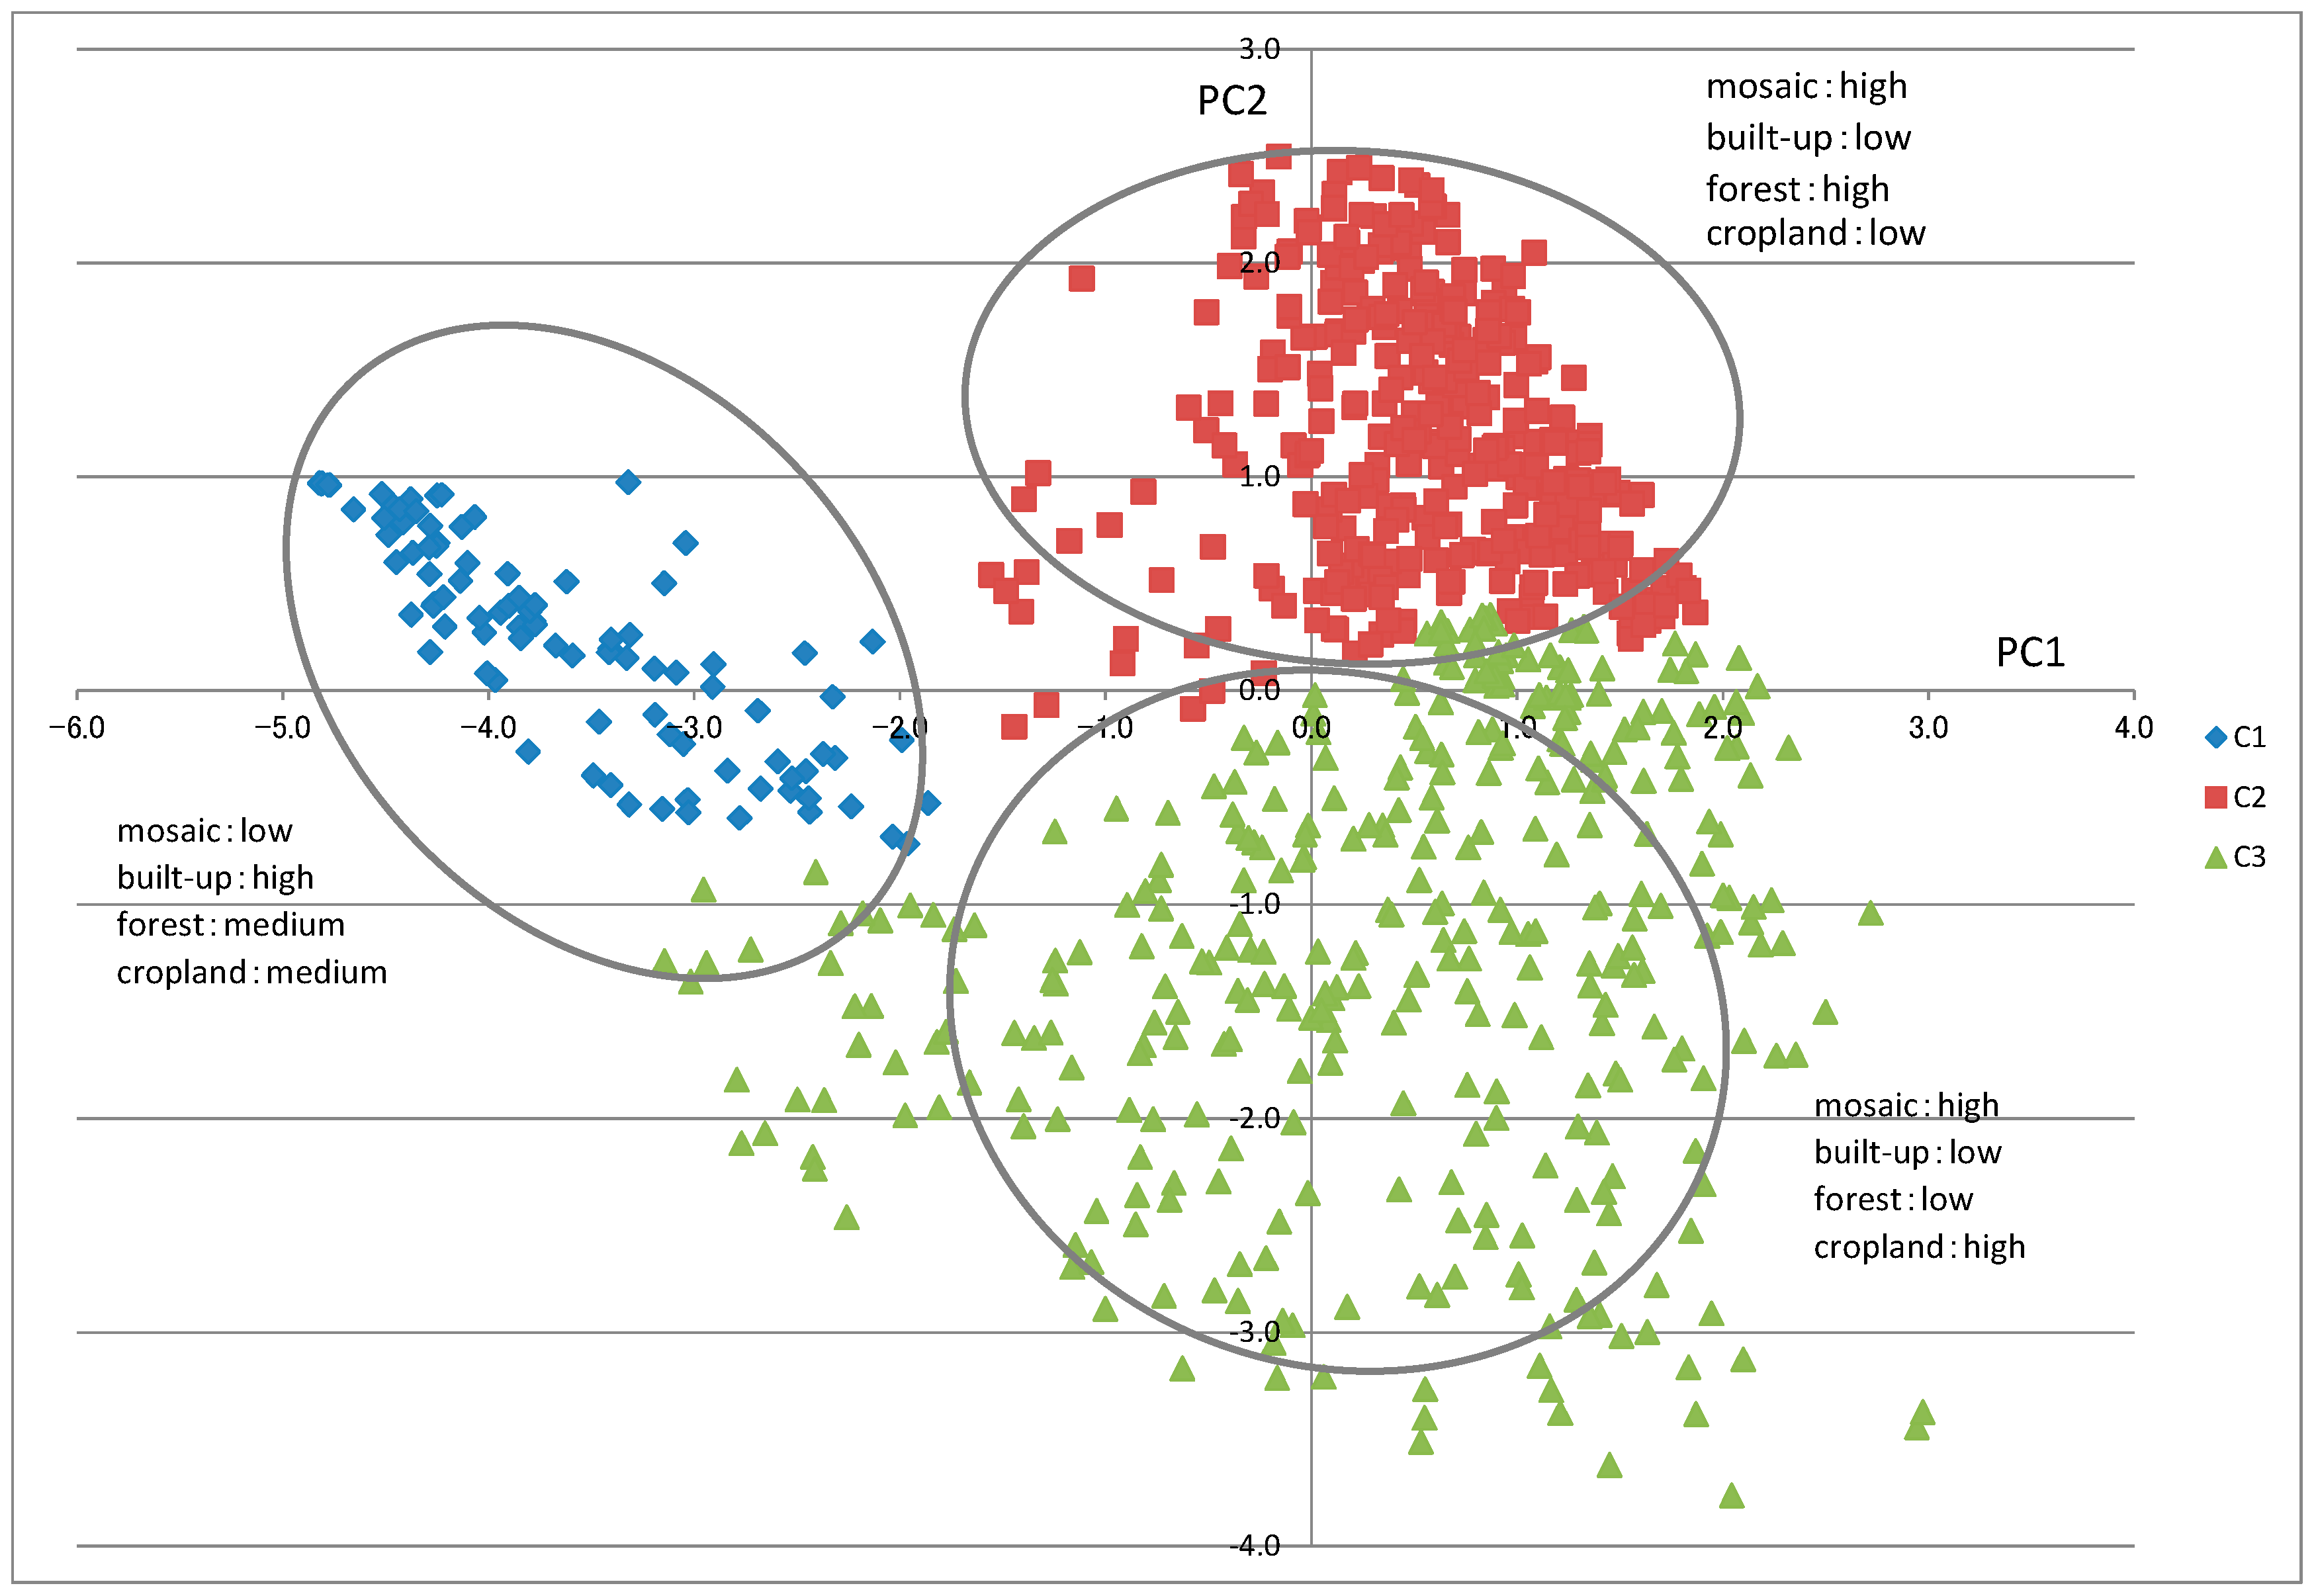
3.2. Results of Principal Component Analysis

We performed PCA on the six indicators. We identified two principal components (Table 2) with a cumulative contribution ratio of 76.7%. The ratio shows that these two principal components can sufficiently explain the differences in cities.
The first component has a strong positive correlation with the degree of land-use mixture, and a negative correlation with its proportion of built-up areas. The second component has relatively strong positive correlation with the proportion of forests and negative correlation with the proportion of paddy and cropland.
The results of the PCA showed that the degree of land-use mixture is one of the important indicators for understanding the characteristics of cities. In addition, the proportions of land-use categories are not alternatives for land-use mixtures, because the former show quantitative characteristics and the latter reflect the qualitative ones.
Table 2. The two principal components.
Eigenvalue and ContributionPC1PC2
Eigenvalue2.67131.9294
Contribution0.44520.3216
Cumulative contribution0.44520.7668
Eigenvector
Landuse mixture0.5754−0.1201
Forest0.36240.56
Shrub and Grassland0.4207−0.2874
Paddy field−0.1219−0.5169
Cropland and Other vegetation mosaic0.1919−0.5646
Built-up area−0.5558−0.0583
Factor loading
Landuse mixture0.9404−0.1668
Forest0.59230.7778
Shrub and Grassland0.6876−0.3993
Paddy field−0.1993−0.718
Cropland and Other vegetation mosaic0.3136−0.7843
Built-up area−0.9084−0.081

3.3. Result of categorization

Cluster analysis of the two principal components revealed three categories of cities (see Figure 1). The first principal component values for cities in Category 1 (N = 93) are low. Their average degree of land-use mixture is the lowest, and the proportion of built-up area is the highest. Category 2 (N = 347) includes cities that have relatively high degree of land-use mixture and high proportion of forest areas. The cities in Category 3 (N = 351) have relatively high degree of land-use mixture and high proportion of farmland. Each category has different characteristics in the component of mosaic land use and degree of land-use mixture.

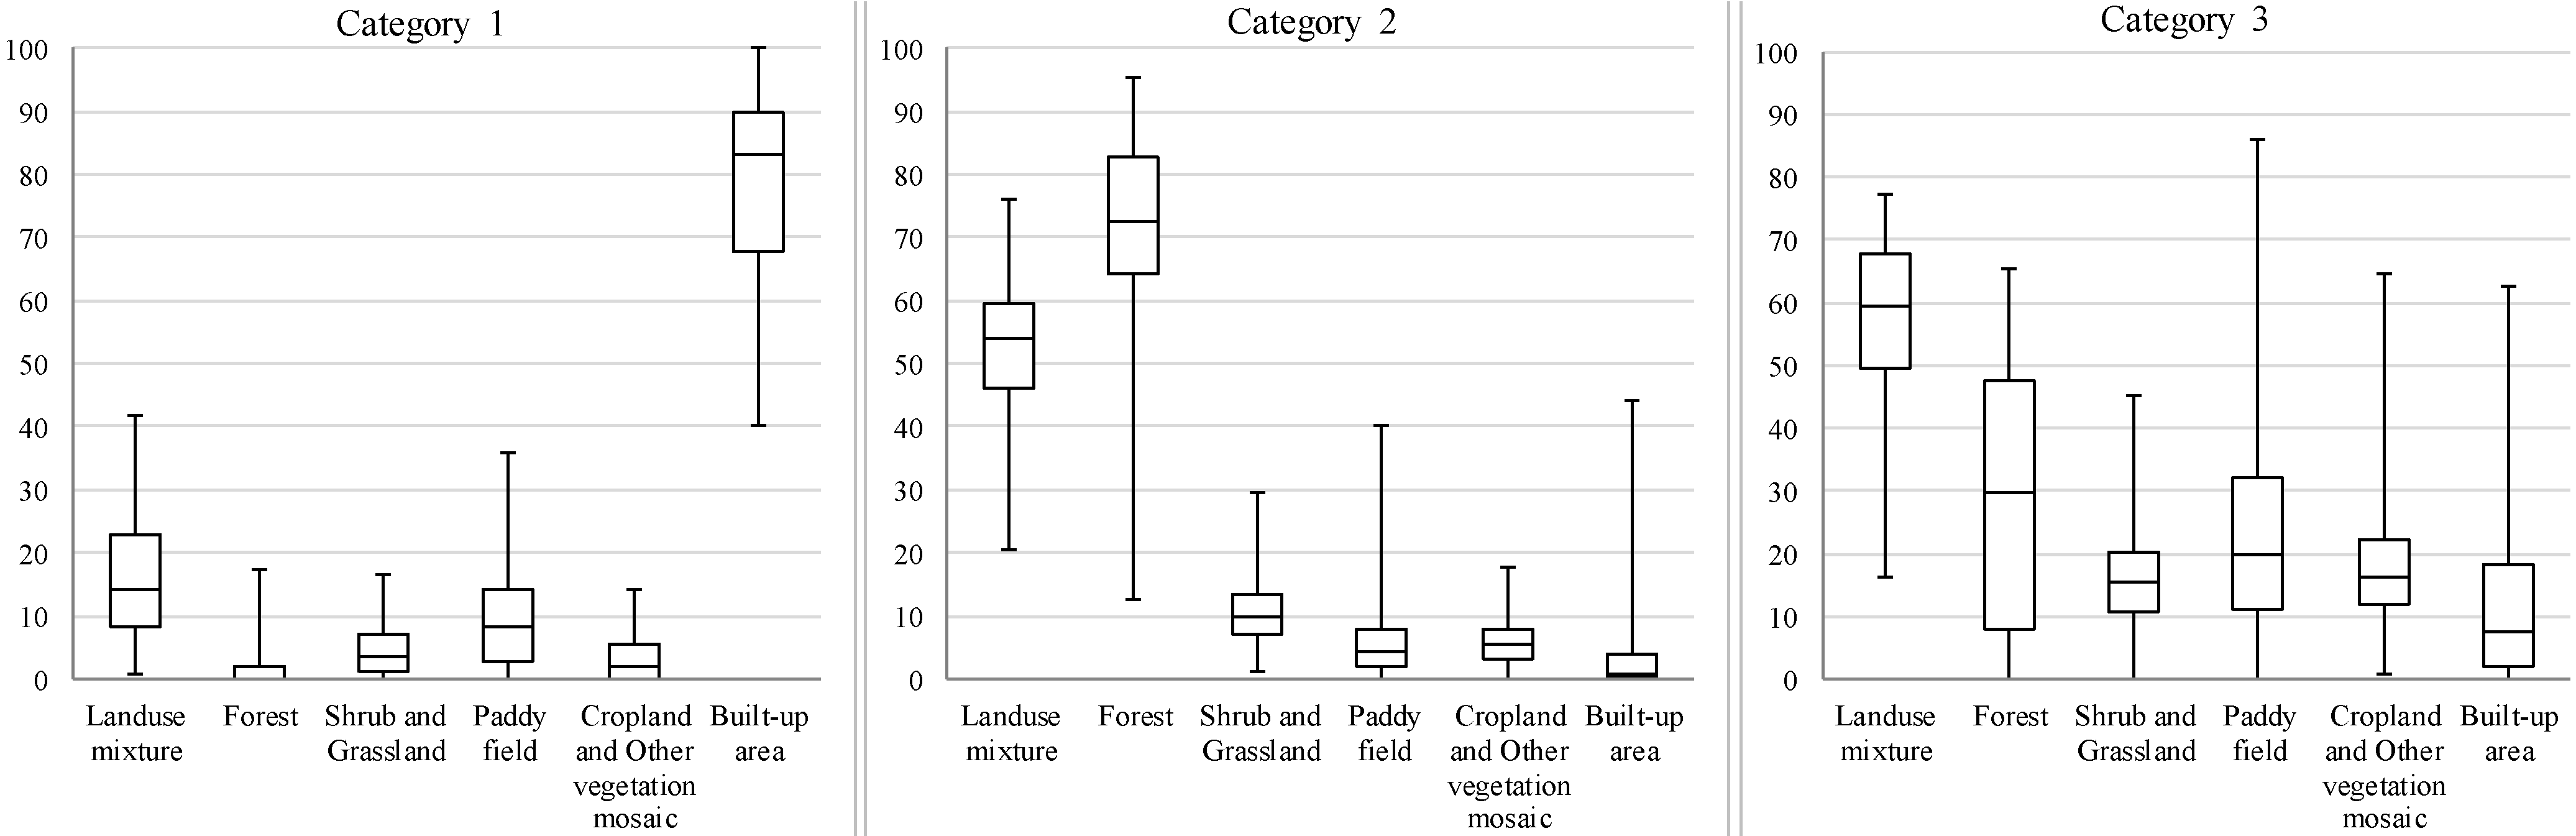
3.4. Characteristics of Each Category

To determine the land-use characteristics of each category, we calculated the averages and standard deviations of the six indicators in each category (see Table 3 and Table 4). The quartiles, and minima and maxima of the indicators are shown in Figure 2. We used the other land-use indicators along with the ones related to native biodiversity indicators to analyze the land-use characteristics that are related to ecosystem characteristics of the cities. In the discussion of the characteristics of each category, averages across all cities in each category were referred to.
Figure 1. Result of categorization of cities.
Sustainability 07 14371 g001
Figure 2. Quartiles and minimums and maximums of the six indicators in each category. Note: Unit: (original values multiplied by 100): Land-use mixture, (%): proportion of forest, shrub and grassland, paddy fields, cropland, and other vegetation mosaic, and built-up area. Horizontal lines in each bar chart show maximum, top 25th percentile, median, bottom 25th percentile, and minimum values.
Sustainability 07 14371 g002
Table 3. Averages of the six indicators in each category.
CategoryNo. of CityLanduse MixtureForestShrub and GrasslandPaddy FieldCropland and Other Vegetation MosaicBuilt-Up Area
-%%%%%
1930.22.14.69.73.579.3
23470.572.310.85.75.94.2
33510.627.916.023.219.112.3
Table 4. Standard deviations of the six indicators in each category.
CategoryNo. of CityLanduse MixtureForestShrub and GrasslandPaddy FieldCropland and Other Vegetation MosaicBuilt-Up Area
1930.102 3.9 4.0 8.1 3.9 13.4
23470.097 13.5 4.9 5.7 3.5 7.9
33510.132 20.4 7.2 16.3 11.2 13.5

3.4.1. Category 1

The proportion of built-up areas was 79%, and that of forest areas was 2%. Large cities that held central administrative units, such as special wards of Tokyo Prefecture and Osaka City, had relatively high proportion of built-up areas, and they were included in Category 1. Although they had high proportion of built-up areas, the proportion of farmland was not considerably different from that of Category 2. However, cities in Category 1 had low proportion of natural land, and the diversity of land-use category was relatively low. Therefore, the degree of land-use mixture was lower than that of the other categories.
We focused on the municipal areas of the cities; if a city is situated in the center of a large metropolitan area consisting of several municipalities, the proportion of built-up areas of the city might be relatively high. The values of the land-use indicators can be changed depending on the definitions of cities. In the future, we intend to identify the impacts of the definitions on the values of the indicators.
In terms of degree of land-use mixture and proportion of natural land, cities in Category 1 might have less biodiversity, and their ecosystem services might be inactive. The conservation of biodiversity in each land-use category in urban areas is important, as well as the conservation and enhancement of biodiversity in the surrounding areas. Reducing the impact on ecosystems from agglomeration of buildings and paved roads and other anthropogenic objects is necessary; cities in Category 1 had high proportion of built-up areas and might strongly depend on ecosystems in their surrounding areas.

3.4.2. Category 2

The proportion of forest areas was 72%, and that of built-up areas was 4%. The proportion of farmlands was relatively low (12%), and that of natural lands excluding forest areas was 11%. The degree of land-use mixture was relatively high, and the land-use mosaic consisted of natural lands rather than farmlands.
Cities in Category 2 might have high biodiversity and abundant ecosystem services. Cities in Category 1 required management of biodiversity within the group and their nearby areas via the cooperation of its surrounding administrative units. However, the main issue of cities in Category 2 was managing their impact on biodiversity within them.

3.4.3. Category 3

The proportion of forest areas in this category was 28%, paddy fields accounted for 23%, and the built-up areas were 12%. In this category, the proportion of farmlands was relatively high; however, the proportion of a specific land-use category was not extremely higher than that in the other categories. These cities had diverse land-use categories, and the average of the degree of land-use mixture was the highest among all the categories.
Cities in Category 3, which have the most diverse land-use, can have higher biodiversity and more abundant ecosystem services than those in Category 1. However, the built-up areas of cities in Category 3 were surrounded by farmland that could expand easily. Therefore, one of the main issues of these cities was the conservation of ecosystems that depended on farmlands. Thus, if a city could not implement adequate management of farmland, they would risk having negative impacts on their ecosystems.

3.4.4. Regional Characteristics of Japan

The regional land-use characteristics of cities in Japan that have wider mountainous areas often include forest lands with low population density. Even Category 3 cities, which have a high proportion of farmland, have relatively high proportion of forest lands (>25%).
Japan is a part of monsoonal Asia; the land is mostly covered with paddy fields and has high population density like other areas in the region. The proportion of paddy fields in Category 1 that has greater built-up areas was higher than that of cities in Category 2 that have high rates of forest lands. This suggests that paddy fields can exist in regions adjacent to built-up and densely populated areas. By considering these regional characteristics, the policy makers, citizens, and business sectors can implement measures to ensure sustainable management of urban biodiversity and ecosystem services in Japan. These characteristics might not be common among cities having different climatic zones.

3.4.5. Basic Environmental Characteristics

Highly dense paddy fields and high proportions of forest lands are the regional characteristics and basic environmental features of Japan. These might not change easily in a short period. However, the proportion of farmland can change to a great extent, and it can be considered a variable environmental characteristic. Understanding the difference among these environmental characteristics is needed to develop adequate management strategies for city biodiversity. Efficient and effective sharing of knowledge and information can be implemented among cities that have the same basic environmental characteristics and similar variable features.

4. Issues and Prospects

Biodiversity of a city is associated with the sustainability of the city; biodiversity in urban areas can contribute to the enhancement of amenities by increasing cultural services and regulating living environment via regulating services. CBI is the indicator for establishing appropriate managements of biodiversity and ecosystem services in each city. The issues of CBI need to be addressed to ensure city sustainability by implementing adequate managements. There are three main technical issues with CBI, which include (1) collection of data for indicators; (2) establishment of spatial territories and definitions of indicators; and (3) elucidation of the different ecological backgrounds of each city.
In this study, we suggested potential solutions to improve city biodiversity by using land-use indicators that are related to native biodiversity indicators in CBI. The land-use indicators are calculated using global data that can be obtained easily. Thus, the first issue related to data collection can be resolved by using remote sensing data. However, indicators to evaluate the quality of biodiversity are required. We categorized cities based on not only proportions of land-use categories but also degrees of land-use mixture, which revealed the qualitative aspects of land use. These indicators can be used to evaluate the qualitative aspects of biodiversity.
Regarding the second issue, we use administrative units for urban areas. It can be expected that each administrative unit for city government management is different in terms of the amount or nature of human activities. When we identify the relationships among human activities and biodiversity, it is necessary to use urban areas detected by the same definition in terms of manpower.
For addressing the third issue, the characteristics of land use that reflect the characteristics of ecosystems in cities need to be identified. Considering the characteristics of ecosystems that are estimated using land-use characteristics, indicators of CBI can be developed and evaluated.
The second and third issues are related to the spatial- and temporal-scale dependence of indicators. Regarding their spatial-scale dependence, geographic information system (GIS) data that were used in this study cannot be used for analyzing smaller districts in cities; GIS data with greater resolution are needed to monitor and evaluate the more micro-scale ecosystems. The share of each land-use category in an administrative area of a city is changing. If time series land-use data would be applied in this analysis, we might found cities that would move to the other categories from categories to which they belonged in the previous time. We did not use time series data in this preliminary analysis. In further research, time series data will be needed to understand temporal trends in land use of cities.
The third part is of particular importance for reviewing cities nationwide. The uniform application of CBI to cities is likely to result in high scores for cities with green areas, regardless of administrative and citizen efforts. Such categorization of cities might enable collaboration and comparison with existing profiles and conditions.

5. Conclusions

The sustainable use of biodiversity and ecosystem services at the urban level is a global issue. We conducted an empirical study to determine the possibility of CBI application at the national level. To our knowledge, this is the first empirical investigation at the national level that includes both rural and urban areas (except Singapore, which is a state). There are issues in application of CBI, including limitation of available dataset. By using the land-use dataset that can be obtained from remote sensing data, we proposed the solution for the issues related to the limitation of the dataset.
Our results suggest that the Japanese cities can be categorized into three major groups. The major biodiversity components were forest, paddy, and cropland. This categorization might serve as a basis for possible collaboration among Japanese cities that have similar challenges and conditions. The collaborations among cities are required to coordinate policies on various spatial scales to enhance biodiversity on a global scale. The categorization that we attempted can be a preliminary step to establish a method to identify the adequate networks of cities in the world for ecosystem services management.
Many cities have expressed concerns regarding the compilation of data or initiation of their own evaluation of native biodiversity or ecosystem services. Furthermore, for many cities, obtaining funds for activities related to biodiversity conservation is difficult. Given the limitations in budgets and human resources, the simplified and cost-effective measures presented in this study might be useful for the development and application of biodiversity indicators in Japan in the future.

Acknowledgments

This study was conducts as a part of the research project, MEXT Gakushin, KAKEN (26360062 Leader Kohsaka, R), the project of Hokuriku Regional Management Service Association (2015) (Leader Kohsaka, R.) and the project funded by the JFE Steel Corporation (2015) (Leader Kohsaka, R.). Part of project was also conducts as a part of the research project, Environment Research and Technology Development Fund (1-1303; Leader Saito, O.). Thanks are extend to O. Saito and S. Hashimoto for the valuable comments.

Author Contributions

Yuta Uchiyama conceived the paper and analyzed the data; Kengo Hayashi reviewed related studies; Ryo Kohsaka reviewed the discussion and analysis of the CBI application and policies. All authors wrote, reviewed and commented on the manuscript. All authors have read and approved the final manuscript.

Conflicts of Interest

The authors declare no conflict of interest.

References

  1. United Nations Population Fund (UNFPA). State of World Population 2009 Facing a Changing World: Women, Population and Climate; UNFPA: New York, NY, USA, 2009. [Google Scholar]
  2. United Nations Department of Economic and Social Affairs (UNDESA). World Urbanization Prospects: The 2014 Revision; United Nations: New York, NY, USA, 2015. [Google Scholar]
  3. Grimm, N.B.; Faeth, S.H.; Golubiewski, N.E.; Redman, C.L.; Wu, J.G.; Bai, X.M.; Briggs, J.M. Global change and the ecology of cities. Science 2008, 319, 756–760. [Google Scholar] [CrossRef] [PubMed]
  4. Puppim de Oliveira, J.A.; Balabana, O.; Dolla, C.N.H.; Moreno-Peñarandaa, R.; Gasparatosa, A.; Iossifovaa, D.; Suwaa, A. Cities and biodiversity: Perspectives and governance challenges for implementing the convention on biological diversity (CBD) at the city level. Biol. Conserv. 2011, 144, 1302–1313. [Google Scholar] [CrossRef]
  5. Wilkinson, C.; Sendstad, M.; Parnell, S.; Schewenius, M. Urban Governance of Biodiversty and Ecosstem Serviecs. In Urbanization, Biodiversity and Ecosystem Services: Challenges and Opportunities; Springer: Dordrecht, The Netherlands, 2013; pp. 539–587. [Google Scholar]
  6. Bai, X. Integrating global environmental concerns into urban management: The scale and readiness arguments. J. Ind. Ecol. 2007, 11, 15–29. [Google Scholar] [CrossRef]
  7. Hardoy, J.; Mitlin, D.; Satterthwaite, D. Environmental Problems in an Urbanizing World; Routledge: London, UK, 2001. [Google Scholar]
  8. Rockström, J.; Stffen, W.L.; Noone, K.; Persson, A.; Chapin, F.S., III; Lambin, E.; Lenton, T.M.; Scheffer, M.; Folke, C.; Schellnhuber, H.J.; et al. Planetary Boundaries: Exploring the Safe Operating Space for Humanity. Available online: http://www.ecologyandsociety.org/vol14/iss2/art32/ (accessed on 25 March 2015).
  9. Secretariat of the Convention on Biological Diversity. Cities and Biodiversity Outlook (CBO), 2012. Available online: https://www.cbd.int/doc/health/cbo-action-policy-en.pdf (accessed on 25 March 2015).
  10. McDonald, R.I.; Marcotullio, P.J.; Güneralp, B. Urbanization and Global Trends in Biodiversity and Ecosystem Services. In Urbanization, Biodiversity and Ecosystem Services: Challenges and Opportunities; Springer: Dordrecht, The Netherlands, 2013; pp. 31–52. [Google Scholar]
  11. Kohsaka, R. Developing biodiversity indicators for cities: Applying the DPSIR model to Nagoya and integrating social and ecological aspects. Ecol. Res. 2010, 25, 925–936. [Google Scholar] [CrossRef]
  12. Millennium Ecosystem Assessment (MA). Ecosystems and Human Wellbeing: Synthesis; Island Press: Washington, DC, USA, 2005. [Google Scholar]
  13. Alfsen-Norodom, C.; Boehme, S.E.; Clemants, S.; Corry, M.; Imbruce, V.; Lane, B.D.; Miller, R.B.; Padoch, C.; Panero, M.; Peters, C.M.; et al. Managing the megacity for global sustainability: The New York Metropolitan Region as an urban biosphere reserve. Ann. N.Y. Acad. Sci. 2004, 1023, 125–141. [Google Scholar] [PubMed]
  14. Folke, C.; Jansson, A.; Larsson, J.; Costanza, R. Ecosystem appropriation by cities. Ambio 1997, 26, 167–172. [Google Scholar]
  15. Jansson, Å. Reaching for a sustainable, resilient urban future using the lens of ecosystem services. Ecol. Econ. 2013, 86, 285–291. [Google Scholar] [CrossRef]
  16. Güneralp, B.; Seto, K.C.; Ramachandran, M. Evidence of urban land teleconnections and impacts on hinterlands. Curr. Opin. Environ. Sustain. 2013, 5, 445–451. [Google Scholar] [CrossRef]
  17. Gómez-Baggethun, E.; Barton, D.N. Classifying and valuing ecosystem services for urban planning. Ecol. Econ. 2013, 86, 235–245. [Google Scholar] [CrossRef]
  18. McKinney, M.L. Effects of urbanization on species richness: A review of plants and animals. Urban Ecosyst. 2008, 11, 161–176. [Google Scholar] [CrossRef]
  19. Muller, N.; Werner, P.; Kelcey, J.G. Urban Biodiversity and Design; Wiley-Blackwell: Chichester, UK, 2010. [Google Scholar]
  20. Güneralp, B.; Seto, K.C. Sub-regional Assessment of China: Urbanization in Biodiversity Hotspots. In Urbanization, Biodiversity and Ecosystem Services: Challenges and Opportunities; Springer: Dordrecht, The Netherlands, 2013; pp. 57–63. [Google Scholar]
  21. McDonald, R.I.; Formanb, R.T.T.; Kareivac, P.; Neugartena, R.; Salzerd, D.; Fishera, J. Urban effects, distance, and protected areas in an urbanizing world. Landsc. Urban Plan. 2009, 93, 63–75. [Google Scholar] [CrossRef]
  22. Güneralp, B.; Seto, K.C. Futures of global urban expansion: Uncertainties and implications for biodiversity conservation. Environ. Res. Lett. 2013. [Google Scholar] [CrossRef]
  23. Snep, R.; van Ierland, E.; Opdam, P. Enhancing biodiversity at business sites: What are the options, and which of these do stakeholders prefer? Landsc. Urban Plan. 2009, 91, 26–35. [Google Scholar] [CrossRef]
  24. Bolund, P.; Hunhammar, S. Ecosystem services in urban areas. Ecol. Econ. 1999, 29, 293–301. [Google Scholar] [CrossRef]
  25. Elkington, J. Cannibals with Forks: The Triple Bottom Line of 21st Century Business; Capstone Publishers: Oxford, UK, 1997. [Google Scholar]
  26. Kohsaka, R.; Pereira, H.; Elmqvist, T.; Chan, L.; Moreno-Peñaranda, R.; Morimoto, Y.; Inoue, T.; Iwata, M.; Nishi, M.; da Luz-Mathias, M.; et al. Indicators for Management of Urban Biodiversity and Ecosystem Services: City Biodiversity Index. In Urbanization, Biodiversity and Ecosystem Services: Challenges and Opportunities: A Global Assessment; Springer: Dordrecht, The Netherlands, 2013; pp. 699–718. [Google Scholar]
  27. Keating, M. The Earth Summit’s Agenda for Change: A Plain Language Version of Agenda and Three Other Rio Agreements; Center for Our Common Future: Geneva, Switzerland, 1993. [Google Scholar]
  28. Li, F.; Liu, X.S.; Hu, D.; Wang, R.S.; Yang, W.R.; Li, D.; Zhao, D. Measurement indicators and an evaluation approach for assessing urban sustainable development: A case study for China’s Jining City. Landsc. Urban Plan. 2009, 90, 134–142. [Google Scholar] [CrossRef]
  29. Kohsaka, R.; Okumura, S. Greening the Cities with Biodiversity Indicators: Experience and Challenges from Japanese Cities with CBI. In Integrative Observations and Assessments, Ecological Research Monographs; Nakano, S., Yahara, T., Nakashizuka, T., Eds.; Springer: Tokyo, Japan, 2014; pp. 409–424. [Google Scholar]
  30. Butchard, S.H.M.; Walpole, M.; Collen, B.; van Strien, A.; Scharlemann, J.P.W.; Almond, R.E.A.; Baillie, J.E.M.; Bomhard, B.; Brown, C.; Bruno, J.; et al. Global biodiversity: Indicators of recent declines. Science 2010, 328, 1164–1168. [Google Scholar]
  31. Walker, B.; Meyers, J.A. Thresholds in Ecological and Social-Ecological Systems: A Developing Database. Available online: http://www.ecologyandsociety.org/vol9/iss2/art3/ (accessed on 25 March 2015).
  32. Niemelä, J. Ecology of urban green spaces: The way forward in answering major research questions. Landsc. Urban Plan. 2014, 125, 298–303. [Google Scholar] [CrossRef]
  33. Larondelle, N.; Haase, D. Urban ecosystem services assessment along a rural-urban gradient: A cross-analysis of European cities. Ecol. Indic. 2013, 29, 179–190. [Google Scholar] [CrossRef]
  34. Nowak, D.J.; Crane, D.E.; Stevens, J.C. Air pollution removal by urban trees and shrubs in the United States. Urban For. Urban Green. 2006, 4, 115–123. [Google Scholar] [CrossRef]
  35. Millward, A.A.; Sabir, S. Benefits of a forested urban park: What is the value of Allan Gardens to the city of Toronto, Canada? Landsc. Urban Plan. 2011, 100, 177–188. [Google Scholar] [CrossRef]
  36. Manes, F.; Incerti, G.; Salvatori, E.; Vitale, M.; Ricotta, C.; Costanza, R. Urban ecosystem services: tree diversity and stability of tropospheric ozone removal. Ecol. Appl. 2012, 22, 349–360. [Google Scholar] [CrossRef] [PubMed]
  37. Hou, Y.; Zhou, S.; Burkhard, B.; Müller, F. Socioeconomic influences on biodiversity, ecosystem services and human well-being: A quantitative application of the DPSIR model in Jiangsu, China. Sci. Total Environ. 2014, 490, 1012–1028. [Google Scholar] [CrossRef] [PubMed]
  38. Mori, K.; Christodoulou, A. Review of sustainability indices and indicators: Towards a new City Sustainability Index (CSI). Environ. Impact Assess. Rev. 2012, 32, 94–106. [Google Scholar] [CrossRef]
  39. Secretariat of the Convention on Biological Diversity (SCBD). User’s Manual for the City Biodiversity Index (CBI), SCBD, 2012. Available online: https://www.cbd.int/subnational/partners-and-initiatives/city-biodiversity-index (accessed on 25 March 2015).
  40. Kadoya, T.; Washitani, I. The Satoyama Index: A biodiversity indicator for agricultural landscapes. Agric. Ecosyst. Environ. 2011, 140, 20–26. [Google Scholar] [CrossRef]
  41. Population and Number of Household Based on the Basic Resident Registration; Ministry of Internal Affairs and Communications: Tokyo, Japan, 2014. (In Japanese)
  42. Tateishi, R.; Hoan, N.T.; Kobayashi, T.; Alsaaideh, B.; Tana, G.; Phong, D.X. Production of global land cover data––GLCNMO2008. J. Geogr. Geol. 2014, 6, 99–122. [Google Scholar] [CrossRef]

