1. Introduction
An urban environment can be understood as a system that covers many different spatial interests. In order to cover them all, there are numerous, more or less successful, spatial arrangements which are interconnected. All integral parts of the system are intertwined, and have a systemic character. Links between urban structure elements freely change and evolve in a way to meet social needs and social demands.
Environmental subjugation necessary for modern living patterns is the reason for studying public space development possibilities. Public place design is important because of aesthetic appearance, personal safety, the safety of property, and traffic safety. Good environmental design represents satisfaction of socio-psychological needs and improves living and working conditions.
A starting point of the research is the awareness that a city is not a constant form. Urban development is guided by social progress and technological capabilities. The question is which development direction should be taken? Which one would ensure good living conditions to all (humans, animals, plants) and correspond to lifestyles which contribute spatial recognition and spatial identity? Which one would be sustainable?
“Sustainable development meets the needs of the present without compromising the ability of future generations to meet their own needs” [
1] (p. 43). From 1987 on, this is one of the most widely-recognized development definitions. Sustainability ties together concern for the capacity of natural systems with the social and economic challenges faced by humanity. “A major pillar of the sustainable development concept is the dynamic and interdependent view on human development and nature conservation, referring to the necessity of conciliating conflicting needs between the word of nature and the human word” [
2]. Since then much research has addressed concerns over the impacts of expanding human development on the planet.
Sustainability is a process that impacts development of all aspects of human life [
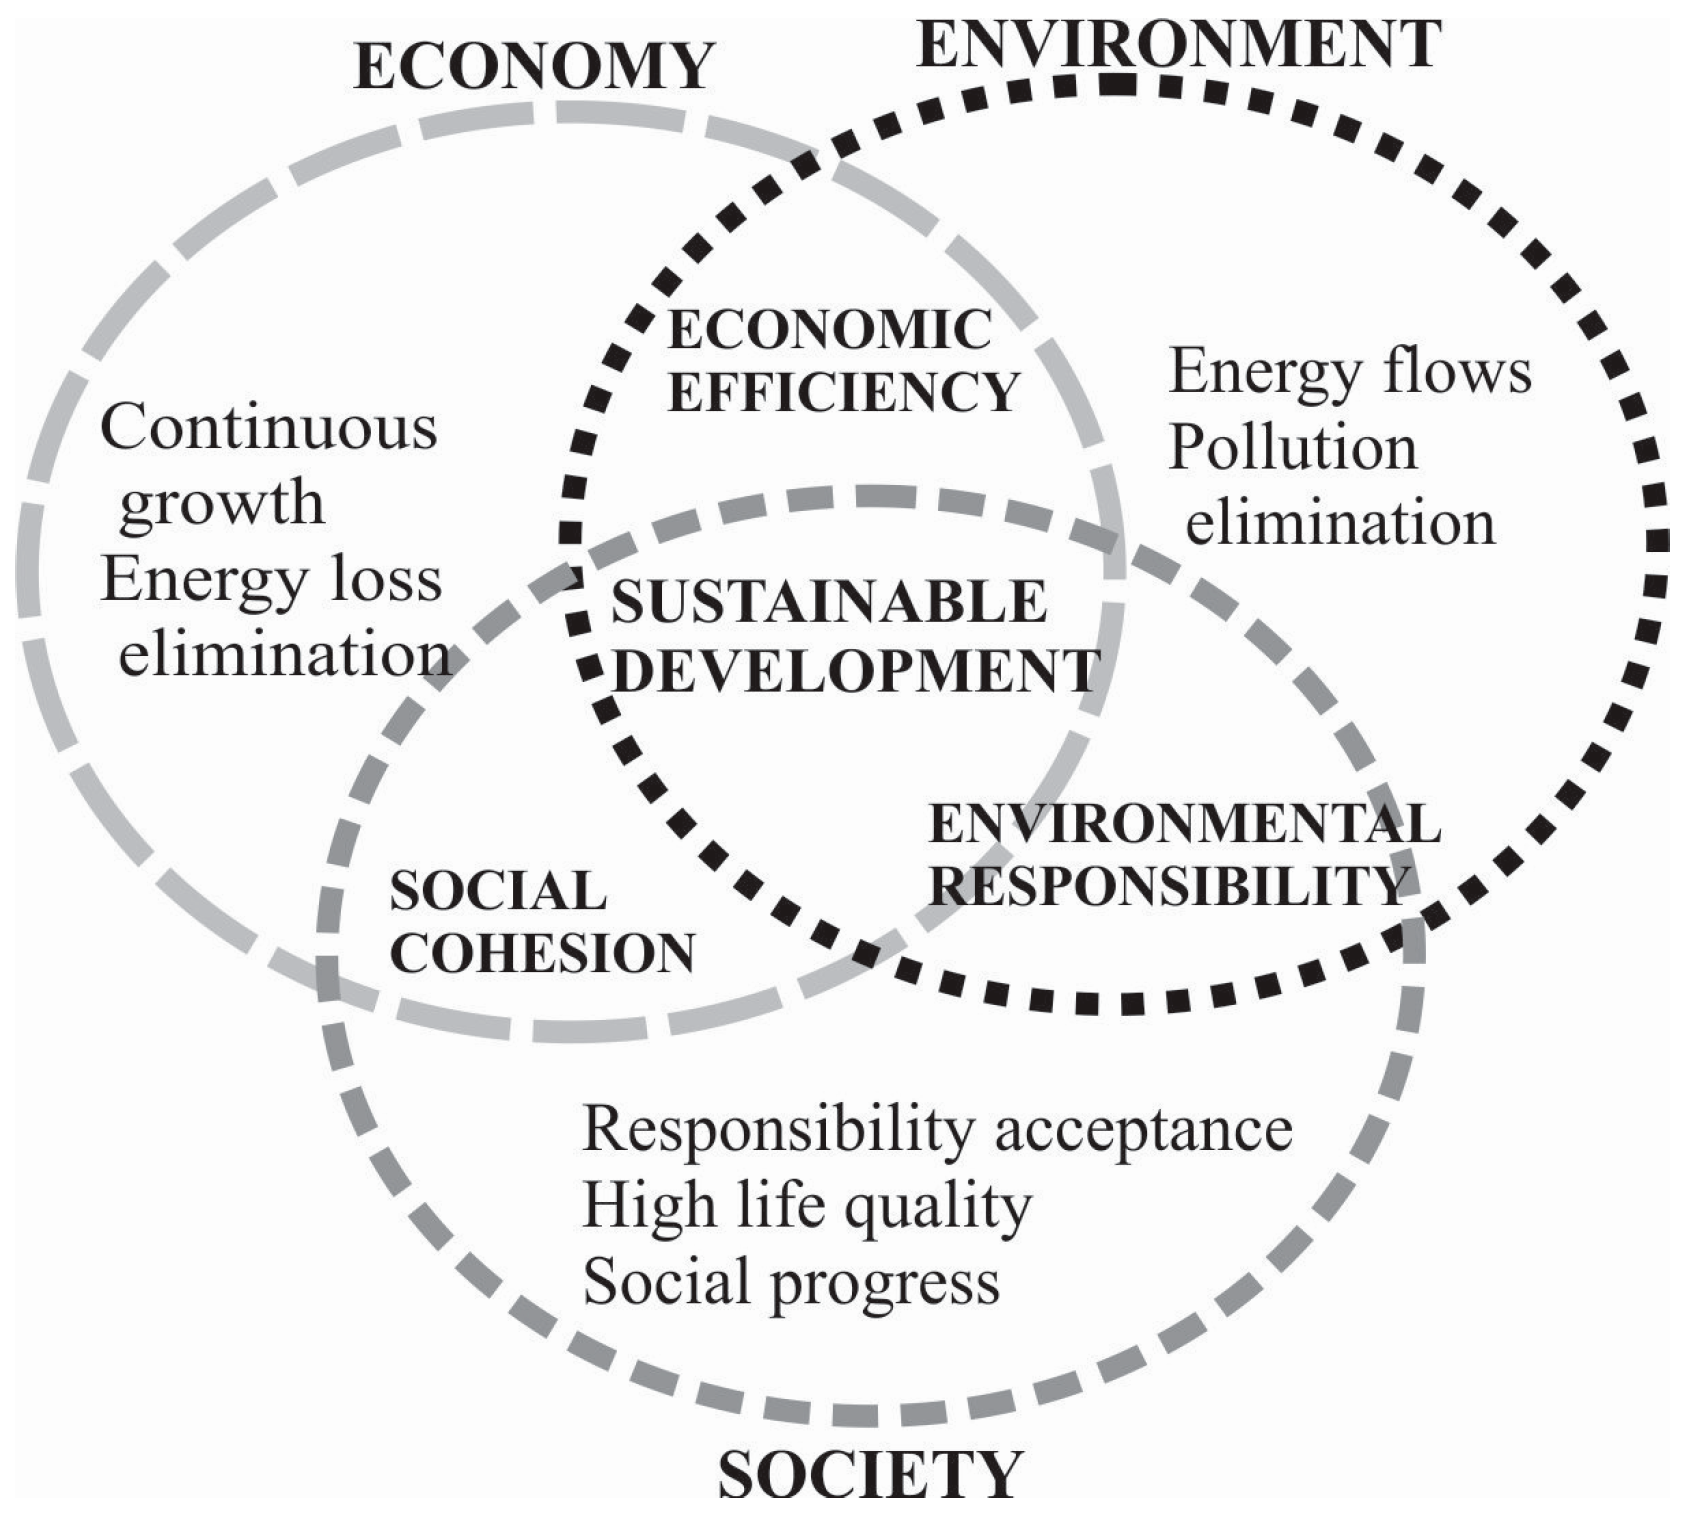
3]. It means resolving the conflict between the various competing goals, and involves the simultaneous pursuit of economic efficiency, environmental responsibility, and social cohesion The concept of sustainable development is most often composed of three constituent domains, such as environment, economy, and society—also known as the three-domain model of the triple bottom line (
Figure 1).
Figure 1.
Input issues and baseline model of sustainable development.
Figure 1.
Input issues and baseline model of sustainable development.
Sustainable development is also a term of multiple meanings dependent on the content and scope to which it relates. After the implementation of Agenda 21 [
4], the principle of sustainable development has become a guide in the transition-oriented development of humanity, which includes all economic and social activities, and it is useful in the management of all natural ecosystems. Sustainability, on the other hand, also constitutes a way of using natural systems which, in the long term, does not change the essential characteristics of the system and does not reduce its capacity for natural regeneration.
Sustainability is still defined on the basis of what we know at any given time. Preserving the environment also requires conservation of created management practices. Conservation, by definition, implies maintaining whatever we know that exists or has existed. However, the future is unknown. Conservation for which we decide today will materialize in the future. Sustainability and development seem to be contradicting terms. This does not diminish the importance of efforts in minimizing the negative effects of urbanization in a rapidly developing world declared Yigitcanlar
et al. [
5].
Sustainable development, as a concept of controlled development, is realistic. Developmental questions are directed to study the possibility of achieving a degree of spatial development that enables the conservation status to be compatible with human activities. Therefore, our spatial interventions are more or less controlled and planned. They can be judged by several criteria which have very different degrees of importance: global, social, and individual. Such criteria are not mutually comparable; their importance is affected by the enforcing ability when making decisions. For future development actions, a variety of possible designs can be prepared. The most appropriate and realistic development variety can be selected. “What is acceptable cannot be judged by absolute criteria. It can only be defined as the most acceptable solution we know” declared Marušič [
6]. “Sustainability appears more dynamically comprehensive and open to continuous environmental and human changes compared to a static preservation vision, only focused on the protection of the physical environment” [
2]. Sustainable development is like “a journey into unknown space”; you do not know where you are going: induction of a temporal component is, therefore, very important.
Sustainable urban development does not mean the sustainable development of any single economic, social, or environmental subsystem; it attempts to balance economic growth, ecological contribution, environmental protection, and social progress [
7]. Cities are among the most important entities to be controlled for achieving a sustainable future of human well-being [
8]. Sustainable urban development has to be seen as an integral of broader goals, like achieving global development, inter-generation equality, social justice, and geographical equality [
9,
10].
A sustainable city is defined as one that maximizes socio-economic benefits while meeting constraint conditions of the environment and socio-economic equity on a permanent basis [
8]. It is designed with consideration of the environmental impact inhabited by people [
11]. Register [
11] first coined the term “sustainable city” in 1987 in his book
Ecocity Berkeley: Building Cities for a Healthy Future. Since then, various conducted research was dedicated to the minimization of required inputs of energy, water and food, and waste output of heat, air pollution—CO
2, methane, and water pollution.
Today there are various definitions of what a sustainable city should be and what components should be included. Generally, experts agree that development should meet the needs of the present without sacrificing the ability of future generations to meet their own needs [
7,
8,
12]. Ideally, a sustainable city creates an enduring way of life across the four domains of ecology, economics, politics, and culture [
13]. However, prosperity is also accompanied by an expansion of urban inequality [
14]. The latest research shows that striking a balance among environmental, economic, and social needs is critical to securing sustainable human well-being [
8,
15]. For this reason, there is a need for a new and reliable system for assessing city sustainability that is capable of providing relevant and requisite information for policy making [
15], leading to sustainable urban development.
In response to such demands, we developed a new starting point based on individual environmental perception. The question is how people (different stakeholders) see, perceive, and experience their environment in everyday life. Technical criteria can be measured, but the citizen perception cannot be measured in the same way. A method of assessing the level of convergence between different stakeholders, especially between planners and users, can be helpful in building a consensus. Some such methods have been already developed by, Maiello
et al. [
16] and Mori
et al. [
8,
15], for example.
According to Williams [
17], achieving sustainable urban development is often characterized as being split, not only between society, economy, and environment, but also on “technical” and “social” grounds. Research, practice, and expertise tend to coalesce around either the scientific and technological advances that need to be made or around social change, largely couched in terms of behavior, economic, or governance shifts. The key to successful urban space development is allocation of resources forwarded through different branches of decision-makers. Compactness of the built environment is a widely-acceptable strategy through which more sustainable urban forms might be achieved [
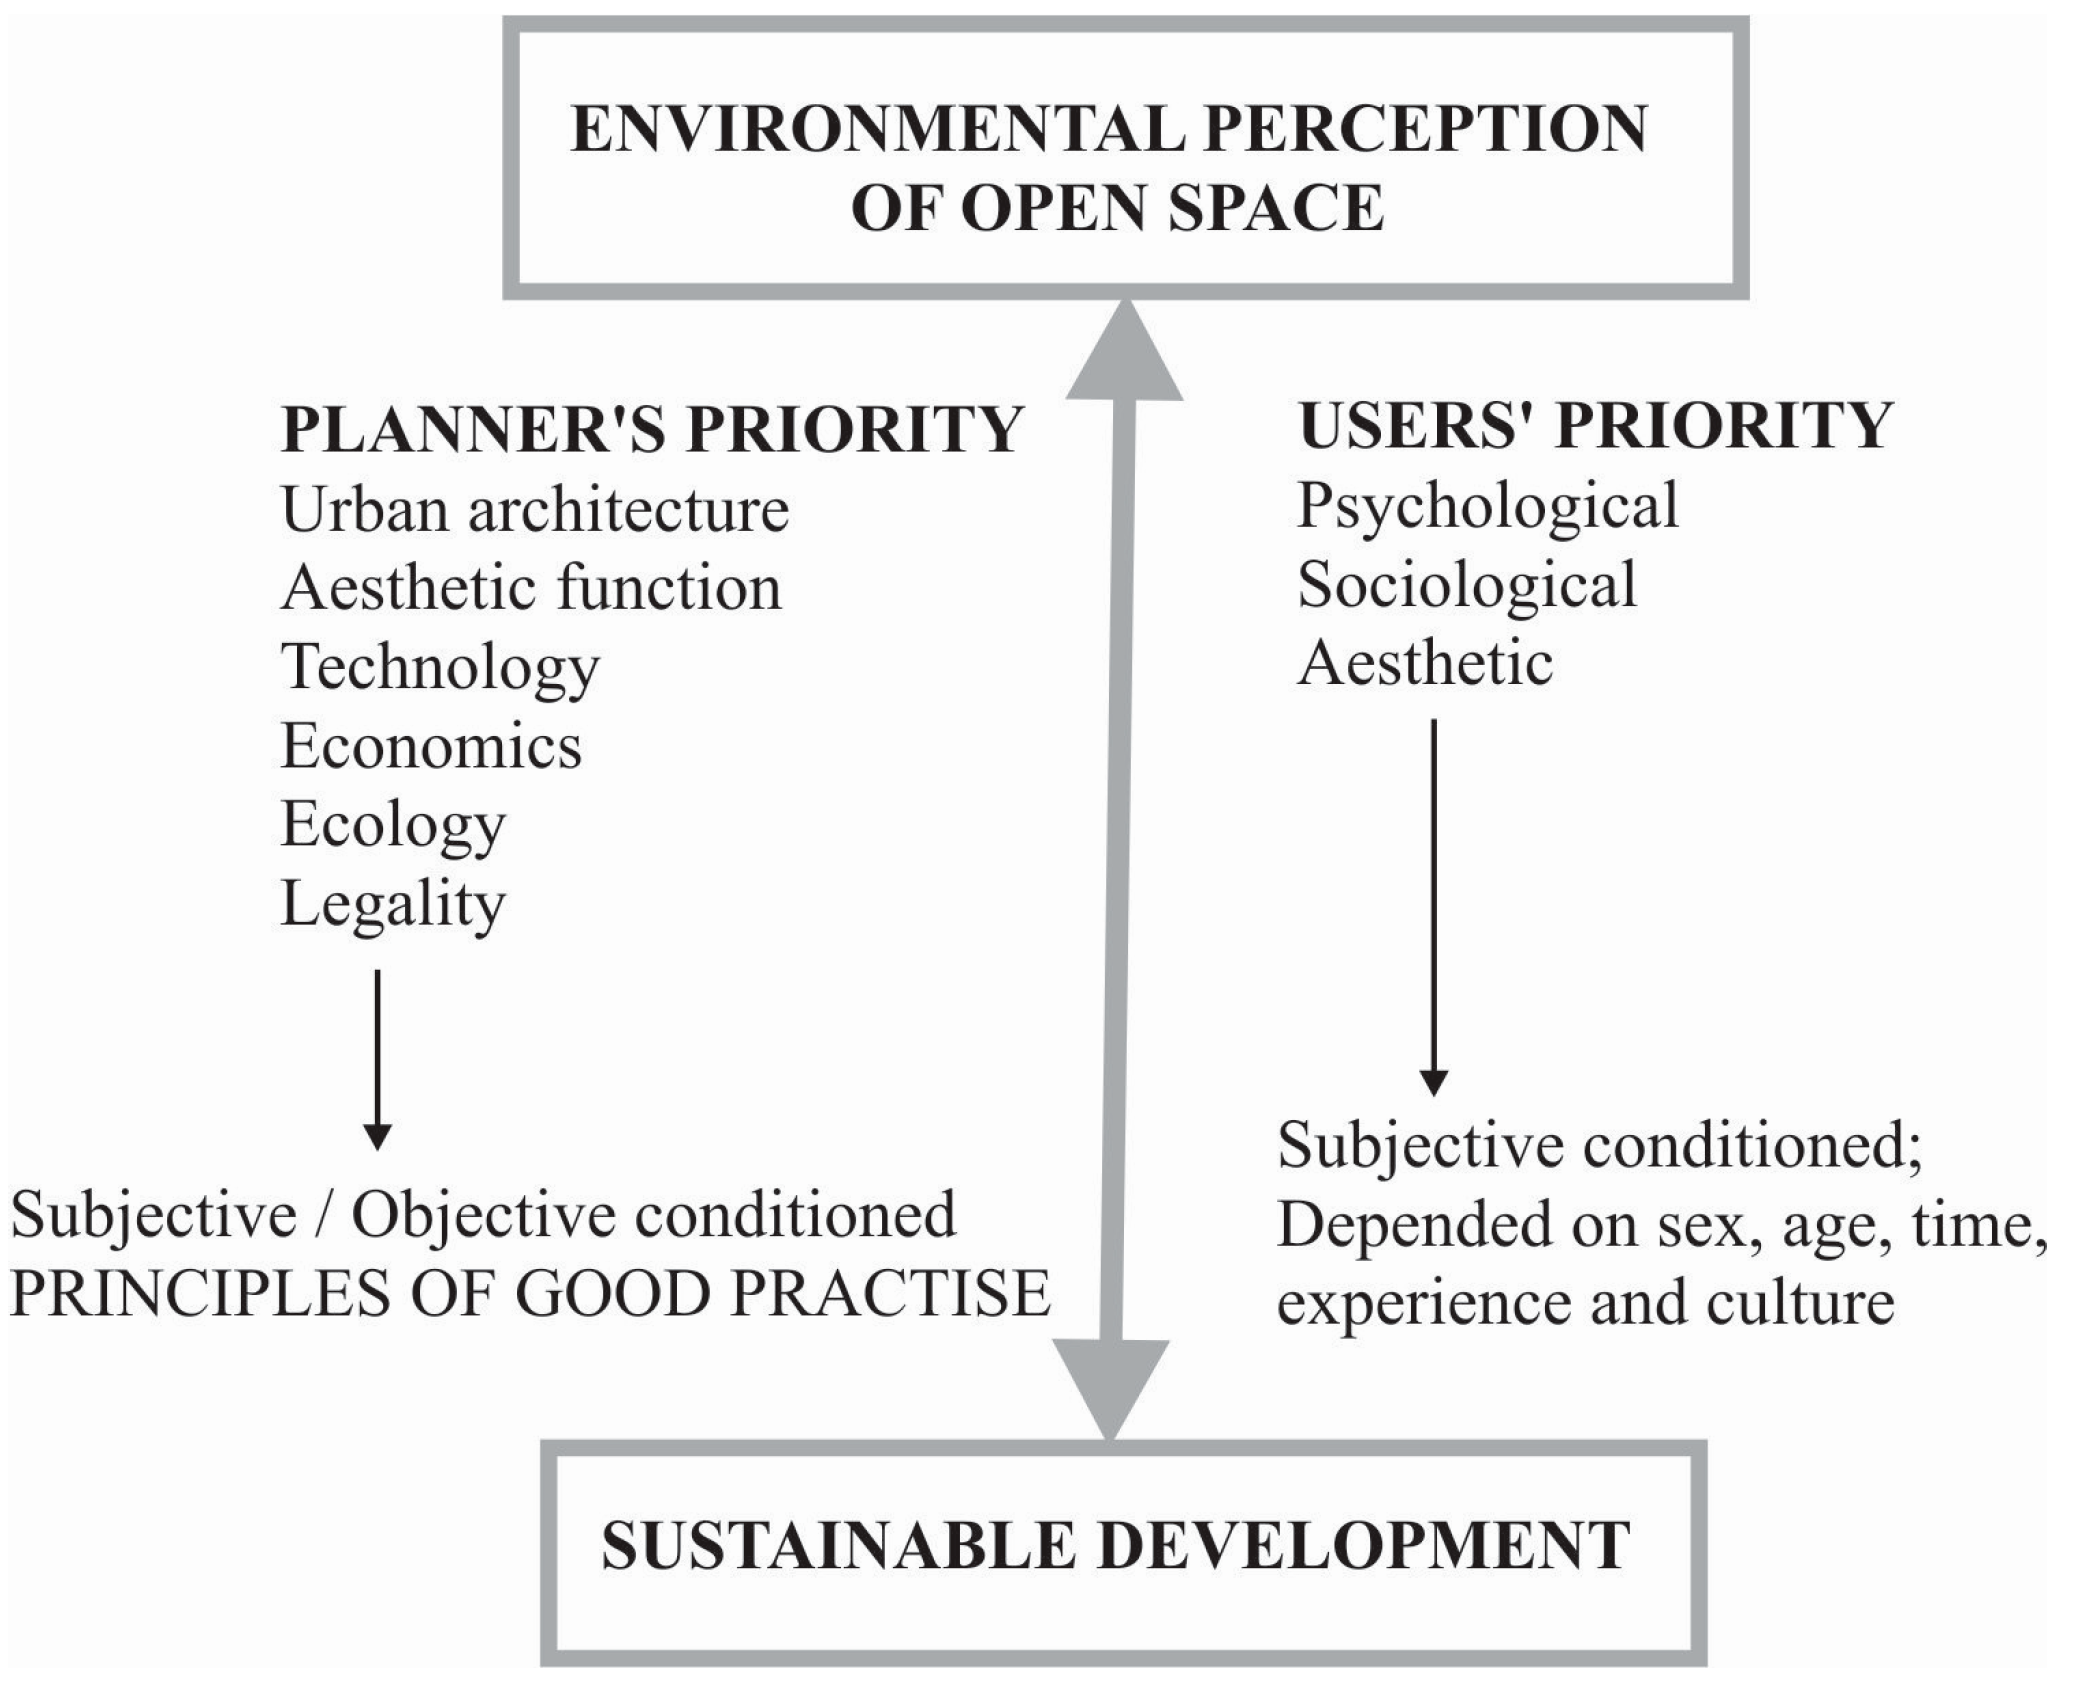
18]. To achieve interaction between urban space and its users, it is necessary to understand how users perceive their environment. This paper focuses on perceptual differences between two interest groups: planners (decision-makers) and users (inhabitants, visitors, actors). Planners experience the environment differently than other social groups, but their decisions about resource allocation have a great impact. This level has often been defined as the objective because it involves physically hard measures or expert judgments [
19]. Planners operate in accordance with the principles of good practice. Their priorities are aesthetically functional, technological, economic, legal, and environmental (
Figure 2). On the other hand, users’ environmental perceptions are always subjective because they rely on individual responses [
19]. Their observations offer a soft measure of environmental quality [
19] that is dependent upon the individual’s sex, age, time, experience, and culture. Their priorities are psychologically-, sociologically-, and aesthetically-conditioned.
Figure 2.
Schematic diagram of the planner-user relationship.
Figure 2.
Schematic diagram of the planner-user relationship.
The concept of quality is an old one, but it has a useful meaning in modern times. Five major approaches to the definitions of quality can be identified: the transcendent approach of philosophy; the product-based approach of economics; the user-based approach of economics; the manufacturing-based approach of operations management; and value-based approach of operations management [
20]. When we concentrate on the user, quality is understood as “superiority of something” or “fitness for use” [
21]: “It consists of the capacity to satisfy wants” [
22]. A quality item has the ability to perform satisfactorily in service and is suitable for its intended purpose. All user-based definitions start from a premise that quality lies in the eye of the beholder [
20]. This means that quality derives from personal needs and product perception. Durability is regarded as an important element. Long-life of products is generally preferred [
20]. Support personnel for quality control may measure the degree that products are reliable, maintainable, or sustainable.
Although the term quality was initially connected to a product, today we use it in other fields; in our case, as open space quality, environmental quality or even residential environment quality. There are various theories of how to judge it. Bonaiuto
et al. [
23,
24,
25] developed an instrument including both hard and soft measures to judge residential environment quality. The instrument consists of eleven scales measuring perceived residential environment quality indicators and one scale measuring neighborhood attachment. Scales are included in four generative criteria, such as spatial, human, functional and contextual aspects [
23,
25]. All scales are well suited for use in research designs focusing on multiple measures of environmental quality of residential places [
19]. After implementing an instrumental questionnaire in eleven Italian cities [
23], Fornara
et al. [
19] presented a shortened version, which allows easier use in both scientific and policy work. Fornara
et al. [
19] also warns that just one scale is concerned with the subjective side of urban quality assessment. This instrument does not offer a proper balance of subjective and objective measures [
19].
When talking about open space, sustainability and quality seemed to be interconnected. Sustainability is primarily derived from ecology, as a capacity to endure. It is how biological systems remain diverse and productive indefinitely. It is based on the “three pillars of sustainability, in which both economy and society are constrained by environmental limits” [
26] (pp. 36–37). Quality on the other hand is derived from the users’ satisfaction with the product or service. “The ISO 9000 family of quality management systems standards is designed to help organizations ensure that they meet the needs of customers and other stakeholders while meeting statutory and regulatory requirements related to a product” [
27]. Users’ satisfaction in open spaces could be incorporated in this context, as well. In the present time we are very conscious of environmental protection. If the product or service does not lead to negative consequences for the environment, it is an ecological aspect of quality. ISO 14000 is a family of standards related to environmental management that exists to help organizations minimize how their operations negatively affect the environment.
It can be summarized that environmental care is a meeting point between sustainability and quality. The main aim of this scientific contribution is to prove that a holistic approach is necessary when dealing with open space. Sustainability principles deal with space in three aspects: environment, economy, and society. In contrast, quality principles stress one aspect: satisfaction of society, which is perceptual and its subjective attributes may be understood differently by different people.
The article focuses on the spatial aspect of urban environment. In this context of spatial development, sustainability principles are superior. Quality principles must be included within the society aspect, which must also reflect a concern for the users’ well-being.
Users play an important role in sustainable spatial development. It is essential to know how they sense urban space because their environmental perception reflects their priorities and, consequently, their use of open space. We would like to prove that sustainable development of the city should be primarily based on the user’s spatial perception and spatial needs in order to provide for their well-being. Everything else (architecture, aesthetics, technology, economy, legality, etc.) is subordinate to this fact.
Table 1.
Factors and criteria of primary and secondary spatial priorities.
Table 1.
Factors and criteria of primary and secondary spatial priorities.
| Factor | Criteria |
|---|
| PRIMARY-User Priorities |
| Psychological | |
|
|
|
| Sociological | |
| Aesthetic | |
| SECONDARY-Planner Priorities |
| Urban architecture | |
| Aesthetic function | |
| Technology | |
| Economics | |
| Legality | |
| Ecology | |
Focusing on spatial priorities, sustainability of urban space could be evaluated through factors and associated criteria listed in
Table 1. Factors are divided into two groups. Primary factors, named
user priorities, are: psychological, sociological, and aesthetic. Secondary factors, named
planner priorities, are: urban architecture, aesthetic function, technology, economics, legality, and ecology.
Urban structure, who allows us various activities, combined with good visual arrangements is a precondition for successful environmental perception. Consequently, successful environmental perception is essential for sustainable urban development. However, how can we find out what is sensed to be positive or negative around us? How to follow up on and measure a sustainable existence? Has the visual arrangement of the urban environment improved or is it getting worse in the course of time? An appropriate spatial evaluation should be undertaken; uniform units of measure are needed.
There is a tendency to answer all those questions using the following hypothesis: By using the top–down approach principle and deductive or inductive conclusions, it is possible to create a holistic assessment model to assess the sustainability of urban environment visual arrangements and to carry out comparative environmental analyses within different time sequences. Such an assessment model represents the base evaluation unit.
A sustainable city can be achieved by balancing the conservation of positive aspects and improvement of negative visual effects. Therefore, this article presents a theoretical tool, a new developed model, to evaluate visual quality and visual potential of a specific location. Such comprehensive space evaluation is completely new, and cannot be traced anywhere in the existing literature. Modeling is useful for the assessment of the environmental situation and can provide information to be used to create a sustainable development plan. The basis of sustainability represents evaluation results obtained by the model application. Such an approach could help in solving current societal challenges: how to achieve sustainable development to assure individual well-being and increase visual perception of the environment, as well as how to adapt an urban development strategy to the three pillars: society, economy, and environment.
2. Environmental Perception of a City
Environmental perception is important for spatial development. It has an impact on individual impressions, ability of environment identification, orientation ability, sense of safety, and ability to recognize spatial order or spatial segmentation. According to Canter [
28] (p. 158) space concept is based on individual experience and designated by the composite conceptual system. We are informed about a place through “what behavior is associated with, or is anticipated to be housed in it, what physical parameters of the settings are, and the description, or conceptions, which people hold of their behavior in that physical environment” [
28] (p. 159). A place is set with a specific physical location, symbolic meanings, and activities taking place in it. It is humans’ cognitive experience of the material world and offers a concrete visual metaphor. Space defines a cognitive image of a specific location, like any human performance that includes physical and mental links between an observed location and its surrounding [
28] (pp. 22–26).
Visual perception dominates over other perception modes such as: hearing, smell, taste, and type. Eyesight provides the largest amount of information to explain what happens around us. We are supplied with a lot of information, e.g., distance, colors, shapes, textures, and contrasts. Vision gives us two thirds of all environmental information [
29]. Sometimes the environment provides us with more information than we can accept. We select only those messages that are important and useful for us, but we accept only as much as we can process [
30] (p. 22). The authors of [
31] consider that every approach that reveals the image of an environment in people’s minds in all its variety, contributes to our knowledge of human-environment interactions. Problems occur when our visual system is overwhelmed by the amount of input. Too less or too much information in one particular place feels uncomfortable, and reaction to a specific situation can be wrong. Good communication between the environment and user is a prerequisite to well-being. However, a city changes all the time and appears quite different during particular time sequences, like during the day or seasons. It is difficult to adapt to it.
Lynch [
32] and Cullen [
33] conclude that a city structure as a sequence of images helps us to adapt in a way that has a positive impact on perception and spatial orientation. According to Lynch [
32], a concept of urban landscape is not only a material reality, but is a mental structure that results from subjective perception. He divides urban space into individual components: points, lines, surfaces, and volumes [
34]. The hierarchy, size, and visual recognition are important. Lynch [
34] noticed five key elements of high recognition value that makes reading spatial order possible. These are paths, edges, districts, nodes, and landmarks. Paths are linear elements along which the observers move. They are dominant elements in space perception. Edges are linear elements that appear as a dividing line between two areas. Districts are closed spatial units, as well as areas of concentration or dispersion. Nodes are strategic spots allowing entrance from all possible directions. Landmarks are more or less exposed unique objects in the area.
When we observe our surroundings, we see both shape and color. Shape belongs to the object and it is objective, independent of the viewing angle. Color is determined by the length of light wave emitted by the object. It is not an absolute object property; it occurs only in the user’s head. Both shape and color are perceived by the light. Both sunlight and artificial light are important perception factors. A boundary between light and dark is the most powerful contrast which defines relations between buildings and open space. Light increases the visual value of the city. Well-lit surfaces have greater recognition potential and allow for recognizing spatial order and structural connections possible; thus strengthening spatial identity. Both sunlight and artificial light are effective. Thoughtful consideration of Lynch’s components is quite important for users. It increases mental city awareness, increases recognition of structural connections, and strengthens spatial identity. Visual appreciation of the environment improves, and along with orientation ability.
Material and the texture of surfaces are also important for environmental perception. Dark surfaces absorb much more light than light colored surfaces; smooth surfaces reflect more than structured. Straight, flat surfaces do not cast shadows, while strongly structured surfaces do. Interplay of light and shadow creates visually appealing components and is desirable, but too excessive a contrast is felt to be unsuitable [
35]. According to Veitch [
36] the most acceptable structures are vertical, constantly illuminated smooth surfaces. Color contrasts are accepted as interesting, as well as spot lighting. Colorful elements catch the attention and are categorized as more noticeable.
Quality lighted environments have larger visual potential; they can be more attractive and, therefore, frequently used. Illuminations are important aesthetically-designed elements within urban structures [
37]. However, not only is visual effect important; feeling safe is a priority for users. Pinter and Farington [
38] report that lighting optimization increases the feeling of safety and decreases criminal activities by 15%, but how much light do we need to achieve a positive effect of good visibility and to recognize danger from far away? Additional light (between zero and 10 lux) increases our safety perception, as reported Boyce
et al. [
39]. According to their opinion, an acceptable illumination is 30 lux and over. Boyce
et al. [
39] concluded, if illumination is over 50 lux, additional light makes no sense.
Urban spaces are not defined just by giving a sense of visibility to the buildings. Public life is a precondition for the development of open space [
40]. “Just as it is possible through choice of materials and colors to create a certain palette in a city, it is equally possible through planning decisions to influence patterns of activities, to create better or worse conditions for outdoor events, and to create lively or lifeless cities” reported Gehl [
41] (p. 33). In particular, individuals perform different roles such as working, leisure, tourism,
etc. Their attitude towards space varies depending on the current role in which they identify themselves. Consequently, not only the formal network of public spaces is important, but also a network of contacts, connections, and activities. In Brisbane, a study by Mostafiz Shatu
et al. [
42] reported that availability of opportunity and services located within the transit-oriented development reduces car use by 5% and increases the use of active transport by 4%. It could be concluded that the way of moving influences spatial perception and behavior, and
vice versa, so that our spatial perception and behavior influence the way of moving. Another study in the UK reinforces that presumption. Susilo
et al. [
43] found that sustainable modes of travel are related to some urban design features, such as secured bike storage, high connectivity of the neighborhoods, natural surveillance, high-quality of the public realm, and traffic-calming all proved significant.
In his book
Life between Buildings, Gehl [
41] (pp. 11–14) presented a probabilistic approach to understand how design influences behavior. He argued that through design it is possible to influence how many people use open spaces, how long individual activities last, and which activity types can develop. Carmona
et al. [
44] (p. 107) believe that the crux of Gehl’s argument is that, in poor-quality public spaces, only strictly necessary activities occur. In higher-quality public spaces, necessary activities take place with approximately the same frequency—although people choose to spend longer doing them—but, more importantly, a wide range of optional (social) activities also tend to occur [
44] (p. 107). Diversity of activities is essential to the sustainability of cities [
18].
Urban surfaces are always used by many users at the same time, by drivers, cyclists, pedestrians, and residents. Each group has their own spatial needs. The environment should go along with it and create a good personal feeling. To ensure good living conditions to all as a precondition for sustainable development, environmental perception should be adjusted. The question is how to achieve it.
3. Evaluation Methodology and Evaluation Model
After analytical research work on different spatial case studies and existing literature, two key questions were set: (1) how to provide good visual arrangements of open space, and (2) how the environmental perception can be equally appreciated during different time sequences, like daytime, time of year or before and after an environmental impact? To answer these questions, a model was developed to evaluate visual potential of concrete locations and respond to development demands.
Three dimensions of an evaluation model (model SEC) was developed. The model got its name from the first letters of its three dimensions named: suitability to everyone, environmental acceptance and cost effectiveness. The top–down approach and the method of decomposition was used to design this model. The method of deductive conclusions was primarily used as a mental approach, but in some cases we used the method of inductive conclusion, especially when it was necessary to form a conclusion from multiple sources. These three basic dimensions resulted from the sustainability model shown in
Figure 1. Dimension “suitability to everyone” is an upgrade from social cohesion; “environmental acceptance”, from environmental responsibility; and cost effectiveness, from economic efficiency.
All three dimensions have associated factors such as psychological, sociological, aesthetic, ecological, functional, and economic (
Table 2). Each factor has appropriate indicators listed below in order to evaluate the importance of a specific factor. Together there were three dimension bases, six factors, and seventeen indicators that evaluate the visual relevance and visual potential of urban open space. The SEC methodology helps us to recognize a situation’s specificity of, and allows a response to, users’ demands. It enables us to answer how to increase the visual potential of the city with minimum impact on nature and economic costs.
Table 2.
Three-dimensional evaluation assessment (SEC model) of urban open space environmental perception.
Table 2.
Three-dimensional evaluation assessment (SEC model) of urban open space environmental perception.
| SEC MODEL | DIMENSIONS | FACTORS | INDICATORS |
|---|
| ENVIRONMENTAL PERCEPTION OF URBAN OPEN SPACE | 1. SUITABILITY TO EVERYONE | 1.1 Psychological | 1.1.1 Individual feeling |
| 1.1.2 Attracting attention |
| 1.1.3 Orientation ability |
| 1.1.4 Sense of safety |
| 1.2 Sociological | 1.2.1 Land use |
| 1.3 Aesthetic | 1.3.1 Location aesthetic |
| 1.3.2 Ability to recognize space order |
| 1.3.3 Daylight or nightlight effect |
| 2. ENVIRONMENTAL ACCEPTANCE | 2.1 Ecological | 2.1.1 Impact on habitats |
| 2.1.2 Impact on living creatures (plants and animals) |
| 3. COST EFFECTIVENESS | 3.1 Functional | 3.1.1 Daylight or nightlight intensity |
| 3.1.2 Light reflection from the surface |
| 3.1.3 Location of urban furniture |
| 3.1.4 Appearance of urban furniture |
| 3.2 Economic | 3.2.1 Energy cost |
| 3.2.2 Urban furniture installation cost |
| 3.2.3 Urban furniture maintenance cost |
Comprehensive evaluation demands a holistic approach of all factors. The SEC model represents such a comprehensive evaluation. The model implementation is not presented in full in this article. The first dimension, suitability to everyone, is detailed. This dimension concentrates on user’s subjective spatial perception. For planners, it is important to know how users sensed the place around them. This first dimension reflects the primary user’s interest and, therefore, is a focus of further research interest.
To support the SEC methodology an evaluation instrument (questionnaire) was developed. Closed questions and five level evaluation scales were used to evaluate a specific location. Due to the examination of the individual indicator impact, a new category called “aspects” was introduced into the SEC model. Each indicator was subdivided using the relevant aspects. For example
individual feeling is studied on the basis of
space attraction, space pleasantness, and
relaxed atmosphere, detected by respondents. All used aspects and associated indicators are presented in
Table 3.
Table 3.
Aspects and corresponding questionnaire term possibilities within two extremes.
Table 3.
Aspects and corresponding questionnaire term possibilities within two extremes.
| FACTORS | INDICATORS | ASPECTS | QUESTIONNAIRE TERM POSSIBILITIES WITHIN TWO EXTREMES |
|---|
| 1.1 Psychological | 1.1.1 Individual feeling | | Not attractive-attractive |
| Unpleasant-pleasant |
| Tense-released |
| 1.1.2 Attracting attention | | Simple-complex |
| Boring-interesting |
| not arousing-arousing |
| 1.1.3 Orientation ability | | not visible-visible |
| 1.1.4 Sense of safety | | Dangerous-safe |
| 1.2 Sociological | 1.2.1 Land use | | walking, stopping, sitting, socializing, playing, cycling, rollerblading, skating, sightseeing tour |
| 1.3 Aesthetic | 1.3.1 Location aesthetic | | Disordered-ordered |
| 1.3.2 Ability to recognize space order | | object line, single object, open space, paved surface, greenery |
| 1.3.3 Light effect | | Uninteresting-interesting |
| unpleasant glow-pleasant glow |
| Incompatible-compatible |
3.1. Model Implementation and Questionnaire
The questionnaire (attached in
Supplementary) consists of four possible questions. First, the respondents should imagine that they are at some specific place of interest. They evaluated the scene on a five-level evaluation scale between two extremes, e.g., not attractive and attractive, unpleasant and pleasant, tense and relaxed, simple-complex, boring-interesting, not arousing-arousing, not visible-visible, dangerous-safe, and the last, between disordered and ordered. The second question deals with what stands out the most in the displayed place. The options were: object line, single object, open space, paved surface, and greenery. The third question deals with place suitability for specific activities, like walking, short stops, sitting, socializing, playing, cycling, rollerblading, roller skating, and sightseeing tours. The forth question deals with light effect. The questionnaire covers all aspects listed in
Table 3. It may be used to evaluate various spatial circumstances. In order to obtain objective results and a holistic picture of the place, it is recommended to reuse the questionnaire at the same location more than once. It also makes sense to use it in different time sequences, like day-time and night-time, during different seasons or before and after spatial interventions.
3.2. The Experiment
In order to show the usefulness and appropriateness of the SEC model evaluation characteristics, empirical research was conducted, based on the descriptive and causal experimental method. The experiment was conducted during the time interval from May 2013 until June 2014. The experiment was based on a sample of 200 respondents, 100 men and 100 women, aged between 18 to 34 years old. All participants were students at the University of Maribor in Slovenia. They were treated as a pilot group. Respondents were anonymous. Interviewing was carried out in small groups of up to ten people. It lasted about half an hour. The interview location was a classroom. Respondents have been shown large scale images of locations (see
Figure 3,
Figure 4,
Figure 5 and
Figure 6) projected on the wall to help in recalling and reliving the specific location. The interviewer was always the same person who performed a passive conduct of the questionnaire handling and running the image presentation. Each participant completed the questionnaire once.
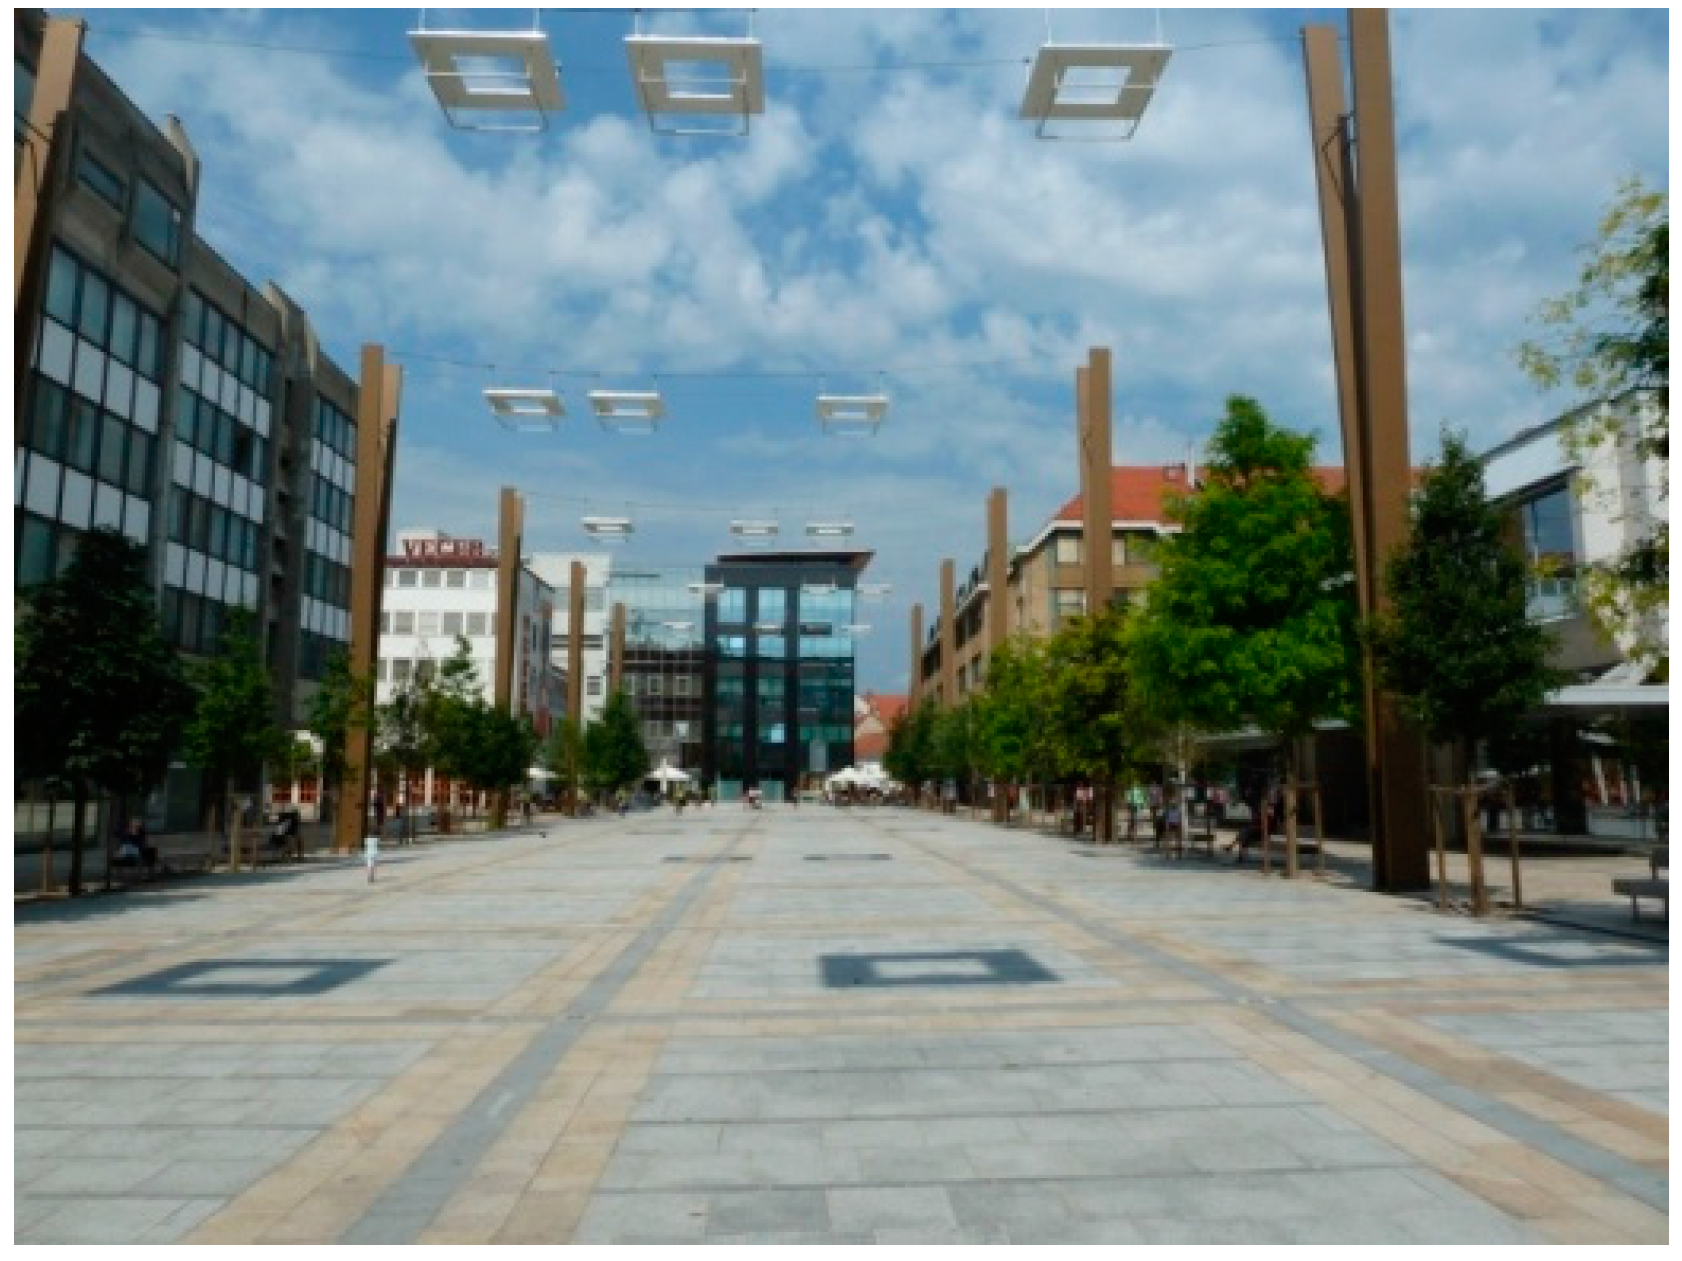
Figure 3.
Leon Štukelj Square during day-time.
Figure 3.
Leon Štukelj Square during day-time.
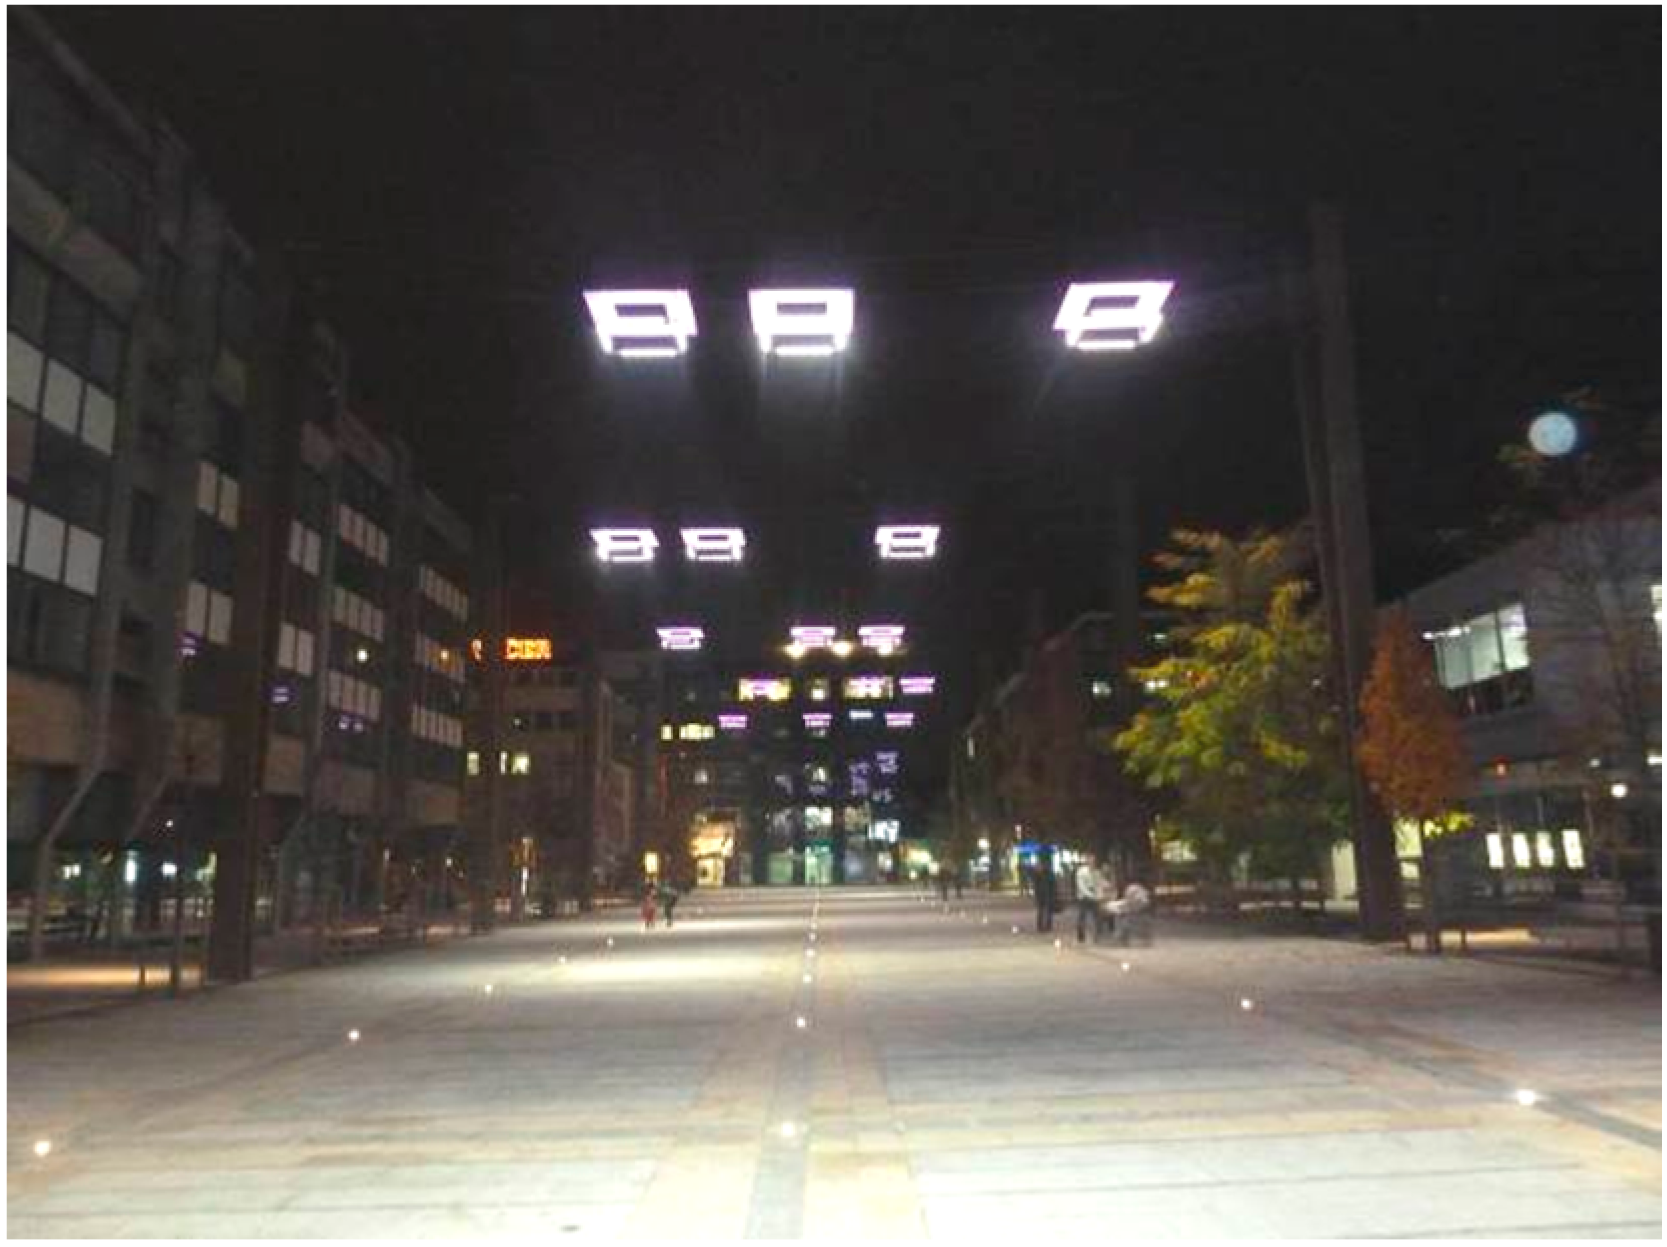
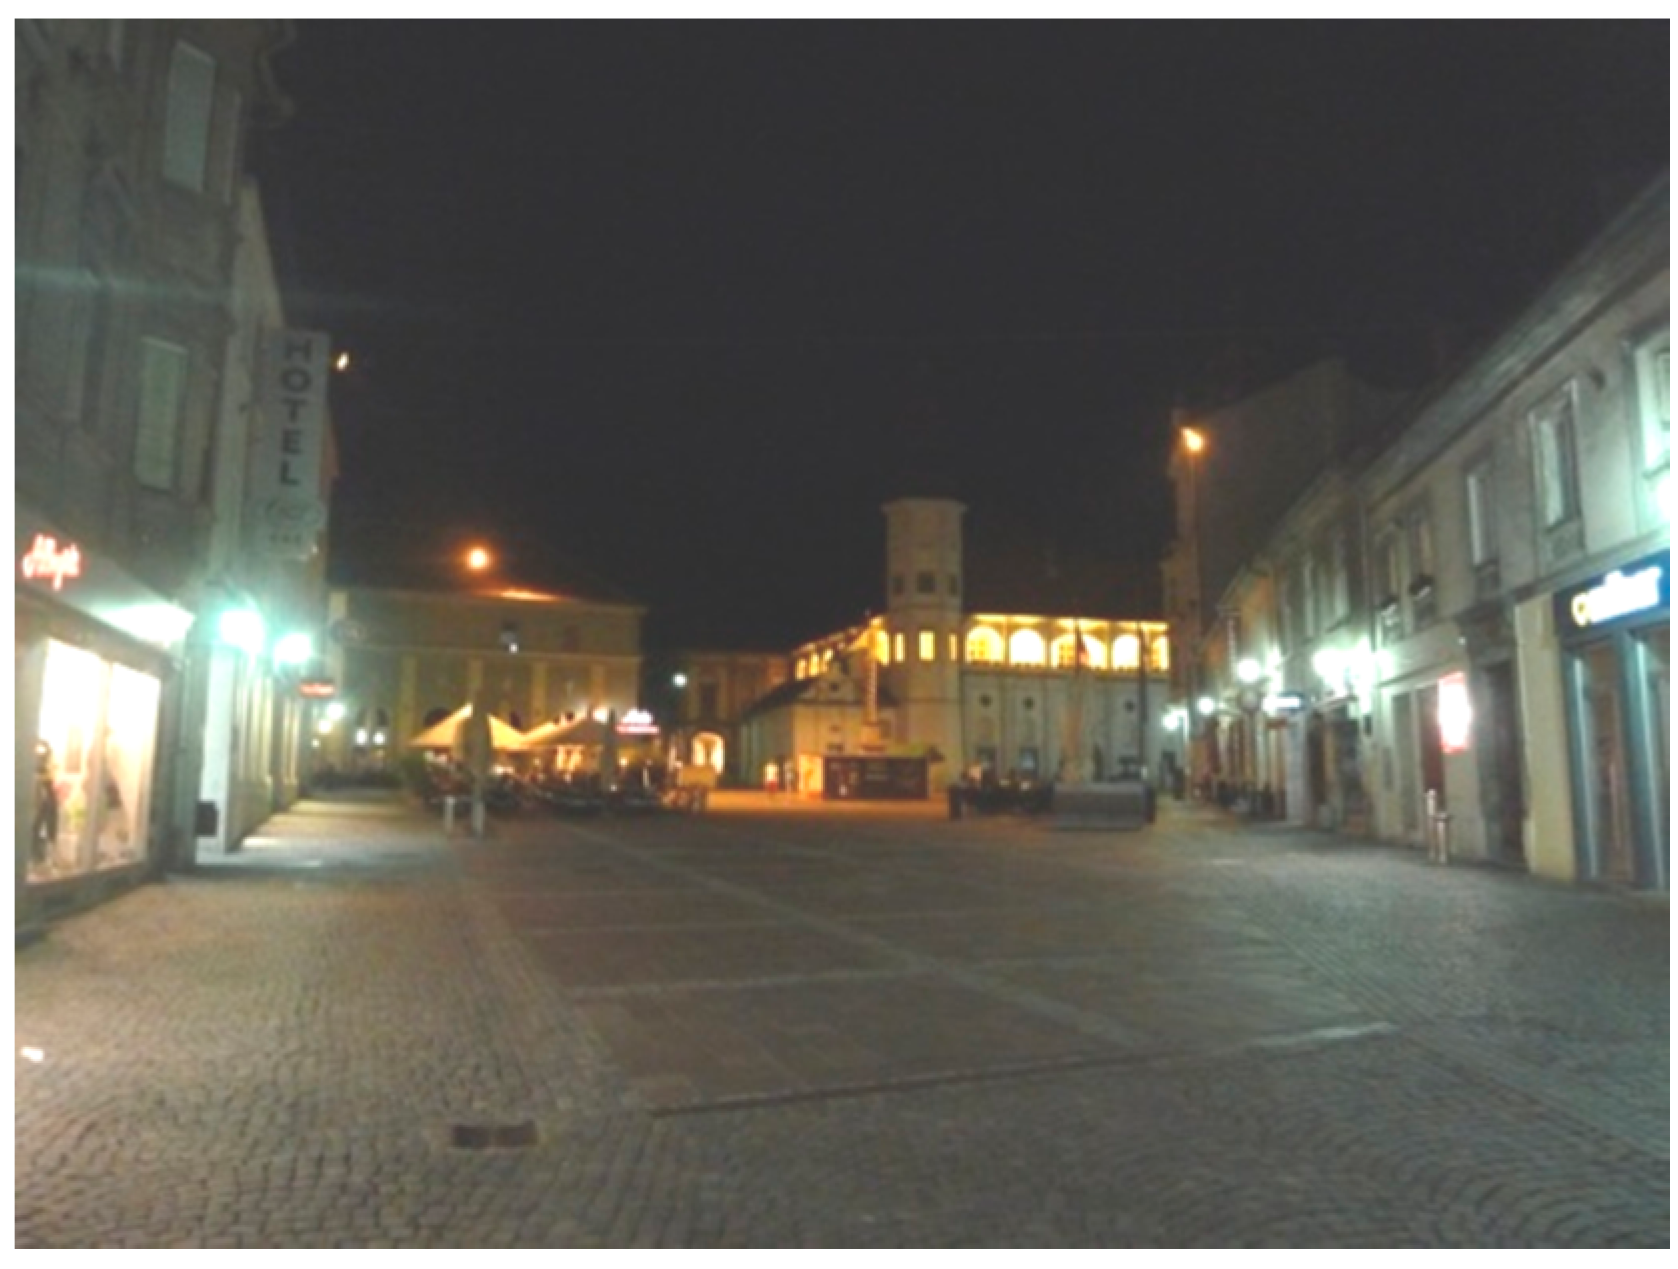
Figure 4.
Leon Štukelj Square during the night-time.
Figure 4.
Leon Štukelj Square during the night-time.
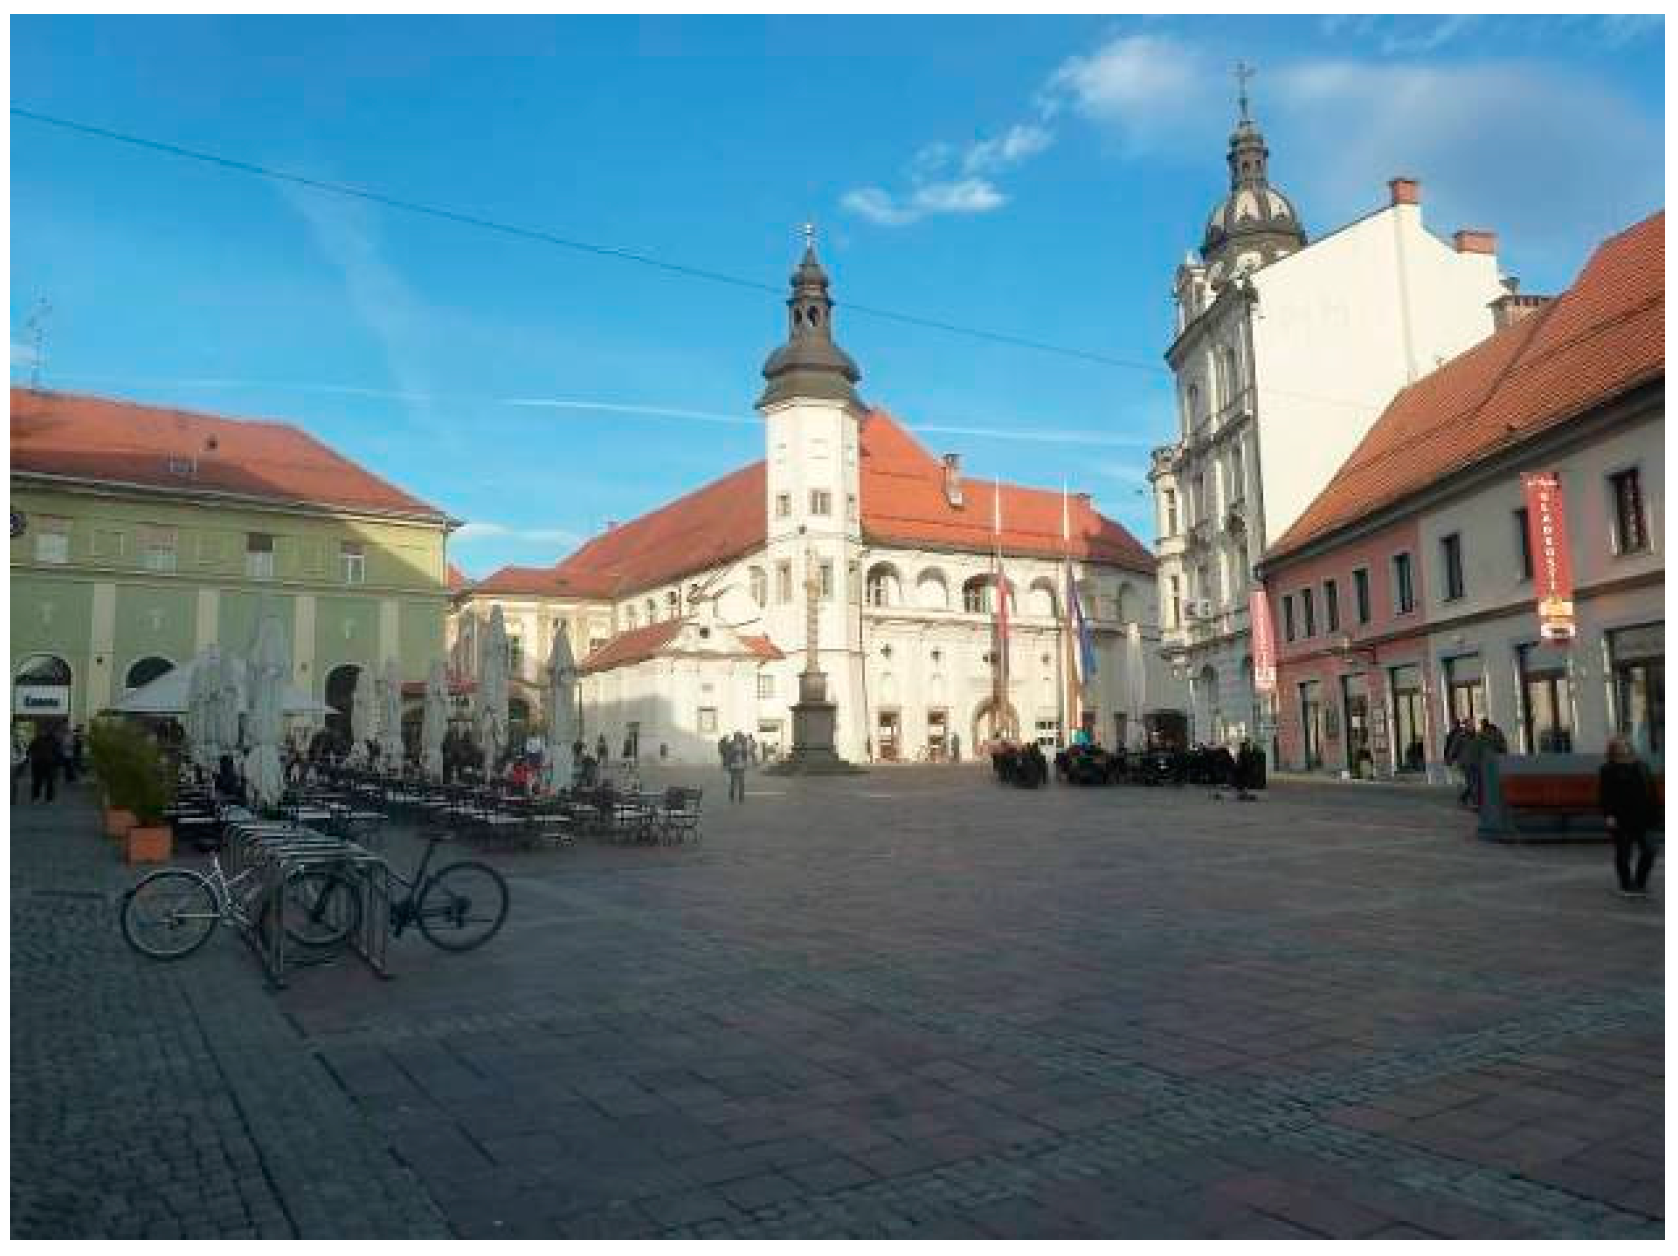
Figure 5.
Castle Square during day-time.
Figure 5.
Castle Square during day-time.
Figure 6.
Castle square during night-time.
Figure 6.
Castle square during night-time.
The research focus of was on space perception differences during day- and night-time. Respondents evaluated each location twice; first during day-time and second during night-time. Presented day-time and night-time images were adjusted through the same point of view.
For the research location city, Maribor has been chosen. Maribor is the second largest Slovenian city with an important central regional role. Two specific locations in the city center were selected; Leon Štukelj Square (LOC-1) and Castle Square (LOC-2). Both chosen locations were well-known to respondents. High recognition and good accessibility allowed the most representative answers.
3.2.1. Location 1: Leon Štukelj Square (LOC-1)
The square is located in a closed traffic zone and it is an important path node. It is a modernly designed city square, transformed and opened 2011. It is a closed square, surrounded by public buildings, mostly of the banking sector. The central part of the square is devoted to events and is, therefore, only occasionally occupied. Distant edges of the square are gradually being appropriated by cafes. Trees, benches, and bins are lined on the edges. Hanging lamps are stretched across the entire square width. At certain points there are also free-standing and floor lamps installed.
The night situation creates a pleasant atmosphere. Changing light color creates different lighting ambiences. Hanging lamp light is focused on paved areas. Ground floor levels, except for one building, are not illuminated.
3.2.2. Location 2: Castle Square (LOC-2)
This square is located in a closed traffic zone of historical city center. It is also an important path node accessible from four directions. It is one of the oldest squares, formed in the 17th century. Buildings are architecturally very recognizable. The central part of the market is overtaken by cafes. Sun lights the vertical edges of the castle, which is a dominant object and orientation point. People move all over the place.
The night situation changes one’s environmental perception. The vertical edges of the castle are not visible. One observes an illuminated monument in the middle of the square. The place also has very uneven lighting. The central part is in semi-darkness. A narrow lighted path near the buildings generates a sense of space. People walk on the lighted path more often than any other direction.
4. Statistical Results: Statistical Data Processing—Compliance of Space Perception and Land Use during Day and Night
Data obtained on the basis of a questionnaire were statistically processed and analyzed using SPSS Windows, Version 21. Methods of descriptive statistics (frequency and numerical analysis, the arithmetic mean of the difference between the mean and standard deviation) and inferential statistics (χ2-test, t-test for dependent samples, and Pearson’s correlation coefficient-r) were used.
4.1. Locations Rating on the Basis of a Psychological Factor
First, respondents assessed the presented situations on the basis of a psychological factor. Corresponding indicators of the SEC model are:
individual feeling,
attracting attention,
orientation ability,
and sense of safety. Each indicator has associated aspects. Respondents evaluated the aspects of
attraction,
pleasantness,
relaxation, composition, arouse interest,
stimulation,
overview,
and safety using a five-level evaluation scale. The results of the individual aspects’ comparison assessments for day and night are given in
Table 4,
Table 5,
Table 6,
Table 7,
Table 8,
Table 9,
Table 10 and
Table 11.
Table 4.
Descriptive measurements of the indicator individual feeling, the results of the t-test, and the correlation for the dependent sample pair day-night.
Table 4.
Descriptive measurements of the indicator individual feeling, the results of the t-test, and the correlation for the dependent sample pair day-night.
| LOCATION | DAY | NIGHT | Difference
| t | 2p | r |
|---|
| σ | | σ |
|---|
| Attraction |
| LOC-1 | 4.23 | 0.889 | 4.18 | 0.910 | 0.055 | 0.783 | 0.435 | 0.391 |
| LOC-2 | 4.16 | 0.779 | 3.50 | 0.874 | 0.660 | 9.581 | 0.000 | 0.310 |
| Pleasantness |
| LOC-1 | 4.16 | 0.833 | 4.25 | 0.747 | −0.090 | −1.445 | 0.150 | 0.383 |
| LOC-2 | 4.15 | 0.804 | 3.48 | 0.879 | 0.665 | 9.713 | 0.000 | 0.341 |
| Relaxation |
| LOC-1 | 3.91 | 0.894 | 4.03 | 0.921 | −0.120 | −1.799 | 0.074 | 0.460 |
| LOC-2 | 3.90 | 0.835 | 3.33 | 0.827 | 0.565 | 7.987 | 0.000 | 0.276 |
Based on the arithmetic mean of the indicator individual feeling, locations are very different. The aspects of pleasantness and relaxation have higher arithmetic mean values for the night as for the day. The aspect pleasantness is not statistically significant because p > 0.05. Greater difference is in the aspect relaxation. Here we are already very close to statistical significance, where the two-way p (2p = 0.074) is greater than 0.005. Location 2 (LOC-2) arithmetic mean is higher in all three aspects during daytime. The correlation coefficient r ranges in the interval between 0.276 and 0.460, which indicates a weak correlation relationship for day and night.
Table 5.
Descriptive measurements of the indicator attracting attention, the results of the t-test, and the correlation for the dependent sample pair day-night.
Table 5.
Descriptive measurements of the indicator attracting attention, the results of the t-test, and the correlation for the dependent sample pair day-night.
| LOCATION | DAY | NIGHT | Difference
| t | 2p | r |
|---|
| σ | | σ |
|---|
| Composition |
| LOC-1 | 3.08 | 1.166 | 3.12 | 1.167 | −0.040 | −0.452 | 0.652 | 0.425 |
| LOC-2 | 3.00 | 1.080 | 2.76 | 0.840 | 0.240 | 3.154 | 0.002 | 0.393 |
| Arouse interest |
| LOC-1 | 4.09 | 0.941 | 4.25 | 0.813 | −0.160 | −2.323 | 0.021 | 0.391 |
| LOC-2 | 3.90 | 0.902 | 3.17 | 0.936 | 0.730 | 9.573 | 0.000 | 0.312 |
| Stimulation |
| LOC-1 | 3.84 | 0.939 | 4.10 | 0.862 | −0.265 | –3.693 | 0.000 | 0.386 |
| LOC-2 | 3.69 | 0.889 | 2.96 | 0.870 | 0.730 | 9.615 | 0.000 | 0.255 |
The indicator attracting attention consists of three aspects: composition, arouse interest, and stimulation. In comparison with the individual feeling indicator, indicator attracting attention has a lower arithmetic mean rating for both day and night. Response dispersion is also greater in both observation periods. The standard deviation varies from 0.889 to 1.166 at daytime and from 0.840 to 1.167 at night-time. Negative average difference of LOC-1 means that the location got higher grades of likability during the night. There is statistically significant difference at two aspects: arouse interest and stimulation. The aspect composition has a relatively high correlation coefficient r = 0.425 of moderate correlation. The results of t-test (t = −0.452 and 2p = 0.652) show that there are no statistically significant differences between both mean values (−0.040). This result indicates moderately consistent distribution of answers for day and night, although the difference in average value is very small.
Table 6.
Descriptive measurements of the indicator orientation ability, the results of the t-test, and the correlation for the dependent sample pair day-night.
Table 6.
Descriptive measurements of the indicator orientation ability, the results of the t-test, and the correlation for the dependent sample pair day-night.
| LOCATION | DAY | NIGHT | Difference | t | 2p | r |
|---|
| σ | | σ |
|---|
| Overview |
| LOC-1 | 4.44 | 0.713 | 4.40 | 0.679 | 0.045 | 0.774 | 0.440 | 0.303 |
| LOC-2 | 4.14 | 0.796 | 3.65 | 0.890 | 0.490 | 7.287 | 0.000 | 0.368 |
Orientation ability is an indicator in which higher or better ratings for the day-time compared to night-time are expected. This expectation is partly confirmed by the results in the
Table 6. We have a minimum difference of average estimates at LOC-1. In this case, we have detected a statistically relevant difference between these average value assessments for night and day (average difference = 0.045,
t = 0.774, and 2
p = 0.440).
Table 7.
Descriptive measurements of the indicator sense of safety, the results of the t-test, and the correlation for the dependent sample pair day-night.
Table 7.
Descriptive measurements of the indicator sense of safety, the results of the t-test, and the correlation for the dependent sample pair day-night.
| LOCATION | DAY | NIGHT | Difference | t | 2p | r |
|---|
| σ | | σ |
|---|
| Sense of safety |
| LOC-1 | 4.19 | 0.829 | 4.13 | 0.814 | 0.065 | 1.012 | 0.313 | 0.389 |
| LOC-2 | 4.14 | 0.833 | 3.44 | 0.883 | 0.700 | 9.458 | 0.000 | 0.257 |
A similar picture as in the case of indicator orientation ability, we also have at indicator sense of safety. Arithmetic means for the day are higher in comparison with the night. A special feature is LOC-1, wherein the difference is not statistically significant (difference of averages = 0.065, t = 1.012, and 2p = 0.313). Respondents sensed this location equally safe during day and night.
4.2. Locations Rating on the Basis of the Aesthetic Factor
On the basis of the Aesthetic factor, the respondents evaluated indicators: location aesthetic, ability to recognize space order, and light effect. Following aspects were used: Space arrangement, Dominance recognition of individual spatial components. Light effect was analyzed on the basis of interesting, pleasant, and compliance aspects.
Table 8.
Descriptive measurements of the indicator location aesthetic of the location, the results of the t-test, and the correlation for the dependent sample pair day-night.
Table 8.
Descriptive measurements of the indicator location aesthetic of the location, the results of the t-test, and the correlation for the dependent sample pair day-night.
| LOCATION | DAY | NIGHT | Difference | t | 2p | r |
|---|
| σ | | σ |
|---|
| Space arrangement |
| LOC – 1 | 4.62 | 0.581 | 4.44 | 0.684 | 0.185 | 3.976 | 0.000 | 0.469 |
| LOC – 2 | 4.09 | 0.765 | 3.71 | 0.788 | 0.385 | 6.460 | 0.000 | 0.411 |
The indicator location aesthetics shows that the average grade of the day are higher than for the night. These differences were statistically significant in both cases.
Table 9.
Descriptive measurements of the indicator light effect during the night-time.
Table 9.
Descriptive measurements of the indicator light effect during the night-time.
| LOCATION | Pleasant | Interesting | Compliance |
|---|
| σ | | σ | | σ |
|---|
| LOC-1 | 3.97 | 1.098 | 4.47 | 0.776 | 4.33 | 0.832 |
| LOC-2 | 3.01 | 0.962 | 2.59 | 1.048 | 2.87 | 1.055 |
The indicator light effect provides the arithmetic mean and standard deviation for the aspects interesting, pleasant, and compliance. This indicator can be evaluated as a daylight effect, as well as artificial night light effect. In our case, we evaluated the artificial night light effect. LOC–1 has the highest arithmetic mean in all categories. The same location has the lowest dispersion estimates.
Table 10.
Frequencies and percentage of perceiving the dominant structural elements of the space during the day-time and night-time.
Table 10.
Frequencies and percentage of perceiving the dominant structural elements of the space during the day-time and night-time.
| | f (DAY) f % | f (NIGHT) f % |
|---|
| LOCATION | Line Object | Single Object | Open Space | Paved Surf. | Green | Line Object | Single Object | Open Space | Paved Surf. | Green |
|---|
| LOC-1 | 19 9.5 | 13 6.5 | 84 42.0 | 83 41.5 | 1 0.5 | 12 6.0 | 12 6.0 | 95 47.5 | 78 39.0 | 3 1.5 |
| LOC-2 | 21 10.5 | 82 41.0 | 50 25.0 | 46 23.0 | 1 0.5 | 46 23.0 | 27 13.5 | 67 33.5 | 59 29.5 | 1 0.5 |
The indicator
ability to recognize space order shows the dominance of the structural elements during the day-time and night-time. Respondents had five possible options (line objects, single object, open space, paved surfaces, and greenery) to choose one between them. The results in
Table 10 show that the respondents do not have the same opinion about dominant elements. Respondents saw all possible categories. The frequency values of elements distinguish between day- and night-time. Statistical evaluation of these differences gives the
Table 11.
Table 11.
Comparative analysis of the differences in perception of the space during the day-time and night-time, the results of χ2-tests, and correlations.
Table 11.
Comparative analysis of the differences in perception of the space during the day-time and night-time, the results of χ2-tests, and correlations.
| | f (DAY)-f (NIGHT) f % | | | | |
|---|
| LOCATION | Line Object | Single Object | Open Space | Paved Surf. | Green | χ2 | g | p | r |
|---|
| LOC-1 | 7 3.5 | 1 0.5 | −11 –5.4 | 15 7.5 | –2 –1.0 | 74.175 | 16 | 0.000 | 0.299 |
| LOC-2 | –25 –14.5 | 55 27.5 | –17 –8.5 | –13 –6.5 | 0 0.0 | 66.133 | 16 | 0.000 | 0.344 |
Since the significance level p ≤ 0.05, we can say that difference in environmental perception between day and nighttime exists. This fact is also confirmed by the correlation results. In both cases, the Pearson correlation coefficient r is low. It reaches a value of ≥ 0.2. Consequently, we are talking about weak relationship assessments during day- and night-time.
4.3. Locations Rating on the Basis of a Sociological Factor
Sociological factor is assessed on the basis of indicator
land use and aspects
land use intensity. Respondents evaluate locations the adequacy for the following activities: walking, stopping, sitting, socializing, playing, cycling, rollerblading or roller skating, and sightseeing tours. Location relevance is assessed with the help of a five-level evaluation scale. The results of both time cuts are shown in
Table 12.
Table 12.
Descriptive measurements of the indicator land use, the results of the t-test, and the correlation for the dependent sample day-night pair.
Table 12.
Descriptive measurements of the indicator land use, the results of the t-test, and the correlation for the dependent sample day-night pair.
| LOCATION | DAY | NIGHT | Difference | t | 2p | r |
|---|
| σ | | σ |
|---|
| Walking |
| LOC-1 | 4.40 | 0.789 | 4.37 | 0.725 | 0.025 | 0.433 | 0.666 | 0.420 |
| LOC-2 | 4.38 | 0.754 | 3.79 | 0.838 | 0.595 | 9.379 | 0.000 | 0.369 |
| Stopping |
| LOC-1 | 4.19 | 0.874 | 4.11 | 0,843 | 0.075 | 1.135 | 0.258 | 0.408 |
| LOC-2 | 4.37 | 0.791 | 3.55 | 0.955 | 0.825 | 11.125 | 0.000 | 0.290 |
| Sitting |
| LOC-1 | 4.21 | 0.889 | 3.91 | 1.008 | 0.300 | 3.770 | 0.000 | 0.302 |
| LOC-2 | 4.49 | 0.796 | 3.31 | 1.086 | 1.175 | 13.605 | 0.000 | 0.186 |
| Socializing |
| LOC-1 | 4.02 | 0.992 | 3.83 | 0.993 | 0.190 | 2.394 | 0.018 | 0.360 |
| LOC-2 | 4.51 | 0.743 | 3.37 | 1.038 | 1.140 | 15.059 | 0.000 | 0.313 |
| Playing |
| LOC-1 | 3.26 | 1.244 | 2.53 | 1.194 | 0.725 | 8.164 | 0.000 | 0.470 |
| LOC-2 | 2.86 | 1.123 | 1.95 | 0.901 | 0.905 | 11.302 | 0.000 | 0.390 |
| Cycling |
| LOC-1 | 3.24 | 1.140 | 2.93 | 1.213 | 0.310 | 3.875 | 0.000 | 0.539 |
| LOC-2 | 2.96 | 1.100 | 2.59 | 1.081 | 0.365 | 4.160 | 0.000 | 0.352 |
| Rollerblading and roller skating |
| LOC-1 | 3.13 | 1.200 | 2.70 | 1.252 | 0.430 | 5.330 | 0.000 | 0.568 |
| LOC-2 | 2.51 | 1.165 | 2.14 | 1.069 | 0.370 | 4.360 | 0.000 | 0.425 |
| Sightseeing tour |
| LOC-1 | 4.03 | 1.049 | 3.57 | 1.201 | 0.460 | 5.527 | 0.000 | 0.459 |
| LOC-2 | 4.54 | 0.664 | 3.34 | 1.082 | 1.195 | 15.672 | 0.000 | 0.312 |
Indicator land use presents location appropriateness for various activities during the day and at night. Average values differences are positive. This means that the average scores are higher for the day-time compared with night-time. The statistical insignificance of the difference is observed at LOC-1 for activities walking (2p = 0.666) and stopping (2p = 0.258). In all other cases, there are statistically significant differences between the mean values obtained for the daytime and the average values obtained for the night-time.
The SEC methodology and evaluation instrument (questionnaire) are suitable for cyclic measurement implementation in cases of monitoring over time, as well as analytical measurements before and after spatial interventions. They can be also used as a single model application at the specific location to evaluate the current spatial situation. This last option is presented in the article.
The article already presents results of two case studies. City evaluation took place once during day-time and once during night-time. Respondents evaluated visual open space qualities from the user’s point of view. Arithmetic means of all indicators differ during day-time and night-time. Such results are evidence that visual image and space perception of locations varies depending on day and night. Between presented case studies, location one (Leon Štukelj Square: LOC-1) is much better assessed. Discrepancies between day and night evaluations are smaller. The location was recently renovated and such results are expected. Location 2 (Castle Square: LOC-2) has lower arithmetic means of all indicators. Discrepancies between day and night evaluations are larger. Obtained results indicate that location one (Leon Štukelj Square: LOC-1) has higher environment quality and, consequently, a higher sustainability level than location 2 (Castle Square: LOC-2). An urgent need for visual renovation of the second location is indicated. There must be something done, especially during the night-time, to bring the visual effect of the location closer to the daylight situation.
5. Conclusions and Discussion
Urban environments are basically controlled and designed by our measures. Improving environmental perception increases visibility, personal security, and enhances orientation. Space perception during different time sequences is not the same; consequently, visual arrangements are not always successful. There are many limitations which need to be considered, such as spatial circumstances, users’ demands, functional demands, economic demands, legal framework, technical capabilities, and nature conservation demands. Basically, users and planners have different priorities.
Sustainability is a process that impacts development of all aspects of human life and it is the highest development priority. City sustainability denotes maximization of the economic and social benefits that a city produces, without exceeding environmental limits and while staying within acceptable limits of socio-economic inequity in both opportunities and distribution continuing into the indefinite future. Every spatial intervention and development should be sustainable. All decision-makers, planers or architects should consider these aspects. Spatial interventions should be controlled and planned; ad hoc decisions are not acceptable. The presented research concentrates on sustainable urban development, focusing on sustainable environmental perception of urban open space characteristics. To ensure good living conditions and broad land use, our perception should be adjusted to the concrete spatial situation.
Comprehensive environmental evaluation requires a holistic factors approach. An evaluation precondition is knowledge about the current state. The assessment model and assessment implementation must be sustainable. This is the basis to compare results for open space sustainable development. The evaluation model (SEC model) has been developed for this purpose. The model makes studying visual potential of urban environment possible.
An important aspect of the sustainable development concept is the inclusion of a temporal component. Multiple applications of the model allow us to obtain comparison results before and after spatial interventions or spatial development tracking over time. A single model application on the specific location provides useful results as well. The model can be used as an evaluation tool during a preliminary analysis implementation phase, followed by a sustainable development strategy preparation. The SEC methodology helps us to identify the current situation and to respond to users demands. The model allows evaluation of visual arrangements at specific locations, the assessment of unused potential, as well as the recognition and responses to specific spatial circumstances.
The SEC model is based on three dimensions, six factors, seventeen indicators, and several corresponding aspects. The model was named from the first letters of the three dimensions: suitability to everyone, environmental acceptance, and cost effectiveness. Based on sustainability principles, the SEC model illustrates the correlation between planning values and a user’s awareness of the city. The model was developed with the help of an analysis of the existing literature on this topic. It represents an upgrade of current sustainable development models, based on principles and guidelines given in Agenda 21. The top–down approach and the method of decomposition was used to design this model. The method of deductive conclusion was primarily used as a mental approach, but in some cases we used the method of inductive conclusion, especially when it was necessary to form a conclusion from multiple sources. Obtained results represent not only the state of the chosen open space; they are also a contribution to open space sustainable development.
Development and demonstration of the SEC model application confirm the hypothesis: by using the top–down approach principle and deductive or inductive conclusions, it is possible to create a holistic assessment model to assess the sustainability of urban environment visual arrangements and to carry out a comparative environmental analysis within different time sequences.
The SEC model application was focused on the users’ points of views (user’s priorities). Subjective open space experience is an important category and it was, therefore, chosen as the study base. Dimension suitability to everyone was studied on two locations in the city of Maribor, Slovenia. To support the evaluation methodology an evaluation instrument (questionnaire) was developed. Each question was compatible with aspects of the SEC model. On the basis of the statistically processed data, the existence of differences of statistically relevant significance
p < 0.05 in respondents’ subjective perception of urban space during different time sequences was proven. Due to the sample of 200 respondents (100 men, 100 women) the results can be within the limits of statistical confidence, generalized to the entire population between 18 to 34 years. Generalization on at least that age group is an original scientific contribution that focusses on the difference in perceptions and urban space usage in different time sequences, such as day and night. It also represents a contribution to the existing scientific results of Canter [
18], Lynch [
22,
24], Gehl [
30,
31], Carmona [
34], and others about sensing, using, and developing urban space. A model that is based on sustainability theory and includes subjective environmental experience factors and indicators is an upgrade to Fornara
et al.’s [
9] and Bonaiuto’s [
13,
14,
15] scientific work on perceived residential environment quality. Sustainability principles are superior to quality principles in the presented research context. Individual well-being is provided if the concern for urban environment is sustainable. Therefore, sustainable development is a prerequisite to obtain a high environment quality.
Obtained research results: (1) demonstrated a link between sustainability and quality principles; (2) development of the SEC model and SEC methodology; (3) development of the methodological instrument questionnaire; (4) successful demonstration of the SEC model implementation; and (5) hypotheses confirmation; these are original scientific contributions presented in this paper.
Model verification on different locations is a topic for future research. To get a holistic picture of a city, it is necessary to expand the research on other typologies, such as streets, parks, and other public places. To increase knowledge in this field, it is also recommended to expand research to different geographic, cultural, and religious areas.


