Article

Estimating Natural Environmental Characteristics of Subsidized Households: A Case Study of Austin, Texas

1
Department of Architecture and Landscape Architecture, North Dakota State University, 711 2nd Avenue North, Office #308, Fargo, ND 58102, USA
2
Department of Landscape Architecture and Urban Planning, Texas A&M University, A307 Langford Architecture Center, 3137 TAMU, College Station, TX 77843, USA
*
Author to whom correspondence should be addressed.
Sustainability 2015, 7(10), 13433-13453; https://doi.org/10.3390/su71013433
Submission received: 24 August 2015 / Revised: 23 September 2015 / Accepted: 25 September 2015 / Published: 30 September 2015

Abstract

:
Compared to the traditional public housing program, the Low-Income Housing Tax Credit (LIHTC) program has been regarded as a better tool to ensure the quality of housing structure for subsidized households and the mixing of incomes in neighborhoods. Previous studies related to LIHTC developments have solely focused on the relationships between subsidized households and socioeconomic environments, such as income, race, poverty, etc. Beyond the socioeconomic environments where subsidized households are located, there is a limited understanding about whether subsidized households experience healthier natural environments in their neighborhoods. This study aims to investigate whether LIHTC-subsidized housing neighborhoods provide adequate natural environments to the subsidized households in Austin, Texas, compared to the public housing households. We employ comparison t-tests and binomial logistic regression models. The results show that LIHTC households are significantly exposed to unhealthy natural environmental settings such as a lack of green vegetation and steep slopes while no statistical evidence is reported for public housing neighborhoods. Findings from this study may help policymakers and planners improve their understanding of whether subsidized housing developments offer better natural environments for disadvantaged populations and help them develop effective environmental intervention strategies to improve the quality of life of subsidized households.

1. Introduction

Subsidized housing programs in the U.S. aim to provide affordable housing, decent homes, and suitable living environments for disadvantaged populations [1]. While “affordable housing and decent homes” indicate the quantity of housing stock and the quality of housing structure, “suitable living environments” may refer to neighborhoods that can promote sustainable natural, built, and socioeconomic environments for subsidized households [2]. The U.S. has made longstanding efforts with various place-based subsidized housing programs that have achieved some success in ensuring affordable and quality housing for low-income families [3]. However, there is a growing concern about the living environments of subsidized households, and many studies have found that subsidized housing developments have often been located in distressed neighborhoods [1,2,3,4].
The neighborhoods where people live largely affect their opportunities for improved life outcomes, such as socioeconomic, environmental, and public health benefits. Disadvantaged neighborhoods are related to low education quality, inadequate access to jobs and active living, and high crime rates, while privileged and sustainable neighborhoods are associated with quality education, job opportunities, safety from crime, and healthier physical environments [4,5,6]. Given the significance of the different neighborhood environments that people live in, many prior studies examined the relationships between the spatial location of subsidized households and the socioeconomic conditions in neighborhoods [1,3,4,7,8]. Previous studies revealed that subsidized housing developments are concentrated in distressed neighborhoods with higher minority populations, poverty, unemployment, teenage school dropouts, crime rates, and lower incomes. Beyond the socioeconomic environments where subsidized households are located, there is a limited understanding about whether subsidized households experience healthier natural environments in their neighborhoods.
Natural environments such as neighborhood parks, trees, gentle slopes, and water features have been considered promising determinants of both quality of life and community sustainability [9,10,11]. Many scholars found that natural environments in neighborhoods improve physical activity levels; emotional, mental, and physical health; and social interactions among neighbors—factors which, apart from improving residents’ quality of life, are considered supportive of community sustainability [12,13]. For this reason, access to different kinds of natural amenities (e.g., parks, trees, water) are often mentioned as sustainability indicators for community development in its environmental, economical, and social aspects [9]. Several studies have identified that low-income households have limited access to natural amenities and that their health conditions are relatively low compared to high-income households [14,15]. A study conducted by Harlan et al. (2006) revealed that lower socioeconomic and ethnic minority groups were more likely to live in hotter neighborhoods where less green environments (i.e., grass or trees, parks, and green public space) are available, and they were more likely to have greater heat stress and fewer social ties [16]. Many studies also show that exposure to healthier natural environments such as green open space and abundant trees is critical for promoting health-related behaviors [17,18,19] and overcoming health inequality related to income deprivation [15]. Despite the benefits of healthier natural environments, there are no studies examining the associations between subsidized households and the natural environments of the neighborhoods where they live.
Given the shortage of previous studies, we pose the following research questions: (1) whether LIHTC-subsidized neighborhoods provide adequate natural environments to the resident subsidized households, compared to non-LIHTC neighborhoods; (2) which specific natural environmental characteristics are associated with LIHTC neighborhoods; and (3) how the results to research questions (1) and (2) based on the LIHTC program differ from those based on the public housing program. We employ comparison tests of the natural environmental conditions in neighborhoods with and without subsidized households. Additionally, we use multivariate analyses to account for the relationships between natural environments and the locations of LIHTC and public housing households. This study uses U.S. Census block group data for the socioeconomic variables that function as the confounding factors in the multivariate analyses. The objectively measured natural environmental data was captured by the block group using geographic information system (GIS). Results from this study may help policymakers and planners improve their understanding of whether subsidized housing developments offer better built environments for disadvantaged populations and help them develop effective environmental intervention strategies to improve the quality of life of subsidized households.
Section 2 contains the literature review discussing previous research about LIHTC and public housing developments and its limitations and summarizing the benefits of natural environments with an emphasis on the need to consider the environmental conditions for LIHTC-related studies. Section 3 introduces data and research methodology, including information on the study area, variables, and statistical methods, followed by the results of bivariate and multivariate analyses in Section 4. Discussion and conclusions are presented in Section 5.

2. Literature Review

2.1. Subsidized Housing Developments and Socioeconomic Environments

The public housing program in the U.S. provided over one million affordable housing units between the late 1930s and the mid-1980s [20,21]. However, the program has been criticized for contributing to rising crime rates, lowering neighborhood housing prices, and promoting white flight [22]. In addition, new public housing tended to be developed in deteriorated neighborhoods where public housing units were already located, further concentrating disadvantaged populations in these communities [2,3,20,23].
After its establishment by the Tax Reform Act of 1986, the Low-Income Housing Tax Credit (LIHTC) program received the baton as the major supplier of affordable housing for low-income families in the U.S. Compared to the public housing program, the LIHTC program has been regarded as a better tool to ensure the quality of housing structure and the mixing of incomes in neighborhoods because it utilizes private equity to produce affordable housing as well as market-rate units. Additionally, the LIHTC program encourages economic diversity among residents by targeting both moderate- and low-income families, whereas other subsidized housing programs focus solely on low-income families [20,24]. These characteristics of the LIHTC program have stimulated the hope that LIHTC developments may promote affordable housing stock and suitable living environments for disadvantaged populations.
However, many scholars assert that the LIHTC program has provided subsidized households with less-than-adequate neighborhoods in terms of socioeconomic environments [1,2,3,4]. Freeman (2004) explored the location of LIHTC-subsidized households and neighborhood characteristics in terms of poverty, income, minorities, and home values during the 1990s in the U.S. Based on the descriptive statistics, the author found that neighborhoods where LIHTC housing was developed contained higher proportions of African-American households, higher poverty rates, and lower median incomes. Additionally, Newman and Schnare (1997) analyzed socioeconomic characteristics in neighborhoods surrounding subsidized housing units, such as public housing and LIHTC units, across the nation from 1990 through 1999. By employing descriptive statistics, they found that public housing and LIHTC units were concentrated in underclass neighborhoods, especially in terms of higher levels of joblessness, female-headed families, welfare recipients, and teenage school dropouts. Other scholars also found that LIHTC developments are clustered in disadvantaged neighborhoods [2,4]. Van Zandt and Mhatre (2009) examined the relationship between spatial clustering of LIHTC developments and concentrated disadvantage, especially in terms of safety from crime, quality education, poverty, and income. They revealed that LIHTC developments in the Dallas-Fort Worth Metropolitan area were clustered in neighborhoods with high poverty rates, concentrations of minority populations, and poor educational access.
While the relationships between subsidized households and socioeconomic environments have been widely studied among planners, such studies often neglect to examine natural environments for subsidized households. Several public health studies have reported that minorities and low-income groups suffer from inactivity-related diseases and that physical inactivity levels of minorities and low-income groups are significantly higher than those of other population groups [25,26,27]. Healthier natural environments in neighborhoods may combat this problem and offer relief to other social and health concerns. This study will address the gap in neighborhood environmental conditions by examining the relationships between the location of public housing and LIHTC households and their natural environments.

2.2. Benefits of Natural Environments

Before identifying the relationship between natural environmental conditions and the location of LIHTC and public housing neighborhoods, we need to explore why natural environments are important for residents. Three benefits of natural environments that are crucial for residents’ healthy living are addressed here: physical health, emotional/mental health, and social benefits.
A growing number of studies have addressed individual physical health benefits stemming from physical activities among both children and adults in greener environmental areas [28,29,30,31]. Physical activities include both recreational activity such as walking, bicycling, or exercising in parks and utilitarian activity such as walking to destinations. Many researchers have argued that people are more likely to engage in recreational physical activities if they live in neighborhoods where there are many natural resources available in the surrounding areas [32,33]. A study using satellite imagery, GPS data, and accelerometers to measure greenness and physical activity in children showed that higher neighborhood vegetation levels, as measured by Normalized Difference Vegetation Index (NDVI), were associated with increases in moderate to vigorous physical activity in children [34]. In their study, children who experienced higher daily average minutes of exposure to greener spaces engaged in more physical activities, compared to those who spent nearly zero minutes of exposure to greener space. In a similar study that aimed to compare play activities with respect to the amount of greenspace, the researcher compared a reference group of 46 children playing in the nearby forest for one or two hours throughout the year to a group of 29 children playing in their traditional outdoor playground that was flat, barren, and covered with asphalt [35]. The results indicated that the natural environment played an influential role in promoting children’s play activities. The relationship between neighborhood greenness and health outcomes such as body mass index (BMI) has also been identified, indicating that the risk of being overweight was much lower among people living in green neighborhoods measured with high NDVI values [36,37]. In an eight-year longitudinal cohort study of 3173 children aged 9–10, the relationship between the development of childhood obesity and proximity to parks and recreational resources was assessed [38]. The study results indicated that children’s BMI was inversely associated with better access to parks and recreational facilities.
Another important benefit from exposure to natural environments is that green environmental features in neighborhoods can diminish emotional or mental stress of residents. According to several authors, natural environments have an ability to provide people with psychological well-being and restoration from attentional fatigue [39,40,41]. Many empirical research projects have identified the role of natural environments in providing people a restful experience and thereby aiding recovery from mental stress. In a study of 953 town-dwellers randomly selected from nine Swedish cities, associations between stress level and use of urban open green spaces were assessed using the analysis of variance and t-tests [19]. The results of this study showed that self-reported experiences of stress were rarely seen in participants who lived close to urban open green spaces, spent more time in those areas, or had excellent accessibility to green spaces. Several studies also examined the restorative effects of natural environments by conducting pre- and post-test analysis [42,43]. In a study on 120 voluntary participants, the influences of natural environments on stress recovery through visualizing various outdoor environmental conditions were examined [43]. The participants viewed a stressful movie and then were exposed to color/sound videotapes of either natural settings dominated by vegetation or urban settings in which there was heavy traffic and no pedestrians along streets. Physiological reactions such as heart rate, muscle tension, and pulse rate were measured, and findings indicated that recovery was faster and more complete when the participants were exposed to natural environments compared to urbanized environments with few natural environmental features.
In addition to the physical and mental health benefits of natural environments, a number of relevant studies have identified the role of natural environments in facilitating social interactions among neighbors [44,45,46]. Natural environments such as parks promote increased opportunities for social integration and a sense of community by providing places where people gather and socialize with each other. In a study interviewing 91 older adults in one inner-city neighborhood, the participants were found to be more likely to have greater social ties with their neighbors and friends if they spent more time in green outdoor common spaces with more trees and grass [44]. Potential reasons why there are more neighborhood social ties in greener places may be associated with higher aesthetic pleasure and improved safety of users walking in greener places or their adjacent streets. Indeed, a study showed that natural landscaping and spaces with dense tree groupings were more attractive for public housing residents than spaces with fewer natural environmental features [47]. Further, several studies have shown that more vegetation or greener natural environmental features are helpful in reducing crime, aggression, and violence in public housing areas [48,49]. These results call attention to the importance of utilizing natural environments as a means to promote social interaction among neighbors.
It is well known that socioeconomically disadvantaged neighborhoods may hinder opportunities for improved life outcomes and upward mobility for subsidized households due to limited quality education, job opportunities, and safety from crime. Beyond the socioeconomic environments, healthier natural environments in neighborhoods may improve individual physical health, emotional or mental health, and social interactions among neighbors. Thus, further research is needed to examine the association between natural environments and the spatial locations of LIHTC and public housing households, instead of focusing solely on the socioeconomic environments.

3. Data and Methodology

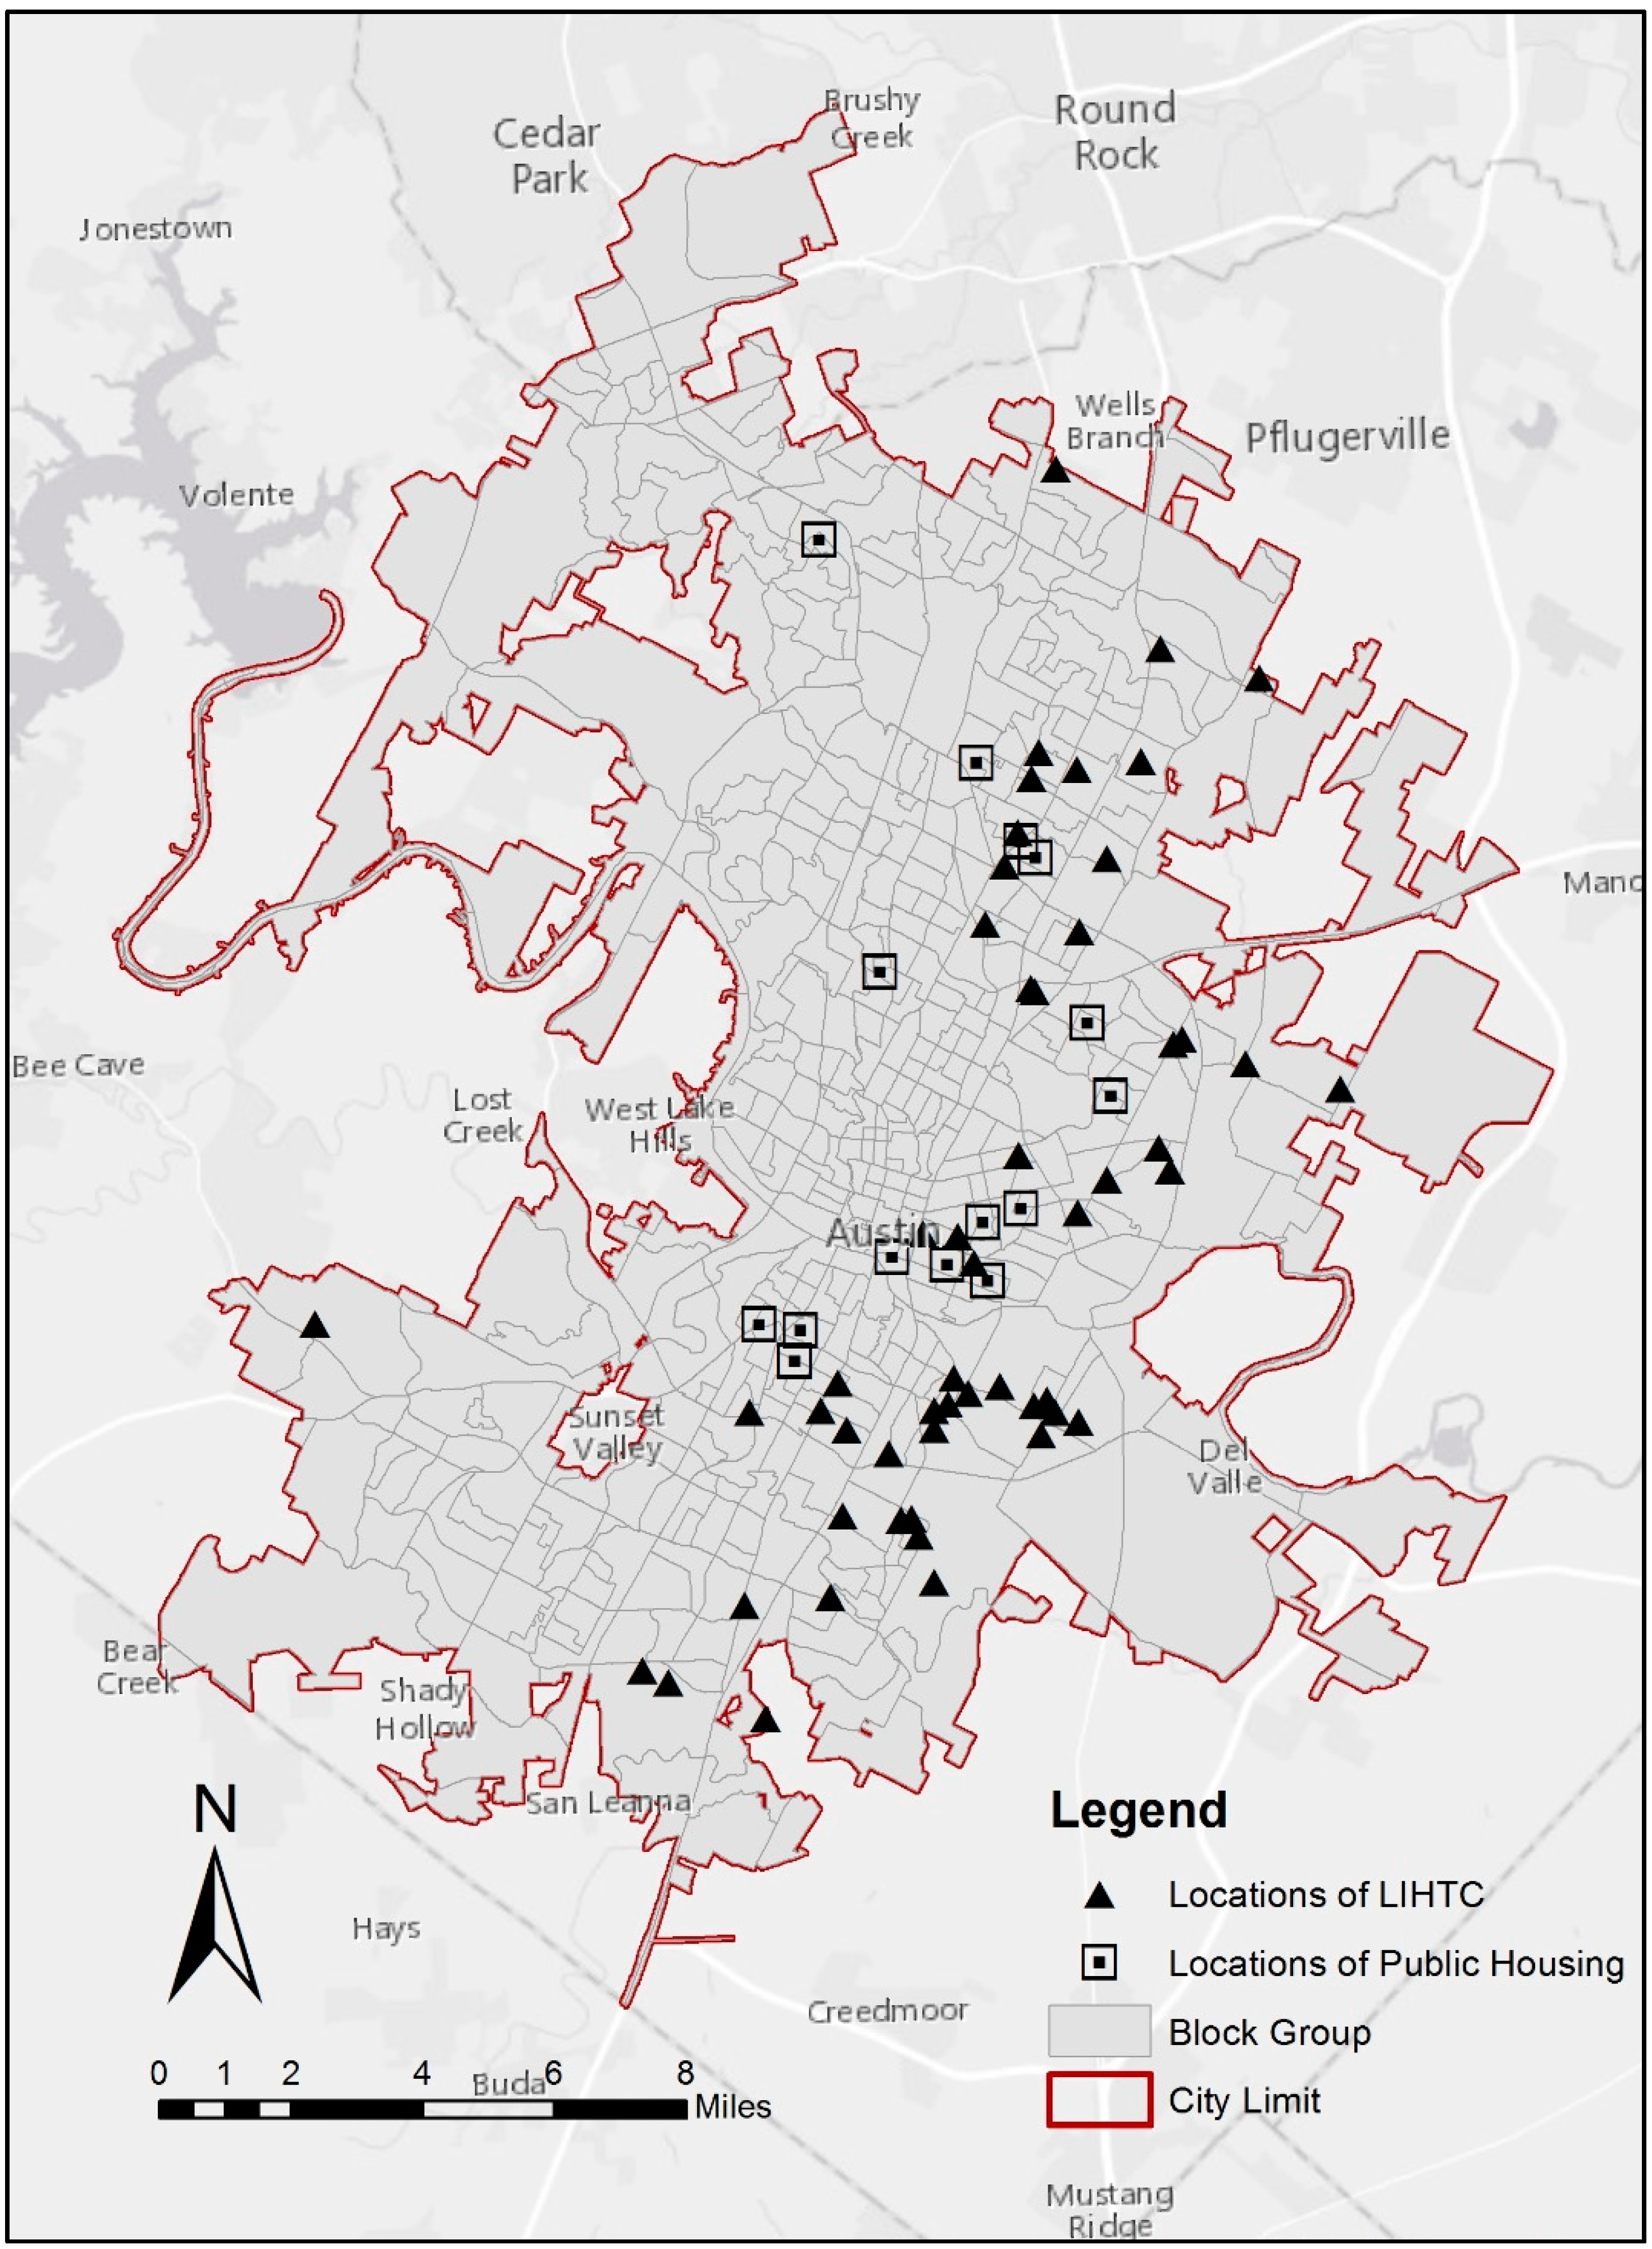
3.1. Study Area and Data Collection

The study area is the city of Austin, Texas, which is the capital of the U.S. state of Texas (Figure 1). Austin has been ranked as one of the fastest-growing cities in the U.S. for the years 2011 to 2014 [50]. According to the U.S. Census Bureau, household population in Austin in 2013 was 885,400, which was about 3.34% of the total population in the state of Texas [51]. In response to pressures from rapid population growth, there is growing concern about the lack of affordable housing across the city. The median housing value doubled between 1998 and 2008 and the burden of housing costs has worsened for both homeowners and renters in Austin [52]. For instance, although there is a large need for affordable rentals due to population growth, only 11% of renters earning less than $10,000 per year could find affordable housing in 2008 [52]. To offset this shortage of affordable housing units, promoting new housing has been the top priority in the city development administrators’ agenda. Although the LIHTC program may play a key role in producing affordable rental housing, the question of whether LIHTC-subsidized housing developments may provide suitable natural environments for low-income families remains unclear.
This study uses the Picture of Subsidized Households for 2009 data obtained from the U.S. Department of Housing and Urban Development (HUD) to determine the location of public housing developments. Additionally, the HUD data was supplemented with additional information from the Texas Department of Housing and Community Affairs’ (TDHCA) LIHTC Property Inventory. These data included all location of LIHTC developments from 1990 to 2009.
This study also uses the 2000 Census block group data for the measures of the socioeconomic status of Austin subsidized households. These measures include median household income, minority composition, poverty, unemployment, female-headed family, welfare receipt, and teenage school dropout. Objectively measured natural environmental data derives from various sources. We used digital geographic data (shapefiles) provided by the City of Austin for tree canopy, impervious surfaces, parks, and water features, Landsat 5 Thematic Mapper (TM) image data from the U.S. Geological Survey for measuring surface temperature and NDVI, and digital elevation model data from the Texas Natural Resources Information System for measuring steep slopes.
The natural environmental conditions were captured at the block group level. Out of a total of 506 block groups in Austin, Texas, we excluded 12 block groups that had no poverty information and were reported with zero median household income (N = 12, 2.4%) because these block groups are industrial or heavily commercial areas in Austin. Thus, 494 block groups with data descriptions of both the socioeconomic status and natural environmental characteristics were used for this study.
Figure 1. Locations of LIHTC and public housing developments within the study area, Austin, Texas.
Sustainability 07 13433 g001

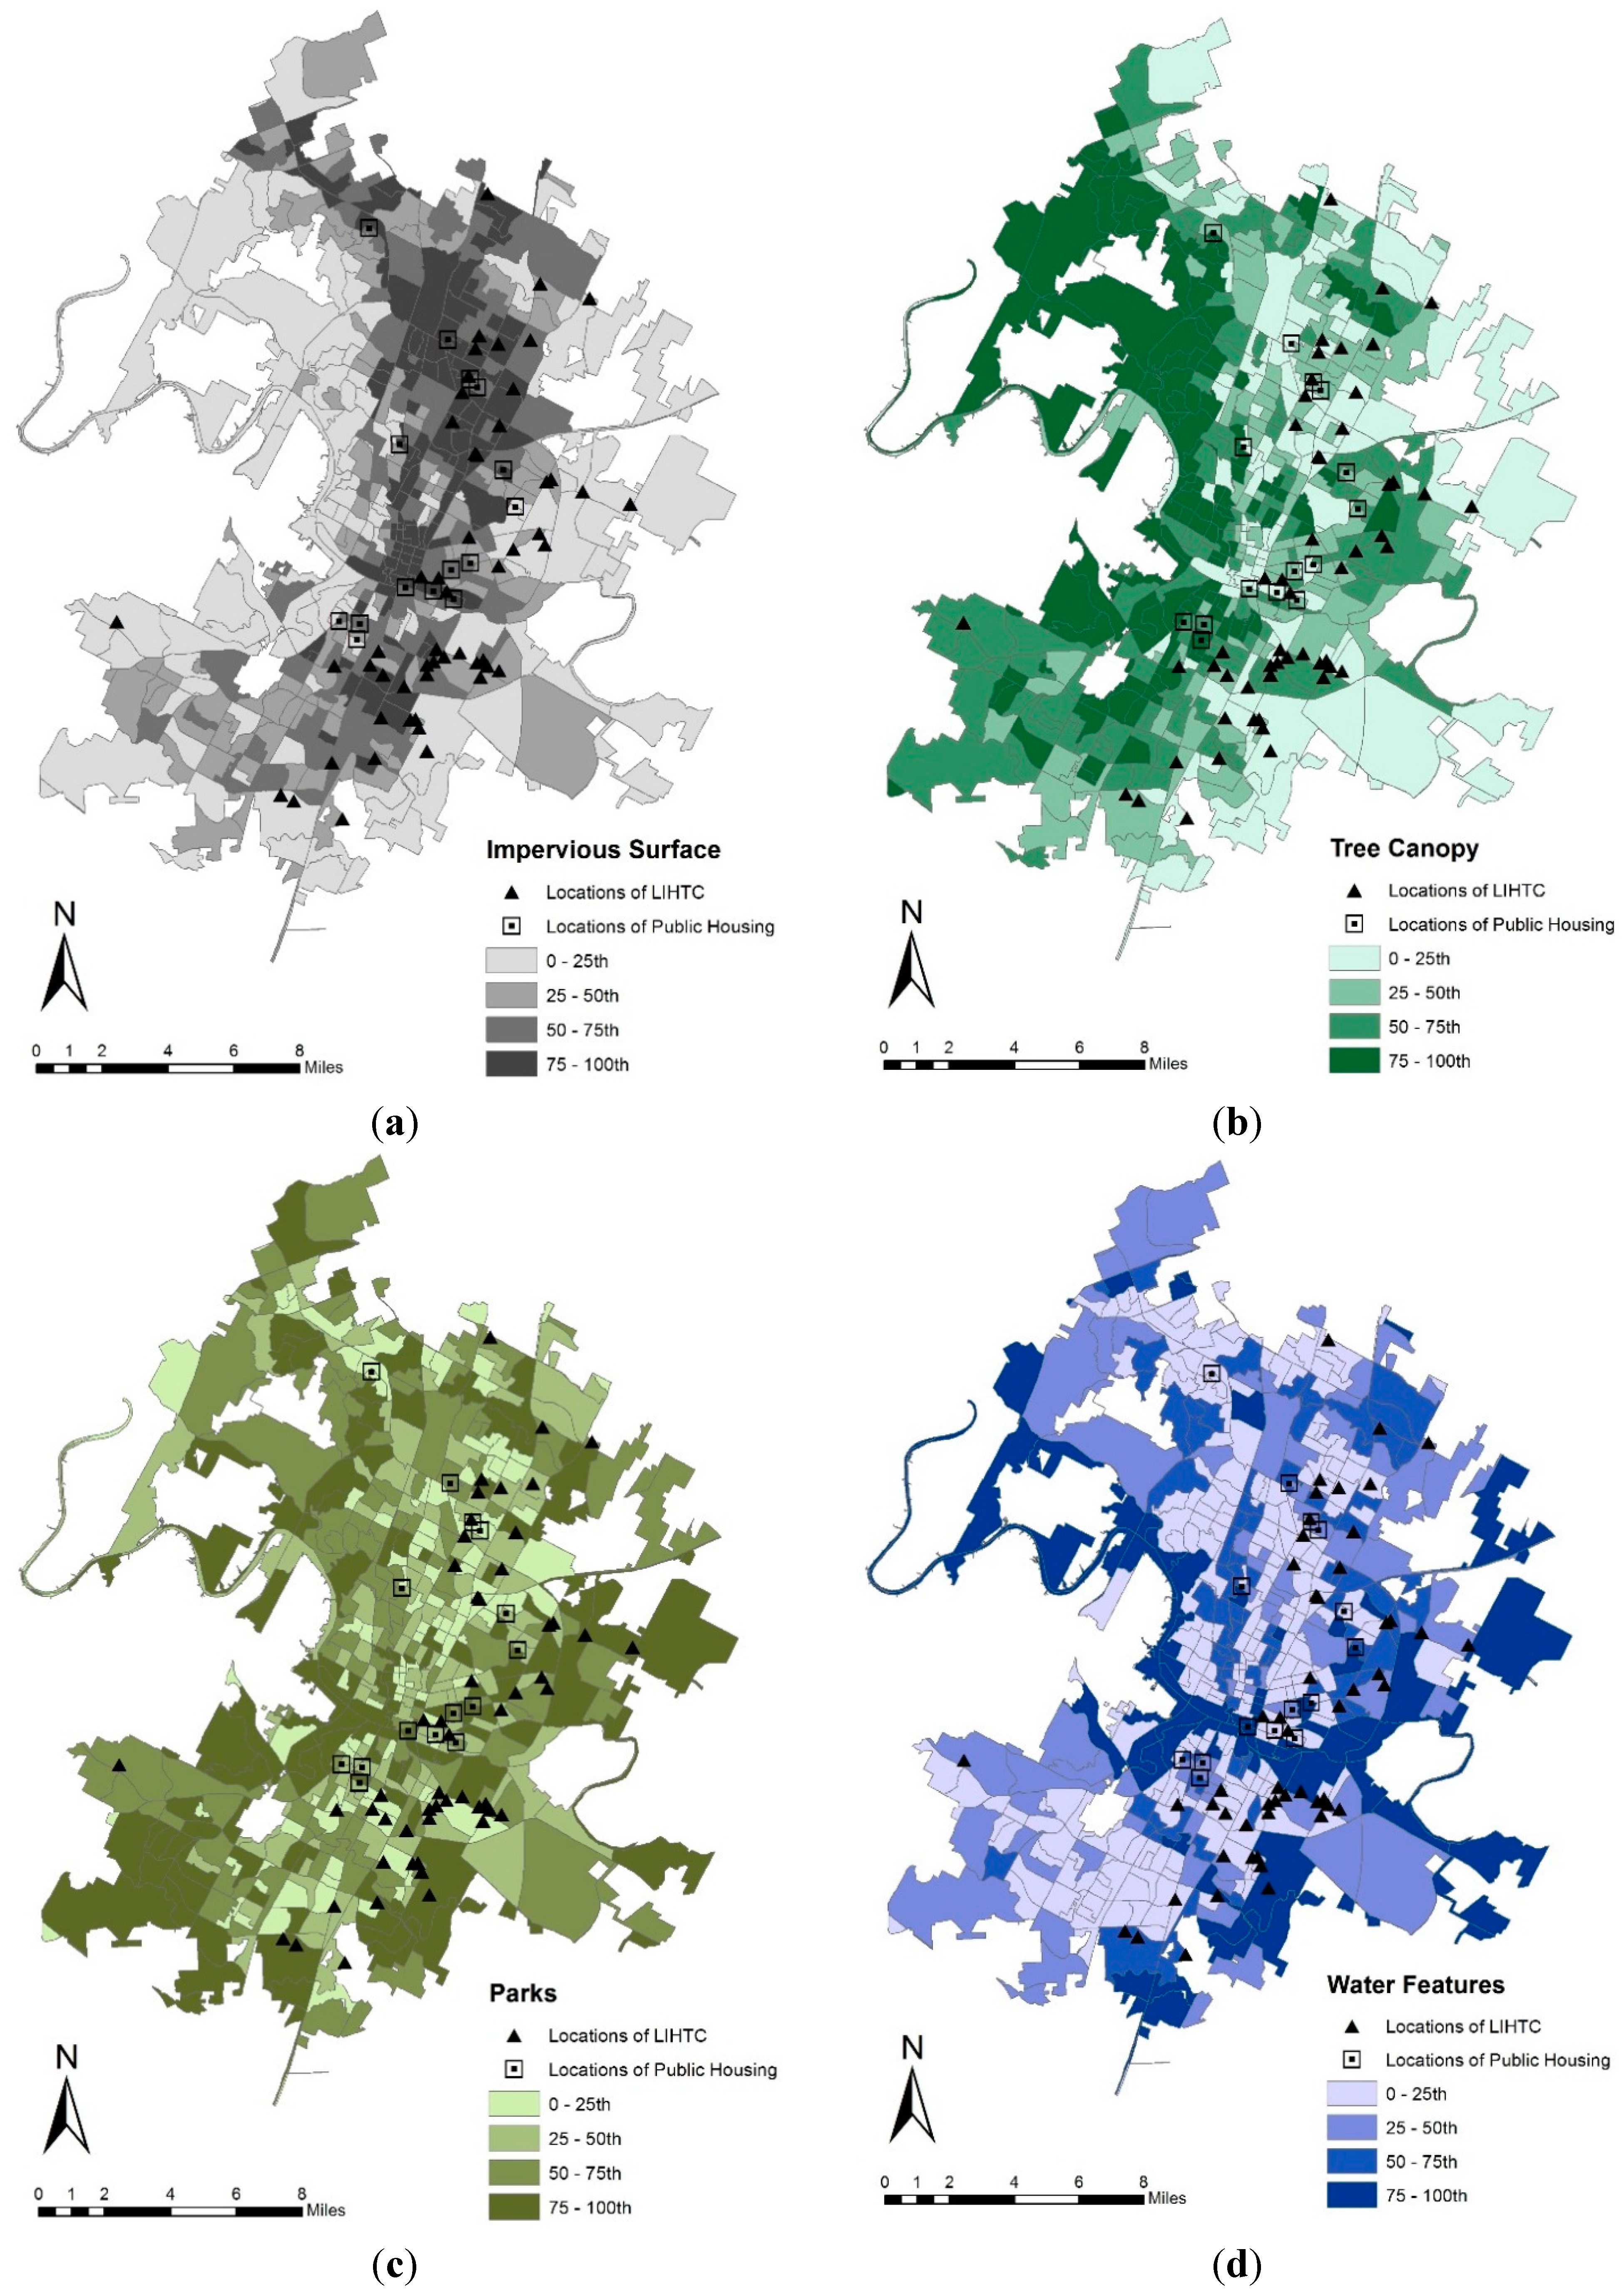
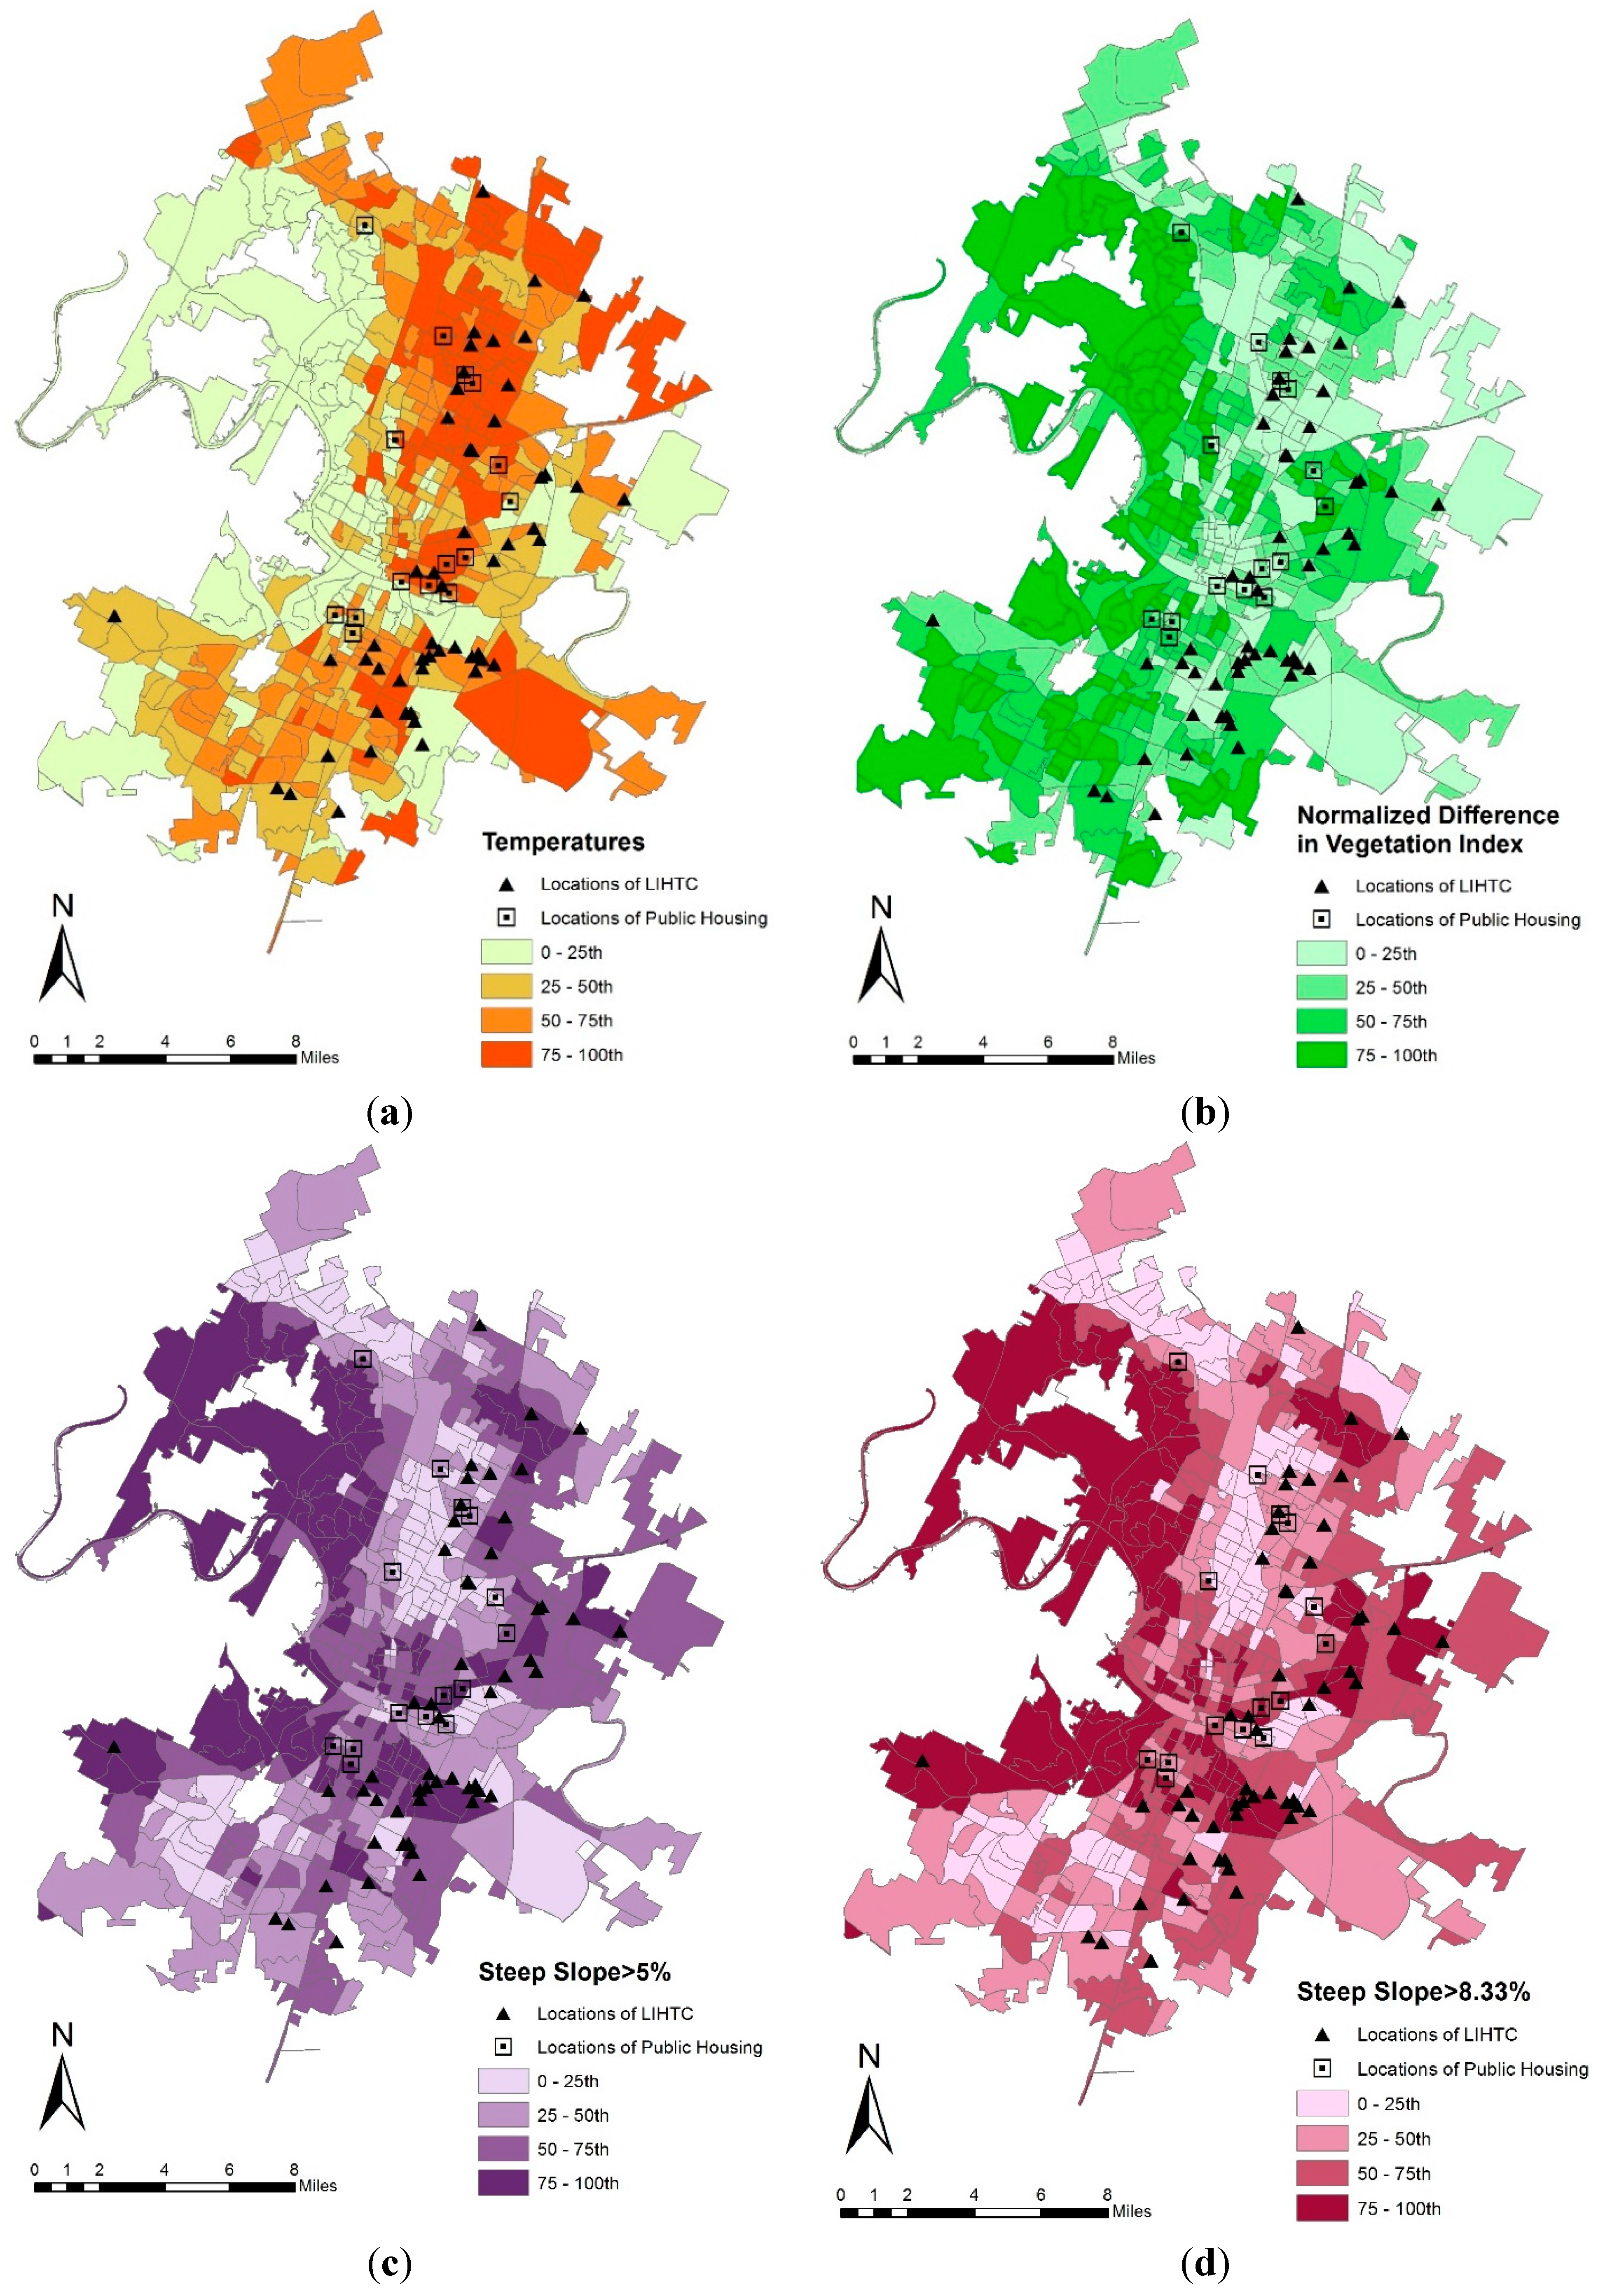
3.2. Measures for Natural Environmental Characteristics

Natural environmental variables were all measured objectively at the block group level using GIS. Through the literature review, we identified the following natural environmental characteristics associated with individuals’ mental, social, and physical health: the amount of greenness measured by NDVI and tree canopies associated with lower BMI [36,37,38] and healthy behaviors such as walking and bicycling [34,35], the availability of neighborhood parks and water features associated with recreational activity [32,33], air temperatures associated with heat stress and mortality [53,54,55], the amount of impervious surface associated with flooding, runoff, and pollution [56], and steep slopes that may discourage people from engaging in outdoor physical activities such as walking and bicycling [11,57].
The NDVI variable, which quantifies the amount of green vegetation in an area, was generated utilizing a remotely sensed image produced by the Landsat 5 Thematic Mapper (TM). The NDVI calculations are based on the fact that greener plants reflect radiation in the near infrared (band 4) while absorbing radiation in the red band (band 3). Thus, the satellite remote sensor stores high values of the near infrared band and low values of the red band for areas of dense green vegetation. The NDVI for a pixel (30 × 30 m) is calculated based on a formula that shows the ratio of the red band and near-infrared band from a Landsat TM image data [58]. The calculated values of NDVI range from −1 to 1, with higher values of NDVI indicating greater dense green vegetation. For our study, we used a Landsat 5TM image taken from 4 August 2009, for the NDVI calculation because the image did not have any cloud obstruction and was consistent with this research period. Tree canopy polygon data obtained from the City of Austin was also used as another independent variable indicating the amount of greenness. The tree canopy variable used in this study indicates the percentage of tree canopies within block groups. Likewise, parks and water features available in neighborhoods were measured for the density of parks and water features within block groups.
The temperature variable was derived from the Landsat 5 TM image data described above, but using the thermal band (band 6). The thermal band from the Landsat 5 TM stores temperature information as a digital number, and the digital numbers were converted to radiance values and then to temperatures [59]. Higher air temperatures are produced if there is large amount of impervious surface in neighborhoods because it collects solar heat. Impervious surfaces can be defined as artificial pavements (e.g., roads, driveways, and parking lots) that are covered by impermeable materials such as asphalt and concrete, preventing the infiltration of water into the ground. Thus, a large amount of impervious surfaces within neighborhoods are often considered an environmental concern because it contributes to flooding, runoff, and pollution [56]. The impervious surface variable was measured as the percentage of impervious surfaces within block groups.
Steep slopes were measured using a digital elevation modeling process in ArcGIS, creating the following two variables: the percentage of steep slope areas within block groups in which the slope was greater than (a) 5% and (b) 8.33%. The standard of 5% (1:20 slope, height-to-distance ratio) is the maximum running slope allowed for an accessible route without a ramp, and the slope of 8.33% (1:12 slope) is the maximum running slope allowed for a ramp [60]. Thus, this study assumed that steep slopes greater than 5% or 8.33% are undesirable environmental conditions for residents in terms of walking or bicycling in neighborhoods.

3.3. Statistical Analyses

Difference-in-means tests (t-test) for the continuous variables were conducted to investigate significant differences in socioeconomic and natural environmental conditions between neighborhoods with and without subsidized households. The null hypothesis is that there are no differences in the mean of the study variables between neighborhoods with and without subsidized developments. Hence, a rejection of the null hypothesis indicates that differences in the mean of socioeconomic and natural environmental conditions between LIHTC (or public housing) versus non-LIHTC (or non-public housing) neighborhoods are statistically significant.
A binary logistic regression model was also used for each subsidized neighborhood. The statistical models are to specify the relationships between natural environmental characteristics and the locations of LIHTC and public housing neighborhoods. The outcome variable for each subsidized neighborhood was coded by a binary scheme: zero for neighborhoods without the subsidized developments and one for neighborhoods with the subsidized developments. The assumption for this analysis is that the probability of a neighborhood including LIHTC or public housing developments follows the logistic curve as specified by the logistic function [61]:
f ( z ) = 1 1 + e z
and the probability of a neighborhood having LIHTC or public housing developments can be estimated with the following logistics regression model:
P ( Y = 1 | X 1 , X 2 , ... , X k ) = 1 1 + e ( β 0 + i = 1 k β i X i )
where P (Y = 1| X 1 , X 2 , …, X k ) is the probability of a neighborhood (Y) being one given ( X 1 , X 2 , …, X k ); X i is an independent variable representing various socioeconomic conditions such as minority composition, poverty, unemployment, female-headed family, welfare receipt, teenage school dropout, and the natural environmental variables measured at the block group level; and β i is the coefficient for variable X i .

4. Results and Discussion

4.1. Comparison T-Tests

4.1.1. Socioeconomic Characteristics

Table 1 shows the results of the differences in means of each socioeconomic variable between neighborhoods where LIHTC projects were developed and where they were not developed. There were significant differences in socioeconomic conditions between neighborhoods with and without LIHTC developments. The mean household income in neighborhoods with LIHTC developments was 33,797 dollars while that without LIHTC developments was 52,991 dollars. Lower mean household income in neighborhoods with LIHTC developments was significant at the 0.01 level. In terms of minority level, the mean in neighborhoods with LIHTC developments was around two times higher compared to the mean of neighborhoods without LIHTC developments (70.5% vs. 38.5%). The poverty level in neighborhoods with LIHTC developments was higher than that without LIHTC developments (21.2% vs. 12.4%). Additionally, neighborhoods with LIHTC developments were characterized by higher unemployment levels (6.5% vs. 4.15%), higher female-headed family levels (33.8% vs. 20.6%), higher welfare receipt levels (3.2% vs. 1.7%), and higher teenage school dropout levels (23.5% vs. 14.2%). These differences were statistically significant at the 0.01 level.
Table 1. Results of t-tests on the socioeconomic status between non-LIHTC versus LIHTC neighborhoods.
VariablesNon-LIHTC NeighborhoodsLIHTC NeighborhoodsDifference in Mean
NMeanS.D.NMeanS.D.
Household Income ($)45252,99127,5584233,79714,68319,194 ***
Percentage Minority45238.4826.384270.4622.79−31.96 ***
Percentage Poverty45212.4113.294221.2112.47−8.80 ***
Percentage Unemployment4524.093.99426.514.15−2.42 ***
Percentage Female-Headed Family43820.6317.254233.7516.63−13.11 ***
Percentage Welfare Receipt4521.662.72423.213.54−1.80 ***
Percentage Teenage School Dropout42514.2220.834223.5316.85−9.31 ***
*** p < 0.01 (two-tailed test).
Table 2 represents the results of comparison t-tests on the socioeconomic variables between non-public housing and public housing neighborhoods. Similar to LIHTC neighborhoods, median household income was much higher for non-public housing neighborhoods compared to public housing neighborhoods. Furthermore, the percentages of minority, poverty, unemployment, female-headed family, welfare receipt, and teenage school dropout rates were higher for public housing neighborhoods.
Table 2. Results of t-tests on the socioeconomic status between non-public housing versus public housing neighborhoods.
VariablesNon-Public Housing NeighborhoodsPublic Housing NeighborhoodsDifference in Mean
NMeanS.D.NMeanS.D.
Household Income ($)48052,01927,2901428,70710,35523,312 ***
Percentage Minority48040.4427.141467.4029.79−26.96 ***
Percentage Poverty48012.7213.111428.2116.25−15.50 ***
Percentage Unemployment4804.173.89148.876.57−4.70 ***
Percentage Female-Headed Family48021.0516.821446.2824.57−25.23 ***
Percentage Welfare Receipt4801.662.59146.455.69−4.79 ***
Percentage Teenage School Dropout48014.7220.081426.8324.78−12.11 ***
*** p < 0.01; ** p < 0.05 (two-tailed test).

4.1.2. Natural Environmental Characteristics

Table 3 represents comparisons of the natural environmental characteristics between non-LIHTC and LIHTC neighborhoods. The percentage of tree canopies measured within block groups was higher for non-LIHTC neighborhoods than for LITHC neighborhoods (34.3% vs. 26.7%). Neighborhood greenness measured by NDVI was also higher for non-LIHTC neighborhoods compared to non-LIHTC neighborhoods (NDVI 0.24 vs. 0.19). Surface temperature was slightly higher for LIHTC neighborhoods compared to non-LIHTC neighborhoods (32.91 °C vs. 32.09 °C), and it was statistically significant at the 0.05 level. Although LIHTC neighborhoods had more impervious surfaces, the measured difference was not statistically significant. Furthermore, the mean values of the parks, water features, and steep slopes variables were not statistically different between LIHTC and non-LIHTC neighborhoods.
Table 3. Results of t-tests on the natural environmental characteristics between non-LIHTC versus LIHTC neighborhoods.
VariablesNon-LIHTC NeighborhoodsLIHTC NeighborhoodsDifference in Mean
NMeanS.D.NMeanS.D.
Tree Canopy (%)45234.3114.984226.669.817.65 **
Impervious Surface (%)45230.0616.234233.4715.82−3.42
Parks (%)4527.4613.39428.2312.48−0.76
Water Features (%)4521.948.01420.450.781.49
Surface Temperature (°C)45232.092.094232.910.94−0.81 **
NDVI (ranging from −1 to 1)4520.240.09420.190.060.05 ***
Steep Slope (%) > 5%45212.5810.754214.669.95−2.08
Steep Slope (%) > 8.33%4526.848.51427.046.38−0.20
*** p < 0.01; ** p < 0.05 (two-tailed test); NVDI = Normalized Difference in Vegetation Index.
Table 4 shows the results of t-tests for comparisons of the natural environmental characteristics between non-public housing and public housing neighborhoods. Higher NDVI values, indicating more greenness within block groups, were measured for non-public housing neighborhoods (NDVI 0.24 vs. 0.20). However, these differences were only statistically significant at the 10% level.
Table 4. Results of t-tests on the natural environmental characteristics between non-Public Housing versus Public Housing neighborhoods.
VariablesNon-Public Housing NeighborhoodsPublic Housing NeighborhoodsDifference in Mean
NMeanS.D.NMeanS.D.
Tree Canopy (%)48033.8114.851428.5810.385.23
Impervious Surface (%)48030.1616.211436.8315.28−6.67
Parks (%)4807.4813.20149.0116.93−1.53
Water Features (%)4801.797.68142.597.87−0.80
Surface Temperature (°C)48032.152.041432.661.42−0.51
NDVI (ranging from −1 to 1)4800.240.09140.200.080.04 *
Steep Slope (%) > 5%48012.8110.751410.888.481.93
Steep Slope (%) > 8.33%4806.928.49144.624.792.32
* p < 0.10 (two-tailed test); NVDI = Normalized Difference in Vegetation Index.
The comparisons of the natural environmental characteristics and the locations of LIHTC and public housing neighborhoods were also supported by a series of GIS maps (Figure 2 and Figure 3). Figure 2 and Figure 3 show the spatial pattern of the natural environmental conditions measured within block groups and the locations of LIHTC and public housing developments. Some of the hostile natural environmental conditions (less tree canopy, lower NDVI, and higher impervious surface) were distributed heavily in the eastern area of Austin where most of the LIHTC developments were located. However, the other natural environmental conditions related to parks, water features, and steep slopes appeared to be evenly distributed, not showing a distinct pattern associated with LIHTC developments. In addition, any distinct spatial patterns between the natural environmental conditions and public housing developments were not identified.
Figure 2. (a) Impervious surface; (b) tree canopy; (c) parks; (d) water features.
Sustainability 07 13433 g002
Figure 3. (a) temperatures; (b) normalized difference in vegetation index; (c) steep slope > 5%; (d) steep slope > 8.33%.
Sustainability 07 13433 g003

4.2. Binary Logistic Regressions

4.2.1. Natural Environmental Correlates of LIHTC and Public Housing Neighborhoods

Table 5 represents the results from a binomial logistic regression estimating the natural environmental correlates of LIHTC and public housing neighborhoods, controlling for socioeconomic characteristics. Considering the multicollinearity problem contained among the natural variables for each model, three variables highly correlated with other variables (surface temperature, tree canopy, and steep slope (>5%)) were not used for the regression models. For example, higher values of NDVI (indicating dense greenness) in neighborhoods were associated with more tree canopies and lower surface temperatures. Further, steep slopes greater than 8.33% were highly associated with steep slopes greater than 5%. Thus, except for those three variables showing the multicollinearity problem, all the other natural environmental variables were used for the final model development.
Table 5. Binomial logistic regression models estimating the associations of natural environmental characteristics with LIHTC and Public Housing neighborhoods.
VariablesLIHTC NeighborhoodsPublic Housing Neighborhoods
Odds Ratiop > |z|Odds Ratiop > |z|
Percentage Minority1.040 ***<0.0001.031 ***0.033
Income ($1,000)0.962 **0.0480.9530.141
Percentage Poverty0.9760.1881.0210.383
Median Housing Value ($1,000)1.0050.1141.0070.201
NDVI †0.902 ***0.0051.0700.389
Impervious Surface0.971 *0.0921.0380.337
Steep Slopes > 8.33% (%)1.045 **0.0250.9820.560
Parks1.0190.2421.0120.576
Water Features0.7750.1411.0580.225
Number of Observations494494
LR Chi71.3623.31
Pro > Chi-Sq<0.00010.0055
Pseudo R20.24830.1830
*** p < 0.01; ** p < 0.05; * p < 0.10; NVDI = Normalized Difference in Vegetation Index; †: the original values of NDVI were multiplied by 100 for an easy interpretation of the NDVI variable.
Regarding the natural environmental correlates of LIHTC neighborhoods, two socioeconomic variables and three natural environmental variables remained significant in the regression model. The estimated odds ratio of the NDVI variable was 0.902, which indicates that a one-unit increase in NDVI in a neighborhood decreased the odds of it being LIHTC neighborhoods by 9.8% ((0.902 − 1) × 100 = −9.8). Furthermore, every additional percentage of impervious surface led to a 2.9% decrease in the odds of the neighborhood including LIHTC ((0.971 − 1) × 100 = −2.9). The odds ratio for the steep slope variable (8.33%) was 1.045, which indicates that every additional percentage of steep slopes greater than 8.33% resulted in the odds of the neighborhood including LIHTC by 4.5% ((1.045 − 1) × 100 = 4.5). The results for the public housing regression model, however, represent that none of the natural environmental factors were associated with public housing neighborhoods.

4.2.2. Socioeconomic Correlates of LIHTC and Public Housing Neighborhoods

Among the four socioeconomic variables used as confounders, the percentage of minority appeared to be significant in both regression models. The results show that both LIHTC and public housing households are more likely to be located in neighborhoods where higher proportions of minority residents lived. The odds ratios for the minority variable was 1.040 and 1.031 for each LIHTC and public housing regression model, which means that the odds of a neighborhood being LIHTC and public housing increased by 4% and 3.1% if the percentage of minority increased by 1%. Furthermore, the estimated odds ratio for the income variable, 0.962, indicates that every $1,000 increase in income decreased the odds of the neighborhood including LIHTC by 3.8% ((0.962 − 1) × 100 = −3.8).

5. Conclusions

Compared to previous studies of LIHTC developments that mainly focused on their associations with socioeconomic characteristics such as income level, unemployment status, and poverty level, this study examined the associations between the spatial locations of subsidized housing neighborhoods and the natural environmental characteristics that may affect residents’ ability to have a healthy lifestyle. Healthy natural environments are necessary for residents because they can help improve not only individual physical health and emotional/mental health, but also facilitate social interactions and a sense of community. For the specific natural environmental conditions, we objectively measured tree canopy, greenness, parks, water features, impervious surface, surface temperatures, and steep slopes at the block group level, using GIS. Controlling for the socioeconomic characteristics of residents, this study identified the natural environmental predictors of LIHTC and public housing neighborhoods through binomial logistic regressions. Furthermore, this study also investigated the disproportionate distribution of natural environmental conditions for both LIHTC and public housing neighborhoods. To the best our knowledge, this study is the first study addressing the natural environmental correlates of LIHTC and public housing households.
The results of t-tests showed that natural environmental conditions were unevenly distributed depending on whether or not neighborhoods contained LIHTC households. LIHTC neighborhoods had less tree canopy, lower NDVI, and higher surface temperatures, compared to non-LIHTC neighborhoods. However, other natural amenities such as parks, water features, and steep slopes were not shown to be statistically different between non-LIHTC and LIHTC neighborhoods. These results imply that although the LIHTC program has achieved some success in providing suitable living environments such as neighborhood parks and water features to disadvantaged populations, green components such as trees or grass are not sufficiently available for the LIHTC households. Thus, there is an opportunity to improve the health of LIHTC-subsidized households by directing greater attention to planting trees or grass within open spaces such as parks and waterfront areas.
In contrast, the comparison t-tests of natural environmental conditions between non-public housing and public housing neighborhoods did not show any statistical differences at the 5% level, which means that the natural amenities are evenly distributed to the non-public and public housing neighborhoods.
Furthermore, the results of t-tests for the socioeconomic variables indicated that compared to both non-LIHTC and non-public housing neighborhoods, LIHTC and public housing neighborhoods were composed of relatively vulnerable residents: the socioeconomically disadvantaged, ethnic minorities, the unemployed, female-headed families, those with welfare receipt, and those with middle/high school dropouts. Based on both of these t-test results, it is plausible to state that unhealthy natural environmental settings (e.g., less green environment and more exposure to thermally hot areas) were more injurious to LIHTC households than to public housing and non-subsidized households. The tendency towards unhealthy behaviors or fewer social interactions among those who live in socioeconomically vulnerable areas may be associated with the adverse or unsupportive natural environmental conditions available in their neighborhoods [15,62]. Moreover, ethnic minority groups and those with lower socioeconomic status are less likely to have the requisite social and material resources to cope with undesirable environmental conditions [16]. Therefore, more attention to the equitable distribution of healthy natural environmental conditions is necessary for LIHTC low-income subsidized households’ healthy living.
To better understand the natural environmental characteristics of the LIHTC and public housing households, we conducted the multivariate analysis that examines the association between natural environments and the locations of LIHTC and public housing developments after adjusting for the socioeconomic variables. The results from the binomial regression models reveal that while there were no specific predictors of public housing neighborhoods, a few natural environmental characteristics appeared to be significantly associated with LIHTC neighborhoods. LIHTC neighborhoods were less likely to have impervious surface areas. Having fewer impervious surfaces in neighborhoods is good for their living environment due to a lower risk of flooding and fewer pollutants delivered to drinking water streams [56]. However, it does not mean that LIHTC neighborhoods had more vegetative areas such as grass or trees that have high penetration rates. It is possible that LIHTC neighborhoods were mostly covered with bare ground or soil as the main pervious land cover types. In other words, there are many potential areas that can be planted with grass and trees. Indeed, the estimated odds ratio for the NDVI variable in our regression model was less than one, which indicates that LIHTC neighborhoods had less vegetation. This is further evidence that there is a ripe opportunity in LIHTC neighborhoods for planting more trees and grass on the widespread bare ground to encourage healthy lifestyles.
Our regression results also show that LIHTC neighborhoods were more likely to have steep slopes of greater than 8.33% (per American with Disabilities Act, the maximum running slope allowed for a ramp [60]). The steep slopes may hinder physical activities (e.g., walking or bicycling) for older adults and those with disabilities in their neighborhoods. Indeed, a study using a random sample of 413 adults showed that a GIS-measured steep hill was associated with non-use of bikeway [11]. Furthermore, commuters may not positively engage in walking or bicycling to their workplace if they are forced to climb steep slopes to get the destinations [63] because it takes longer and can exhaust them before beginning their work in the morning. The findings from our study raise concerns about the issues related to the equitable distribution of natural environmental conditions that help improve the quality of LIHTC neighborhoods’ living environment.
Although the primary intention of the LIHTC and public housing program is to increase the volume of affordable housing for the disadvantaged population, planners and policymakers have further expectations related to its performance. Specifically, beyond the supply of affordable shelters for lower-income households, subsidized housing programs aim to provide “suitable living environments”. Many studies have revealed that LIHTC and public housing households tend to be developed in socially and economically disadvantaged neighborhoods. However, the spatial location of subsidized households and their relation to natural environmental conditions have not been sufficiently studied and remain poorly understood. Our results suggest that the quality of natural environmental conditions should be considered when siting LIHTC housing in neighborhoods. LIHTC regulations implemented by state agencies may underestimate the potential negative effects of concentrating subsidized households in neighborhoods with unhealthy natural environments, which results in a critical gap in the effort to provide suitable living environments for subsidized households. The LIHTC program needs to be improved as a tool for the equitable distribution of favorable socioeconomic as well as natural environmental conditions to subsidized households.
This study may be limited in terms of generalizability. LIHTC and public housing developments in Austin may not be representative of other cities in the U.S. Additional research is needed to better understand the natural environmental conditions of subsidized housing by analyzing more cities. However, we should acknowledge that this study was unable to analyze a larger territory or collection of cities due to the resource limitations of natural environmental data and difficulty of analyzing such large data files. Future study may enable us to extend its study boundary by focusing on a small number of natural environmental variables which are considered important indicators of healthier natural environments. Furthermore, particular attention may be paid to the possibility of comparing results from the LIHTC and public housing program with those from other tenant-based subsidized housing programs such as the Housing Choice Voucher (HCV) program.

Acknowledgments

The open access publishing fees for this article have been covered by the Texas A&M University Online Access to Knowledge (OAK) Fund, supported by the University Libraries and the Office of the Vice President for Research. The authors acknowledge the City of Austin and Texas Natural Resources Information System which provided us with valuable raw data for this study.

Author Contributions

Young-Jae Kim conceived the idea for the analysis, contributed to natural environmental data collection using GIS, and drafted the manuscript. Ayoung Woo contributed to socioeconomic data collection and literature on subsidized housing developments. All authors have read, provided feedback, and approved the final manuscript.

Conflicts of Interest

The authors declare no conflict of interest.

References and Notes

  1. Newman, S.J.; Schnare, A.B. “… And a suitable living environment”: The failure of housing programs to deliver on neighborhood quality. Hous. Policy Debate 1997, 8, 703–741. [Google Scholar] [CrossRef]
  2. Oakley, D. Locational Patterns of Low-Income Housing Tax Credit Developments A Sociospatial Analysis of Four Metropolitan Areas. Urban Aff. Rev. 2008, 43, 599–628. [Google Scholar] [CrossRef]
  3. Freeman, L. Siting Affordable Housing: Location and Neighborhood Trends of Low Income Housing Tax Credit Developments in the 1990s; Brookings Institution, Center on Urban and Metropolitan Policy: Washington, DC, USA, 2004. [Google Scholar]
  4. Van Zandt, S.; Mhatre, P.C. Growing pains: Perpetuating inequality through the production of low-income housing in the Dallas/Fort Worth Metroplex. Urban Geogr. 2009, 30, 490–513. [Google Scholar] [CrossRef]
  5. Rogers, S.H.; Halstead, J.M.; Gardner, K.H.; Carlson, C.H. Examining walkability and social capital as indicators of quality of life at the municipal and neighborhood scales. Appl. Res. Qual. Life 2011, 6, 201–213. [Google Scholar]
  6. Squires, G.D.; Kubrin, C.E. Privileged places: Race, uneven development and the geography of opportunity in urban America. Urban Stud. 2005, 42, 47–68. [Google Scholar] [CrossRef]
  7. Kasarda, J.D. Inner-city concentrated poverty and neighborhood distress: 1970 to 1990. Hous. Policy Debate 1993, 4, 253–302. [Google Scholar] [CrossRef]
  8. Pendall, R. Why voucher and certificate users live in distressed neighborhoods. Hous. Policy Debate 2000, 11, 881–910. [Google Scholar] [CrossRef]
  9. Chiesura, A. The role of urban parks for the sustainable city. Landsc. Urban Plan. 2004, 68, 129–138. [Google Scholar]
  10. Nowak, D.J.; Dwyer, J.F. Understanding the benefits and costs of urban forest ecosystems. In Urban and Community Forestry in the Northeast; Springer: Berlin, Germany; Heidelberg, Germany, 2007; pp. 25–46. [Google Scholar]
  11. Troped, P.J.; Saunders, R.P.; Pate, R.R.; Reininger, B.; Ureda, J.R.; Thompson, S.J. Associations between self-reported and objective physical environmental factors and use of a community rail-trail. Prevent. Med. 2001, 32, 191–200. [Google Scholar] [CrossRef] [PubMed]
  12. Bedimo-Rung, A.L.; Mowen, A.J.; Cohen, D.A. The significance of parks to physical activity and public health: A conceptual model. Am. J. Prevent. Med. 2005, 28, 159–168. [Google Scholar] [CrossRef] [PubMed]
  13. Crompton, J.L. Financing and Acquiring Park and Recreation Resources; Human Kinetics: Champaign, IL, USA, 1999. [Google Scholar]
  14. Parks, S.; Housemann, R.; Brownson, R.C. Differential correlates of physical activity in urban and rural adults of various socioeconomic backgrounds in the United States. J. Epidemiol. Community Health 2003, 57, 29–35. [Google Scholar] [CrossRef] [PubMed]
  15. Mitchell, R.; Popham, F. Effect of exposure to natural environment on health inequalities: An observational population study. Lancet 2008, 372, 1655–1660. [Google Scholar] [CrossRef]
  16. Harlan, S.L.; Brazel, A.J.; Prashad, L.; Stefanov, W.L.; Larsen, L. Neighborhood microclimates and vulnerability to heat stress. Soc. Sci. Med. 2006, 63, 2847–2863. [Google Scholar] [CrossRef] [PubMed]
  17. De Vries, S.; Verheij, R.A.; Groenewegen, P.P.; Spreeuwenberg, P. Natural environments-healthy environments? An exploratory analysis of the relationship between greenspace and health. Environ. Plan. A 2003, 35, 1717–1732. [Google Scholar] [CrossRef]
  18. Maas, J.; Verheij, R.A.; Groenewegen, P.P.; de Vries, S.; Spreeuwenberg, P. Green space, urbanity, and health: How strong is the relation? J. Epidemiol. Community Health 2006, 60, 587–592. [Google Scholar] [CrossRef] [PubMed]
  19. Grahn, P.; Stigsdotter, U.A. Landscape planning and stress. Urban For. Urban Green. 2003, 2, 1–18. [Google Scholar] [CrossRef]
  20. Eriksen, M.D.; Rosenthal, S.S. Crowd out effects of place-based subsidized rental housing: New evidence from the LIHTC program. J. Public Econ. 2010, 94, 953–966. [Google Scholar] [CrossRef]
  21. Schwartz, A.F. Housing Policy in the United States; Routledge: London, UK, 2014. [Google Scholar]
  22. Woo, A.; Joh, K.; van Zandt, S. Impacts of the Low-Income Housing Tax Credit Program on Neighborhood Housing Turnover. Urban Aff. Rev. 2014. [Google Scholar] [CrossRef]
  23. Rohe, W.M.; Freeman, L. Assisted housing and residential segregation: The role of race and ethnicity in the siting of assisted housing developments. J. Am. Plan. Assoc. 2001, 67, 279–292. [Google Scholar] [CrossRef]
  24. McClure, K. The low-income housing tax credit as an aid to housing finance: How well has it worked? Hous. Policy Debate 2000, 11, 91–114. [Google Scholar] [CrossRef]
  25. Ainsworth, B.E.; Keenan, N.L.; Strogatz, D.S.; Garrett, J.M.; James, S.A. Physical activity and hypertension in black adults: The Pitt County Study. Am. J. Public Health 1991, 81, 1477–1479. [Google Scholar] [PubMed]
  26. Mason, J.O.; McGinnis, J.M. “Healthy People 2000”: An overview of the national health promotion and disease prevention objectives. Public Health Rep. 1990, 105, 441–446. [Google Scholar] [CrossRef] [PubMed]
  27. Taylor, W.C.; Baranowski, T.; Young, D.R. Physical activity interventions in low-income, ethnic minority, and populations with disability. Am. J. Prevent. Med. 1998, 15, 334–343. [Google Scholar]
  28. Saelens, B.E.; Sallis, J.F.; Black, J.B.; Chen, D. Neighborhood-based differences in physical activity: An environment scale evaluation. Am. J. Public Health 2003, 93, 1552–1558. [Google Scholar] [CrossRef] [PubMed]
  29. Giles-Corti, B.; Broomhall, M.H.; Knuiman, M.; Collins, C.; Douglas, K.; Ng, K.; Lange, A.; Donovan, R.J. Increasing walking: How important is distance to, attractiveness, and size of public open space? Am. J. Prevent. Med. 2005, 28, 169–176. [Google Scholar] [CrossRef] [PubMed]
  30. Rodriguez, D.A.; Brown, A.L.; Troped, P.J. Portable global positioning units to complement accelerometry-based physical activity monitors. Med. Sci. Sports Exerc. 2005, 37, S572–S581. [Google Scholar] [CrossRef] [PubMed]
  31. Berrigan, D.; Pickle, L.W.; Dill, J. Associations between street connectivity and active transportation. Int. J. Health Geogr. 2010. [Google Scholar] [CrossRef] [PubMed]
  32. Humpel, N.; Owen, N.; Leslie, E. Environmental factors associated with adults’ participation in physical activity: A review. Am. J. Prevent. Med. 2002, 22, 188–199. [Google Scholar] [CrossRef]
  33. Kaczynski, A.T.; Henderson, K.A. Environmental correlates of physical activity: A review of evidence about parks and recreation. Leis. Sci. 2007, 29, 315–354. [Google Scholar] [CrossRef]
  34. Almanza, E.; Jerrett, M.; Dunton, G.; Seto, E.; Pentz, M.A. A study of community design, greenness, and physical activity in children using satellite, GPS and accelerometer data. Health Place 2012, 18, 46–54. [Google Scholar] [CrossRef] [PubMed]
  35. Fjørtoft, I. Landscape as playscape: The effects of natural environments on children’s play and motor development. Child. Youth Environ. 2004, 14, 21–44. [Google Scholar]
  36. Bell, J.F.; Wilson, J.S.; Liu, G.C. Neighborhood greenness and 2-year changes in body mass index of children and youth. Am. J. Prevent. Med. 2008, 35, 547–553. [Google Scholar] [CrossRef] [PubMed]
  37. Liu, G.C.; Wilson, J.S.; Qi, R.; Ying, J. Green neighborhoods, food retail and childhood overweight: Differences by population density. Am. J. Health Promot. 2007, 21, 317–325. [Google Scholar] [CrossRef] [PubMed]
  38. Wolch, J.; Jerrett, M.; Reynolds, K.; McConnell, R.; Chang, R.; Dahmann, N.; Brady, K.; Gilliland, F.; Su, J.G.; Berhane, K. Childhood obesity and proximity to urban parks and recreational resources: A longitudinal cohort study. Health Place 2011, 17, 207–214. [Google Scholar] [CrossRef] [PubMed]
  39. Kaplan, R.; Kaplan, S. The Experience of Nature: A Psychological Perspective; CUP Archive: Cambridge, UK, 1989. [Google Scholar]
  40. Hartig, T.; Evans, G.W. Psychological foundations of nature experience. Adv. Psychol. 1993, 96, 427–427. [Google Scholar]
  41. Staats, H.; Kieviet, A.; Hartig, T. Where to recover from attentional fatigue: An expectancy-value analysis of environmental preference. J. Environ. Psychol. 2003, 23, 147–157. [Google Scholar] [CrossRef]
  42. Ulrich, R. View through a window may influence recovery. Science 1984, 224, 224–225. [Google Scholar]
  43. Ulrich, R.S.; Simons, R.F.; Losito, B.D.; Fiorito, E.; Miles, M.A.; Zelson, M. Stress recovery during exposure to natural and urban environments. J. Environ. Psychol. 1991, 11, 201–230. [Google Scholar] [CrossRef]
  44. Kweon, B.S.; Sullivan, W.C.; Wiley, A.R. Green common spaces and the social integration of inner-city older adults. Environ. Behav. 1998, 30, 832–858. [Google Scholar] [CrossRef]
  45. Peters, K.; Elands, B.; Buijs, A. Social interactions in urban parks: Stimulating social cohesion? Urban For. Urban Green. 2010, 9, 93–100. [Google Scholar] [CrossRef]
  46. Kaźmierczak, A. The contribution of local parks to neighbourhood social ties. Landsc. Urban Plan. 2013, 109, 31–44. [Google Scholar] [CrossRef]
  47. Coley, R.L.; Sullivan, W.C.; Kuo, F.E. Where does community grow? The social context created by nature in urban public housing. Environ. Behav. 1997, 29, 468–494. [Google Scholar] [CrossRef]
  48. Kuo, F.E.; Sullivan, W.C. Aggression and violence in the inner city effects of environment via mental fatigue. Environ. Behav. 2001, 33, 543–571. [Google Scholar] [CrossRef]
  49. Kuo, F.E.; Sullivan, W.C. Environment and crime in the inner city does vegetation reduce crime? Environ. Behav. 2001, 33, 343–367. [Google Scholar] [CrossRef]
  50. Forbes. Available online: http://www.forbes.com/pictures/emeg45iikm/1-austin-texas/ (accessed on 13 March 2015).
  51. U.S. Census Bureau. Available online: http://quickfacts.census.gov/qfd/states/48/4805000.html (accessed on 3 June 2015).
  52. BBC Research and Consulting. Comprehensive Housing Market Study: City of Austin; BBC Research and Consulting: Denver, CO, USA, 2009. [Google Scholar]
  53. Givoni, B.; Noguchi, M.; Saaroni, H.; Pochter, O.; Yaacov, Y.; Feller, N.; Becker, S. Outdoor comfort research issues. Energy Build. 2003, 35, 77–86. [Google Scholar] [CrossRef]
  54. Kalkstein, L.; Smoyer, K. The impact of climate change on human health: Some international implications. Experientia 1993, 49, 969–979. [Google Scholar] [CrossRef] [PubMed]
  55. Laschewski, G.; Jendritzky, G. Effects of the thermal environment on human health: An investigation of 30 years of daily mortality data from SW Germany. Clim. Res. 2002, 21, 91–103. [Google Scholar]
  56. Kauffman, G.J.; Brant, T. The role of impervious cover as a watershed-based zoning tool to protect water quality in the Christina river basin of Delaware, Pennsylvania, and Maryland. Proc. Water Environ. Fed. 2000, 2000, 1656–1667. [Google Scholar] [CrossRef]
  57. Timperio, A.; Ball, K.; Salmon, J.; Roberts, R.; Giles-Corti, B.; Simmons, D.; Baur, L.A.; Crawford, D. Personal, family, social, and environmental correlates of active commuting to school. Am. J. Prevent. Med. 2006, 30, 45–51. [Google Scholar] [CrossRef] [PubMed]
  58. Jensen, J.R. Introductory Digital Image Processing: A Remote Sensing Perspective, (3rd ed.); Prentice-Hall Inc: Upper Saddle River, NJ, USA, 2005. [Google Scholar]
  59. The digital numbers from the Landsat 5TM image data were converted to temperature data using the following three steps: (a) converting the digital numbers to radiance values; (b) converting the radiance to temperature as degrees Kelvin; and (c) converting the degrees Kelvin to degrees Celsius.
  60. Americans with Disabilities Act ADA checklist for readily achievable barrier removal. Available online: http://www.adachecklist.org/howto.html (accessed on 17 April 2015).
  61. Wooldridge, J. Introductory Econometrics: A Modern Approach; Cengage Learning: Boston, MA, USA, 2012. [Google Scholar]
  62. Sugiyama, T.; Leslie, E.; Giles-Corti, B.; Owen, N. Associations of neighbourhood greenness with physical and mental health: Do walking, social coherence and local social interaction explain the relationships? J. Epidemiol. Community Health 2008, 62. [Google Scholar] [CrossRef]
  63. Rodrı́guez, D.A.; Joo, J. The relationship between non-motorized mode choice and the local physical environment. Transp. Res. Part D 2004, 9, 151–173. [Google Scholar]

