Article

A Spatial Optimization Model for Sustainable Land Use at Regional Level in China: A Case Study for Poyang Lake Region

1
Research Centre for Environmental and Landscape Ecology, Jiangxi Agricultural University, 1101 Zhimin Road, Nanchang 330045, China
2
Land Use Planning Group, Wageningen University, P.O. Box 47, Wageningen 6700 AA, The Netherlands
*
Author to whom correspondence should be addressed.
Sustainability 2015, 7(1), 35-55; https://doi.org/10.3390/su7010035
Submission received: 7 August 2014 / Accepted: 11 December 2014 / Published: 23 December 2014
(This article belongs to the Section Sustainable Urban and Rural Development)

Abstract

:
Economic growth in China is accompanied by many problems, such as rapid deterioration of the environment and a sharp decline in the area of arable land. China’s current land-use planning system fails to deal with these problems, especially at the regional level. The lack of sustainable spatial allocation at regional level has become a pressing problem. This article aims to: (1) analyze the reason why sustainable land use at the regional level is difficult to achieve under the current Chinese land-use planning system; (2) put forward a regional optimization model for sustainable land use; and (3) explore the usefulness and possibility of the future application of the model in supporting land-use planning. The model has been applied in a case study for the Poyang Lake Region, Jiangxi Province in China. Based on predictions of the demand of land in 2015, three single-objective scenarios were constructed: food production oriented, nature conservation oriented and economic growth oriented. An optimized, multi-objective pattern of sustainable land use was achieved by integrating the three single-objective scenarios. The relevance and applicability of the model were discussed with planning experts and practitioners. The results indicate that the model can contribute to a more sustainable regional land-use planning in China. However, the results also show a need for further research on how to embed wider social and economic aspects in the model.

Graphical Abstract

1. Introduction

Since the start of economic reform in 1978, China has achieved remarkable economic progress. Today, China is among the fastest growing economies in the world, but this growth has not come without a price. The state of the environment in China is deteriorating fast, adversely affecting human health, productivity of land and natural resources. It was estimated that the damage caused by environmental pollution and degradation of natural resources consumes up to 8% of China’s GDP, roughly equal to the annual growth of the country’s economy [1]. Rapid urbanization and industrialization are exacerbating the environmental problems [2,3,4], especially given the enormous scale of these processes [5]. The level of urbanization in China has increased from 17.9% in 1978 to 40.5% in 2003, and is expected to further increase to 50% by the end of 2020 [6]. The food supply cannot meet the domestic demand due to the rapid urbanization [7]. During the 10th Five-Year Plan period (2000–2005), China lost over 6 million hectares of arable land, amounting to 4.7% of the total in 2000. In 2006, arable land reduced to 121.8 million hectares. Moreover, a staggering 10% of the arable land is contaminated due to polluted water, excessive fertilizer use, heavy metals and solid wastes. Heavy metals alone contaminate 12 million tons of grain each year, causing a loss of 20 billion Yuan (2.6 billion US$). Therefore, national targets have been set to ensure food security [8]. The targets are to maintain 120 million hectares of arable land by 2010 and keeping up a 95% self-sufficiency rate by 2030, when the population will stabilize at a projected 1.6 billion people. Land-use planning and environmental management are considered essential to meet these targets and to protect the arable land and natural resources.
During the last decade, a comprehensive regulatory and institutional framework for environmental management and protection has been set up. However, these policies have not been very effective in saving arable land and reducing environmental impacts [9]. The current spatial planning system is unable to manage and guide the process of urbanization. Some important reasons are the ineffective top-down policy and planning, conflicting interests at the different administrative levels, and a lack of engaging relevant stakeholders and the general public [10]. For example, the current land-use planning system puts too much emphasis on quotas rationing, and neglects a proper spatial allocation, especially at the regional level. In order to maximize the benefits from land resources, local governments (the executors of the land-use planning system) often take dramatic steps to pursue urbanization without considering where construction land is being allocated, lacking a proper suitability assessment and assessment of the consequences to other land uses. Therefore, the processes of urbanization do not only waste and destroy other land resources (e.g., arable land), but also damage the ecological environment of cities. In 2006, at the start of the third revision of land-use master plans, the Department of Land and Resources of Jiangxi Province assessed the effectiveness of previous land-use master plans and concluded that the land-use planning system failed to balance urbanization and the protection of arable land and natural resources. One of the key questions the department identified was: How to balance economic development and urbanization on the one hand and to protect arable land and natural resources on the other hand? The Jiangxi Agricultural University in Nanchang started a research project to analyze this problem. The objectives of the project were: (1) to develop a land-use optimization model to support regional land-use planning and allocation; and (2) to apply the model in a case study area. This article describes the approach of the method that has been developed and presents the results of its application in the Poyang Lake Region in Jiangxi Province.

2. Land-Use Master Planning in China

China’s land-use planning system, which initiated from the former Soviet Union, can be characterized as centralized and hierarchical [5]. The land administration law (adopted in 1986 and revised in 1998 and 2004) provides the legal framework for China’s land-use planning system. This land administration includes strong regulations to protect arable land and the environment [11]. The system covers five administrative levels: state, province, city, county and township, and prescribes the establishment of land-use master plans, special topic plans and project plans [11]. The master plans are long-term plans (10 years on average) that determine and balance the size and distribution of the various types of land use. The special topic plans cover specific objectives set by the master plans, and the detailed project plans include specific engineering designs. The land-use master plans, the core of the planning system, are implemented at each of the five administrative levels. The departments and bureaus of land administration are responsible for preparing and organizing the process [11]. Land-use master plans especially aim to protect arable land, manage (restrict) construction land and conserve nature, in order to achieve sustainable land use. Therefore, the master plans have adopted a system of quotas which regulate the area of arable land, construction land, and the conversion of arable land to construction land. Each master plan sets the quotas for a lower level master plan. The quotas are derived from a process of area demands prediction.
In 2004, China started the third round of land-use master plan revision. An assessment of the results of the previous land-use master plans, which were implemented during the 1990s, showed that many of these plans were poorly executed. The master plans failed to guide urban development, especially in the more sensitive areas such as Poyang Lake Region in Jiangxi Province. One reason is that the land-use master plans primarily manage land-use quota (“how much”) and do not provide much guidance to the spatial allocation of new developments (“where”). Consequently, land allocation basically takes place as a bottom-up process at the local level. Coherent, holistic perspectives on spatial development at the regional level (provincial and city level) are lacking.
Moreover, the cooperation between local governments has declined due to the economic reforms in the previous decades. Since 1978, the central government has been decentralizing economic decision making. As a consequence, local governments have transformed from passive regulators in the previous planned economy to entrepreneurial agents that initiate local developments. Under the pressure of economic growth, the local governments usually emphasize on the one-sided pursuit of economic benefits from urban development, neglecting the protection of arable land and natural resources. Local governments tend not to cooperate closely with neighboring administrations. The Jiangxi Province government aims to achieve a more coherent, sustainable land-use planning. Therefore, a more regional, holistic approach is required to guide the future spatial development in the area, especially in the Poyang Lake Region, located north of the province capital city Nanchang. This region is important for its rapid socio-economic development, and it is also one of the main rice growing areas in China [12]. Furthermore, Poyang Lake Region accommodates wetlands of international importance by providing a habitat for many world major migratory birds [13]. From late autumn to early winter, thousands of migratory birds fly from Siberia, Mongolia, Japan, North Korea and the northern parts of China to Poyang Lake for over-wintering [14]. A main challenge in the area is to guide economic development and urbanization on the one hand and to protect arable land and natural resources on the other hand [15]. Given the complexity of the task at hand, the province government expressed the need for supporting tools for the future spatial planning of the region. These tools should allow the design and optimization of a more sustainable land-use allocation at province and city level, providing a framework for the spatial developments at the local level. The framework of such a tool will be described in the next section.

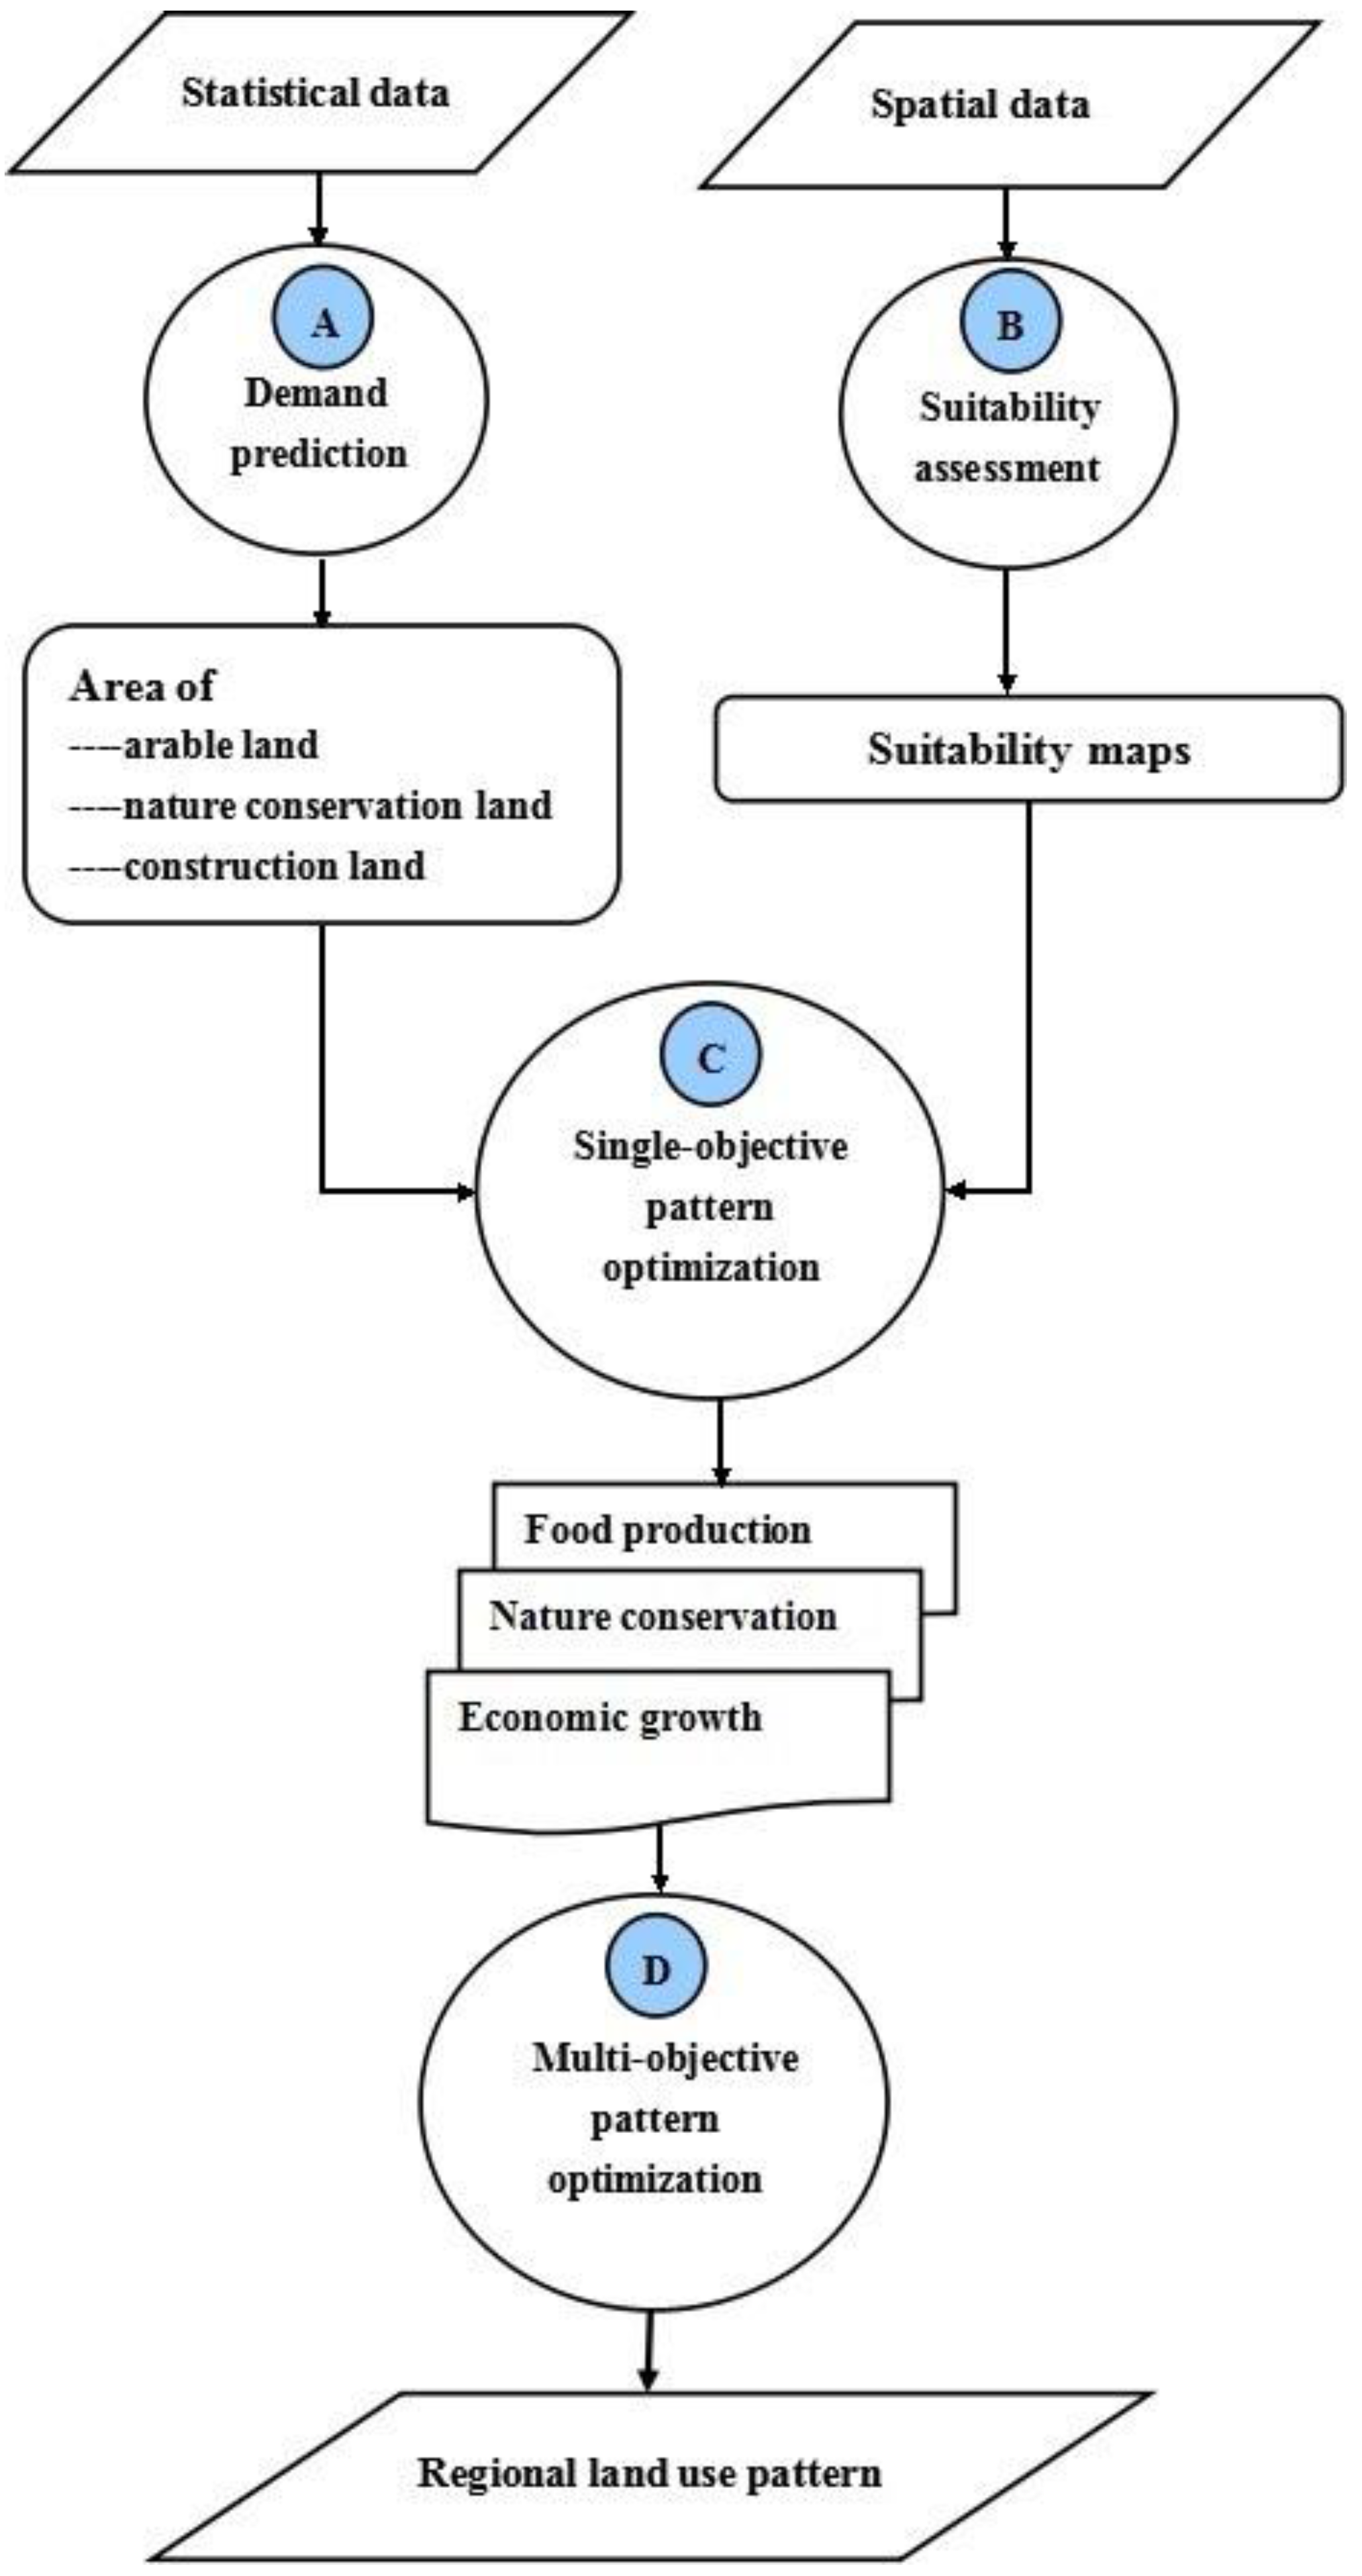
3. A Land-Use Optimization Model

FAO defines land-use planning as “the systematic assessment of physical, social and economic factors in such a way as to encourage and assist land users in selecting options that increase their productivity, are sustainable and meet the needs of society” [16]. In this definition, land-use planning is perceived as a land-use optimization process, based on land assessment and directed by economic and social needs. Land-use optimization, both in size and pattern, is a complex process and a main topic in land-use planning research. As early as in the 1960s, spatial pattern optimization models were put forward. Based on mathematics and statistics, these models tried to incorporate spatial variables in multiple regression models or as land-use conversion probabilities in transition probability matrices. With the progress of computer technology, and especially after the introduction of geographical information systems (GIS), land-use allocation and optimization modelling became more wide-spread [17,18,19,20,21,22]. Land-use optimization models typically involve the optimization of the size as well as the spatial pattern of land use [23]. Today, spatial pattern analysis [24,25,26,27,28] and spatial modelling [29,30,31,32] are widely used. Differences between models are often related to differences in context, purpose and scale of the study area. Two common groups of models are simulation models, which explore possible changes of land use in the near future as a function of driving forces, and descriptive models, which produce alternative, optimized designs for land use, based on biophysical characteristics and socio-economic input and goals [22]. Simulation models focus on spatially explicit simulation of near future land-use patterns, and descriptive models aim to calculate optimal land-use configurations that best match a set of goals and objectives. These two groups of land-use models are fit for optimizing land-use patterns in land-use planning systems characterized as “bottom-up” (participatory planning). Since these characteristics, input and goals usually vary over space and time, most models are context specific and cannot be universally applied. The land-use planning systems in many developing countries, such as China, were initiated from the former Soviet Union and can be characterized as “top-down”. Although land-use optimization is very relevant for deriving more sustainable land-use master plans, the present models are not well equipped to deal with the Chinese context. Therefore, a land-use optimization model was constructed that deals with the specific Chinese planning context. The model aims to support the spatial planning of future land use at the province and city level, by providing guidance to municipal governments in their process of allocating the amount of arable land, construction land and land for nature conservation, in view of the Chinese land-use quota system. The model uses GIS-based multi-criteria techniques to assess the land suitability, which are commonly applied in land-use optimization processes [33,34]. The flow chart of the model is presented in Figure 1.
Figure 1. Flow chart of the land-use optimization model.
Sustainability 07 00035 g001
The model includes four basic steps. In the first step, the demand for arable land, construction land and land for nature conservation in a target year are predicted using statistical data (Step A). The second step includes a suitability assessment (Step B). In Step C, three land-use scenarios are developed that provide three perspectives for single-objective pattern optimization. The last step involves a multi-objectives pattern optimization process, with special emphasis on spatial analysis and relationships, resulting in an integrated land-use allocation map (Step D). Moreover, the model and results were assessed by governmental officials and experts from planning practice. The four steps and the model assessment are explained in more detail in the next sections.

3.1. Step A Demand Prediction

The arable land demand is predicted based on the theory of land carrying capacity [35,36]. It starts with predicting the population size and the consumption of rice, as a strategic commodity, in a region in a given target year. The rice productivity per hectare is estimated by modelling the historical rice production trend using statistical data. The arable land demand in the target year is then calculated as:
y = x1/x2/x3
where x1 is the total rice consumption (in tons), x2 the average rice production (in tons/ha) and x3 the ratio of rice to other food products. The import or export of rice is included as percentage decrease or increase in arable land demand, estimated based on the historical trend derived from statistical data.
The current Chinese land-use regulation system is primarily based on productive land. Despite the need to preserve land for nature conservation (see introduction section), the land-use quota system does not incorporate procedures for land to be allocated as such. Therefore, in the model three land-use types from the land-use regulation system are selected to represent areas with a high potential for nature conservation. These are forests, water bodies and grassland. Allocating land as forests, water bodies and grassland supports bio-productivity goals, such as fruit, fuel wood, timber, hay for cattle and fishing grounds, which are included in the current system. The land demand for forest, water and grassland is predicted using the principle of Ecological Footprint (EF). EF represents the human demand on bio-productivity [37], by assessing how much biologically productive land and water area are required to uphold the consumption of a given human population [38]. EF is calculated by estimating the consumption of resources in terms of mass units and transforming these mass units into an area of required land [23,39]. The formula used in the model is:
EF = i = 1 n ( C i / P i )
where Ci is the consumption per capita of product i in kg/year, Pi is the regional productivity of product i in kg/ha/year. Based on a trend analysis of the EF for grassland, forest and water, a linear regression model is calculated with year as dependent variable and footprint as independent variable. The land demand in the target year is calculated as the estimated EF multiplied by the estimated population. An extra 12% is added for reasons of biodiversity protection, according to the proposal of the World Commission of Environment and Development (WCED) [38].
The demand for urban and rural construction land is estimated using land-use standards of the Ministry of Construction, published in the “Classification of land use and norms of city planning” (1990) and “Standard of township planning” (1994). The required area of construction land is derived by multiplying these standards per capita by the estimated population in the target year.

3.2. Step B Suitability Assessment

The frame work for land evaluation of the FAO [40] is used as guideline for the land-use suitability assessment. The guideline provides principles and procedures for the qualitative evaluation of the suitability of land for alternative uses based on biophysical, economic and social criteria. The procedures include the appraisal and grouping of specific areas of land in terms of their suitability for defined uses [40]. The spatial data for the suitability assessment include a land-use, soil, landform and elevation map. The first step of the suitability assessment involves the identification of unsuitable areas, such as built-up area and surface water, and restricted areas, such as nature reserves and military areas. For the remaining areas, a land suitability assessment along the FAO framework is carried out by choosing the limiting factors determining the land suitability [33]. The suitability class of an area is determined by the factor with the lowest suitability class (the limiting factor) (Table 1). The selected factors are: slope gradient, soil parent material or mother rock, soil organic matter content, and landform. Suitability maps for arable land (including paddy field and dry land), forest and grassland are created using four suitability classes: high suitable, moderate suitable, low suitable and unsuitable.
Table 1. The suitability assessment factors and classes.
Limiting factorsLimiting classSuitability class of each land use
codeclassification criterionPaddy fieldDry landForest landGrassland
Slope (P)P0<2°1111
P12°–5°2111
P25°–15°2212
P315°–25°3323
P4>25°4434
Soil parent material (R)R0sediment1111
R1Limestone/sandstone2211
R2conglomerate3323
R3carbonatite4323
Soil organic matter (O)O0>3%1111
O12%–3%2111
O21%–2%3222
O30.6%–1%4323
O4<0.6%4434
Landform (T)T0plain1111
T1Sloping-land2211
T2Low-hill2211
T3High-hill3322
T4Low-mountain4422
T5Moderate-mountain4433
Note: Suitability classes are: 1 = High suitability; 2 = Moderate suitability; 3 = low suitability; 4 = Unsuitable.

3.3. Step C Single-Objective Pattern Optimization

In Step C, three land-use scenarios are designed, respectively aiming at food security, nature conservation and economic growth, in a process of single objective pattern optimization. A scenario is defined as a set of land conversion rules that determine the conversion from one type of land use to another in the process of pattern optimization. The rules are tailored to the Chinese policy context.
The conversion rules for the food production scenario are presented in Table 2. Due to China’s national arable land protection policy the conversion rules with respect to arable land conversion are more stringent than those of other land-use types. Conversions are restricted to suitability class 4 areas. The category non-developed land in Chinese classification system is defined as currently unutilized land, for example unused areas that are less accessible by existing infrastructure.
Table 2. Conversion rules for the food production scenario.
ToArable landForest
From
Arable landN.A.Unsuitable for arable land;
High suitability for forest;
Low ecosystem robustness;
Landform: Mountain
Non-developed landHigh or moderate suitability for arable land; Low or moderate flood riskN.A.
The land-use conversion rules for the nature conservation scenario are shown in Table 3. In order to increase the ecosystem robustness optimally, an additional rule for all conversions is that the converted area should have a low robustness. The ecosystem robustness is derived from data published by the Department of Land and Resources (2005) that classifies robustness of areas in three categories: high, moderate and low robustness.
Table 3. Conversion rules for the nature conservation scenario.
ToForestGrasslandWater
From
Arable landUnsuitable for arable land;
High suitability for forest;
Landform: mountain
Unsuitable for arable land;
High suitability for grassland
Unsuitable for arable land;
Distance to lake <500 m;
Slope 0–2°;
Landform: plain
ForestN.A.N.A.Unsuitable or low suitability for forest;
Distance to lake <500 m;
Slope 0–2°;
Landform: plain
GrasslandN.A.N.A.Unsuitable or low suitability for grassland;
Distance to lake <500 m;
Slope 0–2°
Landform: plain
Non-developed landHigh or moderate suitability for forest;
Landform: mountain
High or moderate suitability for grasslandDistance to lake <500 m;
Slope 0–2°;
Landform: plain
The conversion rules for the economic growth scenario are presented in Table 4. The growth rates in an area are derived from a trend analysis of economic growth in the administrative units, using the GDP per capita and the GDP growth rate.
Table 4. Conversion rules for the economic growth scenario.
ToConstruction land
From
Arable landUnsuitable for arable land;
High economic growth rate;
Landform: plain, lowland or lower hilly land
GrasslandUnsuitable or low suitability for grassland;
High or comparatively high economic growth rate;
Landform: plain, lowland or lower hilly land
ForestUnsuitable or low suitability for forest;
High or comparatively high economic growth rate;
Landform: plain, lowland or lower hilly land
Non-developed landHigh or comparatively high economic growth rate;
Landform: plain, lowland or lower hilly land

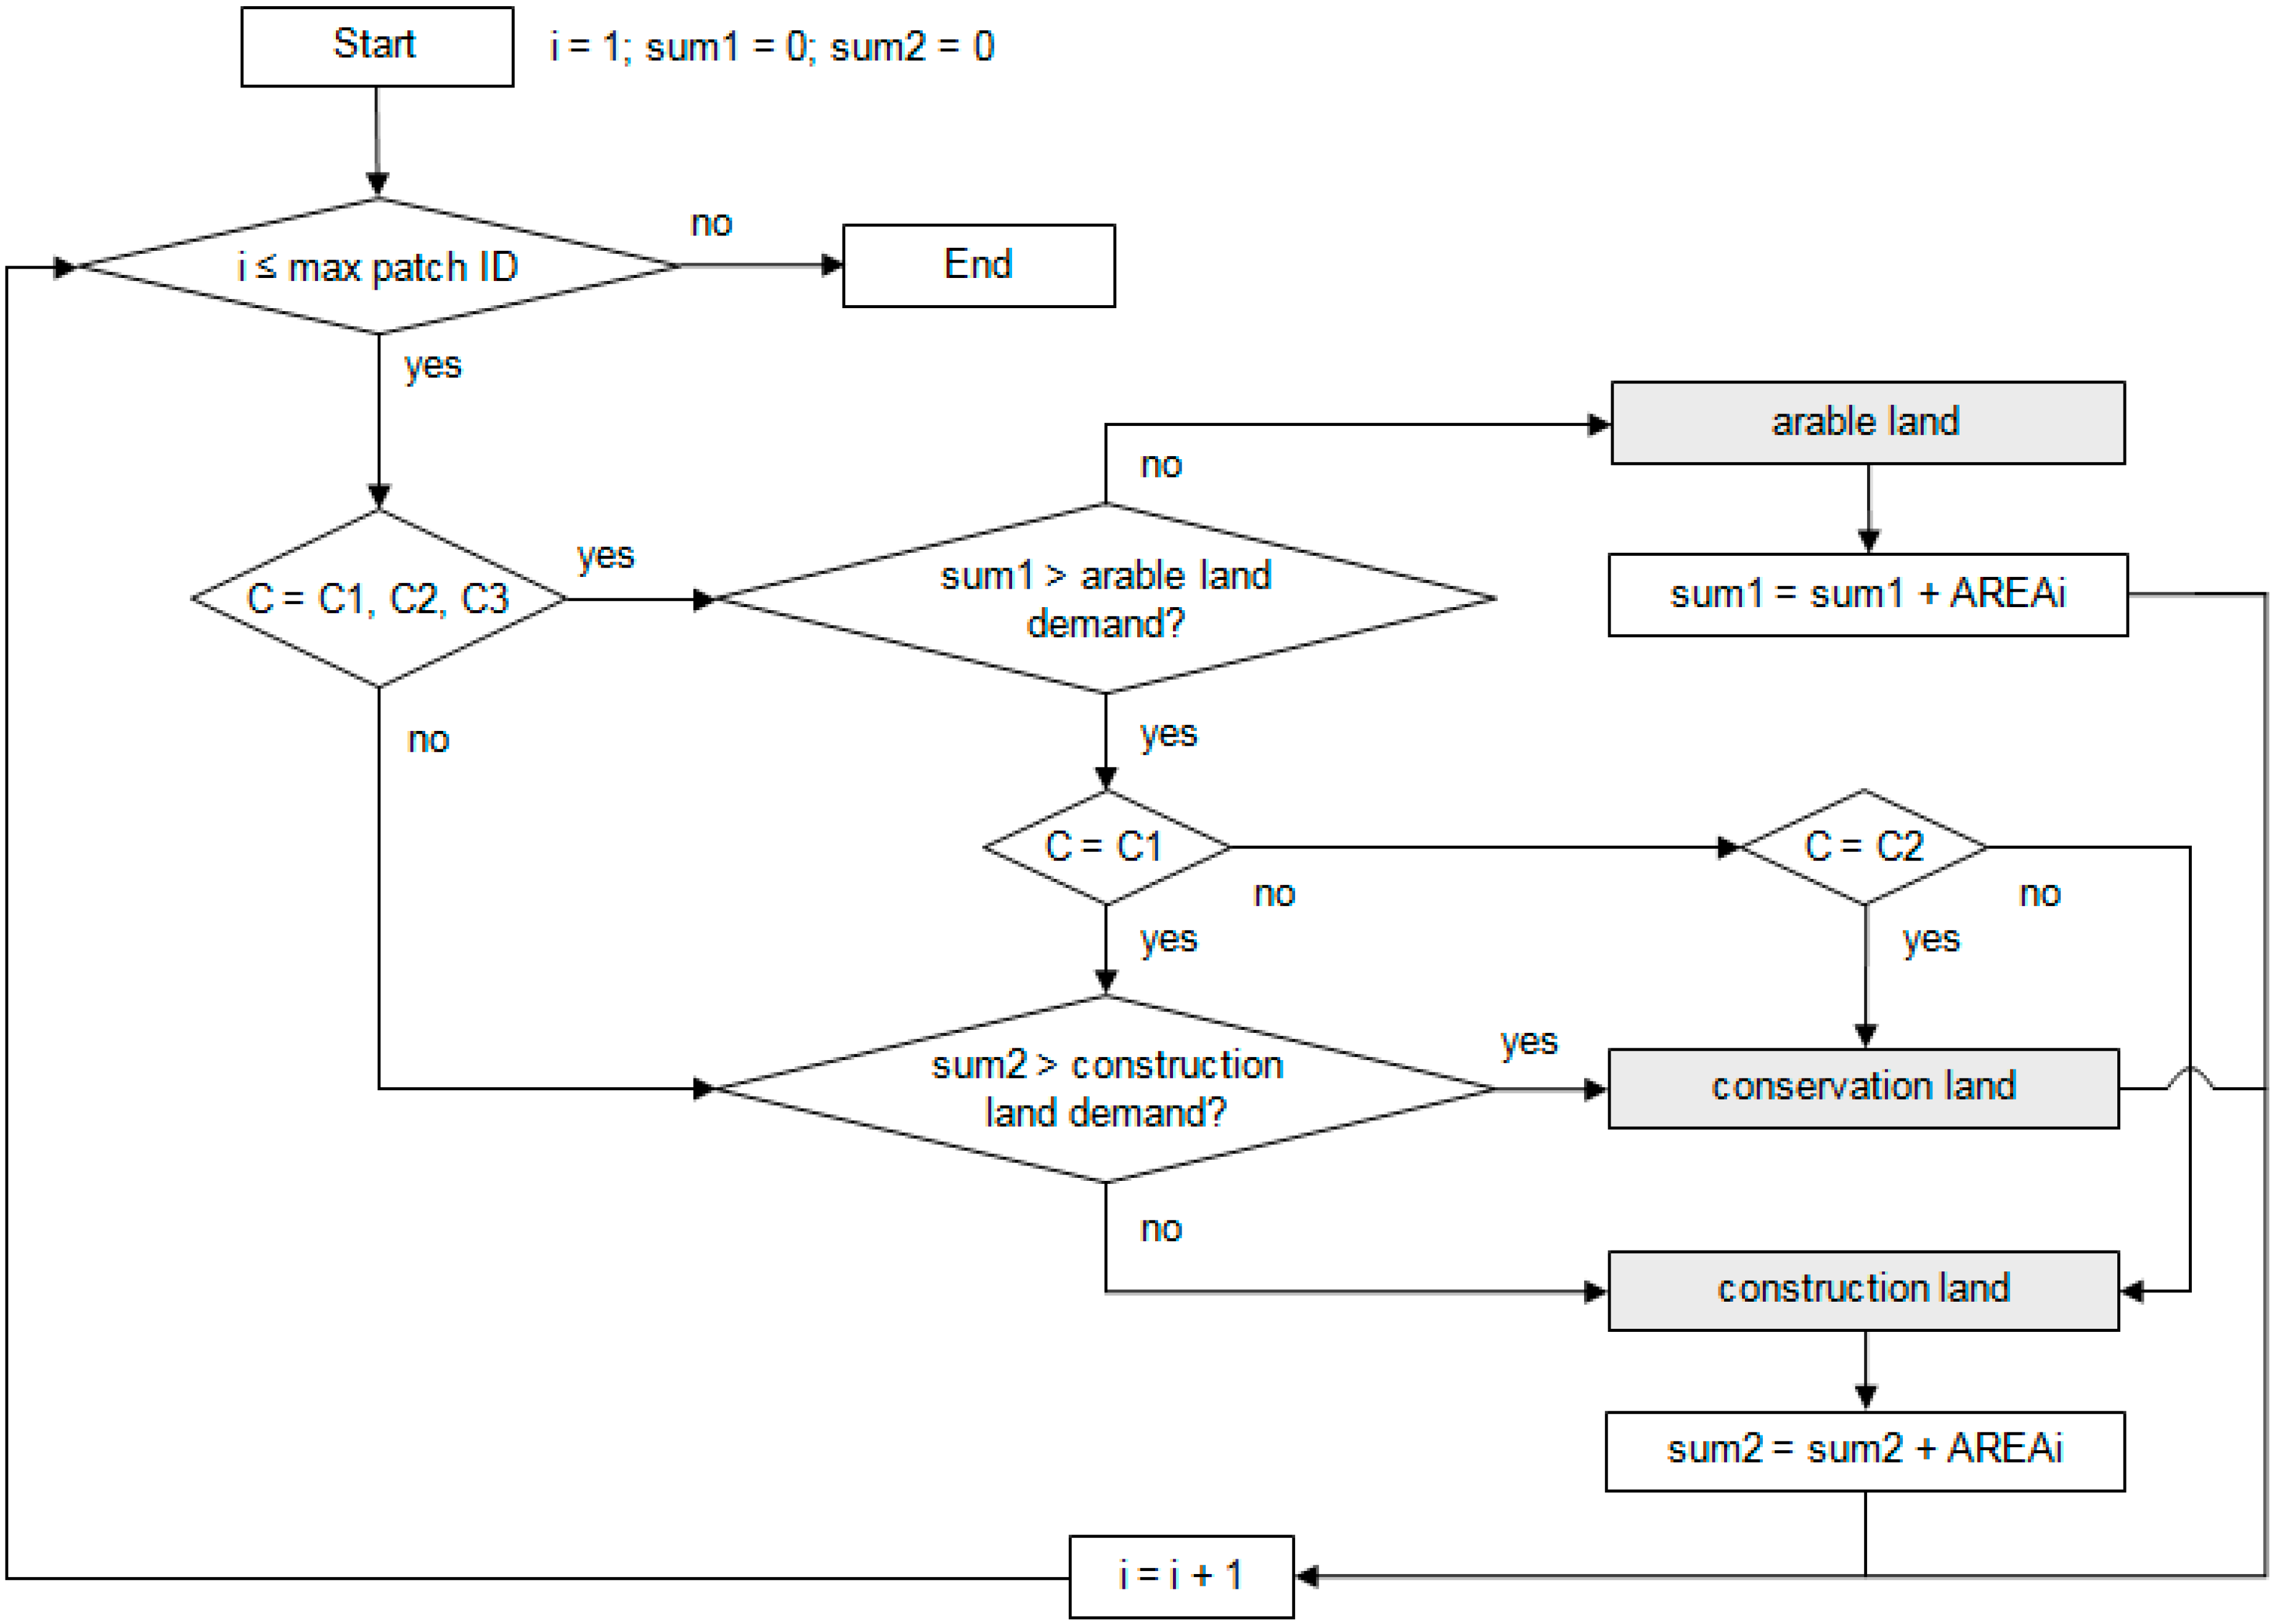
3.4. Step D Multi-Objective Pattern Optimization

The multi-objectives pattern optimization process is conducted by a spatial analysis with ArcGIS 10.0. The first part involves an overlay of the three single-objective optimization maps to identify the conflicting land-use patches. Patches are defined as mosaics of smaller landscape entities with a (relatively) homogenous type of land use compared to its surroundings. The term originally stems from landscape ecology [41]. The land-use patches are separated into two groups: patches with conversion conflicts (class one) and those without (class two). For class one patches a distinction is made between the type of conflict, i.e., a triple conflict between arable land, nature conservation land and construction land (C1) or a double conflict between arable land and construction land (C2), arable land and nature conservation land (C3), or nature conservation land and construction land (C4).
In the second part of the spatial analysis, the total area of class two patches (without conflicts) is compared with the land-use demand prediction to identify if the demand in the target year is met. If the area of class two patches is less than the demand, class one patches are assigned to arable, nature conservation or construction land. The rank order for this stepwise allocation process is derived from priorities as laid down in Chinese land management policy and regional policy objectives. Figure 2 shows the flow chart of the process, using the priority ranking of the case study Poyang Lake Region. In this example, protecting arable land to safeguard food security was given the highest priority, construction land a second priority and nature conservation the lowest priority (see also the discussion section). The class one patches that are most suitable for arable farming are assigned to arable land, until the land demand is met. Afterward, the patches that most suitable for construction are assigned to construction land. When the demand for construction land is met, the remaining land is assigned to conservation land. The algorithm is implemented in SQL.
Figure 2. Optimization flow chart. With i = patch ID, max patch ID = maximum number of patches, sum1 = total allocated area of arable land, sum2 = total allocated area of construction land, C1 … C4 = allocation conflicts (text), and AREAi = area of patch i. The optimization sequence is from top-left to bottom-right.
Sustainability 07 00035 g002

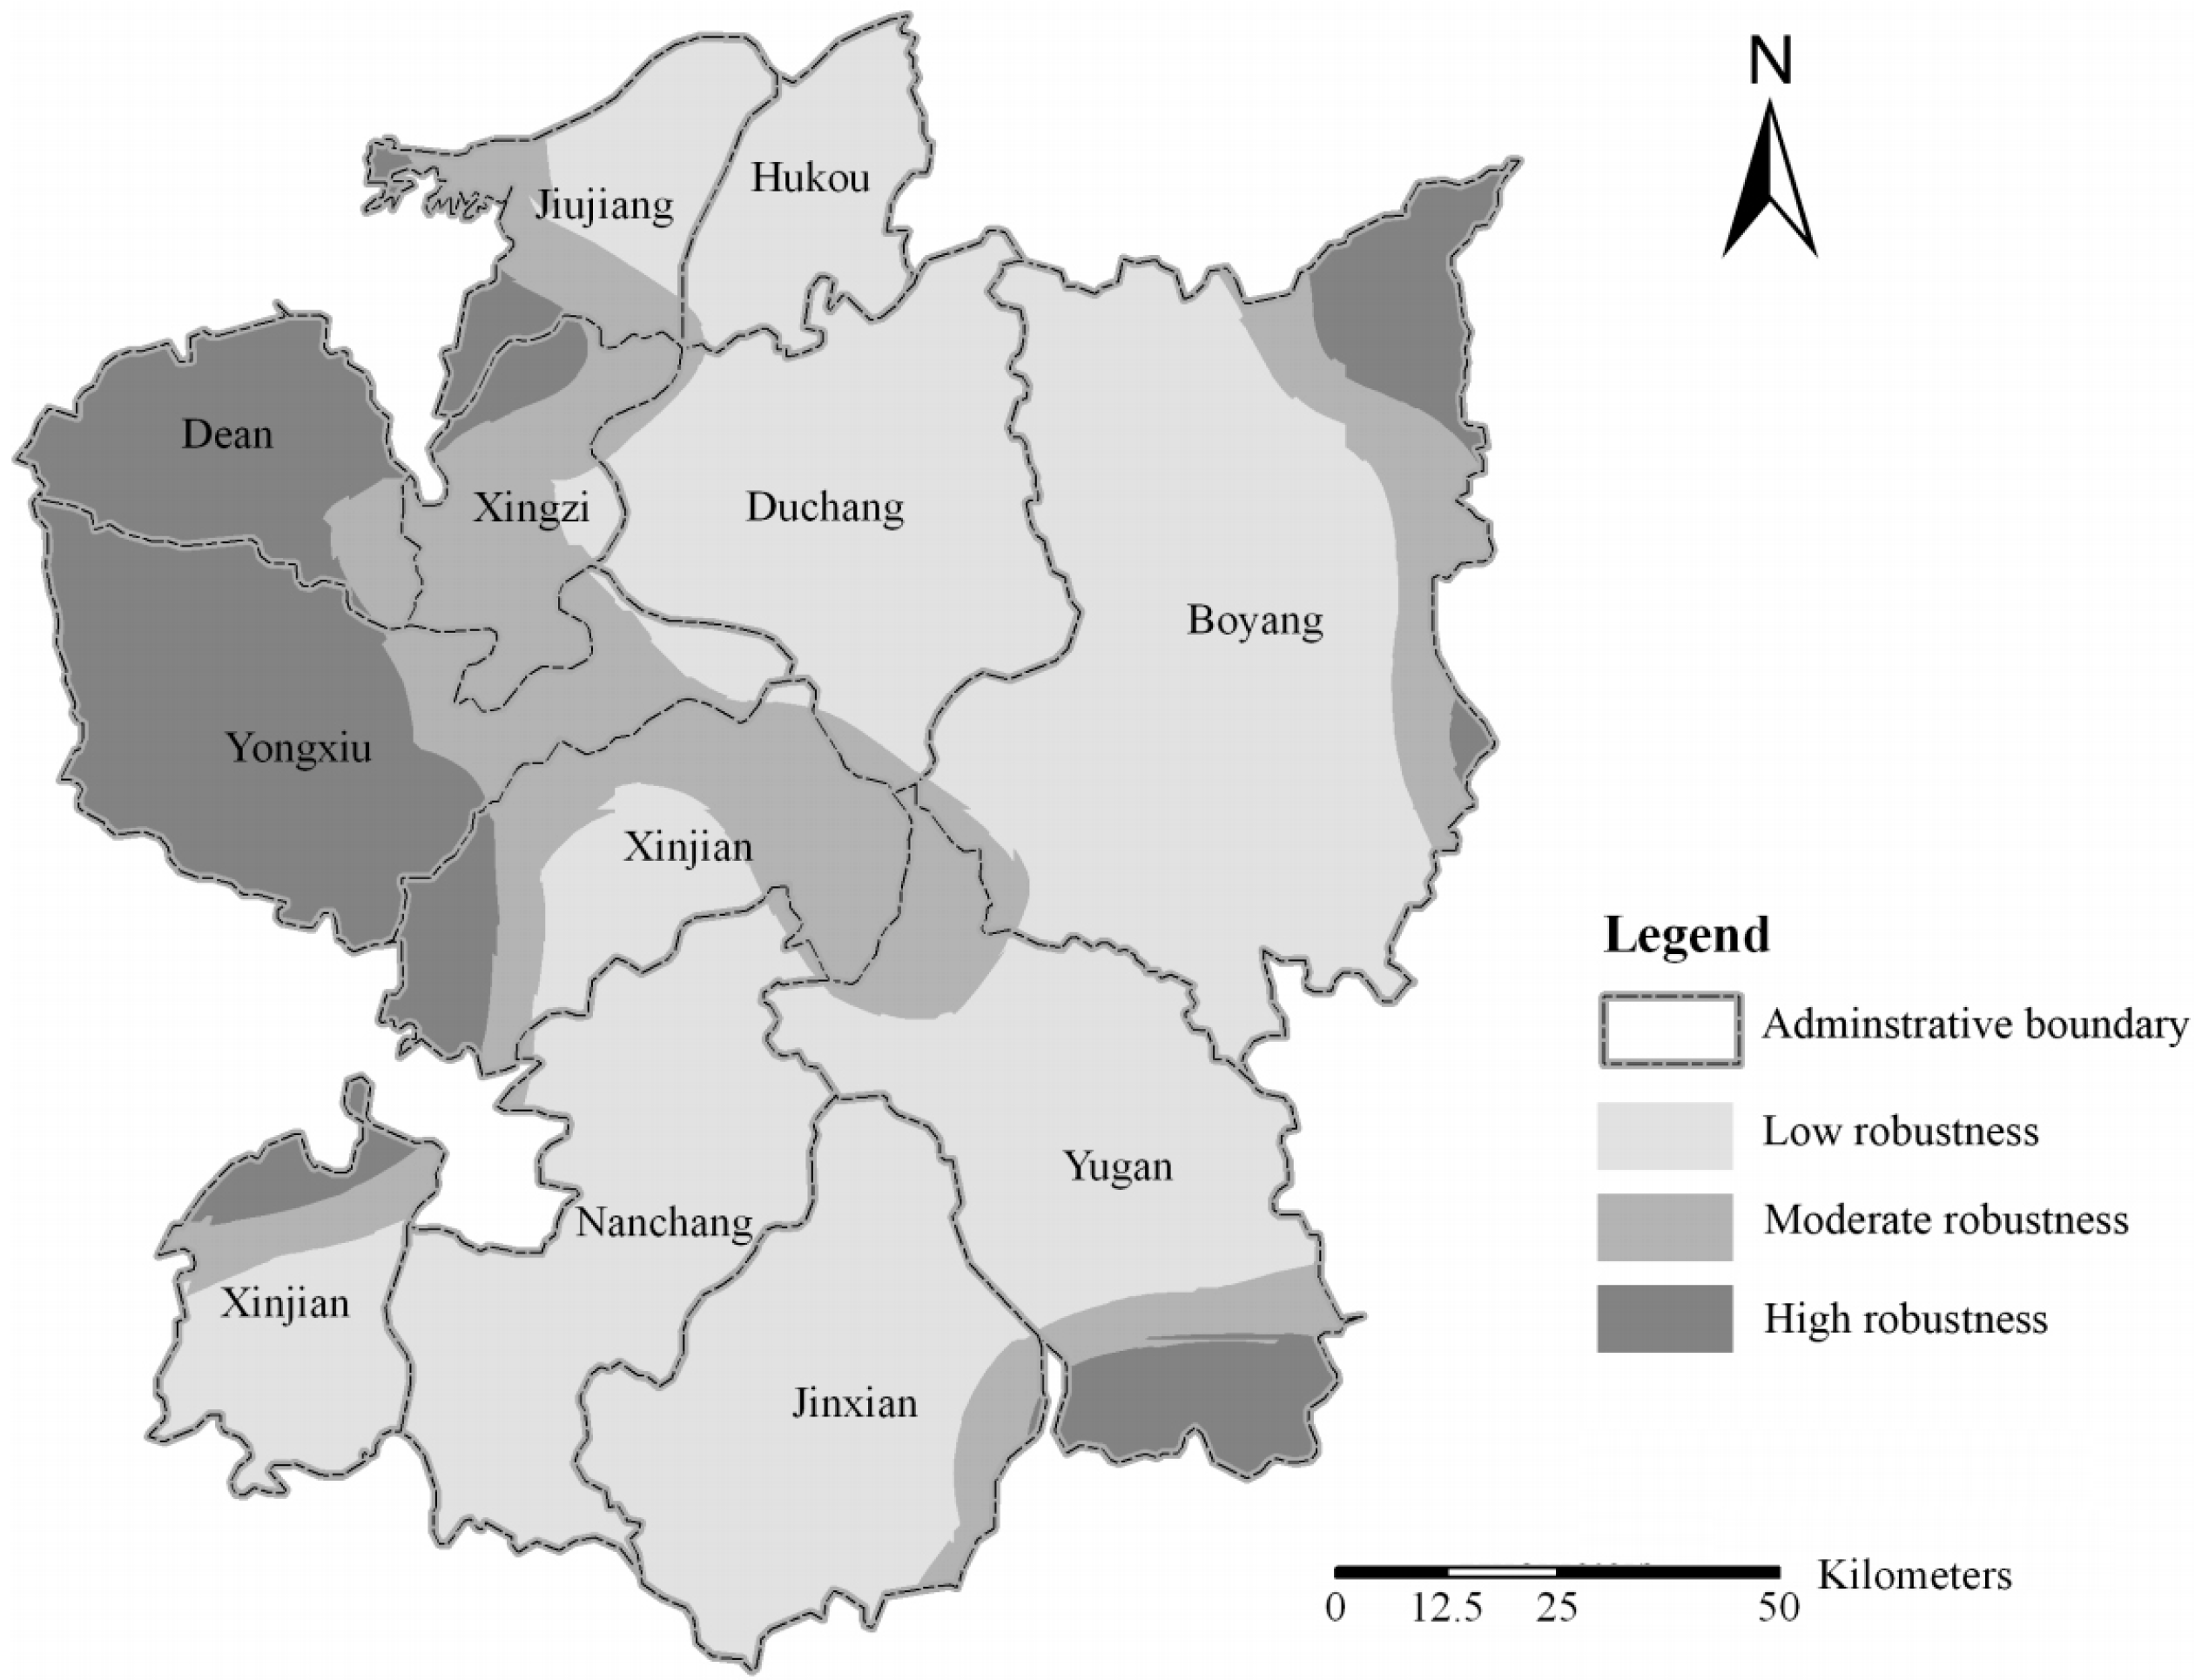
3.5. Model Assessment

The relevance and applicability of the model were assessed in a workshop with 12 invited experts and planning practitioners, including three experts from a university and research institute, three representatives from the provincial level government and six representatives from local governments in Poyang Lake Region. During the workshop, the model and results were presented and discussed.

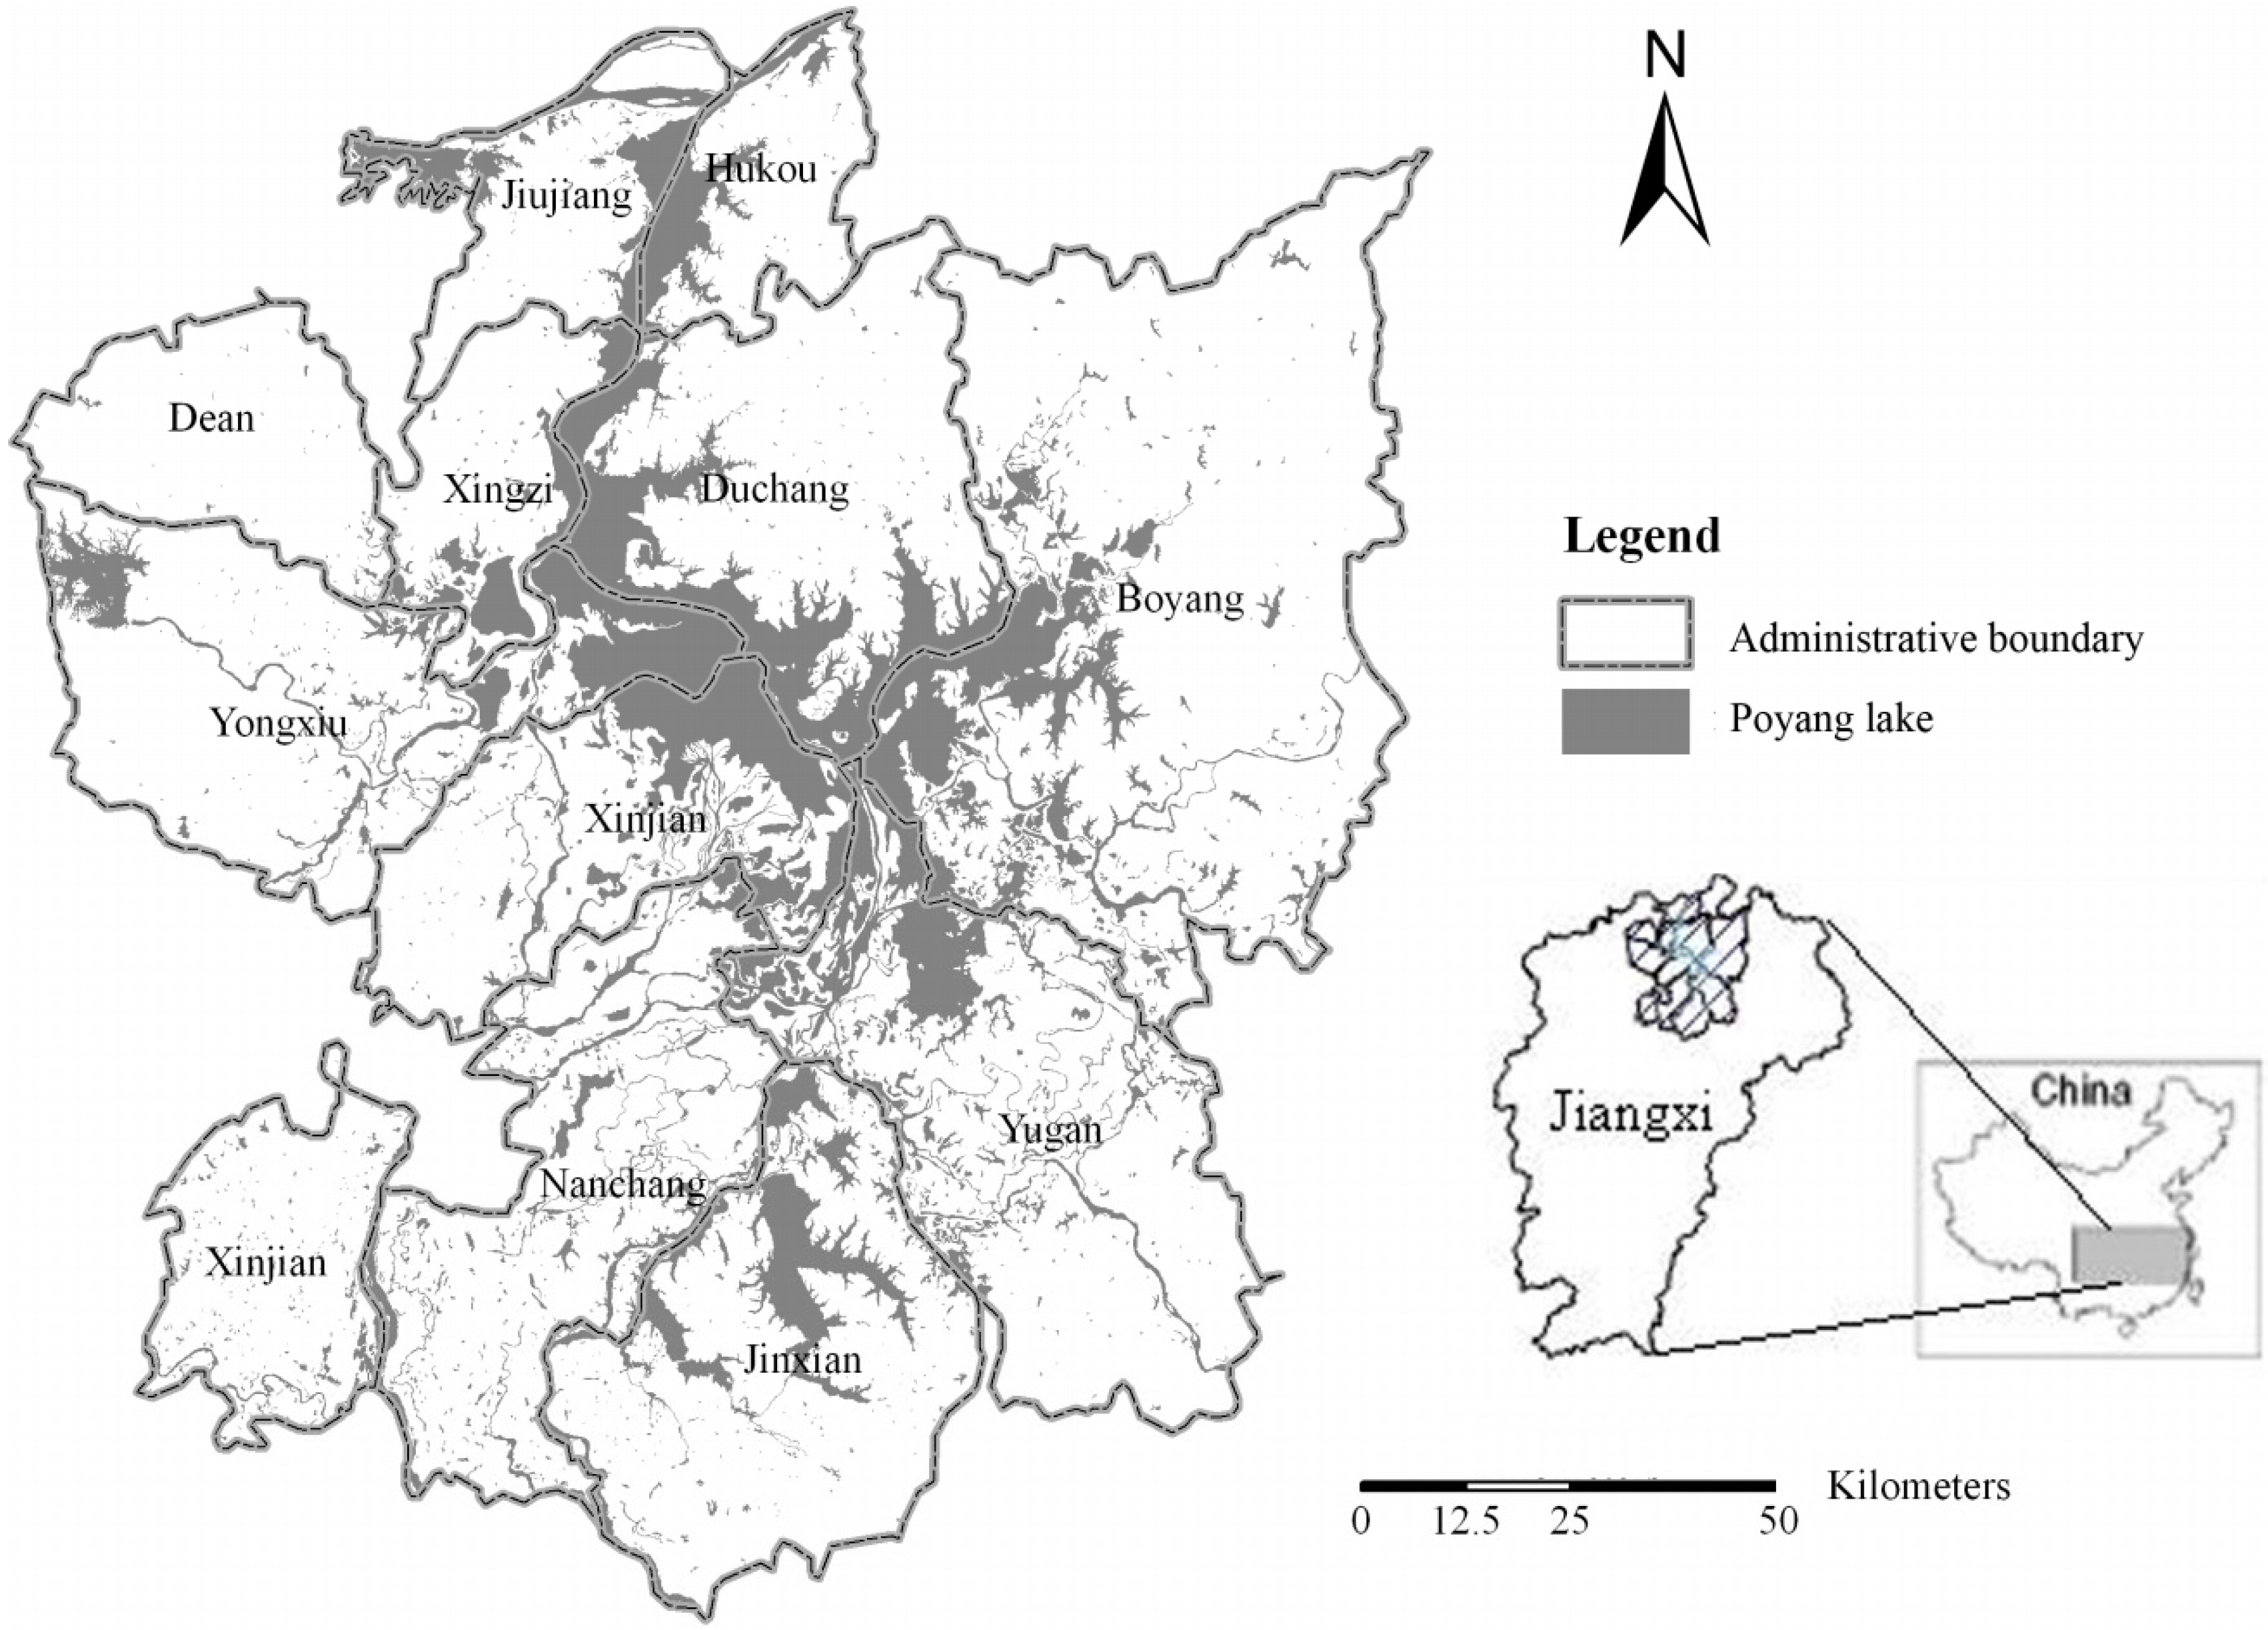
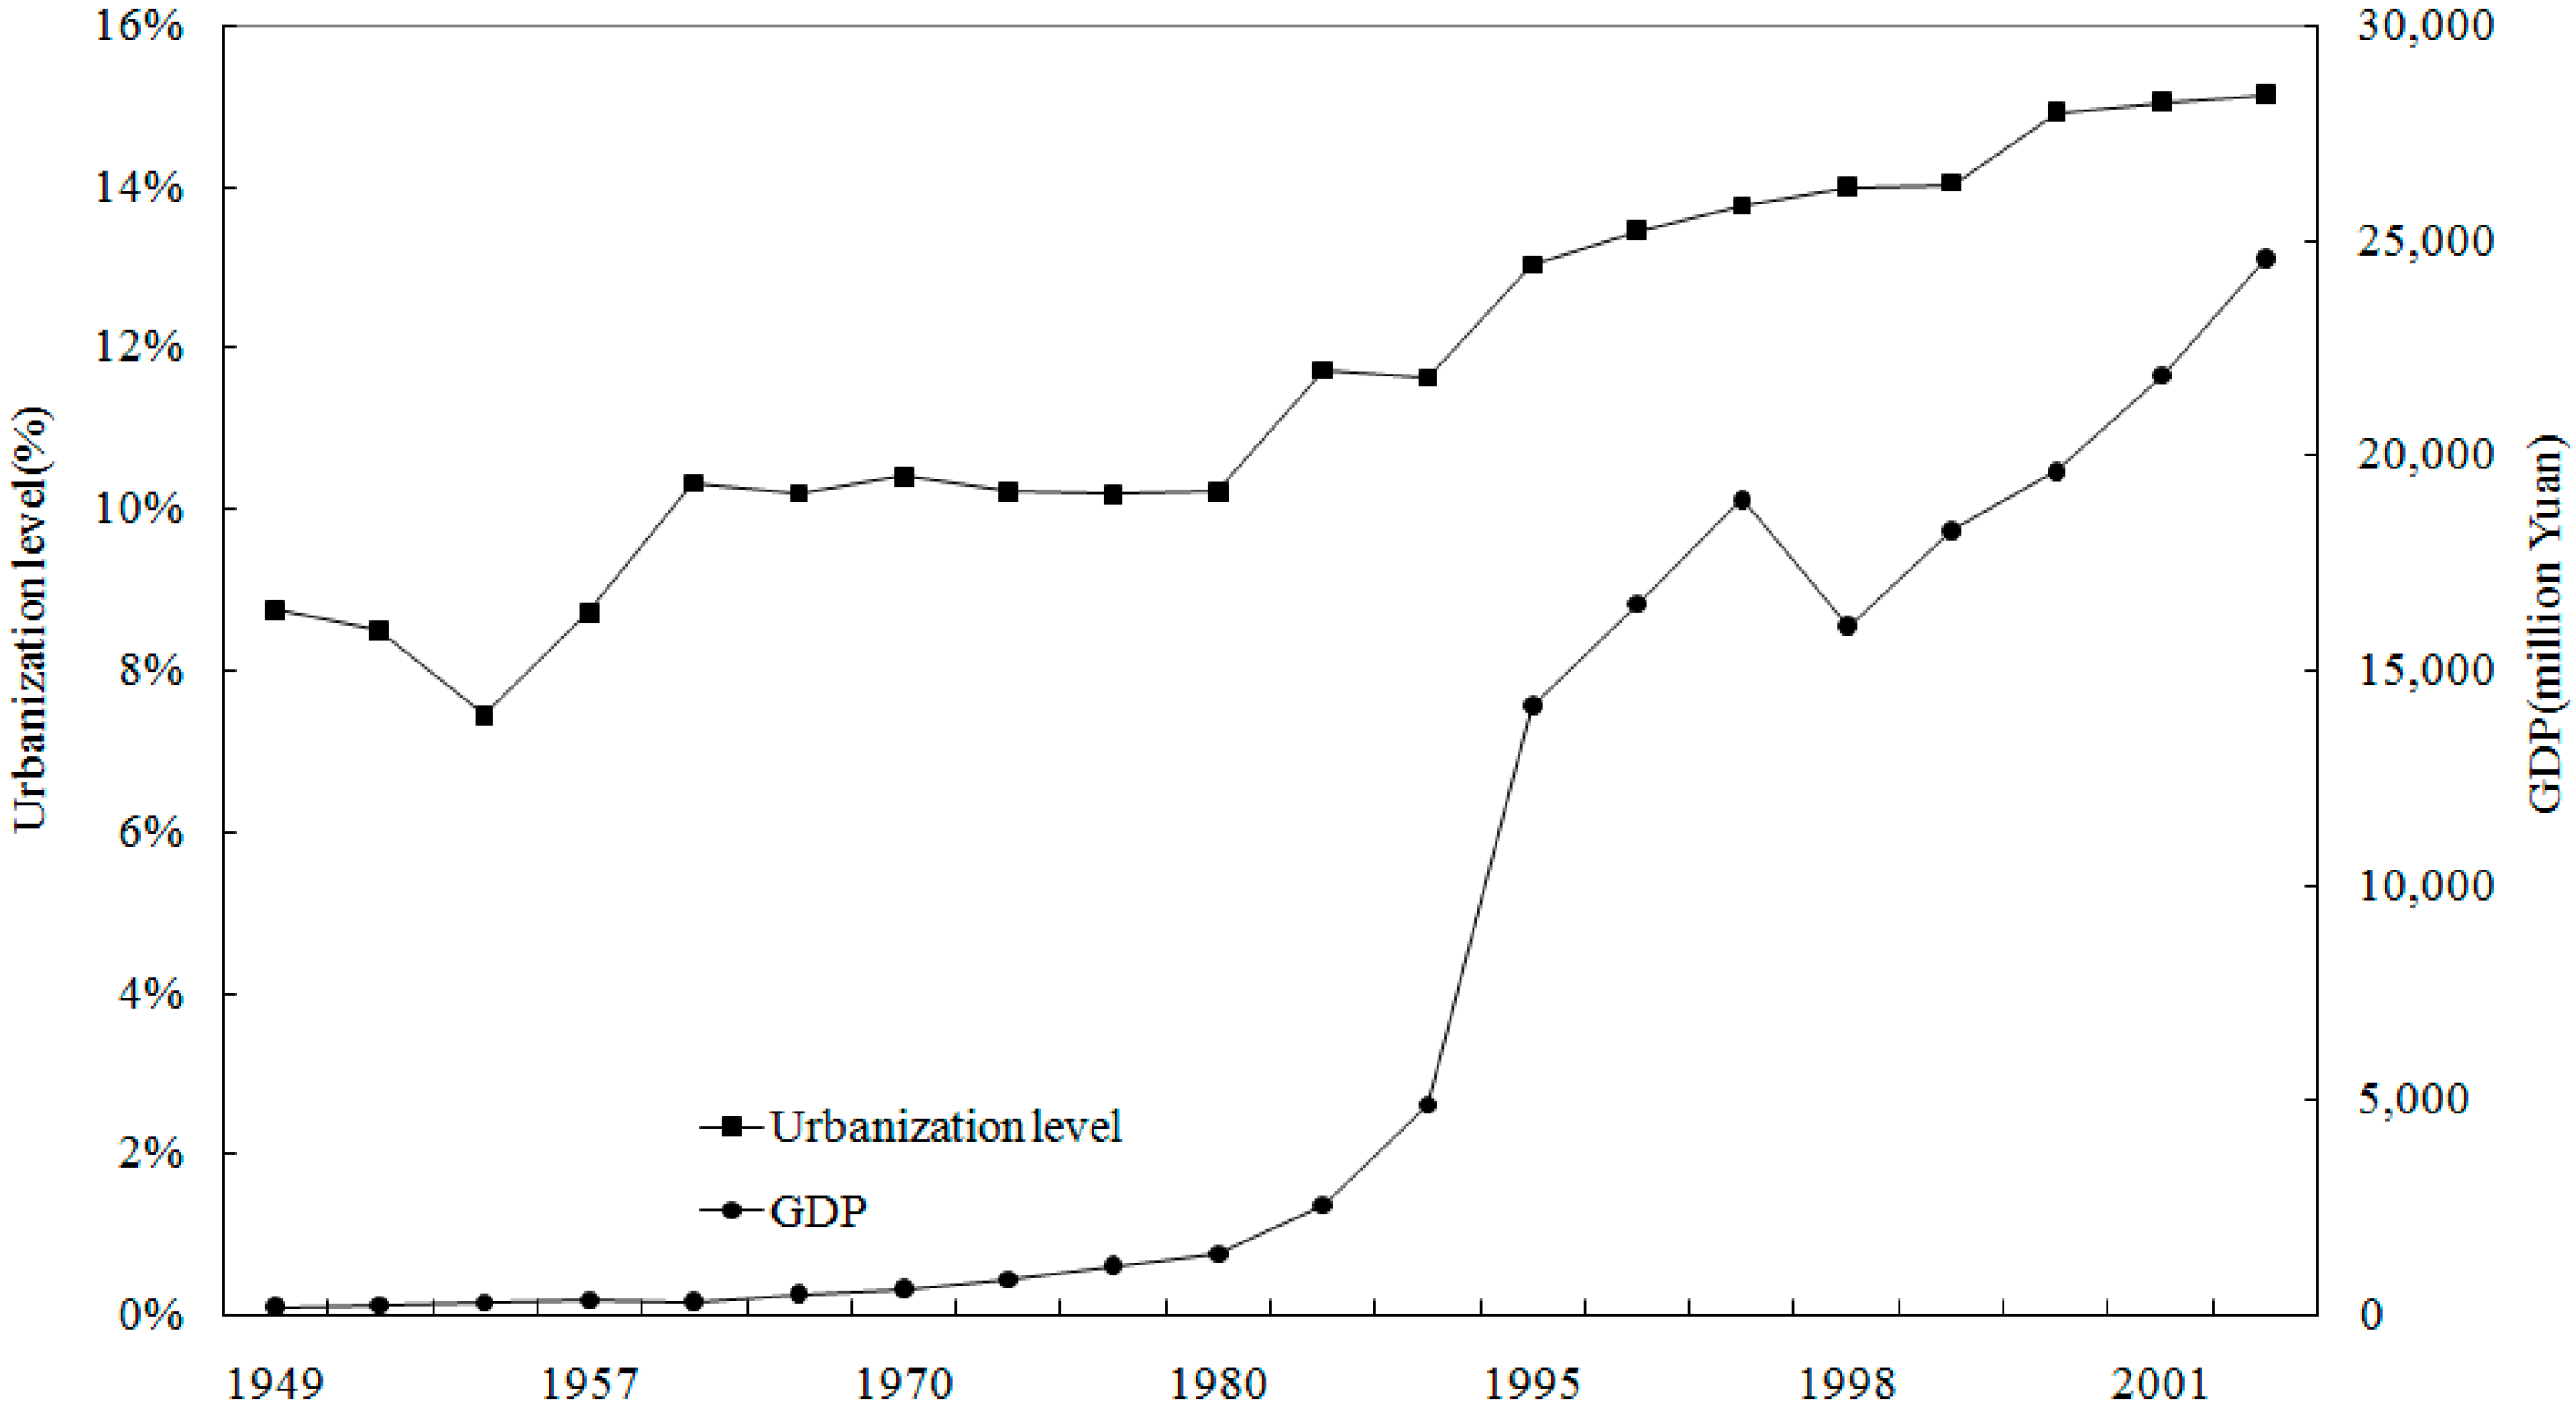
4. Case Study Area: Poyang Lake Region

Poyang Lake is located in the north of Jiangxi province and is the largest fresh-water lake in China. Extensive alluvial plains with low elevation are bordering Poyang Lake, while mountainous areas are located farther away. Five major rivers, the Gan, Fu, Xin, Rao and Xiu, flow into the lake, which has a narrow outlet in Duchang country to the Yangtze River (Figure 3). Poyang Lake Region includes 10 administrative counties (Nanchang, Xinjian, Jianxian, Yugan, Boyang, Duchang, Hukou, Xinzi, Dean, Yongxiu) and one district (JiuJiang). The region covers an area of 19,882 km2 or 11.9% of Jiangxi province. The area has a warm and wet land climate, with an average temperature of 17 °C and annual precipitation of 1426 mm.
Figure 3. Location of the study area (Poyang Lake Region).
Sustainability 07 00035 g003
Poyang Lake Region is one of the main rice growing areas in China, and plays an important role in national food security. Its agriculture and land exclamation date back to the Qin dynasty (221 BC). During the Tan Dynasty (618 AD), the area became known as the “homeland of rice and fish”. The foundation of New China (1949) gave a boost to land exclamation, with the political programs of “agriculture cooperation” and “people’s communization”. The area of arable land peaked in 1952, but has been shrinking since 1980 due to the process of accelerating industrialization and urbanization. At present, arable land covers 45.5% of the area, but is expected to decrease further in the future, endangering the national food security [42,43]. Poyang Lake Region is also an area with great ecological significance. It nurtures a rich biodiversity because of the exceptional wetland landscape. There are over 4000 flora and 900 fauna species of which more than 100 species are nationally protected. The area is a haven for migratory birds in China and has great significance for nature conservation in the middle and lower sections of the Yangtze River. After the flooding in 1998, the largest ever recorded in history, people started to realize that environmental deterioration is a great threat to the sustainable development of the Poyang Lake Region. A land-use policy named “returning arable land to natural habitat” was adopted in the region that aims to return arable land of poor quality into forest, water and grassland again.
Furthermore, Poyang Lake Region is a densely populated area, with 6.8 million inhabitants in 2002, accounting to 15.8% of that of Jiangxi province, but with a relatively low GDP of 25 billion Yuan (3.3 billion US$), only 9.5% of that of Jiangxi province (Figure 4). The rapid economic growth since 1990, although less than the average economic growth in China, will require further expansion of construction land.
Figure 4. GDP and urbanization level of Poyang Lake Region (1949–2002).
Sustainability 07 00035 g004
The regional government is taking measures to control urban development. For example, in each administrative area the amount of construction land reclaimed from arable land, is not allowed to exceed the amount of arable land reclaimed from non-developed land. However, these measures are not very successful as they merely build upon the land-use quota system and cannot guide spatial development well. A coherent, holistic perspective for the spatial development of Poyang Lake Region to guide the local governments in their land allocation process is missing. This makes Poyang Lake Region an ideal case study area for applying the model.

5. Results

A geo-database containing spatial and statistical data has been set up, including land-use and administrative boundary maps of 2005, a soil map from the soil inventory of 1985, a general landform map and a raster DEM (digital elevation model). The vector maps are at 1:50,000 scale while the raster DEM has a 30 × 30 m resolution. The statistical data were derived from annually published statistical reports of the 10 counties and city district. The results of the four steps of the model (Figure 1) and the model assessment will be described in the next sections. The year 2015 was chosen as the target year, in line with China’s current land-use master plan.

5.1. Demand Prediction

The arable land demand in 2015 was calculated to be 798,600 ha, including 20% for rice export outside the region as derived from statistics. The land demand is 12% less than the 904,850 ha in 2005. The reason for this is that currently unsuitable area, such as mountainous land, is kept into production for arable farming, while the model allocates more suitable land in the flatter parts of the region. Consequently, the required production can be realized with a smaller area of arable land.
The land demand for nature conservation in 2015 was estimated to be 168,692 ha for grassland, 282,939 ha for forest and 418,606 ha for surface water, totaling 870,237 ha. In 2005 these areas were 69,559 ha for grassland, 495,002 ha for forest and 378,720 ha for surface water, totaling 943,281.
The demand for urban and rural construction land in 2015 was calculated to be 69,900 ha, based on land-use standards issued by the Ministry of Construction.

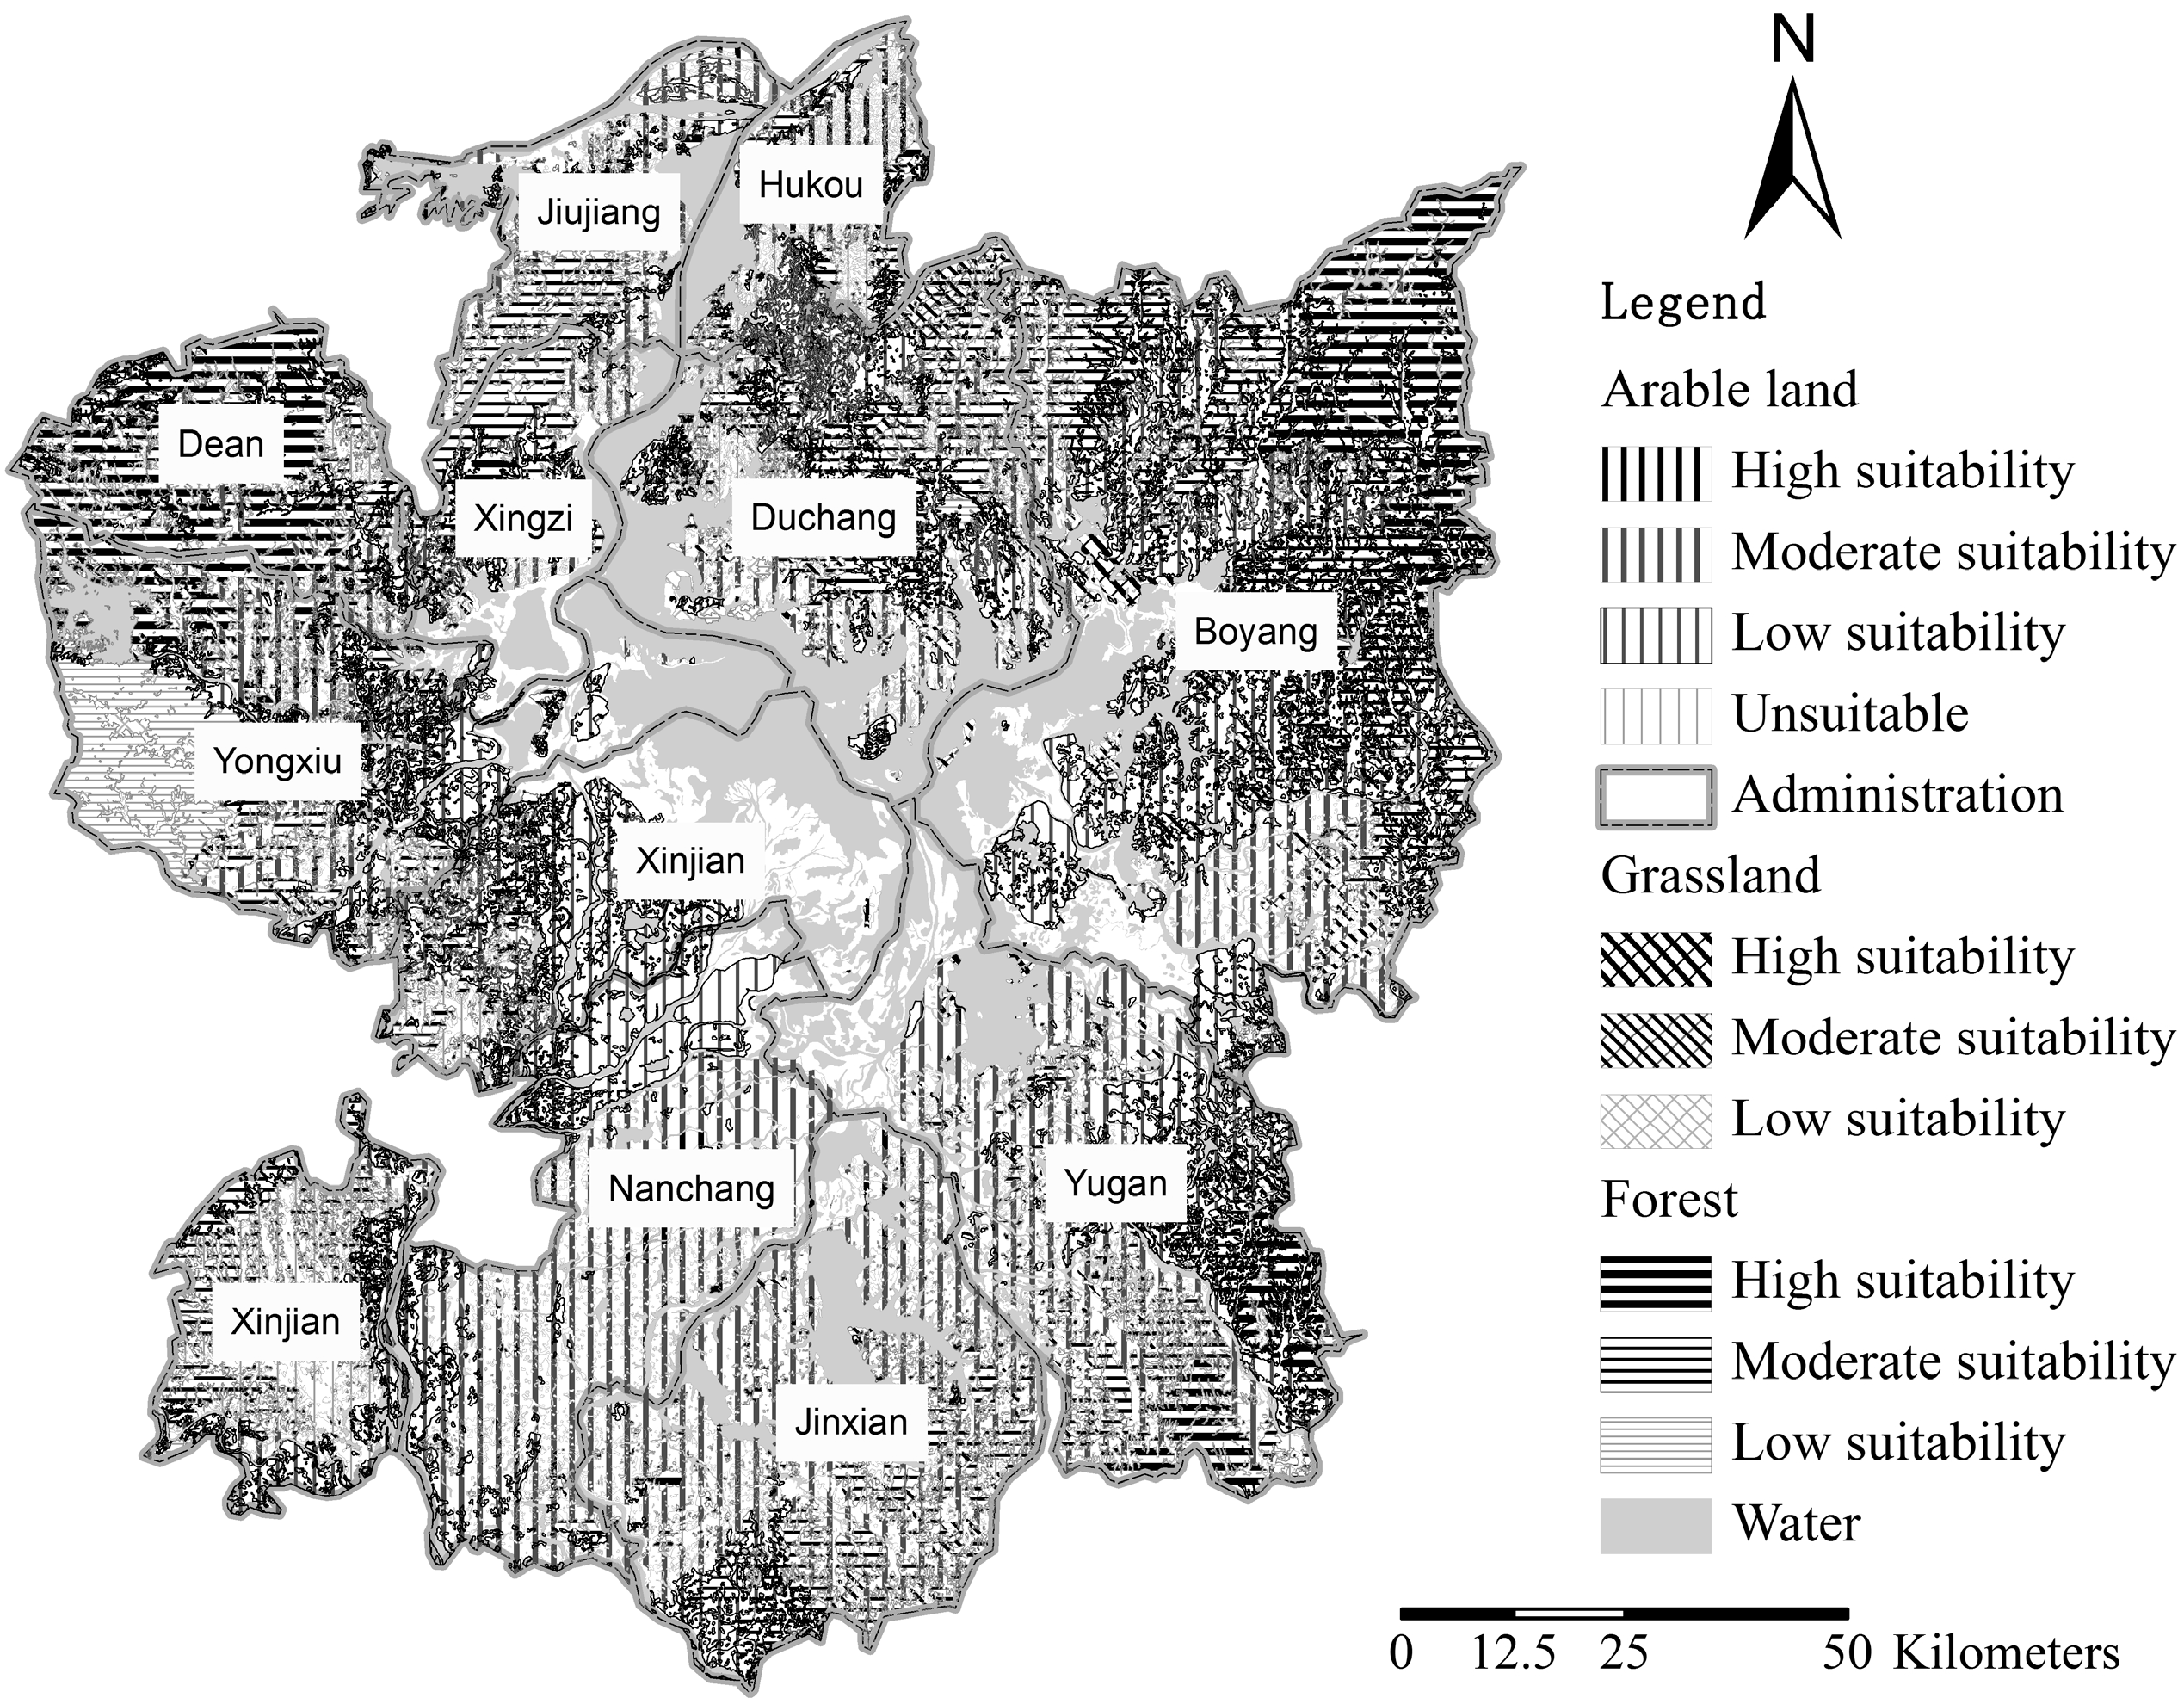
5.2. Suitability Assessment

Figure 5 shows the suitability of Poyang Lake Region for arable land, forest and grassland, as a result of the suitability assessment.
Figure 5. The results of suitability assessment of Poyang Lake Region.
Sustainability 07 00035 g005

5.3. Single-Objective Pattern Optimization

In the third step, three single-objective pattern optimization scenarios were developed. The areas allocated land use in each of the scenarios are presented in Table 5.
Table 5. Areas allocated land use in the single-objective pattern optimization (in ha).
Land useArea in 2005Food production scenarioNature conservation scenarioEconomic growth scenarioArea demand in 2015
Arable land904,850869,161787,218857,347785,100
Forest495,002601,711498,672451,793282,938
Grassland69,55969,559192,33968,34716,8692
Water body378,720378,720429,678378,720418,606
Construction land50,62750,62750,627143,05069,900
Non-developed land89,40718,38529,62988,906-
Total1,988,1631,988,1631,988,1631,988,163-
The pattern optimization in the food production scenario results in a reallocation of arable land. Highly suitable non-developed land is converted to arable land. Since a water level over 19.5 m (above sea level) at the Duchang gauging station is considered a major flood event, non-developed land below 19.5 m is not converted to arable land due to the high flood risk and remain undeveloped. Unsuitable arable land is converted to forest.
For the pattern optimization in the nature conservation scenario the ecosystem robustness in Poyang Lake Region needed to be identified first. The ecosystem robustness was derived from the Poyang Lake Ecological Planning research (Department of Land and Resources, 2005 (Figure 6).
Figure 6. Ecosystem robustness level of Poyang Lake Region.
Sustainability 07 00035 g006
The pattern optimization for the economic growth scenario required the identification of economic growth rates in Poyang Lake Region, which are shown in Figure 7.
Figure 7. Economic growth rate of Poyang Lake Region.
Sustainability 07 00035 g007
The results in Table 5 show that the three land-use optimization scenarios each meet their specific demand for food production, nature conservation or economic growth. However, compared to the total land-use demand in 2015, neither scenario can comply with all three objectives simultaneously. Therefore, a multi-objective pattern optimization is required, as presented in the next section.

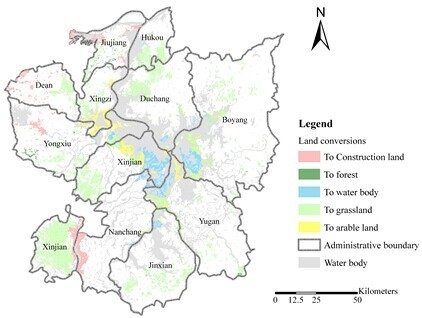
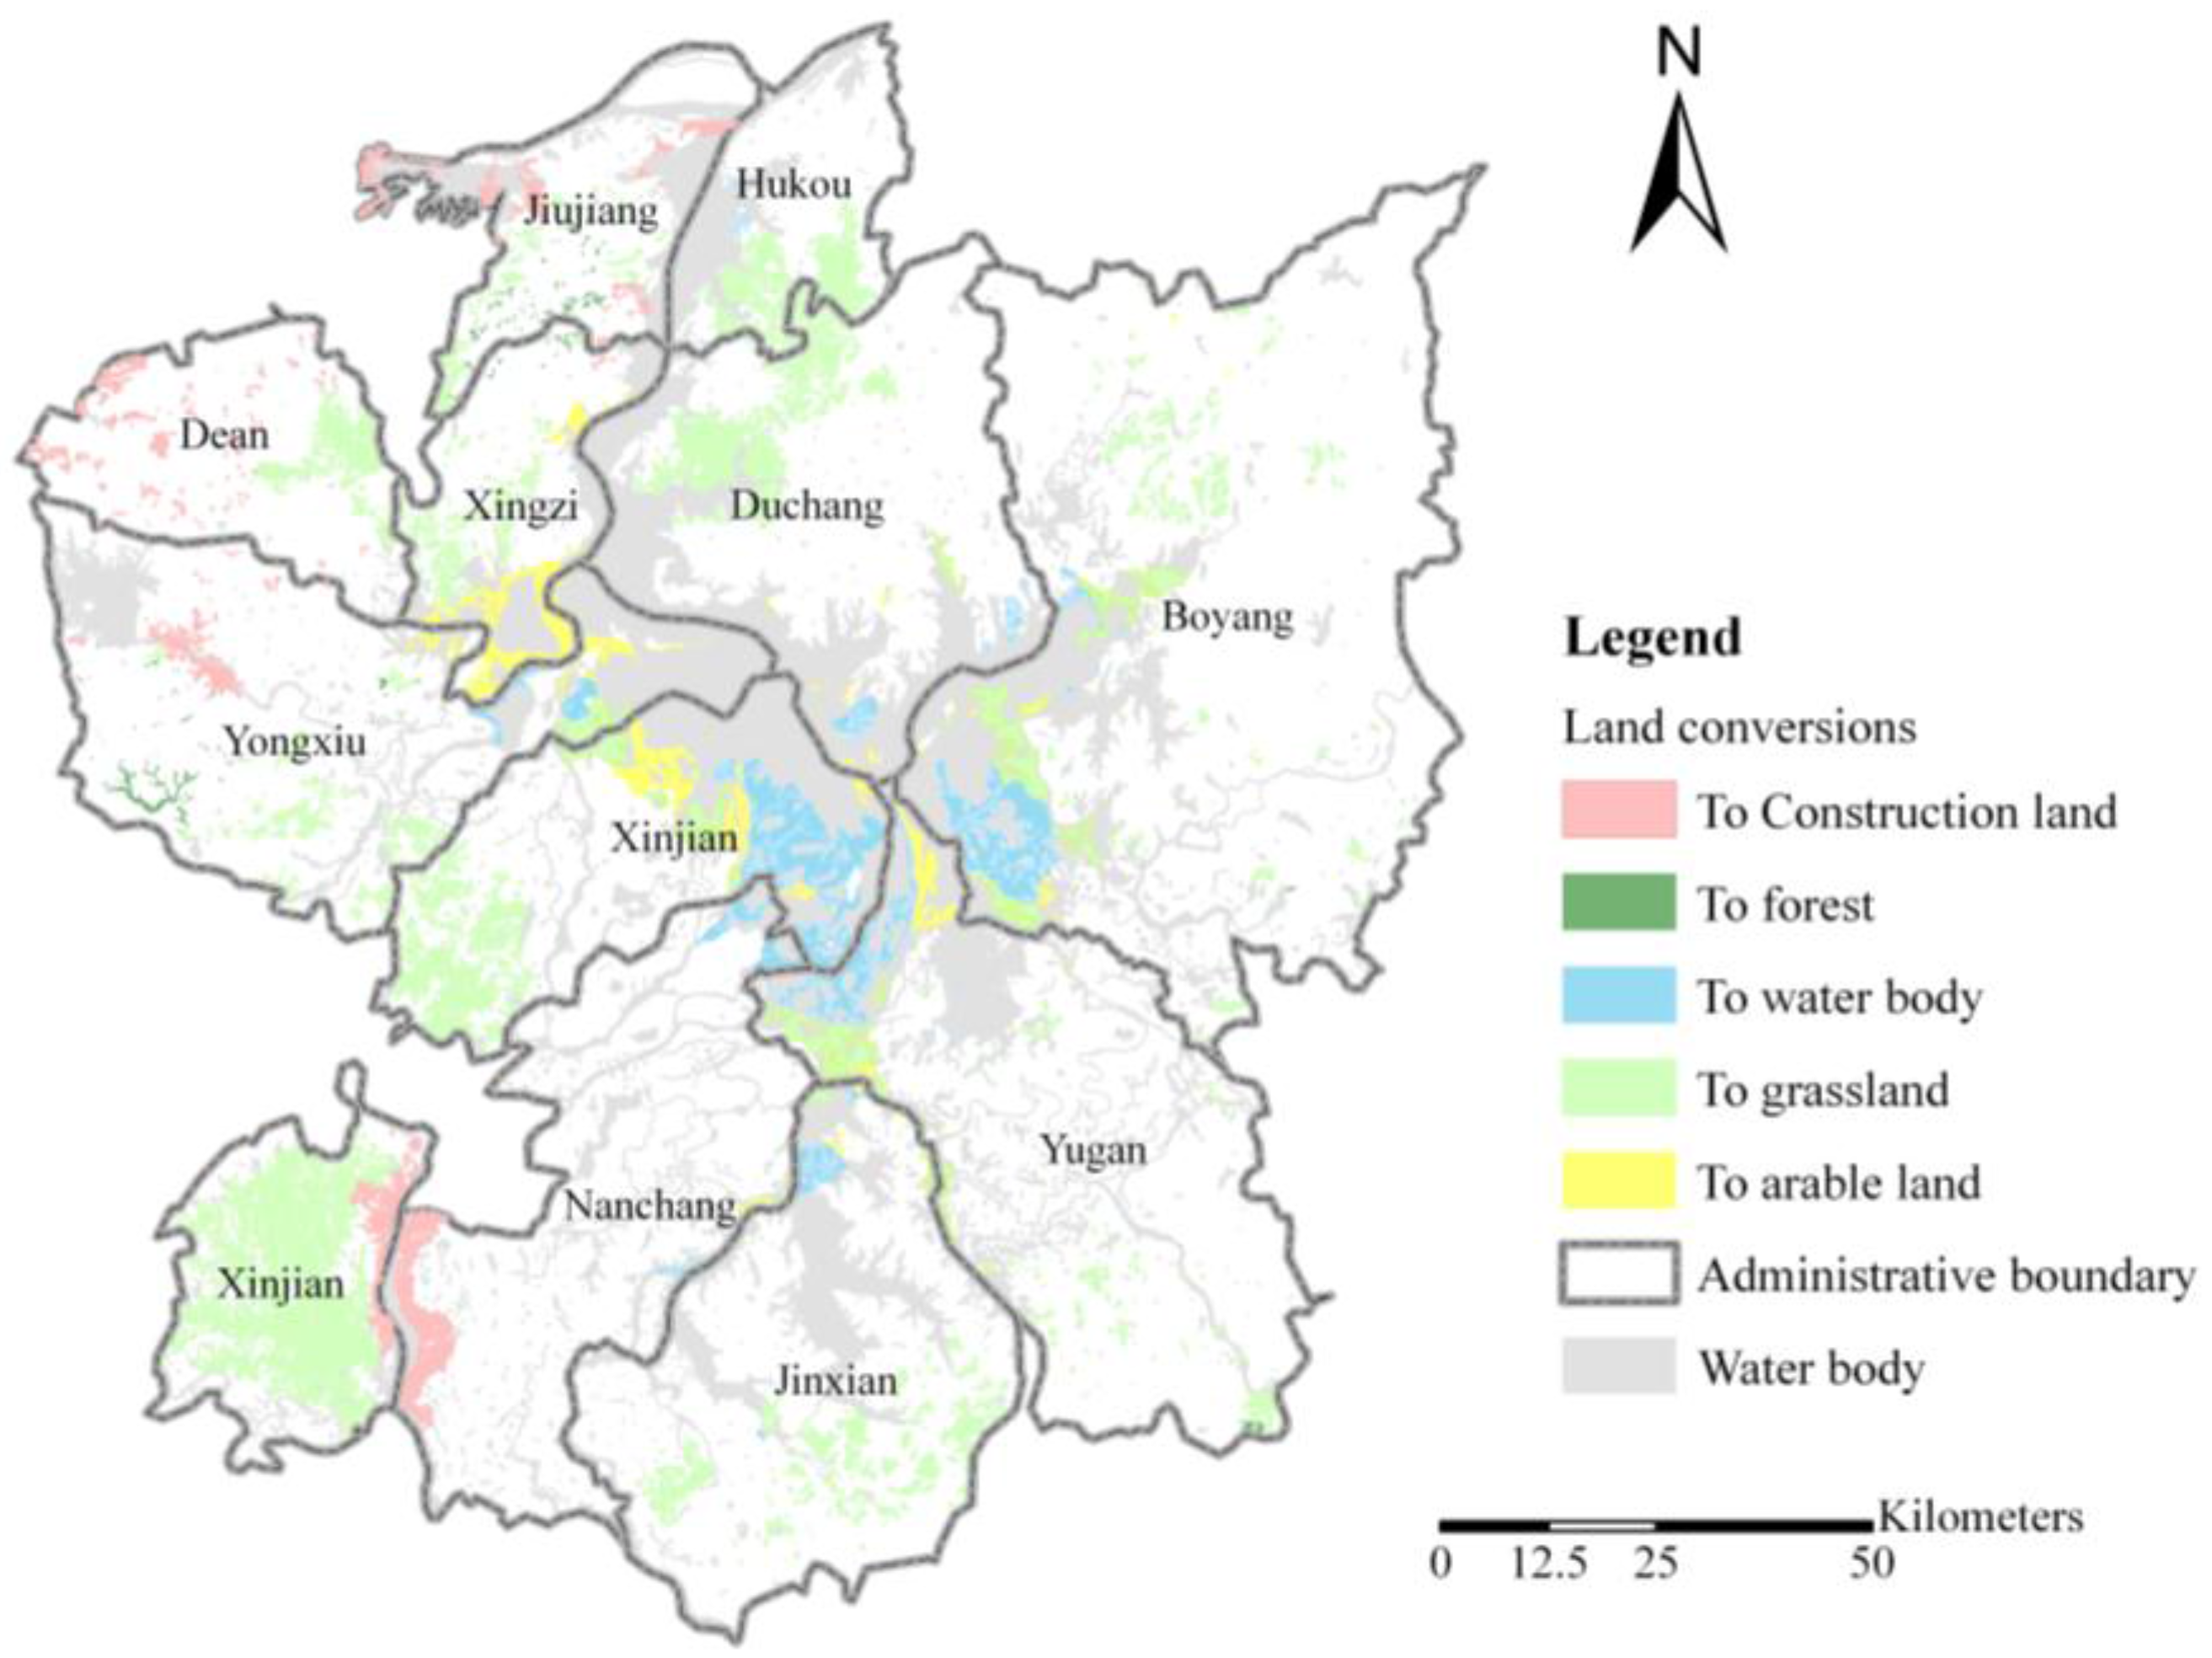
5.4. Multi-Objectives Pattern Optimization

In the process of pattern optimization, 11,457 patches were distinguished in Poyang Lake Region, including 1201 class one patches (with conflicts), covering approximately 10% of the total area. The converted areas and total optimized areas of land use in 2015 are presented in Table 6. Compared to Table 5, the results show that the land demand in 2015 for each land-use type can be met. Looking at the land-use conversions, the area of arable land decreases by 102,405 ha, some of which will returned to forest and surface water, but for the most to grassland. Construction land grows in order to keep up with the fast economic growth. The area of non-developed land decreases, for the most in favor of the area of surface water.
Table 6. Optimized land use (2015) and land-use conversions (in ha).
2005Converted to2015
Arable landForestGrasslandWaterConstruction land
Arable land904,850-386292,401891210,031801,444
Forest495,0020-04776191496,031
Grassland69,55900-60124169,738
Water body378,720000-0434,874
Construction land50,6270000-69,838
Non-developed land89,40611,8002135840441,865896416,238
The land-use conversions between 2005 and 2015 are shown in Figure 8. The results show that the expansion of surface water mainly takes place in the vicinity of the lake. Jiujiang city, Xinjian, Nanchang and Jinxian counties witness a sharp increase of construction land due to their high economic growth rate. The increase in grassland mostly occurs in Xinjian and Boyang counties, close to the lake. The forest pattern does not change noticeably.
Figure 8. Optimized land-use conversions 2005–2015.
Sustainability 07 00035 g008

5.5. Assessment of the Results

The model and results have been assessed in a workshop with 12 invited experts and planning practitioners. In general, the participants concluded that the model and results can support a more holistic, strategic land-use planning at regional level, which is currently lacking in the Chinese planning system. They argued that the results may provide guidance to a more sustainable, regional spatial development. Furthermore, the use of geo-technology supplies decision makers with easy-to-use output maps and database. The experts showed particular interest in the rationale behind the model. They supported the idea underpinning the model, that the implementation of the major Chinese land-use objectives (food security, nature conservation and economic development) requires a balanced allocation of land-use, both in size and spatial location. The participants concluded that the model provides a new perspective of strategic land-use planning at regional scale in China. However, the model also fuelled a heated debate between the representatives of the local and the provincial government. The provincial government representatives regarded the model appropriate for dealing with the sensitiveness of Poyang Lake Region and developing a spatial development strategy at regional level, and also a proper tool for implementing the current guidelines of quota management by the province and local level administrations. The representatives from the local governments disagreed. In their opinion, a new regional administrative body including the 11 counties of Poyang Lake Region should be established, in order to effectively deal with the different interests and objectives at the regional and lower spatial scales, including discussing compensation mechanisms. The local government representatives considered such compensation mechanisms a prerequisite for the successful implementation of the model.

6. Discussion and Conclusions

China’s rapid economic growth and urban sprawl are accompanied by resource depletion and environmental deterioration [1,7]. Land-use planners are confronted with the challenge to keep a balance between the interests of food production, economic growth and protecting natural resources. However, current land-use policy and planning are ineffective in dealing with the process of rapid urbanization and safeguarding arable land and natural resources [1,7,9]. Some main reasons are that the quota system is not spatially explicit and only provides a framework for the distribution of areas of land use over the different administrative levels, with a primary focus at economic growth. This has been stimulated by China’s long tradition of policies controlling the agricultural production, keeping the product prices low and using the profits of the agriculture sector for investments in the industrial sector. These policies also led to a sharp urban–rural division. Consequently, the current land-use planning system in China is unable to support a more sustainable land-use planning, since it falls short in providing holistic, strategic development perspectives at the regional level. The results described in this paper show that the conceived model can provide such development perspectives by enabling the design and optimization of a more sustainable land-use allocation at the regional level, providing a framework for guiding the process of land-use allocation at the local level. The assessment of the model in the workshop with Chinese planning experts and practitioners showed that the model is perceived as a useful extension and complementary to the current framework of China’s land-use planning system.
The results in Poyang Lake Region demonstrate the potential of computer-based planning support systems to support a more balanced, strategic regional planning. Examples of planning support systems have been discussed by many authors [44,45,46]. The presented model and techniques are not innovative from a methodological perspective, but the paper provides an interesting and unique case study of a model developed and applied in the Chinese land-use planning context. The model should not been seen as a fixed approach, but as a general framework that needs to be adapted to the characteristics of a region, also in view of the assumptions made during the development of the model. For example, the demand prediction is based on trend analysis, which is accurate only if there are no future deviations from the trend, such as changes in export to other regions. Moreover, the criteria used for the suitability assessment and the priority ranking of conservation, arable and construction land in the Poyang Lake Region case study, may be different in other regions in China. Furthermore, it can be argued that the step-wise allocation process in the model does not represent a multi-objective optimization process [18], but suggests a linear process instead. It should be understood that the model allows a region to experiment with different assumptions and priority ranks, and thus assess the consequences of other policy choices and conditions. The results should therefore not be seen as a blueprint for future development, but as an important tool for discussing the consequences of decisions about future land-use developments with local governments in a region. In general, the results can act as a guiding perspective for a more sustainable spatial development of the region, and a warning sign for potential problems (requiring mitigating measures) in situ ations that local governments choose for alternative spatial developments. The third round of Chinese land-use plan revision may provide a good opportunity to further study, apply and improve the model, and present examples of its use in other strategic land-use plans at the regional level.
However, strategic development perspectives and spatial pattern optimization as such are not enough to realize a more sustainable land-use development in China. This also requires an administrative body which takes the responsibility for implementing and monitoring the process of strategic, regional land-use planning and managing the communication between stakeholders and the different administrations. Managing the communication process requires selecting appropriate levels and methods of participation, fitting the purpose and need for communication [47,48]. Currently, conflicting interests between different administrations are hindering the process toward a more sustainable land-use development [10], requiring approaches that enable to resolve these conflicts. During the workshop, the local governmental representatives suggested setting up a new regional administration body. As this might be very complex to implement within the current administrative system in China, another plausible option is to make regional planning a responsibility of the province level government. However, this does not solve the problem that in order to realize a more sustainable development at regional level, some local administrations should host more urbanization and economic growth, while other local administrations should focus more on safeguarding arable land and natural resources. Therefore, the successful implementation of strategic development perspectives by the regional government also requires instruments, such as financial incentives and compensation mechanisms that can convince local governments to renounce their claims for urbanization and economic development in favor of the protection of arable land and natural resources. Such instruments will also be important in view of ethical and social issues that are related to land reallocation processes. Land reallocation is known to cause social unrest due to perceived injustice, for example changes in income distribution among farmers due to reallocation and loss of use of farmland [49]. Further research is needed on how to connect these wider social and economic aspects with the approach and results of the model.
It can be expected that the continuous reform of the economic and political system in China will also result in a future revision of the land-use planning system. This paper shows that the system needs to become more integrated, regionally-oriented and strategic, as well as being more interactive and participatory in nature. Most likely, this will also foster the development of computer-based planning support systems in the near future.

Acknowledgments

This research was funded by the Natural Science Foundation of China (41161031).

Author Contributions

The research and paper were designed and written by Wenbo Chen and Gerrit J. Carsjens. Haifeng Li and Lihong Zhao were responsible for collecting the empirical data. The model results were analyzed by Wenbo Chen and Lihong Zhao.

Conflicts of Interest

The authors declare that there are no conflicts of interest.

References

  1. Schmidt, C.W. Economy and environment—China seeks a balance. Environ. Health Perspect. 2002, 110, A516–A522. [Google Scholar] [CrossRef] [PubMed]
  2. Kitada, T.; Okamura, K.; Tanaka, S. Effects of topography and urbanization on local winds and thermal environment in the Nohbi Plain, coastal region of central Japan: A numerical analysis by mesoscale meteorological model with a kappa-epsilon turbulence model. J. Appl. Meteorol. 1998, 37, 1026–1046. [Google Scholar] [CrossRef]
  3. Burak, S.; Dogan, E.; Gazioglu, C. Impact of urbanization and tourism on coastal environment. Ocean Coastal Manag. 2004, 47, 515–527. [Google Scholar] [CrossRef]
  4. Solecki, W.D.; Leichenko, R.M. Urbanization and the metropolitan environment—Lessons from New York and Shanghai. Environment 2006, 48, 8–23. [Google Scholar] [CrossRef]
  5. Li, Y.; Yeung, S.C.W.; Seabrooke, W. Urban planning and sustainable development under transitional economy: A case study of Guangzhou. Int. J. Sustain. Dev. World Ecol. 2005, 12, 300–313. [Google Scholar] [CrossRef]
  6. Song, Y.; Ding, C.R. Urbanization Challenges in China: Critical Issues in an Era of Rapid Growth. J. Ind. Ecol. 2011, 15, 816–816. [Google Scholar] [CrossRef]
  7. Chen, J. Rapid urbanization in China: A real challenge to soil protection and food security. Catena 2007, 69, 1–15. [Google Scholar] [CrossRef]
  8. Wang, X.; Guo, B.; Guan, X.J.; Wang, G. Urbanization and Food Crisis in China. Beyond Exp. Risk Anal. Crisis Response 2011, 16, 292–300. [Google Scholar]
  9. Ke, Z.; Xia, C.; Tan, B.P. Toward an improved legislative framework for China’s land degradation control. Nat. Resour. Forum 2008, 32, 11–24. [Google Scholar] [CrossRef]
  10. Lai, M. A comparative study on urban land use planning system between China and Taiwan. Sustain. City Urban Regen. Sustain. 2002, 14, 497–506. [Google Scholar]
  11. Tao, T.; Tan, Z.; He, X. Integrating environment into land-use planning through strategic environmental assessment in China: Towards legal frameworks and operational procedures. Environ. Impact Assess. Rev. 2007, 27, 243–265. [Google Scholar] [CrossRef]
  12. Michishita, R.; Jiang, Z.B.; Xu, B. Monitoring two decades of urbanization in the Poyang Lake area, China through spectral unmixing. Rem. Sens. Environ. 2012, 117, 3–18. [Google Scholar] [CrossRef]
  13. Chang, M.S.; Kung, C.C. Nonparametric Forecasting for Biochar Utilization in Poyang Lake Eco-Economic Zone in China. Sustainability 2014, 6, 267–282. [Google Scholar] [CrossRef]
  14. Chen, M.Q.; Wei, X.H.; Huang, H.S.; Lu, T.G. Poyang Lake basin: A successful, large-scale integrated basin management model for developing countries. Water Sci. Technol. 2011, 63, 1899–1905. [Google Scholar] [CrossRef] [PubMed]
  15. Deng, X.Z.; Zhao, Y.H.; Wu, F.; Lin, Y.Z.; Lu, Q.; Dai, J. Analysis of the trade-off between economic growth and the reduction of nitrogen and phosphorus emissions in the Poyang Lake Watershed, China. Ecol. Modell. 2011, 222, 330–336. [Google Scholar] [CrossRef]
  16. Food and Agricultural Organization (FAO). Guidelines for Land Use Planning; Food and Agricultural Organization of the United Nations: Rome, Italy, 1993. [Google Scholar]
  17. Arciniegas, G.; Janssen, R.; Omtzigt, N. Map-based multicriteria analysis to support interactive land use allocation. Int. J. Geogr. Inf. Sci. 2011, 25, 1931–1947. [Google Scholar] [CrossRef]
  18. Zhang, H.H.; Zeng, Y.N.; Bian, L. Simulating Multi-Objective Spatial Optimization Allocation of Land Use Based on the Integration of Multi-Agent System and Genetic Algorithm. Int. J. Environ. Res. 2010, 4, 765–776. [Google Scholar]
  19. Svoray, T.; Bar, P.; Bannet, T. Urban land-use allocation in a Mediterranean ecotone: Habitat Heterogeneity Model incorporated in a GIS using a multi-criteria mechanism. Landsc. Urban Plan. 2005, 72, 337–351. [Google Scholar] [CrossRef]
  20. Strange, N.; Meilby, H.; Thorsen, B.J. Optimization of land use in afforestation areas using evolutionary self-organization. Forest Sci. 2002, 48, 543–555. [Google Scholar]
  21. Brookes, C.J. A genetic algorithm for designing optimal patch configurations in GIS. Int. J. Geogr. Inf. Sci. 2001, 15, 539–559. [Google Scholar] [CrossRef]
  22. Verburg, P.H.; de Koning, G.H.J.; Kok, K.; Veldkamp, A.; Bouma, J. A spatial explicit allocation procedure for modelling the pattern of land use change based upon actual land use. Ecol. Model. 1999, 116, 45–61. [Google Scholar] [CrossRef]
  23. Chen, B.; Chen, G.Q. Ecological footprint accounting based on emergy—A case study of the Chinese society. Ecol. Model. 2006, 198, 101–114. [Google Scholar] [CrossRef]
  24. Antrop, M. Changing patterns in the urbanized countryside of Western Europe. Landsc. Ecol. 2000, 15, 257–270. [Google Scholar] [CrossRef]
  25. Carsjens, G.J.; van der Knaap, W. Strategic land-use allocation: Dealing with spatial relationships and fragmentation of agriculture. Landsc. Urban Plan. 2002, 58, 171–179. [Google Scholar] [CrossRef]
  26. Chen, L.D.; Messing, I.; Zhang, S.R.; Fu, B.J.; Ledin, S. Land use evaluation and scenario analysis towards sustainable planning on the Loess Plateau in China—Case study in a small catchment. Catena 2003, 54, 303–316. [Google Scholar] [CrossRef]
  27. Antrop, M. Landscape change and the urbanization process in Europe. Landsc. Urban Plan. 2004, 67, 9–26. [Google Scholar] [CrossRef]
  28. De Groot, R. Function-analysis and valuation as a tool to assess land use conflicts in planning for sustainable, multi-functional landscapes. Landsc. Urban Plan. 2006, 75, 175–186. [Google Scholar]
  29. Seppelt, R.; Voinov, A. Optimization methodology for land use patterns using spatially explicit landscape models. Ecol. Model. 2002, 151, 125–142. [Google Scholar] [CrossRef]
  30. Seppelt, R.; Voinov, A. Optimization methodology for land use patterns—Evaluation based on multiscale habitat pattern comparison. Ecol. Model. 2003, 168, 217–231. [Google Scholar] [CrossRef]
  31. Koomen, E.; Rietveld, P.; de Nijs, T. Modelling land-use change for spatial planning support. Ann. Reg. Sci. 2008, 42, 1–10. [Google Scholar] [CrossRef]
  32. Yin, R.S.; Xiang, Q.; Xu, J.T.; Deng, X.Z. Modeling the Driving Forces of the Land Use and Land Cover Changes Along the Upper Yangtze River of China. Environ. Manag. 2010, 45, 454–465. [Google Scholar] [CrossRef]
  33. Joerin, F.; Theriault, M.; Musy, A. Using GIS and outranking multicriteria analysis for land-use suitability assessment. Int. J. Geogr. Inf. Sci. 2001, 15, 153–174. [Google Scholar] [CrossRef]
  34. Liu, Y.S.; Wang, J.Y.; Guo, L.Y. GIS-based assessment of land suitability for optimal allocation in the Qinling Mountains, China. Pedosphere 2006, 16, 579–586. [Google Scholar] [CrossRef]
  35. Kessler, J.J. Usefulness of the Human Carrying-Capacity Concept in Assessing Ecological Sustainability of Land-Use in Semiarid Regions. Agric. Ecosyst. Environ. 1994, 48, 273–284. [Google Scholar] [CrossRef]
  36. Ye, L.M.; van Ranst, E. Population carrying capacity and sustainable agricultural use of land resources in Caoxian County (North China). J. Sustain. Agric. 2002, 19, 75–94. [Google Scholar] [CrossRef]
  37. Liu, M.; Hu, Y.; Li, X.; He, H.S.; Xu, C.; Zhang, W. Ecological footprint and biological capacity time series assessment for a forest region in northeastern China. Int. J. Sustain. Dev. World Ecol. 2007, 14, 493–502. [Google Scholar] [CrossRef]
  38. Wackernagel, M.; Onisto, L.; Bello, P.; Linares, A.C.; López Falfán, I.S.; Méndez Garcı́a, J.; Guerrero, A.I.S.; Guerrero, M.G.S. National natural capital accounting with the ecological footprint concept. Ecol. Econ. 1999, 29, 375–390. [Google Scholar] [CrossRef]
  39. Monfreda, C.; Wackernagel, M.; Deumling, D. Establishing national natural capital accounts based on detailed - Ecological Footprint and biological capacity assessments. Land Use Policy 2004, 21, 231–246. [Google Scholar] [CrossRef]
  40. Food and Agricultural Organization (FAO). A Framework for Land Evaluation. Soils Bulletin 32; Food and Agricultural Organization of the United Nations: Rome, Italy, 1976. [Google Scholar]
  41. Blaschke, T. The role of the spatial dimension within the framework of sustainable landscapes and natural capital. Landsc. Urban Plan. 2006, 75, 198–226. [Google Scholar] [CrossRef]
  42. Cui, L.J.; Wu, G.F.; Liu, Y.L. Monitoring the impact of backflow and dredging on water clarity using MODIS images of Poyang Lake, China. Hydrol. Process. 2009, 23, 342–350. [Google Scholar] [CrossRef]
  43. Feng, L.; Hu, C.M.; Chen, X.L.; Li, R.F. Satellite observations make it possible to estimate Poyang Lake’s water budget. Environ. Res. Lett. 2011. [Google Scholar] [CrossRef]
  44. Carsjens, G.J. Supporting Strategic Spatial Planning: Planning Support Systems for the Spatial Planning of Metropolitan Landscapes. Ph.D. Thesis, Wageningen University, Wageningen, The Netherlands, 2009. [Google Scholar]
  45. Geertman, S.; Stillwell, J. Planning Support Systems: Best Practice and New Methods; Springer Science: Berlin, Germany, 2009. [Google Scholar]
  46. Brail, R.K. Planning Support Systems for Cities and Regions; Lincoln Institute of Land Policy: Cambridge, MA, USA, 2008. [Google Scholar]
  47. Buono, F.; Pediaditi, K.; Carsjens, G.J. Local community participation in Italian national parks management: Theory versus practice. J. Environ. Policy Plan. 2012, 14, 189–208. [Google Scholar] [CrossRef]
  48. Institute of Environmental Management and Assessment (IEMA). Perspectives, Guidelines on Participation in Environmental Decision Making; IEMA: Lincoln, UK, 2002. [Google Scholar]
  49. Wu, J.; Fox, J.B.; Donohue, J.M.; Dai, Q. An empirical study of land reallocation management and peasant loss of lifetime employment: Societal unrest in China through the lens of organisational justice research. Int. J. Sustain. Soc. 2010, 2, 50–69. [Google Scholar] [CrossRef]

