Water Resource Vulnerability Characteristics by District’s Population Size in a Changing Climate Using Subjective and Objective Weights

Abstract
:1. Introduction
2. Methods
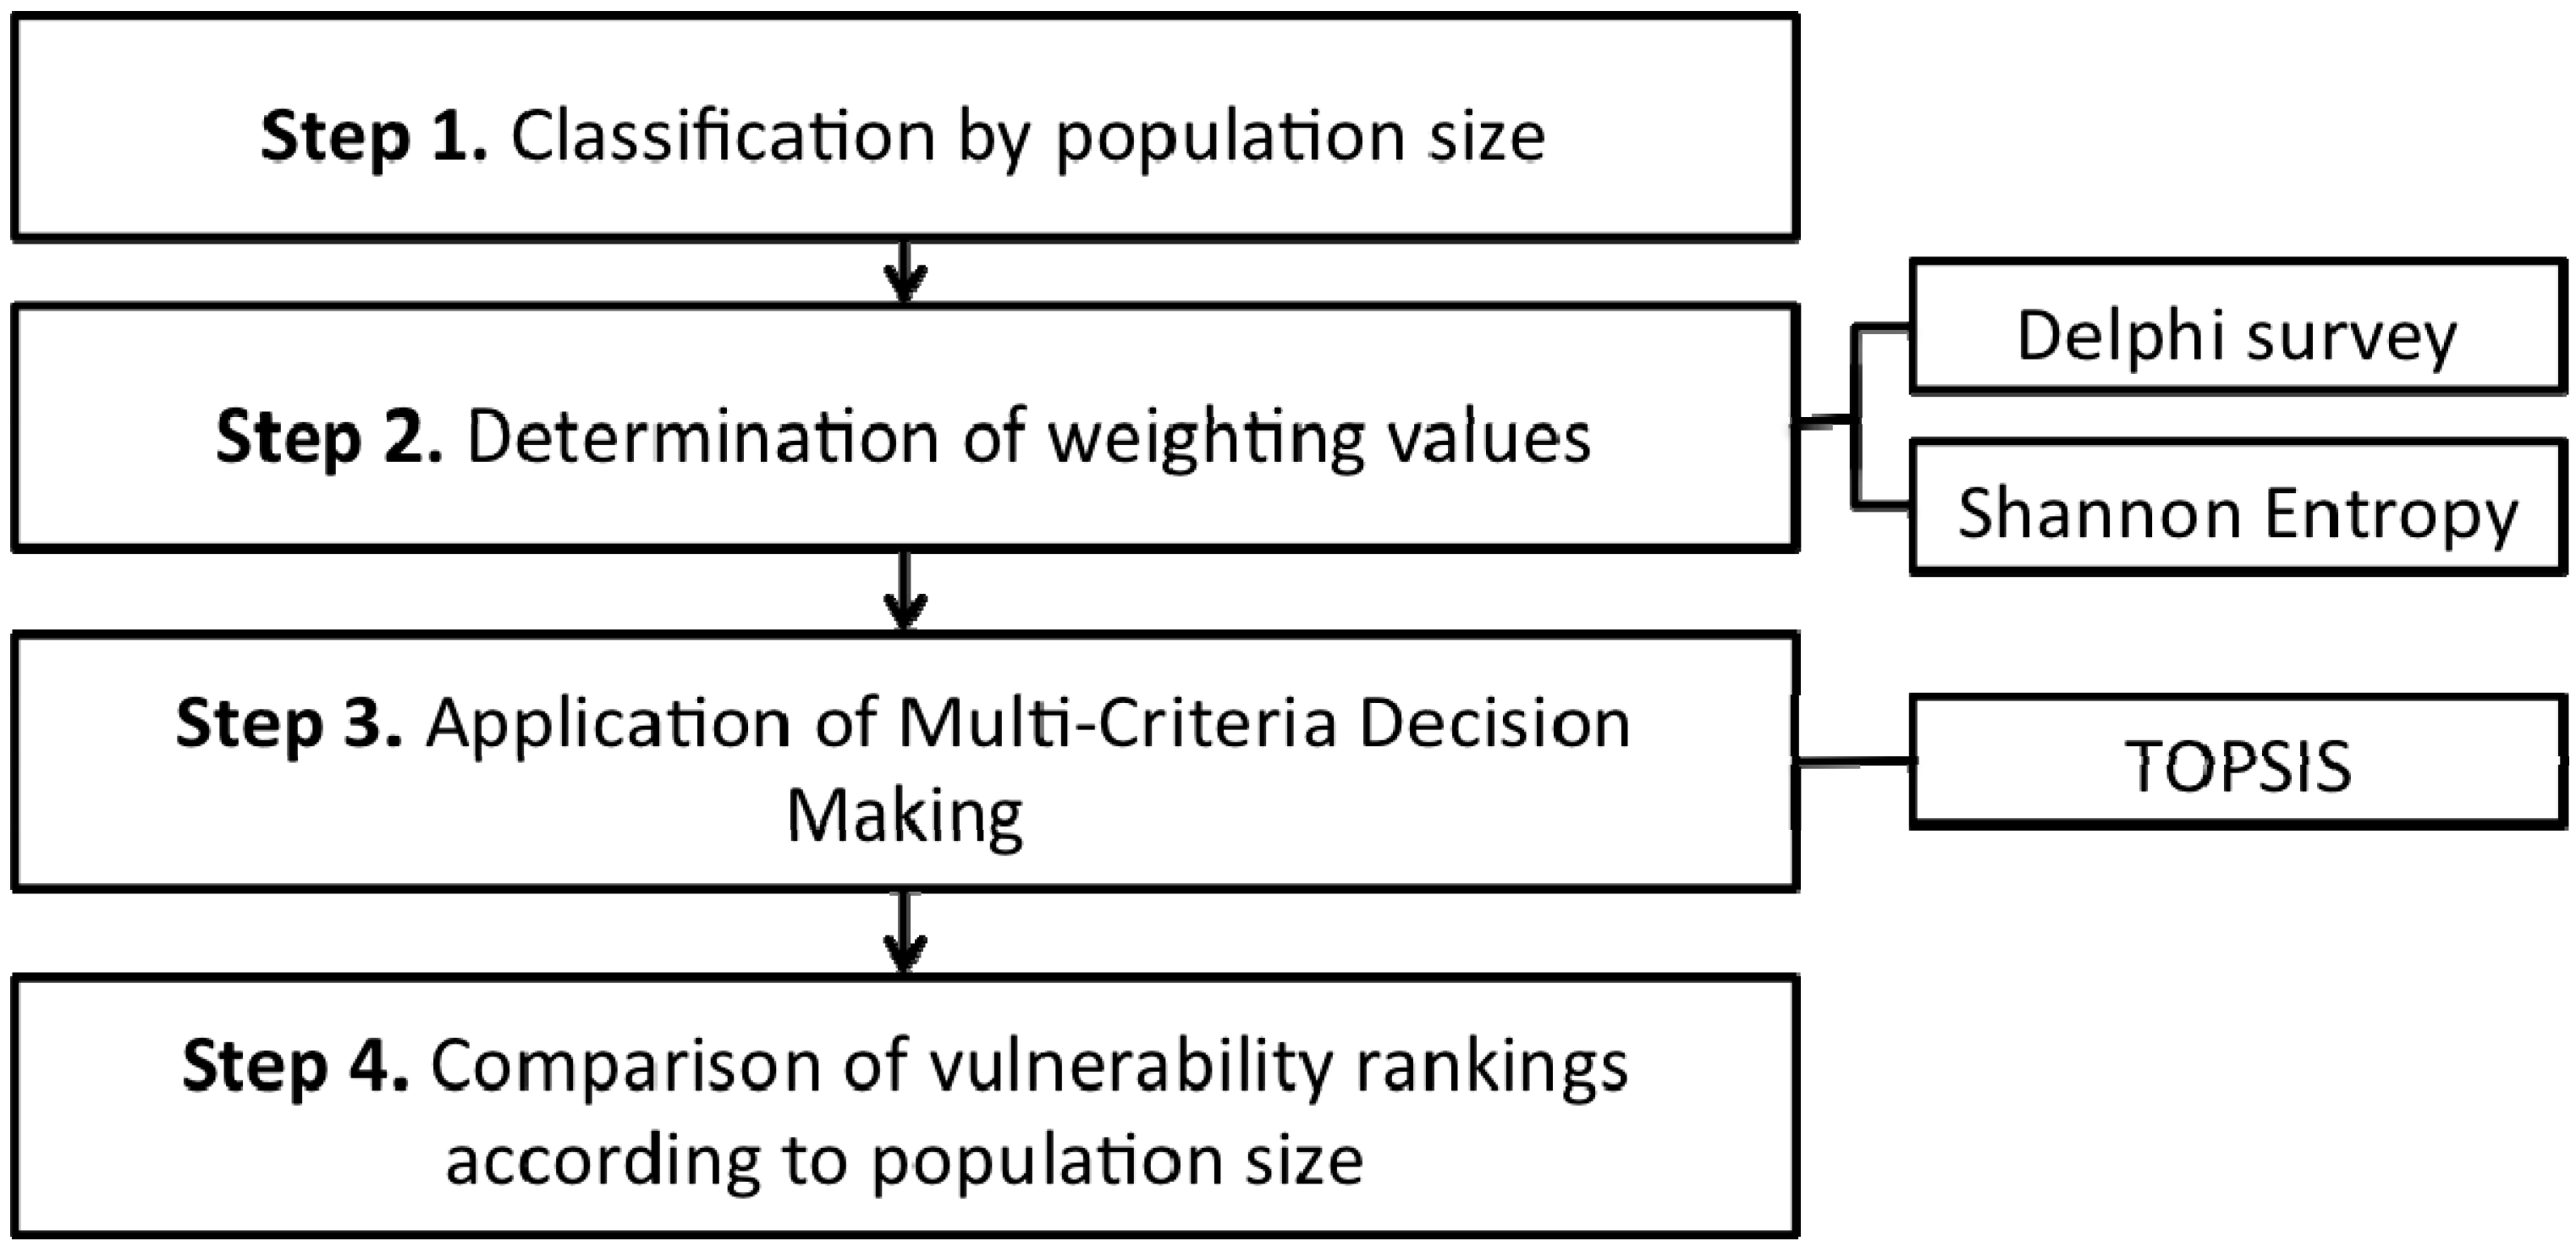
2.1. Procedure
2.2. Vulnerability Framework
2.3. Weighting Values
2.3.1. Delphi Technique
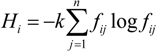
2.3.2. Shannon’s Entropy


 .
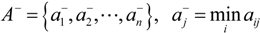
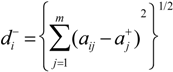
.2.4. TOPSIS
.
 if i ∊ Θ1 and
  if i ∊ Θ2; moreover, Θ1 is associated with the benefit attribute and Θ2 is associated with the cost attribute.
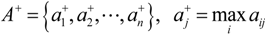

3. Materials
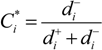
3.1. Study Area
3.2. Weighting Values on Each Criterion


| Provinces | Number of Districts | Area (km2) | Population (103 People) | |
|---|---|---|---|---|
| Name | Symbol | |||
| Seoul | A01 | 25 | 605.3 | 10,039 |
| Busan | A02 | 16 | 765.9 | 3446 |
| Daegu | A03 | 8 | 885.6 | 2431 |
| Incheon | A04 | 10 | 1029.4 | 2661 |
| Gwangju | A05 | 5 | 501.3 | 1450 |
| Daejeon | A06 | 5 | 539.9 | 1515 |
| Ulsan | A07 | 5 | 1057.1 | 1094 |
| Gyeonggi-do | A08 | 31 | 10,183.9 | 11,637 |
| Gangwon-do | A09 | 18 | 16,874.9 | 1443 |
| Chungcheongbuk-do | A10 | 12 | 7431.5 | 1479 |
| Chungcheongnam-do | A11 | 16 | 8598.0 | 1959 |
| Jeollabuk-do | A12 | 14 | 8051.0 | 1703 |
| Jeollanam-do | A13 | 22 | 12,095.1 | 1740 |
| Gyeongsangbuk-do | A14 | 23 | 19,026.1 | 2592 |
| Gyeongsangnam-do | A15 | 20 | 10,531.1 | 3141 |
| Jeju-do | A16 | 2 | 1845.9 | 547 |
| Total | 232 | 100,021.7 | 48,877 | |
3.3. Performance Values
4. Results
4.1. Population-Based Groups
| Population Size | Symbol | Number of Districts |
|---|---|---|
| More than 500,000 | G1 | 23 |
| 300,000–500,000 | G2 | 42 |
| 200,000–300,000 | G3 | 31 |
| 100,000–200,000 | G4 | 39 |
| 50,000–100,000 | G5 | 51 |
| Less than 50,000 | G6 | 46 |
| Total | 232 |
4.2. Weights with Subjective and Objective Approaches
| Criteria | Weighting Value | Indicator Value | |||
|---|---|---|---|---|---|
| Delphi | Entropy | Min. | Avg. | Max. | |
| Sensitivity | 0.27 | 0.42 | |||
| Low-lying area of less than 10 m (km2) | 0.10 | 0.067 | 0.0 | 17.5 | 266.2 |
| Low-lying household of less than 10 m | 0.10 | 0.061 | 0.0 | 2.5 | 61.9 |
| Area ratio with banks (%) | 0.07 | 0.153 | 0.0 | 2.6 | 21.1 |
| Population density (persons/km2) | 0.12 | 0.095 | 0.19 | 38.7 | 271.8 |
| Total population (persons) | 0.10 | 0.148 | 0.833 | 202.8 | 1040 |
| Regional average slope (°) | 0.11 | 0.190 | 0.8 | 11.5 | 23.0 |
| Percentage of road area (%) | 0.07 | 0.156 | 0.7 | 5.6 | 26.2 |
| Cost of flood management over last three years (106 Korean won) | 0.16 | 0.081 | 0.0 | 342.5 | 21129.5 |
| Population affected by flood management over last three years (10 persons) | 0.15 | 0.049 | 0.4 | 200.8 | 103.8 |
| Adaptive Capacity | 0.34 | 0.38 | |||
| Financial independence (%) | 0.13 | 0.192 | 7.4 | 28.0 | 90.5 |
| Number of civil servants per population (persons/103 people) | 0.07 | 0.208 | 25.0 | 55.0 | 90.8 |
| GRDP (106 Korean won) | 0.11 | 0.180 | 8.7 | 87.7 | 236.5 |
| Number of civil servants related to water | 0.13 | 0.104 | 0.0 | 0.4 | 7.9 |
| Ratio of improved river section (%) | 0.14 | 0.208 | 16.0 | 72.6 | 100.0 |
| Capacity of drainage facilities (m3/min) | 0.21 | 0.105 | 0.0 | 48.1 | 459.0 |
| Flood controllability of reservoirs (106 m3) | 0.21 | 0.003 | 0.0 | 11.3 | 616.0 |
| Climate Exposure | 0.39 | 0.19 | |||
| Daily maximum precipitation (mm) | 0.31 | 0.205 | 58.4 | 80.8 | 162.6 |
| Days with over 80 mm of rainfall (days) | 0.23 | 0.189 | 0.0 | 0.7 | 2.5 |
| 5-day maximum rainfall (mm/5 days) | 0.19 | 0.205 | 92.6 | 141.6 | 273.1 |
| Surface runoff (mm/day) | 0.16 | 0.197 | 0.0 | 0.1 | 0.3 |
| Summer precipitation (June–September) (mm) | 0.11 | 0.205 | 311.8 | 605.1 | 933.9 |
| Criteria | Weighting Value | Indicator Value | |||
|---|---|---|---|---|---|
| Delphi | Entropy | Min. | Avg. | Max. | |
| Sensitivity | 0.31 | 0.38 | |||
| Population density (persons/km2) | 0.11 | 0.078 | 0.19 | 38.7 | 271.8 |
| Total population (persons) | 0.10 | 0.117 | 8.3 | 202.6 | 1040 |
| Water supply (L/person/day) | 0.07 | 0.143 | 299.7 | 359.5 | 444.1 |
| Grain production per area (ton/km2) | 0.07 | 0.092 | 0.0 | 29.5 | 300.1 |
| Livestock production per area (km2) | 0.06 | 0.101 | 0.6 | 65.4 | 630 |
| Groundwater withdrawal (m3/year) | 0.08 | 0.119 | 0.02 | 15.7 | 103.3 |
| River water withdrawal (m3/year) | 0.09 | 0.118 | 0.0 | 152.8 | 762.1 |
| Household water consumption (103/m3/year) | 0.15 | 0.051 | 0.2 | 11.5 | 143.2 |
| Industrial water usage (103 m3/year) | 0.14 | 0.077 | 0.0 | 13.2 | 279.7 |
| Agriculture water usage (103 m3/year) | 0.13 | 0.103 | 0.01 | 68.0 | 743.5 |
| Adaptive Capacity | 0.38 | 0.33 | |||
| Financial independence (%) | 0.12 | 0.152 | 7.4 | 27.9 | 90.5 |
| Civil servants per population (persons/104 people) | 0.05 | 0.159 | 25.0 | 55.0 | 90.8 |
| GRDP (106 Korean won) | 0.09 | 0.139 | 8.7 | 87.7 | 236.5 |
| Number of civil servants related to water (persons) | 0.09 | 0.085 | 0.0 | 0.4 | 7.9 |
| Water supply distribution ratio (%) | 0.15 | 0.165 | 74.5 | 89.6 | 100.0 |
| Groundwater capacity (103 m3/year) | 0.14 | 0.139 | 0.32 | 46.8 | 327.0 |
| Reservoir for water supply capacity per area (103 m3) | 0.21 | 0.093 | 0.0 | 1.3 | 22.3 |
| Recycled water usage per area (103 ton/year) | 0.15 | 0.068 | 0.18 | 14.9 | 210.0 |
| Climate Exposure | 0.31 | 0.29 | |||
| Maximum number of continuous non-rainy days (days) | 0.22 | 0.178 | 13.9 | 21.0 | 26.2 |
| Winter (Dec, Jan and Feb; DJF) precipitation (mm) | 0.18 | 0.173 | 0.5 | 1.1 | 3.4 |
| Spring (Mar, Apr and May; MAM) precipitation (mm) | 0.21 | 0.178 | 1.2 | 1.9 | 3.0 |
| Winter (DJF) evapotranspiration (mm) | 0.10 | 0.125 | 0.2 | 1.9 | 13.8 |
| Spring (MAM) evapotranspiration (mm) | 0.13 | 0.175 | 0.04 | 2.3 | 5.6 |
| Underground outflow (mm) | 0.15 | 0.171 | 0.0 | 0.3 | 0.7 |
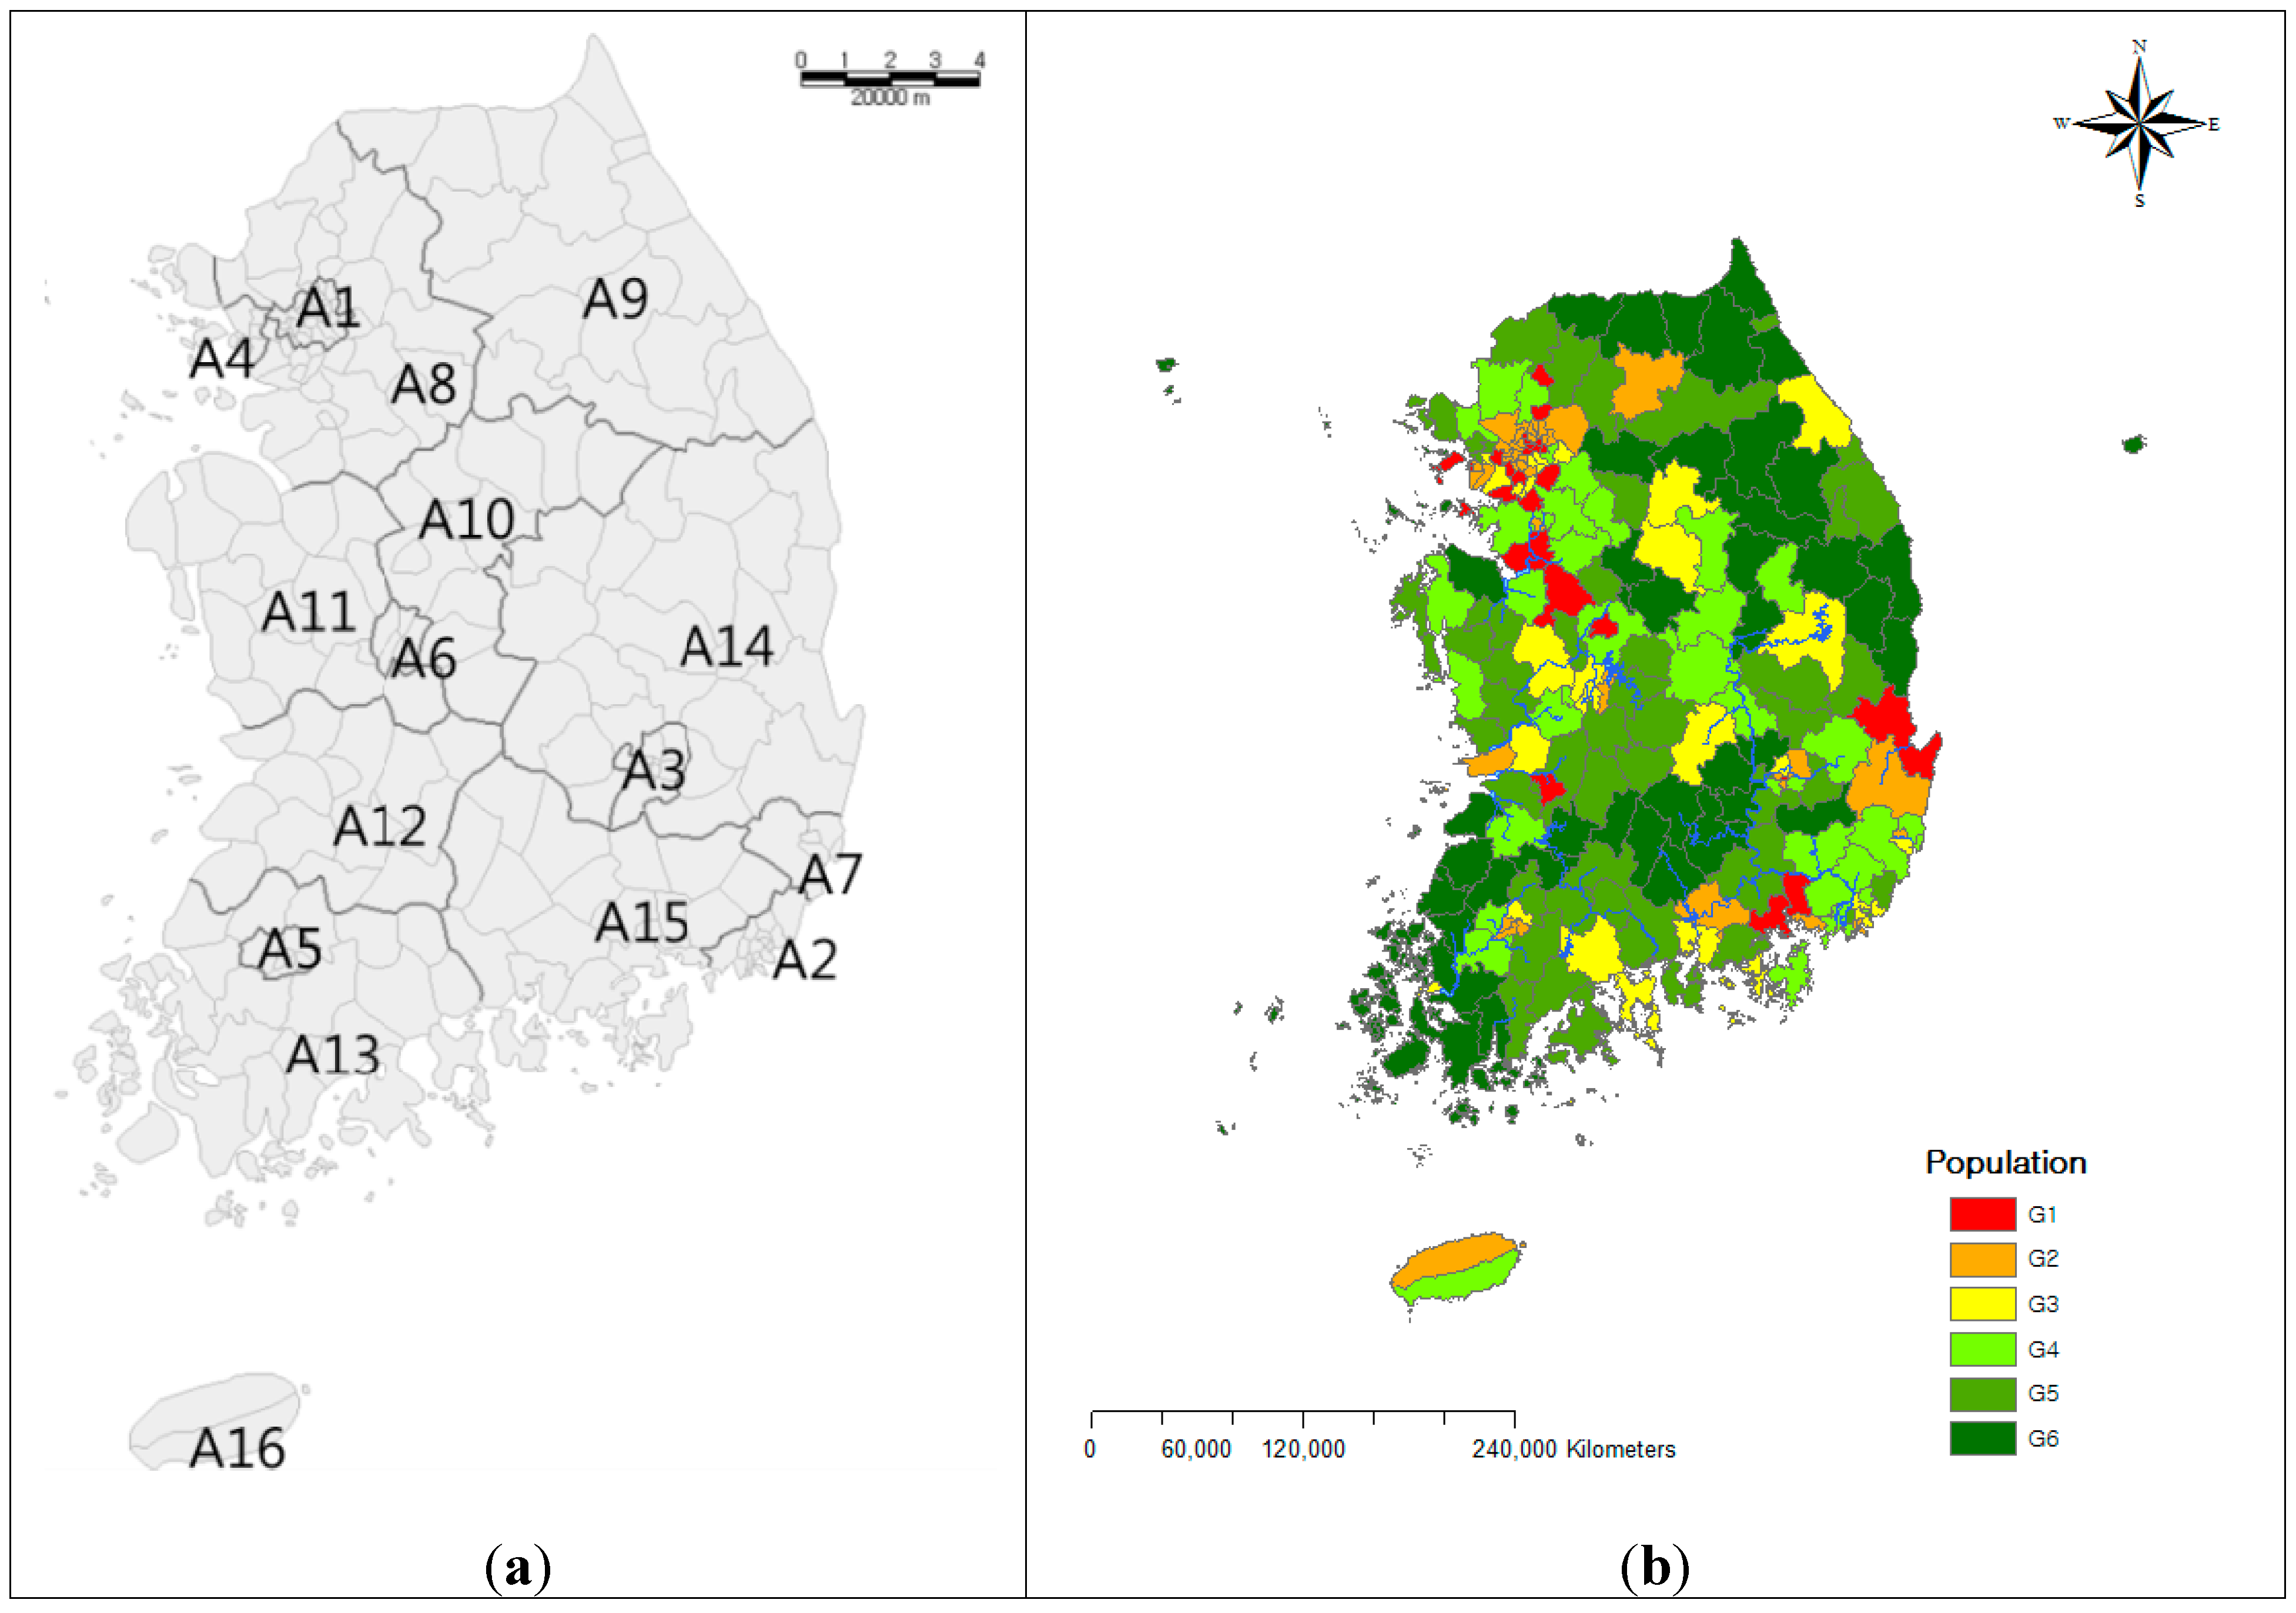
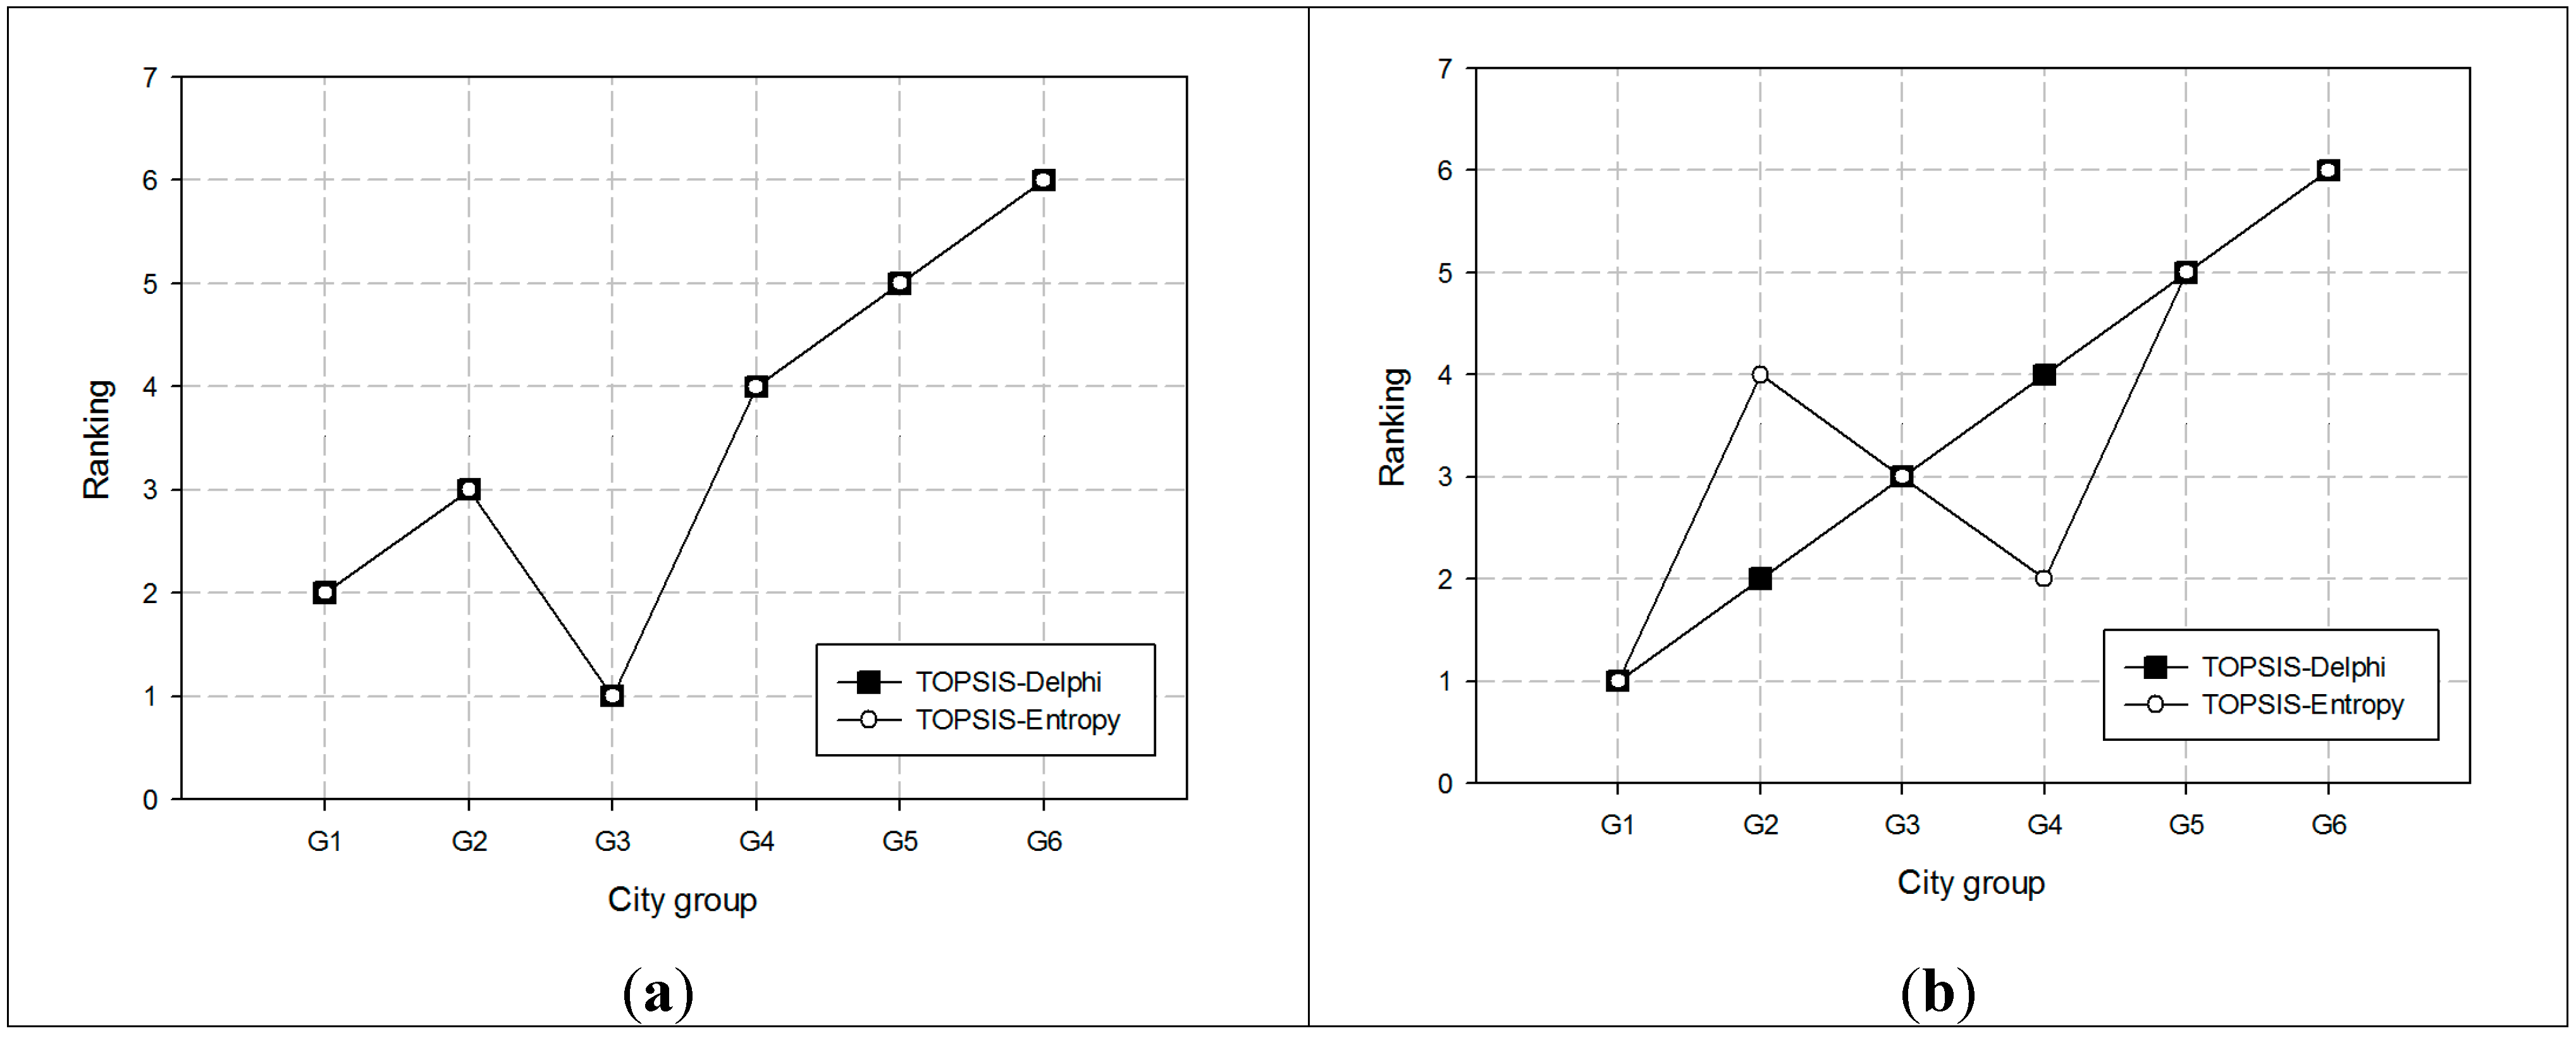
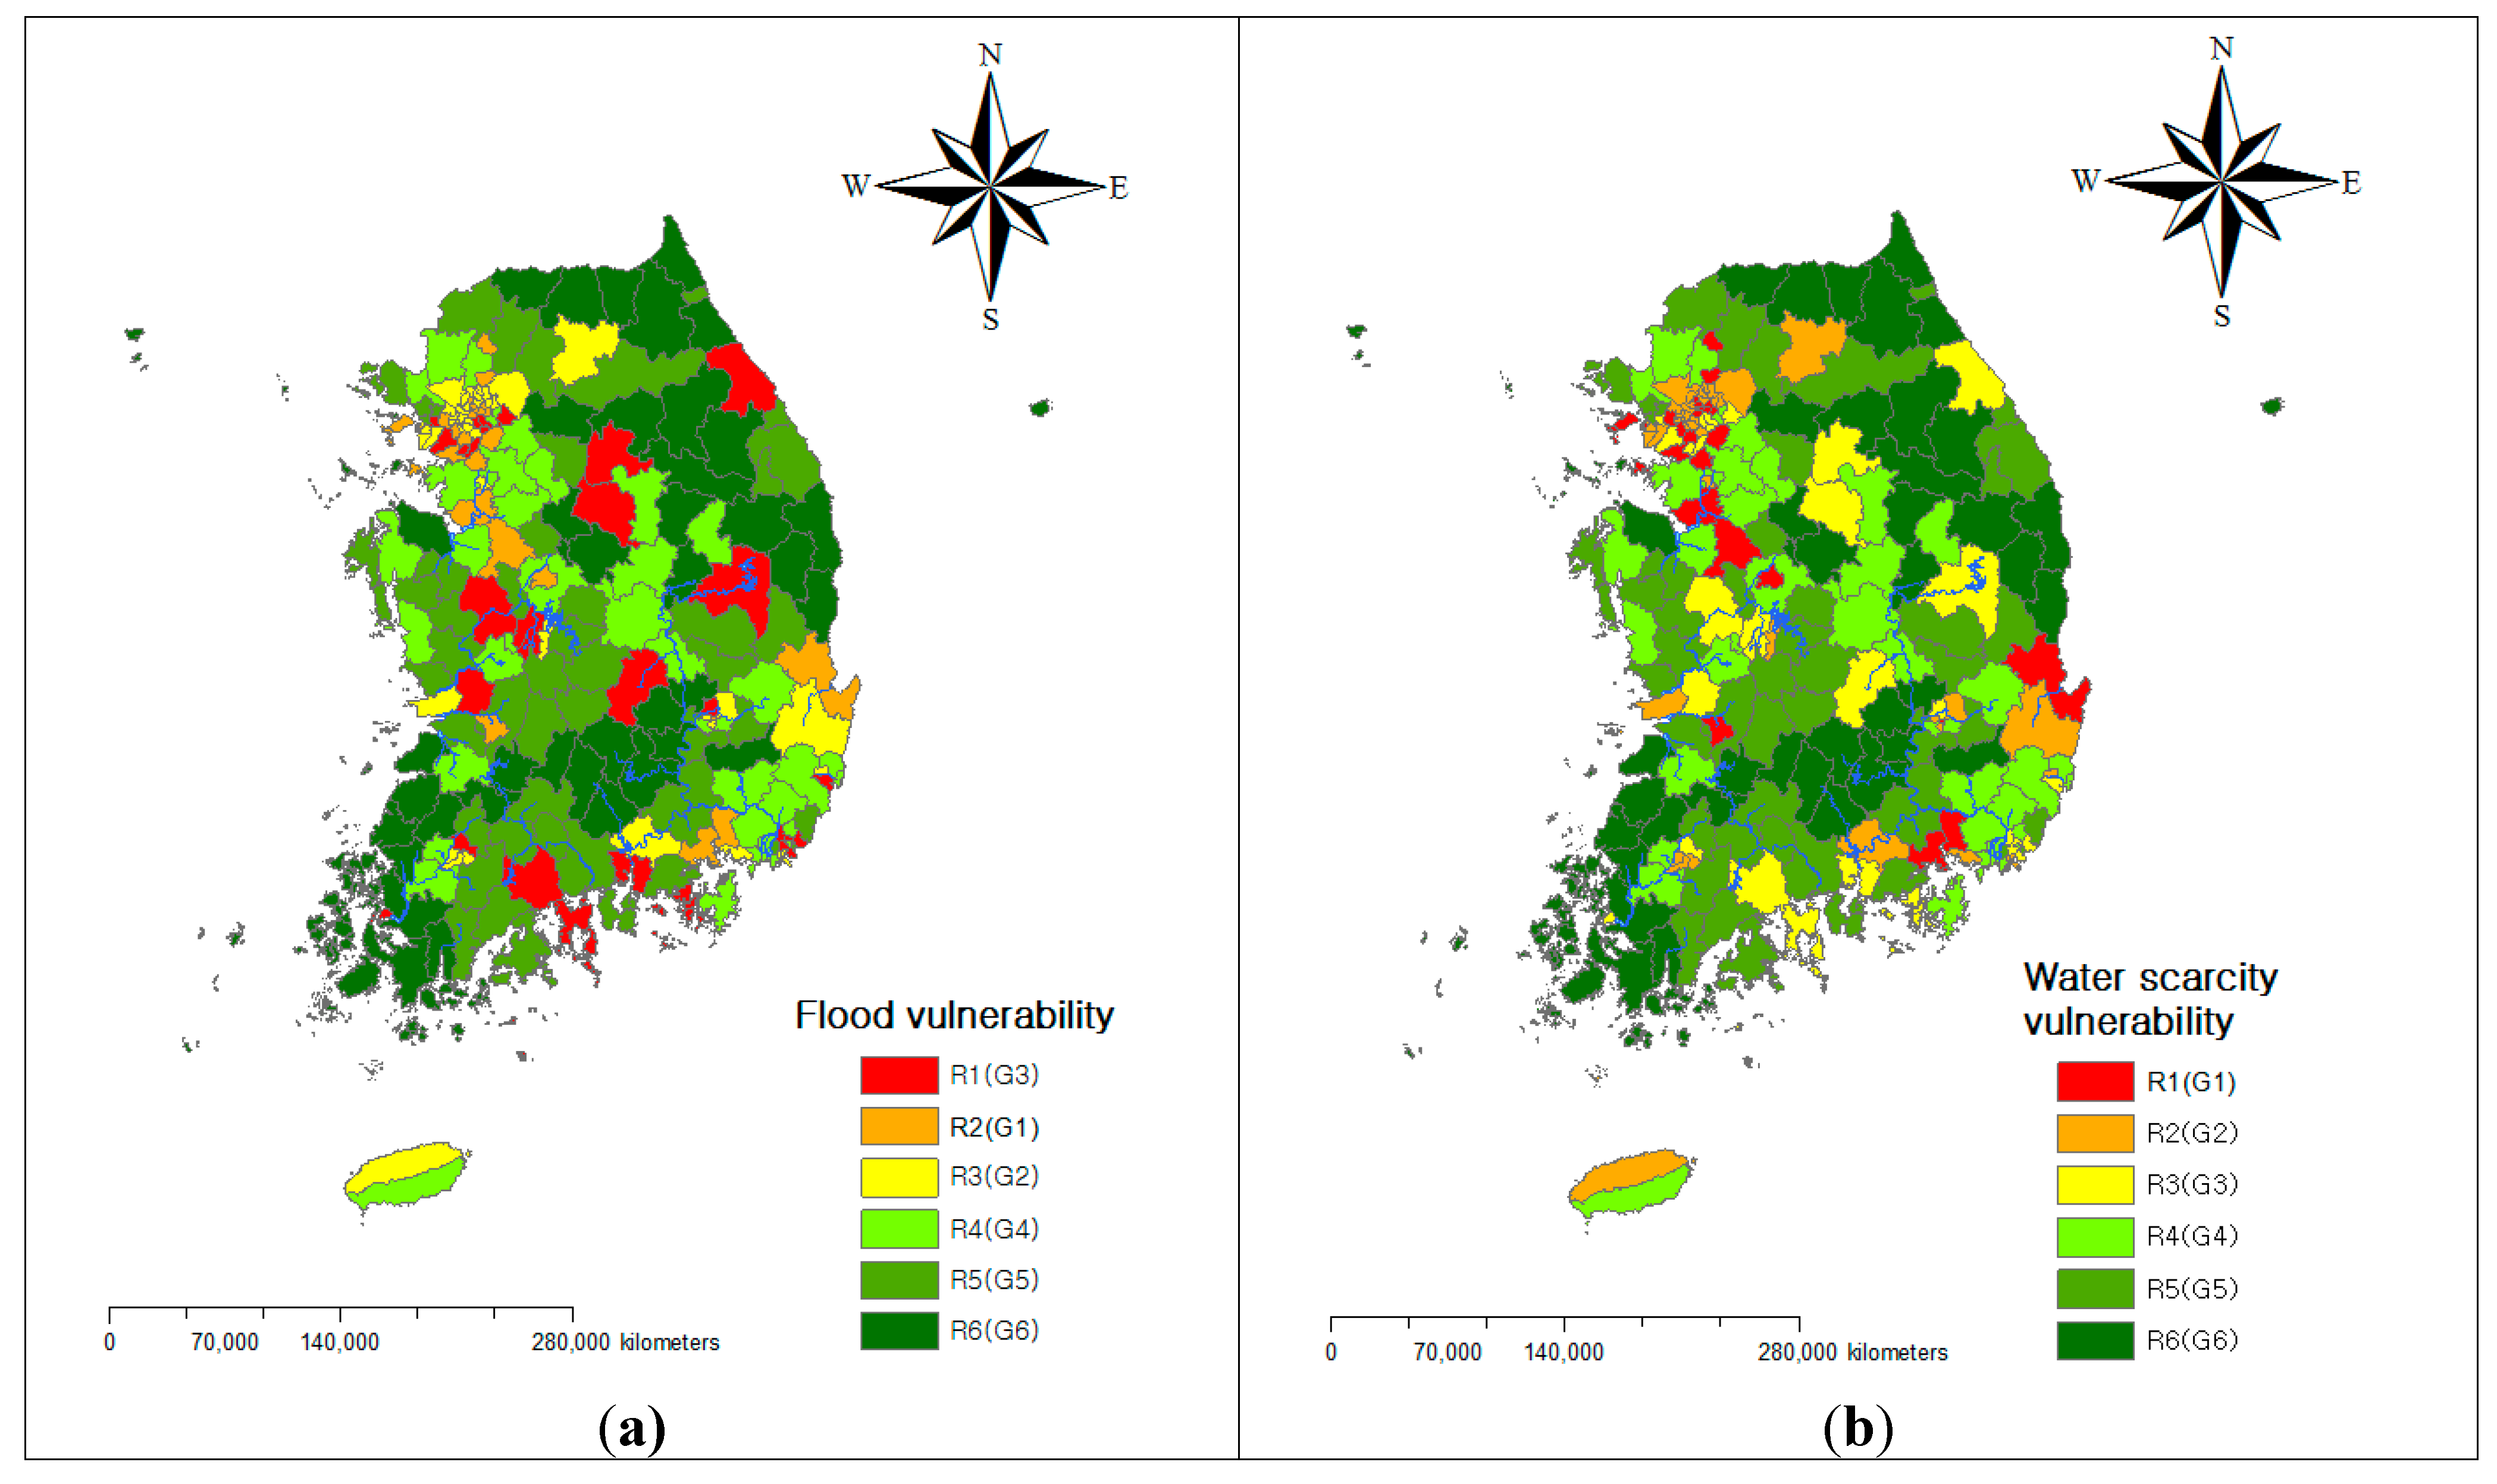
4.3. Vulnerability Rankings and Scores
| Method | Symbol | Sensitivity | Adaptive Capacity | Climate Exposure | C* | Ranking |
|---|---|---|---|---|---|---|
| TOPSIS with Delphi | G1 | 0.510 | 0.656 | 0.370 | 0.363 | 2 |
| G2 | 0.474 | 0.565 | 0.411 | 0.306 | 3 | |
| G3 | 0.546 | 0.498 | 0.412 | 0.871 | 1 | |
| G4 | 0.460 | 0.487 | 0.413 | 0.263 | 4 | |
| G5 | 0.354 | 0.412 | 0.419 | 0.163 | 5 | |
| G6 | 0.193 | 0.311 | 0.394 | 0.023 | 6 | |
| TOPSIS with entropy | G1 | 0.515 | 0.715 | 0.465 | 0.398 | 2 |
| G2 | 0.490 | 0.555 | 0.498 | 0.331 | 3 | |
| G3 | 0.513 | 0.494 | 0.489 | 0.886 | 1 | |
| G4 | 0.427 | 0.521 | 0.488 | 0.266 | 4 | |
| G5 | 0.297 | 0.471 | 0.477 | 0.138 | 5 | |
| G6 | 0.165 | 0.403 | 0.474 | 0.004 | 6 |

| Method | Symbol | Sensitivity | Adaptive Capacity | Climate Exposure | C* | Ranking |
|---|---|---|---|---|---|---|
| TOPSIS with Delphi | G1 | 0.782 | 0.581 | 0.590 | 1.000 | 1 |
| G2 | 0.698 | 0.439 | 0.537 | 0.568 | 2 | |
| G3 | 0.670 | 0.482 | 0.493 | 0.538 | 3 | |
| G4 | 0.582 | 0.501 | 0.522 | 0.438 | 4 | |
| G5 | 0.520 | 0.507 | 0.471 | 0.286 | 5 | |
| G6 | 0.476 | 0.526 | 0.393 | 0.224 | 6 | |
| TOPSIS with entropy | G1 | 0.669 | 0.696 | 0.531 | 1.000 | 1 |
| G2 | 0.518 | 0.518 | 0.470 | 0.246 | 4 | |
| G3 | 0.571 | 0.499 | 0.466 | 0.300 | 3 | |
| G4 | 0.531 | 0.531 | 0.498 | 0.325 | 2 | |
| G5 | 0.543 | 0.505 | 0.448 | 0.215 | 5 | |
| G6 | 0.543 | 0.523 | 0.378 | 0.125 | 6 |
5. Conclusions
Acknowledgments
Author Contributions
Conflicts of Interest
References
- United Nations (UN). World Urbanization Prospects: The 2011 Revision, Population Division of the Department of Economic and Social Affairs; UN: New York, NY, USA, 2012. [Google Scholar]
- Padowski, J.C.; Jawitz, J.W. Water availability and vulnerability of 225 large cities in the United States. Water Resour. Res. 2012, 48, 1–16. [Google Scholar] [CrossRef]
- Vörösmarty, C.J.; Green, P.; Salisbury, J.; Lammers, R.B. Global water resources: Vulnerability from climate change and population growth. Science 2000, 289, 284–288. [Google Scholar]
- Arnell, N.W.; Delaney, E.K. Adapting to Climate Change: Public Water Supply in England and Wales; Unpublished Paper; School of Geography, University of Southampton: Southampton, UK, 2004. [Google Scholar]
- Medellín-Azuara, J.; Harou, J.J.; Olivares, M.A.; Madani, K.; Lund, J.R.; Howitt, R.E.; Tanaka, S.K.; Jenkins, M.W. Adaptability and adaptations of California’s water supply system to dry climate warming. Clim. Chang. 2008, 87 (Suppl. 1), S75–S90. [Google Scholar]
- Cameron, D.; Beven, K.; Naden, P. Flood frequency estimation under climate change (with uncertainty). Hydrol. Earth Syst. Sci. 2000, 4, 393–405. [Google Scholar] [CrossRef]
- Prudhomme, C.; Jakoba, D.; Svenssona, C. Uncertainty and climate change impact on the flood regime of small UK catchments. J. Hydrol. 2003, 277, 1–23. [Google Scholar] [CrossRef]
- Kay, A.L.; Davies, H.N.; Bell, V.A.; Jones, R.G. Comparison of uncertainty sources for climate change impacts: Flood frequency in England. Clim. Chang. 2009, 92, 41–63. [Google Scholar] [CrossRef]
- Stewart, T.J. A critical survey on the status of multiple criteria decision making theory and practice. OMEGA 1992, 20, 569–586. [Google Scholar] [CrossRef]
- Lee, K.S.; Chung, E.S. Development of integrated watershed management schemes for an intensively urbanized region in Korea. J. Hydro-Environ. Res. 2007, 1, 95–109. [Google Scholar]
- Chung, E.S.; Lee, K.S. Identification of spatial ranking of hydrological vulnerability using multi-criteria decision making techniques: Case of Korea. Water Resour. Manag. 2009, 23, 2395–2416. [Google Scholar] [CrossRef]
- Jun, K.S.; Chung, E.S.; Kim, Y.G.; Kim, Y. A fuzzy multi-criteria approach to flood risk vulnerability in South Korea by considering climate change impacts. Exp. Syst. Appl. 2013, 40, 1003–1013. [Google Scholar] [CrossRef]
- Li, Q.; Zhou, J.; Liu, D.; Jiang, X. Research on flood risk analysis and evaluation method based on variable fuzzy sets and information diffusion. Saf. Sci. 2012, 50, 1275–1283. [Google Scholar] [CrossRef]
- Kim, Y.; Chung, E.S. Fuzzy VIKOR approach for assessing the vulnerability of the water supply to climate change and variability in South Korea. Appl. Math. Model. 2013, 37, 9419–9430. [Google Scholar] [CrossRef]
- National Institute Environmental Research (NIER). Sectoral Climate Change Vulnerability Map for Guiding the Development of Climate Change Adaptation Action Plan at District Level; NIER: Incheon, South Korea, 2011. (In Korean) [Google Scholar]
- Pandey, V.P.; Babel, M.S.; Shrestha, S.; Kazama, F. Vulnerability of freshwater resources in large and medium Nepalese river basins to environmental change. Water Sci. Technol. 2010, 61, 1525–1534. [Google Scholar] [CrossRef] [PubMed]
- Adger, W.N. Vulnerability. Glob. Environ. Chang. 2006, 16, 268–281. [Google Scholar] [CrossRef]
- Kelly, P.M.; Adger, W.N. Theory and practice in assessing vulnerability to climate change and facilitating adaptation. Clim. Chang. 2000, 47, 325–352. [Google Scholar] [CrossRef]
- Intergovernmental Panel on Climate Change (IPCC). Climate Change 2001: Impacts, Adaptation Vulnerability. In Contribution of Working Group II to the Third Assessment Report of the Intergovernmental Panel on Climate Change; UNEP/WMO: Geneva, Switzerland, 2001. [Google Scholar]
- Hinkel, J. Indicators of vulnerability and adaptive capacity—Towards a clarification of the science-policy interface. Glob. Environ. Chang. 2011, 21, 198–208. [Google Scholar] [CrossRef]
- Turner, B.L.; Kasperson, R.E.; Matsone, P.A.; McCarthy, J.J.; Corell, R.W.; Christensen, L.; Eckley, L.; Kasperson, J.X.; Luerse, A; Martello, M.L.; et al. A framework for vulnerability analysis in sustainability science. Proc. Natl. Acad. Sci. USA 2003, 100, 8074–8079. [Google Scholar]
- Gain, A.K.; Giupponi, C.; Renaud, F.G. Climate change adaptation and vulnerability assessment of water resources systems in developing countries: A generalized framework and a feasibility study in Bangladesh. Water 2012, 4, 345–366. [Google Scholar] [CrossRef]
- Hamouda, M.A.; Nour el-Din, M.M.; Moursy, F.I. Vulnerability assessment of water resources system in the Eastern Nile Basin. Water Resour. Manag. 2009, 23, 2697–2725. [Google Scholar] [CrossRef]
- Seager, J. Perspectives and limitations of indicators in water management. Reg. Environ. Chang. 2001, 2, 85–92. [Google Scholar] [CrossRef]
- Linstone, H.A.; Turoff, M. The Delphi Method: Techniques and Application; Addison-Wesley Publishing Company Advanced Book Program: Boston, MA, USA, 1975. [Google Scholar]
- Adler, M.; Ziglio, E. Gazing into the Oracle: The Delphi Method and Its Application to Social Policy and Public Health; Jessica Kingsley Publishers: London, UK, 1996. [Google Scholar]
- Richey, J.S.; Mar, B.W.; Horner, R.R. The delphi technique in environmental assessment implementation and effectiveness. J. Environ. Manag. 1985, 21, 135–146. [Google Scholar]
- Rowe, G.; Wright, G. The Delphi Technique as a Forecasting Tool: Issues and analysis. Int. J. Forecast. 1999, 15, 353–375. [Google Scholar] [CrossRef]
- Shannon, C.E. A mathematical theory of communication. Bell Syst. Tech. J. 1948, 27, 379–423. [Google Scholar] [CrossRef]
- Yan, J.; Zhang, T.; Zhang, B.; Wu, B. Application of entropy weight fuzzy comprehensive evaluation in optimal selection of engineering machinery. In Proceedings of the 2008 International Colloquium on Computing, Communication, Control, and Management, Guangzhou, China, 3–4 August 2008; pp. 220–223.
- Hwang, C.L.; Yoon, K. Multiple Attributes Decision Making Methods and Applications; Springer: Heidelberg, Germany, 1981. [Google Scholar]
- Kim, Y.; Chung, E.S. An index-based robust decision making framework for watershed management in a changing climate. Sci. Total Environ. 2014, 473–474, 88–102. [Google Scholar]
- Ye, F.; Li, Y. An extended TOPSIS model based on the possibility theory under fuzzy environment. Knowl. Based Syst. 2014, 67, 263–269. [Google Scholar] [CrossRef]
- Ho, C.H.; Park, T.W.; Jun, S.Y.; Lee, M.H.; Park, C.E.; Kim, J. A projection of extreme climate events in the 21st century over East Asia using the community climate system model 3. J. Atmos. Sci. 2011, 47, 329–344. [Google Scholar]
- Lee, M.H.; Ho, C.H.; Kim, J.; Song, C.K. Assessment of the changes in extreme vulnerability over East Asia due to global warming. Clim. Chang. 2012, 113, 301–321. [Google Scholar] [CrossRef]
© 2014 by the authors; licensee MDPI, Basel, Switzerland. This article is an open access article distributed under the terms and conditions of the Creative Commons Attribution license (http://creativecommons.org/licenses/by/3.0/).
Share and Cite
Chung, E.-S.; Won, K.; Kim, Y.; Lee, H. Water Resource Vulnerability Characteristics by District’s Population Size in a Changing Climate Using Subjective and Objective Weights. Sustainability 2014, 6, 6141-6157. https://doi.org/10.3390/su6096141
Chung E-S, Won K, Kim Y, Lee H. Water Resource Vulnerability Characteristics by District’s Population Size in a Changing Climate Using Subjective and Objective Weights. Sustainability. 2014; 6(9):6141-6157. https://doi.org/10.3390/su6096141
Chicago/Turabian StyleChung, Eun-Sung, Kwangjae Won, Yeonjoo Kim, and Hosun Lee. 2014. "Water Resource Vulnerability Characteristics by District’s Population Size in a Changing Climate Using Subjective and Objective Weights" Sustainability 6, no. 9: 6141-6157. https://doi.org/10.3390/su6096141
APA StyleChung, E.-S., Won, K., Kim, Y., & Lee, H. (2014). Water Resource Vulnerability Characteristics by District’s Population Size in a Changing Climate Using Subjective and Objective Weights. Sustainability, 6(9), 6141-6157. https://doi.org/10.3390/su6096141