Article

Spatiotemporal Pattern and Driving Forces of Arable Land-Use Intensity in China: Toward Sustainable Land Management Using Emergy Analysis

1
Institute of Poyang Lake Eco-economics, Jiangxi University of Finance and Economics, Nanchang 330013, China
2
College of Public Administration, Nanjing Agricultural University, Nanjing 210095, China
3
Department of International Trade, Inha University, Inharo 100, Nam-gu, Incheon 402-751, Korea
*
Authors to whom correspondence should be addressed.
Sustainability 2014, 6(6), 3504-3520; https://doi.org/10.3390/su6063504
Submission received: 21 January 2014 / Revised: 17 May 2014 / Accepted: 20 May 2014 / Published: 28 May 2014

Abstract

:
The level of arable land-use intensity has important impacts on food security and rural sustainable development. Using the emergy method, we investigate the spatial disparities and driving forces of arable land-use intensity in China from 1999 to 2008 at the national, regional and provincial levels. The empirical results show that chemical fertilizer was the largest component of agricultural inputs and that agricultural diesel oil recorded the highest growth rate. The degree of heterogeneities in arable land-use intensity in China showed a decreasing trend, which resulted mainly from the differences among the eastern, northeastern, central and western regions. The regional disparities in labor, pesticides and plastic sheeting decreased from 1999 to 2008. The per capita annual net incomes of household operations and the agricultural policies had a significant positive correlation with total inputs, fertilizer inputs, pesticide inputs and agricultural plastic sheeting. In addition, the nonagricultural population had a greater impact on agricultural plastic sheeting. Finally, we suggest that there is an urgent need to focus on the effects of chemical fertilizer and pesticide inputs on the ecological environment. Agricultural support policies should be introduced for the poor agricultural production provinces.

1. Introduction

Land use is an economic and social activity, wherein goods and services are obtained through the combined use of human labor and land resources [1,2,3,4,5]. Arable land is one of the necessary resources for human survival [6,7]. The level of arable land-use intensity has important impacts on food security and rural sustainable development. China suffers from a relative scarcity of arable land. The per capita arable land area was only 1.39 acres in 2006, less than 40% of the world average at the time. Additional, accelerating urbanization and a growing population have drastically reduced China’s arable land [8,9]. To maintain sustainable development in agriculture, it is imperative first to ensure the quantity and quality of arable land. The lack of incentives for improving the quality of arable land may pose more threats to food security than the reduction in arable land area [6,10]. Since the initiation of economic reforms in China, increasing arable land use and production intensity have played critical roles in meeting the growing demand for food [11,12]. Therefore, intensive use of arable land has become a vital strategy for alleviating the shortage of arable land and ensuring food security [13]. The structural characterization of arable land-use intensity reflects the internal structure of and trends in land-use intensity. In recent years, in addition to considering the indicators used to measure arable land-use intensity, researchers have explored the factors affecting its development by analyzing the structural features of land-use intensity [14]. The structural features of land-use intensity can also reveal the associated impacts on the surrounding ecological environment. Certain studies have indicated that these features will vary with economic development and that capital investment will be gradually replaced by labor input [15]. Thus, it is particularly significant to study the structural features, regional disparities and driving forces of arable land-use intensity in China [6,12,15,16].
In China’s economically developed regions, there is evidence of an apparent decline in the labor force on China’s arable land, a gradual decline in the proportion of capital investment in increasing production and a rapid growth in labor-saving inputs through capital investment [17]. In contrast, the economically underdeveloped areas show a higher degree of labor intensity and low capital intensity [17]. It is apparent that these studies analyzed the structural features of arable land-use intensity in China from the viewpoints of labor intensity and capital intensity. The structural features of arable land-use intensity should be further refined, such as in terms of fertilizer intensity or pesticide intensity, so that they specifically reflect the changing trends in intensive land use. In addition, past studies have not focused on the changing differences in these internal structures among various areas of the country. Using methods, such as monetary evaluation, to measure arable land-use intensity, previous studies on the structural features of land-use intensity have always considered prices of agricultural inputs to be a unified dimensionless quantity. However, the price method suffers from two main defects. The biggest shortcoming is that spatiotemporal disparities in the prices of labor and production are remarkably obvious, and there are sometimes large deviations from the real quantities of labor and material inputs [6]. Additionally, price is a quantitative measure that does not hold any information about the quality of the input/product. In contrast, emergy evaluation offers insight into the quality of the inputs in agricultural production. Emergy is the available energy (exergy) of one kind that is used in transformations directly and indirectly to make a product or service [16]. Emergy accounts for and, in effect, measures quality differences between forms of energy [16]. Furthermore, emergy can be used to evaluate the indirect and direct work of nature and does not suffer from the problem of spatiotemporal differences [18,19]. It can eliminate the defects of the monetary evaluation by evaluating the arable land-use intensity from an eco-centric perspective, thereby excluding any anthropocentric views on agricultural production [20]. In recent years, scholars have begun to apply the theory of emergy to analyze arable land eco-economic systems [21,22]. Thus, using emergy analysis to investigate the quality of the land-use intensity, this study analyzes the spatiotemporal patterns, regional disparities and driving factors of arable land-use intensity in China. The results will contribute toward the sustainable management of arable land in China.

2. Materials and Methods

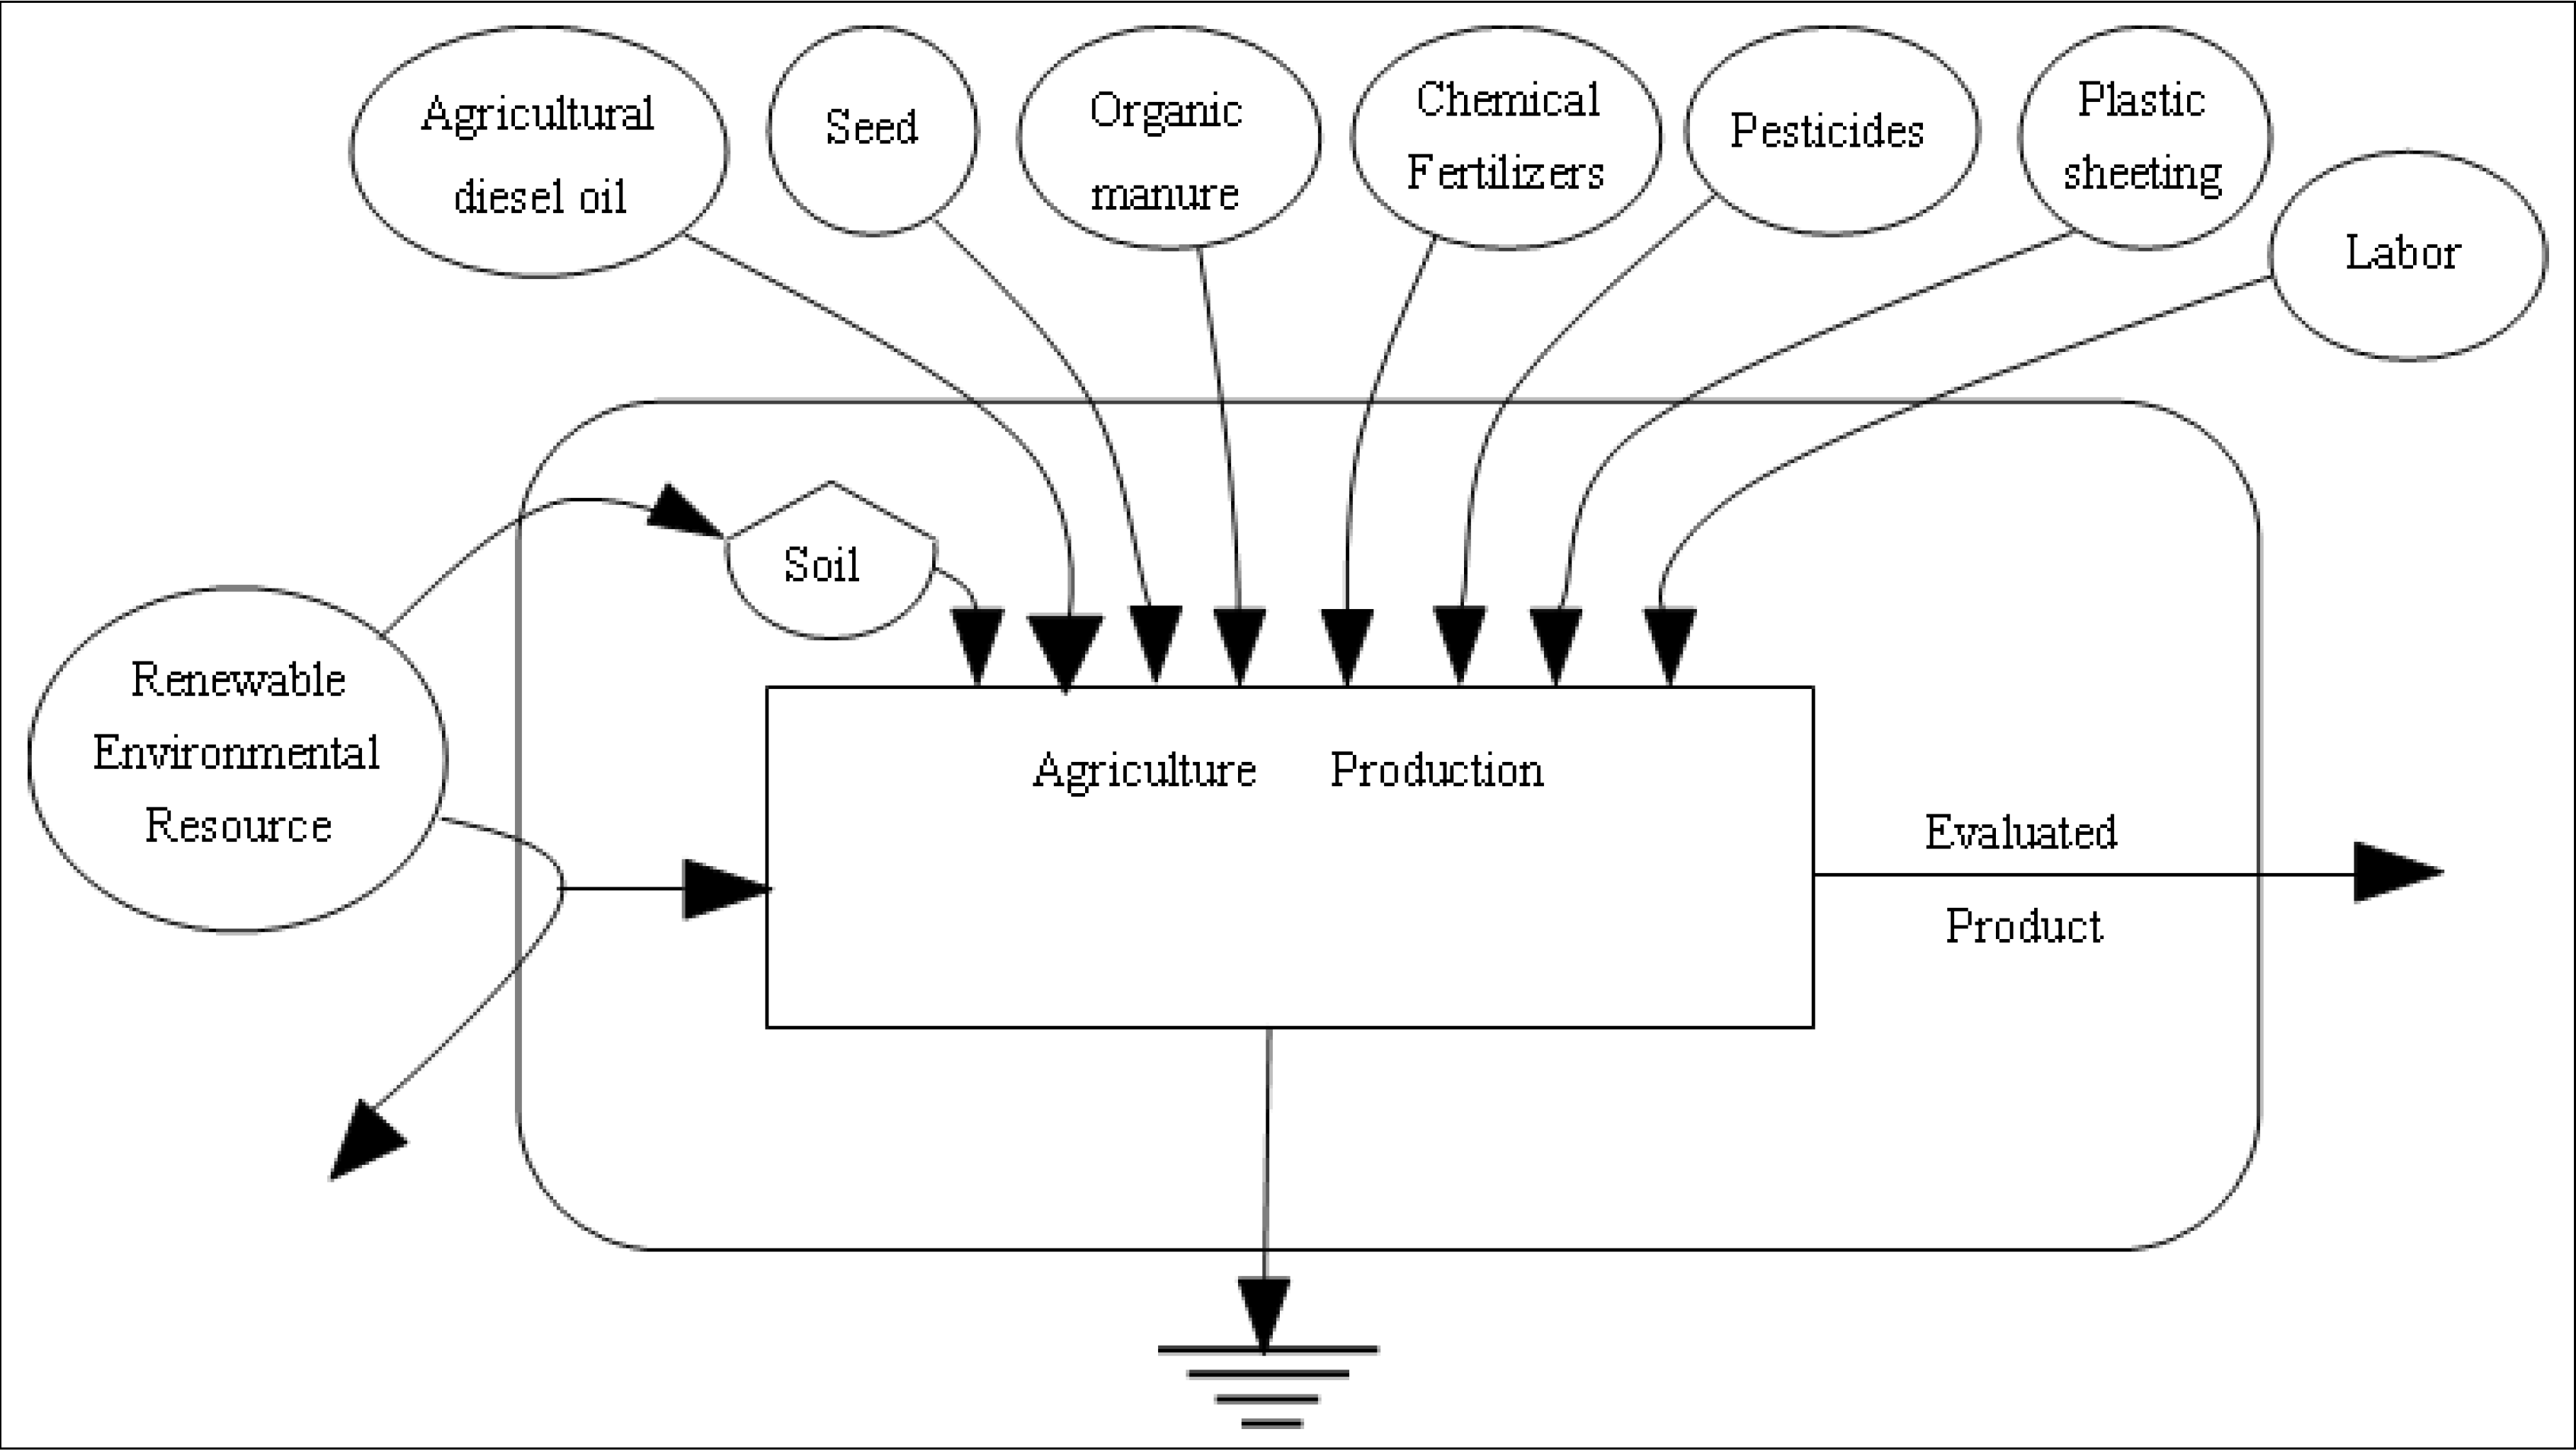
2.1. System Investigated

In this study, we will investigate the agricultural production system in China during the time period of 1999–2008 to examine the spatiotemporal pattern and driving forces of arable land-use intensity. The agricultural production system in China is a semi-natural ecosystem under human control. The main input items of the agricultural production system in China include chemical fertilizers, pesticides, plastic sheeting, organic fertilizers, seeds and labor. In particular, modern agriculture in China focuses on the input of industrial auxiliary goods and is not aware of the values of environmental resources. To evaluate a system, first, a system diagram is drawn to organize the evaluation and account for all inputs and outflows [16]. The energy diagram of the agricultural production system in China can enable us to understand more easily the basic structure and the internal and external relationships between the ecological stream flows of the agricultural production system. According to related studies and the characteristics of agricultural production in China [23,24,25,26], we have drawn the energy diagram of inputs for agricultural production in China (Figure 1).
Figure 1. Energy diagram of inputs for agricultural production in China.
Sustainability 06 03504 g001
According to the level of economic development and the status of national policy support, China is generally divided into four major regions, i.e., the developed eastern region (Eastern region), the rising middle region (Central region), the developing western region (Western region) and the revitalizing northeast district (Northeastern region). When measuring the spatial disparity, this study considers the above four regions in China.

2.2. Data

Based on the accessibility of data, this study divides the input items of arable land in China into the five categories, including renewable resources (sun, rain and wind), non-renewable resources (soil), industrial auxiliary goods (chemical fertilizers, pesticides, plastic sheeting, etc.), organic goods (organic fertilizers, seeds) and others (labor, etc.). The data pertaining to the nitrogen, phosphate, potash and compound fertilizers, pesticides, plastic sheeting and diesel are sourced from the China Rural Statistical Yearbook. The data on the labor force and the area of arable land are sourced from the China Statistics Yearbook of Labor and the China Statistical Yearbook of Land and Resources, respectively. The data on the amount of labor per hectare are derived from the 2012 National Agricultural Costs and Returns Assembly. The time scale of the data spans 10 years (1999–2008), and spatially, we consider China’s 31 provinces (municipalities and autonomous regions). Hong Kong, Macao and Taiwan have been excluded from the scope of this study, due to data unavailability.

2.3. Methods

2.3.1. Measuring Emergy for Input Items

The “solar value” can be used to measure a variety of energy values in practical applications, since solar energy can be converted into any other form of energy. In other words, the amount of solar energy consumed in the creation of any resource, product or service is the solar value of that entity [18,27]. In this study, we use the concept of emergy as a unified measure for six inputs to arable land per hectare, and we analyze China’s emergy intensity of arable land use and its structural characteristics. It should be noted that in addition to the abovementioned five inputs/investments, investment in arable land includes herbicides and other services. However, taken together, the proportions of the five kinds of inputs selected in this study are relatively larger and represent the overall trend of investment in arable land. Emergy analysis is an environmental accounting approach and is able to account for free local resources. In particular, it enables the unification of flows in various forms. Unit emergy values (UEVs) are computed based on the emergy required to generate one unit of output from a process [16]. The unit emergy values (UEVs) of the sun, rain, wind, soil, labor, agricultural diesel, N fertilizers, P fertilizers, K fertilizers, pesticides and plastic sheeting are sourced from related studies [26,27]. The translated data used in this study mainly refer to the relevant literature [27,28].
The fundamental formula for the calculation of the emergy of the inputs is as follows:
Em (seJ) = flow (J, g, $) × UEVs (seJ/J, seJ/g, seJ/$)
The formula for labor emergy (LE) per hectare of arable land is as follows:
LE = Tl × UEVl × Nl × Dl
where LE is the labor emergy per unit area of arable land, Tl is the conversion rate of labor energy, UEVl is the UEV of labor, Nl is the quantity of labor per hectare of arable land and Dl is the average labor days per hectare of arable land.

2.3.2. Measuring Regional Disparity

Theil’s T statistic was introduced by Theil to measure local income inequality [29]. The regional disparities in arable land-use intensity and its structure can be measured using Theil’s T statistic in this study, because Theil’s T statistic effectively uses group data and allows researchers to analyze inequalities within groups and between components of a group. Therefore, Theil’s T statistic can reveal the source of inequality and its values. The following equation calculates Theil’s T statistic for differences in arable land-use intensity at the provincial level:
Sustainability 06 03504 i001
where n is the number of provinces, yp is the arable land-use intensity of province p and μy is the national average of arable land-use intensity. If every province has exactly the same arable land-use intensity, T will be zero; this represents perfect equality and is the minimum value of T. If one province is accountable for all arable land-use intensity, T will equal lnn; this represents the utmost inequality and is the maximum value of T. The value of T is a monotonically increasing measure of inequality in the distribution of arable land-use intensity, bounded by T∈[0, lnn].
If provinces in China are classified into four types of areas, then the additive decomposability of Theil’s T statistic can be estimated for China as the sum of two components: the elements between regions (Tbr) and the elements within a region (Twr).
T = Tbr + Twr
The index for between-region elements (Tbr) can be used as a lower bound for the country’s Theil’s T statistic. The between-region component of Theil’s T statistic can be written as:
Sustainability 06 03504 i002
where m is the number of regions, pi is the number of the provinces in region i, P is the total number of provinces, yi is the average of arable land-use intensity in region i and μ is the average arable land-use intensity in China.

2.3.3. Econometric Model

In this paper, we establish an empirical model to explore the factors influencing arable land-use emergy intensity in the various provinces of China. The econometric model is as follows:
Yit = αit + β1INCit + β2INDit + β3POPit + β4POLit + uit
where i (i = 1, ..., 31) and t (t = 1999, ..., 2008) represent the province, i, and year t, respectively. The term, αit, is a constant, and uit is the random error term. Yit is the emergy intensity of land-use, an explanatory variable. INCit is the net rural household income per capita. INDit is the proportion of nonagricultural industry. POPit is the proportion of nonagricultural population, and POLit represents the agricultural support policy.
According to the hypothesis of economic man, an increase in the net income of rural households per capita drives farmers to increase agricultural production and also determines the farmers’ investment capacities in arable land. To remove the heteroscedasticity in the data to the extent possible, we take the log of INCit. In general, positive changes in agricultural output in one year lead to adjustments in agricultural inputs in the following year. Therefore, we set INCit with a time lag effect of one year.
The development of the secondary and tertiary industries has driven improvements in production equipment, capital investment and the technology for agricultural production, and the increasing demand for agricultural products has promoted agricultural intensification. The rising proportion of the nonagricultural industry has had a tremendous positive impact on the intensive use of arable land.
An important characterization of the urbanization process is the reduction in the proportion of the nonagricultural population. Thus, in this study, we choose the proportion of the nonagricultural population to characterize the level of urbanization. The rising proportion of nonagricultural population drives the demand for agricultural products and, therefore, also spurs improvements in agricultural management. In such a case, farmers would increase investments in farmland and increase the use intensity of arable land, thus producing more agricultural products and reaping greater economic benefits.
In China, agricultural support policies have had a significant impact on agricultural development. Since 2004, the Chinese government has guided this development in rural areas through No. 1 Central Document; for nine consecutive years, the government has maintained concerted efforts to support and promote agriculture, thus improving the overall production capacity of the sector. Therefore, POLit is zero before the year 2004 and one otherwise.
This study considers the panel data of 31 provinces from 1999 to 2008. We conducted a regression analysis of arable land-use intensity with Eviews7.0 software. First, we conducted the F-test analysis for the abovementioned econometric model, to ascertain whether it supports the variable intercept model. Then, we use the Hausman test to determine whether the fixed effects model or the random effects model is more suitable. The results of the Hausman test showed that the model supports the fixed effects model. Finally, the least squares dummy variable method (LSDV) was used to estimate the fixed effects model.

3. Results and Discussion

3.1. Change in Emergy Intensity of Arable Land-Use at the Country Level

According to Formulas (1) and (2), we can obtain the emergy flows of agricultural production in China during the time period of 1999–2008. Considering the limited space, we only list the emergy flow of China in 1999 (see Table 1).
Table 1. Emergy flows of agricultural production of China in 1999.
ItemFlowFlow unitsUEVUEV unitsEmergyEmergy units
Renewable environmental flows:
1Sun3.56 × 1022J1.00sej/J3.56 × 1022sej
2Rain19.12 × 1018J1.82 × 104sej/J3.48 × 1022sej
3Wind22.84 × 1018J1.58 × 103sej/J3.61 × 1022sej
Non-renewable environmental flows:
4Soil1.68 × 1018J1.70 × 105sej/J28.63 × 1022sej
Non-renewable industrial flows:
5N fertilizer2180.90 × 1010g3.80 × 109sej/g8.29 × 1022sej
6P fertilizer697.80 × 1010g3.90 × 109sej/g2.72 × 1022sej
7K fertilizer365.60 × 1010g1.10 × 109sej/g0.40 × 1022sej
8Chemical manure880.00 × 1018g2.80 × 109sej/g2.46 × 1022sej
9Pesticides132.16 × 1010g1.62 × 109sej/g0.21 × 1022sej
10Plastic sheeting125.87 × 1010g3.80 × 108sej/g0.05 × 1022sej
11Agricultural diesel oil1354.30 × 1010g6.60 × 104sej/J3.87 × 1022sej
Renewable organic flows:
12Organic manure192.98 × 1013g4.54 × 106sej/g0.88 × 1022sej
13Seed133.93 × 1016g3.36 × 106sej/J4.50 × 1022sej
Other flows:
14Labor3.58 × 108J3.80 × 105sej/J5.51 × 1022sej
Total * 47.23 × 10²²sej
Notes: UEV = unit emergy value; * To avoid double counting, we consider only the largest of renewable environmental flows (sun, wind, rain).
According to the emergy flows of agricultural production in China, we obtain the emergy intensity of arable land use during the time period of 1999–2008 (see Table 2). From Table 2, we can see that the emergy intensity of arable land use increased from 47.23 × 10¹⁴ sej/ha in 1999 to 50.10 × 10¹⁴ sej/ha in 2008, an increase of 6.07% (see Table 2). The internal structures of arable land-use intensity reveal that labor input declined year-by-year, and agricultural diesel, fertilizers, pesticides and plastic sheeting exhibited increasing trends from 1999 to 2008. The largest increase was recorded for chemical manure.
From Table 2, we can see that for all the years studied, the emergy of fertilizers continued to represent the largest input factor in China’s agricultural sector. Although the proportions of fertilizer inputs fluctuated, they always exceeded 52% of the total input factors. The emergy of fertilizers input per unit area of arable land gradually increased through time, increasing by 29.26% from 1999 to 2008. Agricultural diesel oil increased by 47.67%, thus becoming the fastest-growing input factor of agricultural growth in China during this period.
Table 2. Input structures per unit of arable land in China from 1999 to 2008.
Input items1999200020012002200320042005200620072008
Renewable environmental resources2.692.652.702.682.502.632.642.752.992.99
Non-renewable environmental resources22.1622.1322.1422.1422.1322.1622.1222.1222.1322.13
Industrial GoodsChemical manure10.7410.8311.1011.4011.7912.4112.7513.1713.5913.88
Pesticides0.170.180.160.170.170.240.270.200.220.22
Plastic sheeting0.040.040.040.050.050.050.050.060.060.06
Agricultural diesel oil3.003.133.333.423.654.254.454.514.744.43
Organic materialsOrganic manure0.680.690.630.640.650.650.660.630.630.63
Seed3.483.493.493.493.483.483.483.493.483.48
Others Labor4.264.164.054.023.923.413.162.742.482.27
Total *47.2347.2947.6348.0048.3549.2849.5749.6850.3350.10
Note: * To avoid double counting, we consider only the largest of renewable environmental flows (sun, wind, rain).
Table 2 also shows that the emergy of labor decreased from 4.26 × 10¹⁴ sej/ha in 1999 to 2.27 × 10¹⁴ sej/ha in 2008, a reduction of 46.65%. This reduction resulted from the modernization of agriculture and, in particular, agricultural mechanization. It is also due to the increasing opportunity cost of farming labor. The proportion of agricultural diesel is one of the important indicators of agricultural mechanization. The emergy of investment in agricultural diesel increased from 3.00 × 10¹⁴ sej/ha in 1999 to 4.43 × 10¹⁴ sej/ha in 2008 (Table 2), which means that the level of agricultural mechanization in China increased from 1999 to 2008.

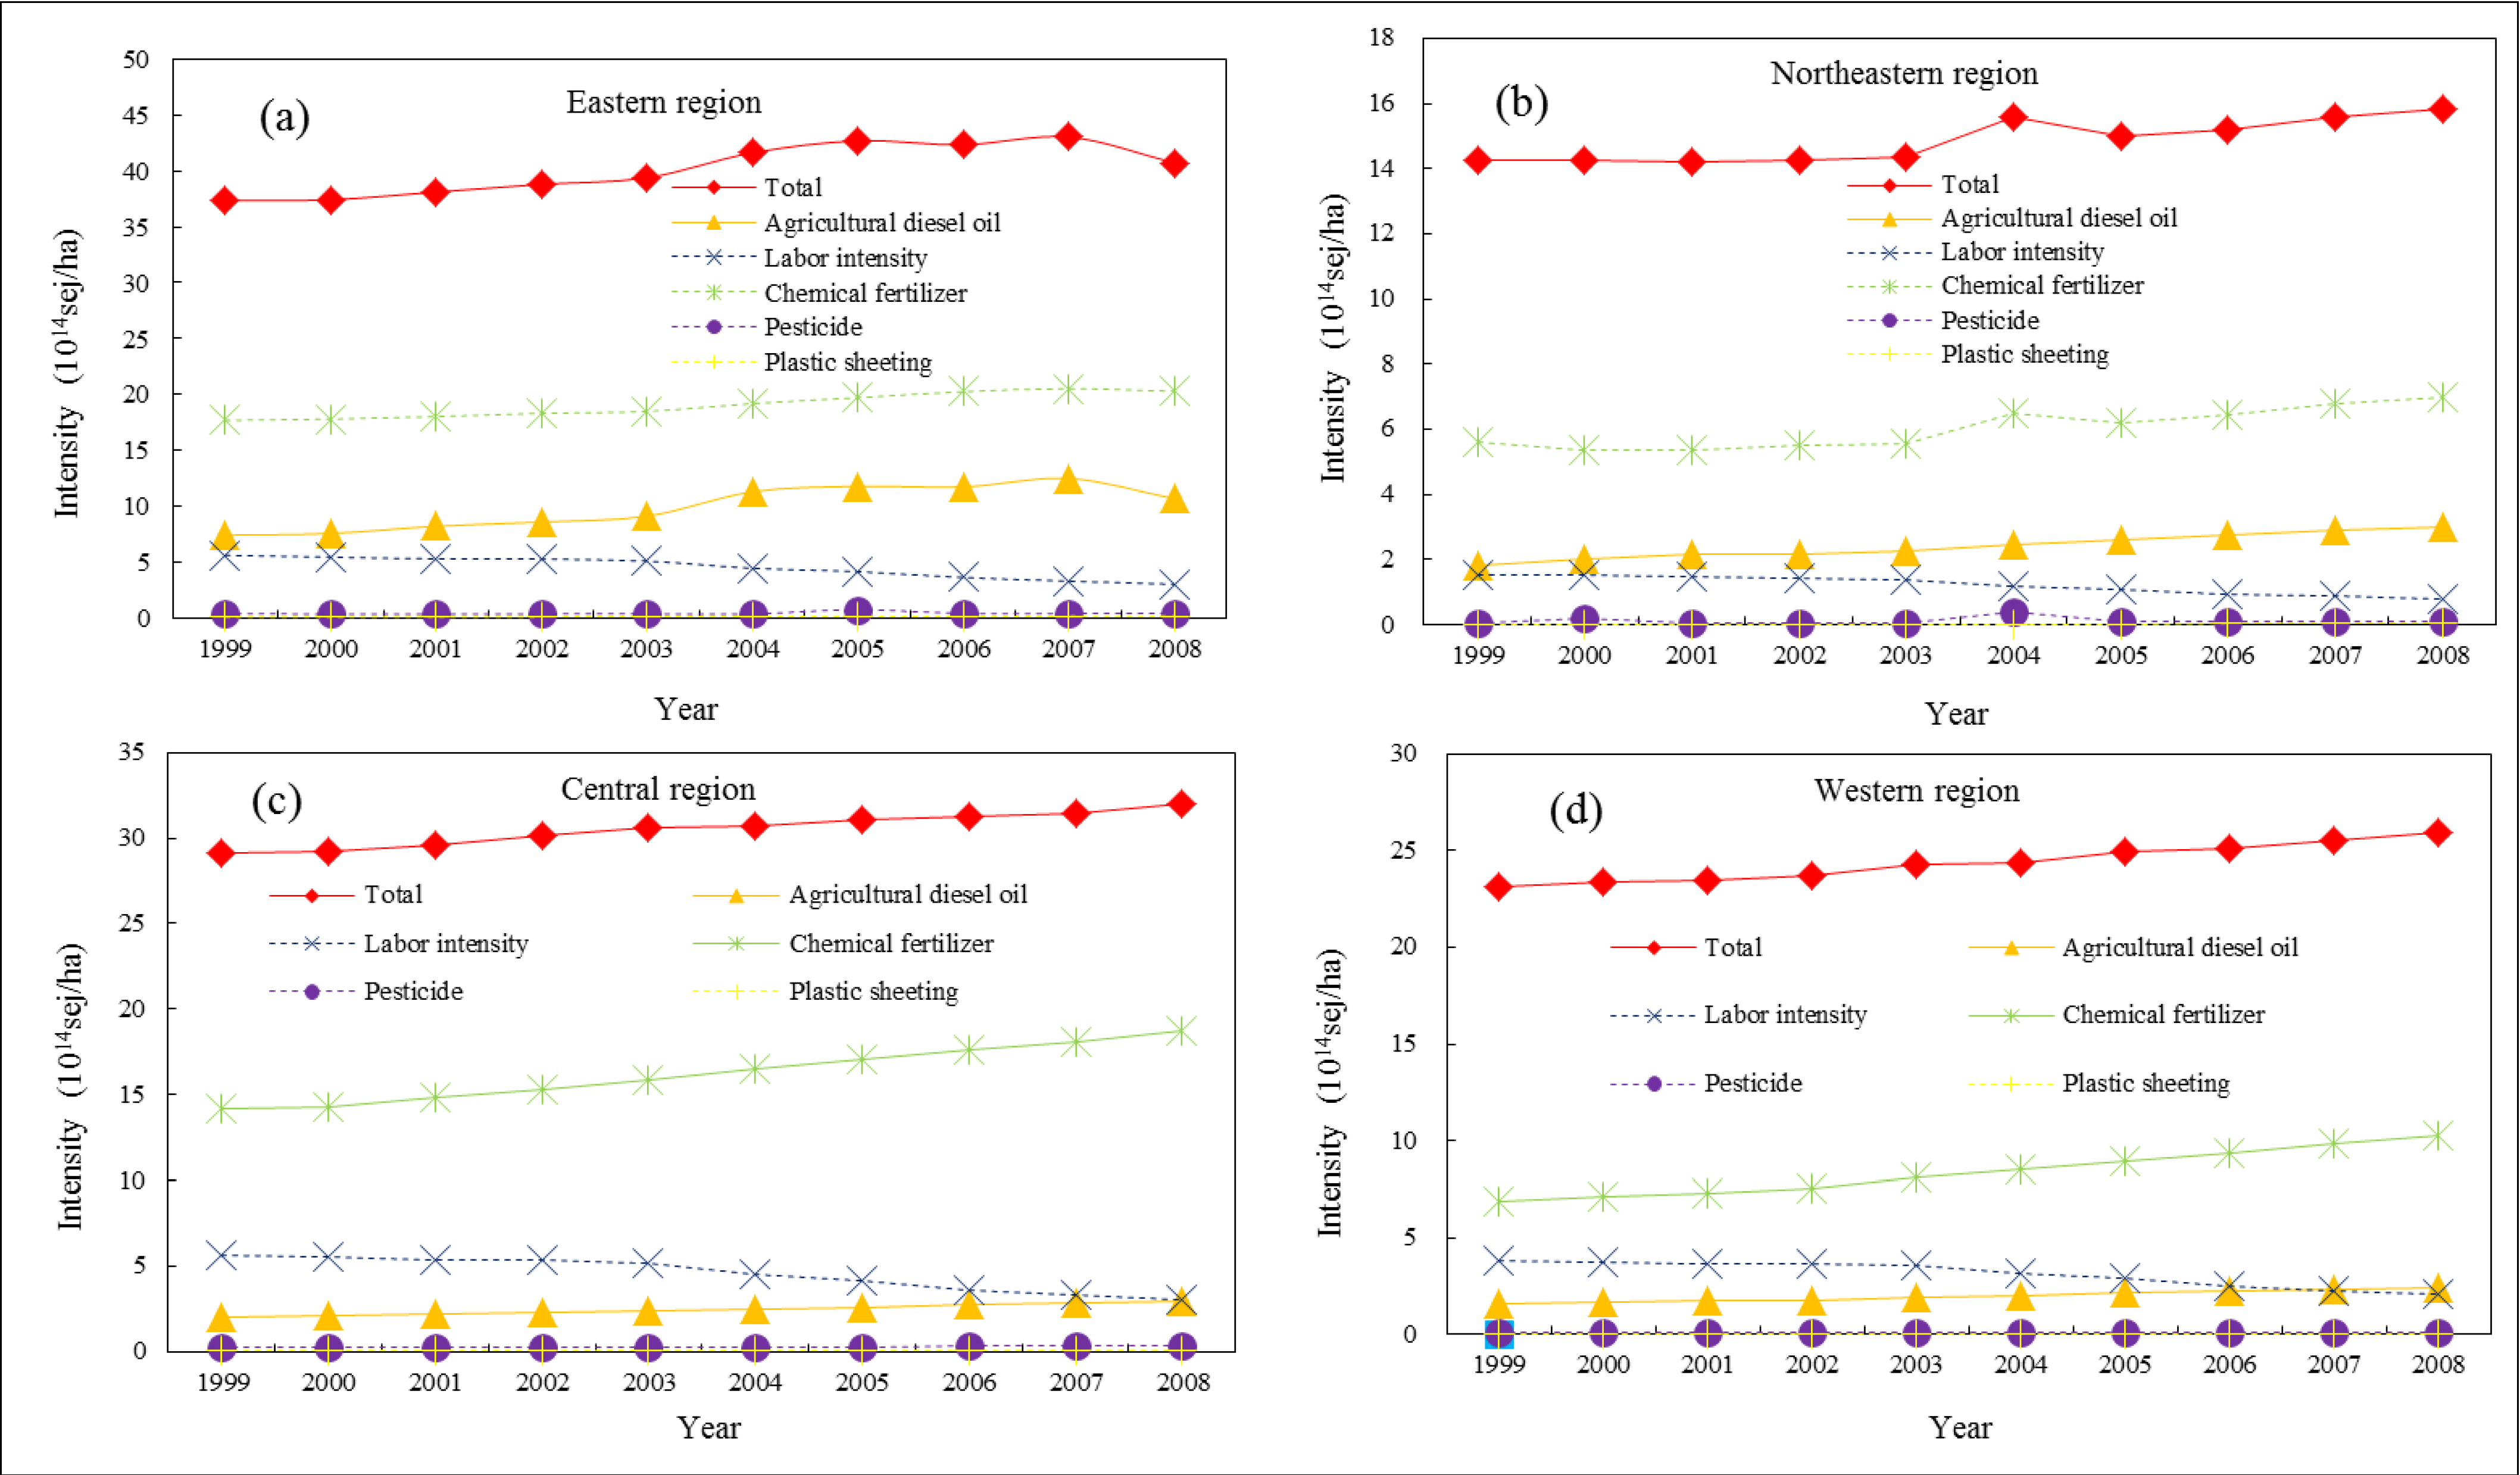
3.2. Change in Emergy Intensity of Arable Land-Use at the Regional Level

Figure 2 depicts the changes in land-use intensity and its structural features in the four regions of China from 1999 to 2008. In contrast to the northeast and western regions, land-use intensity in the eastern and central regions exceeded the national average from 1999 to 2008.
Figure 2 shows that the degree of arable land-use intensity at the regional level could be arranged in decreasing order as follows: the eastern region, the central region, the western region and the northeastern region. The difference in arable land-use intensity between the eastern and northeastern regions and the central and western regions is significant (Figure 2). In the past decade, the gaps in arable land-use intensity between the eastern and northeastern regions, the eastern and central regions, and the eastern and western regions increased by 1.69%, 10.56% and 9.69%, respectively.
The emergies of the five input items per unit area of arable land in the eastern region (including agricultural diesel, fertilizers, pesticides and plastic sheeting) were higher than the national level. The corresponding characteristics of the western region were diametrically opposite. The investment in diesel in the central region was lower than that of the national level, while for the investment in plastic sheeting flats, with the national average. The emergy of fertilizer inputs per unit of arable land were the largest in the eastern region; they increased from 17.67 × 10¹⁴ sej/ha in 1999 to 20.28 × 10¹⁴ sej/ha in 2008, an increase of 14.77%. The rapid increase in the emergy intensity of arable land-use in the northeast region can be attributed to the rapid growth in chemical manure from 1999–2008.
Figure 2. Changes in emergy intensity of arable land-use and its internal structures in China from 1999 to 2008.
Sustainability 06 03504 g002
Although fertilizers form the largest component of agricultural inputs across all four regions, the amounts and percentage changes vary for each region. In terms of fertilizer inputs, the eastern region recorded the largest amount and the slowest growth, while the western region showed small input amounts and the largest increase, with the middle and northeastern regions falling somewhere in between. The trend of continued high dependence on fertilizer inputs was contained to some degree in the eastern region, but it could still be observed in the central and western regions.
The past 10 years have witnessed inevitable large-scale rural labor force migration, which plays a major role in China’s social and economic development. The northeast region saw the largest reduction in labor (49.03%), followed by the eastern (46.32%) and central regions (46.64%). The labor decline in the western region was relatively small, but it reached 45.97%. In terms of labor proportion, the proportion of emergy of labor in the western region decreased the most from 1999 to 2008 with a reduction of 17.47%. In 2008, the labor force was no longer one of the largest input factors in the agriculture of the eastern, northeastern and western regions.

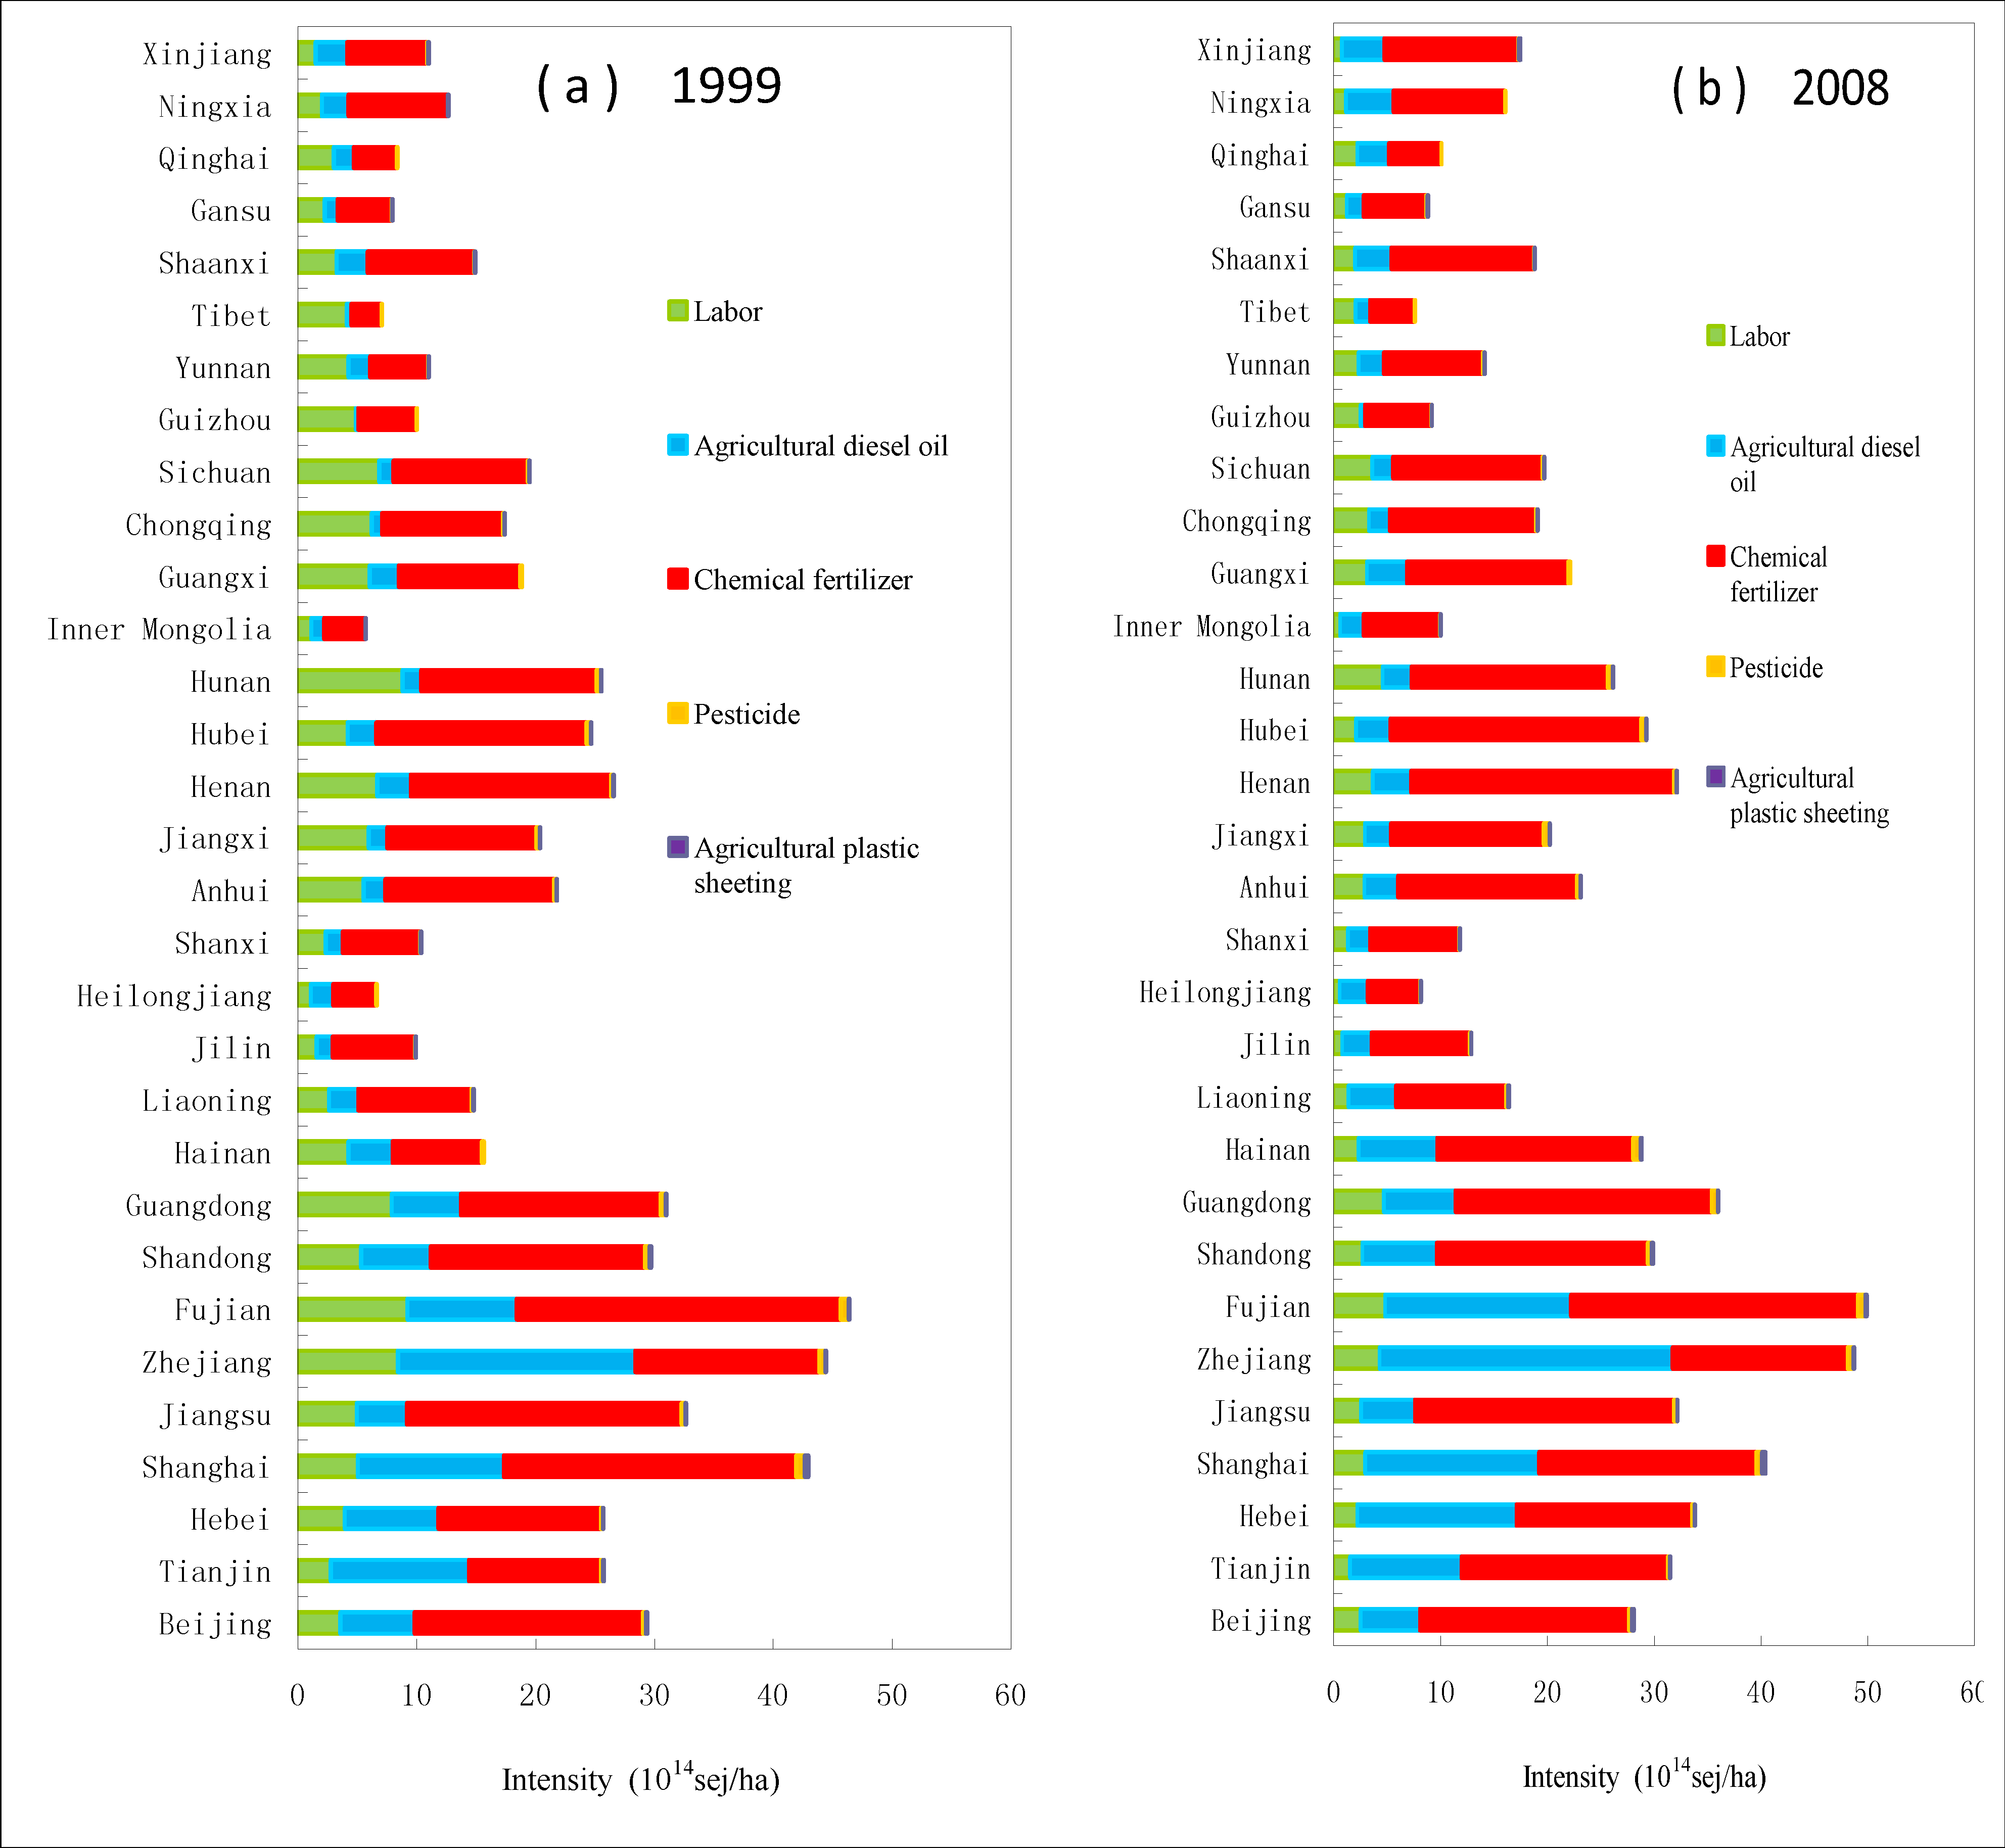
3.3. Change in Arable Land-Use Intensity at the Provincial Level

Figure 3 shows the structural features of the emergy intensity of arable land use at the provincial level in 1999 and 2008. With the exception of the small decrease in Shanghai, the use intensities of arable land for the remaining 30 provinces of China increase. Figure 3 shows that provinces with a low level of land-use intensity were mainly concentrated in the western and northeastern regions.
Figure 3. Internal structures of the emergy intensity of arable land-use at the provincial level in China in 1999 and 2008.
Sustainability 06 03504 g003
The land-use intensities of the provinces of the western and northeastern regions were low, while the growth rates of the land-use intensity increased (see Figure 4). Notably, the land-use intensity in Inner Mongolia recorded the largest increase (95%) of all provinces.
Fertilizers formed the largest component of agricultural inputs, with the proportion exceeding 50% in most of the provinces. There were enormous gaps in fertilizer input per unit area among different provinces. For instance, the gaps in the emergy of fertilizer input per unit area between the Fujian and Tibet provinces in 1999 and 2008 were 24.72 × 10¹⁴ sej/ha and 22.63 × 10¹⁴ sej/ha, respectively. The amount of fertilizer input per unit area in Inner Mongolia and Fujian provinces more than doubled in the past 10 years. The amounts of chemical fertilizer per unit area in Fujian province and Shanghai recorded negative growth rates from 1999 to 2008. The increase in the amounts of fertilizer inputs showed an obvious spatial gradient, with the increases declining gradually from west to east.
Labor input per unit area decreased to varying degrees, ranging from 27 to 51%. The input amounts of pesticides and plastic sheeting were much lower than those of chemical fertilizer, diesel and labor. The provinces with higher pesticide inputs were mainly concentrated in the eastern and central regions.
Figure 4. Degrees of change rates in the emergy intensity of arable land-use and their internal structures for each province in China from 1999 to 2008.
Sustainability 06 03504 g004

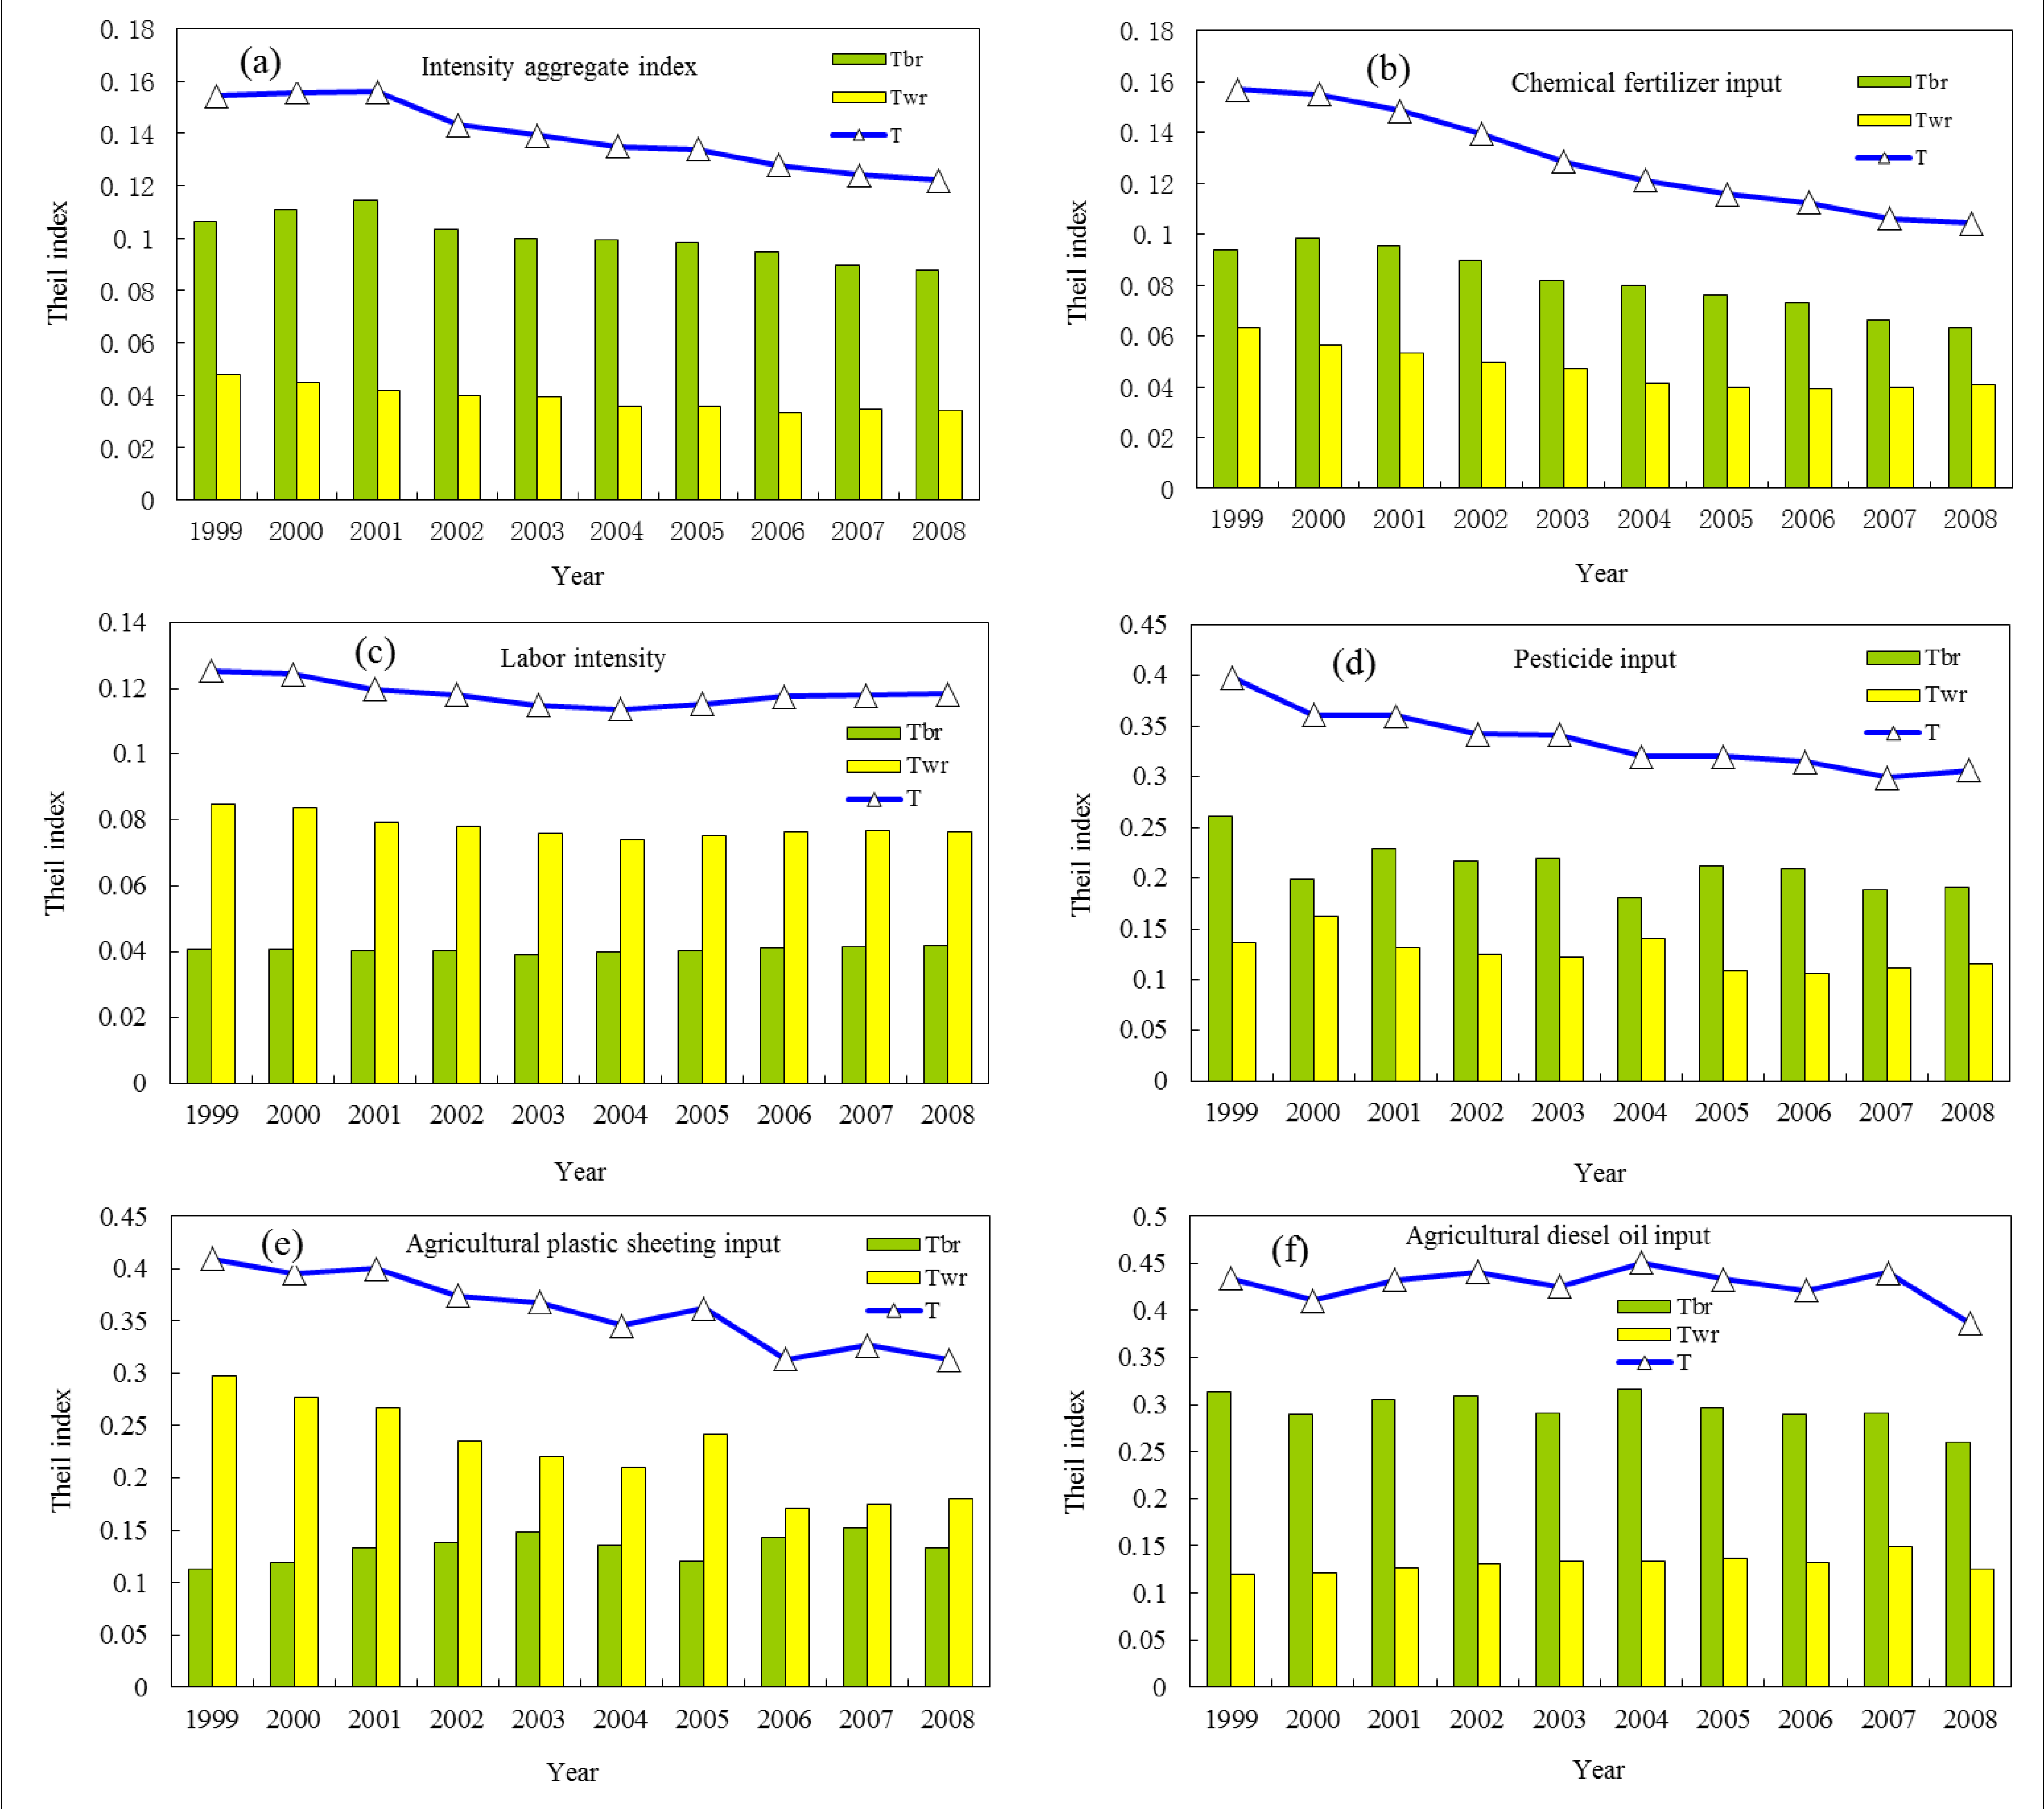
3.4. Regional Disparities in Arable Land-Use Intensity

The Theil index of arable land-use intensity and its internal structure (including inputs for labor, diesel, fertilizers, pesticides and plastic sheeting) from 1999 to 2008 are shown in Figure 5. It shows a decreasing trend in the degree of arable land-use intensity for all inputs. The disparities in arable land-use intensities arise mainly from the differences between the eastern, northeastern, central and western regions.
Figure 5. Theil indexes of arable land-use intensity and their internal structures in China from 1999 to 2008.
Sustainability 06 03504 g005
From the viewpoint of the internal structure of arable land-use intensity in China, the highest regional disparities were recorded for plastic sheeting, pesticides and diesel per unit area. Their Theil indexes ranged from 0.35 to 0.45 (Figure 5). Figure 5 also shows that the Theil index of labor input remained steady at approximately 0.12 from 1999 to 2008, which means that the disparities in labor inputs were at a minimum. The disparities in labor and plastic sheeting per unit area of arable land arose mainly from the internal differences among the four regions.

3.5. Driving Forces of Arable Land-Use Intensity

Table 3 shows the results of the econometric models for arable land-use intensity and their internal structures. The three models pass the significant F-test. The results support the variable intercept model. The results of the Hausman test show that the model supports the fixed effects model. The adjusted R-squared indicates that the three econometric regression models of arable land-use intensity and their internal components fit the given context better.
Table 3. Results of the econometric models for arable land-use intensity and its internal structure.
VariableDependent Variable
Intensity aggregate indexChemical fertilizerAgricultural diesel oilLabor intensityAgricultural plastic sheetingPesticide
c1.2768 ***
(4.8714)
−1.1316 ***
(−3.3932)
−5.8807 ***
(−12.3908)
7.2038 ***
(23.2273)
−10.8734 ***
(−8.8441)
−5.8275 ***
(−6.1582)
INC0.1541 ***
(4.4650)
0.2634 ***
(6.0001)
−0.5758 ***
(−14.0986)
0.2734 *
(1.6891)
0.3024 **
(2.4267)
IND0.0054 *
(2.5810)
0.0191 ***
(7.2676)
0.0380 ***
(10.1123)
−0.0169 ***
(−6.8804)
0.0536 ***
(5.5068)
0.0199 ***
(2.6598)
POP0.0036 *
(2.2761)
−0.0098 ***
(−5.2302)
0.0349 ***
(4.6873)
POL0.0268 *
(1.9964)
0.0702 ***
(4.1041)
0.1265 ***
(5.1994)
−0.1284 ***
(−8.0744)
0.1124 **
(2.3177)
R-squared0.98630.98220.98610.98570.91040.9521
Adjusted R-squared0.98450.98000.98430.98390.89920.9462
Prob(F-statistic)0.00000.00000.00000.00000.00000.0000
Durbin-Watson stat0.70650.67650.98680.66240.82621.9278
Notes: (1) INC represents the net income of rural households per capita; IND represents the proportion of the nonagricultural industry; POP represents the proportion of the nonagricultural population; and POL represents the agricultural policy; (2) The numbers within parentheses are the values of the t-statistic; (3) * p < 0.1; ** p < 0.05; *** p < 0.01.
There was a significantly positive relationship between the net income of rural household per capita and arable land-use intensity (Table 3). Similarly, the net income of rural household per capita played a positive role in the fertilizer inputs, pesticide inputs and agricultural plastic sheeting. This is mainly because the farmers are the main users of arable land and the net income of rural households per capita is directly related to the investment capacity in arable land. The higher the net income of rural households per capita, the more money farmers will invest in arable land. This result effectively confirms the hypothesis of economic man.
Table 3 shows a significant positive correlation between the proportion of nonagricultural industry and total investment and fertilizer inputs per unit of arable land. Increasing the proportion of secondary and tertiary industries can contribute advanced production elements, including capital, technology and equipment, to arable land use. It can also increase the demand for agricultural products and prompt farmers to increase the core agricultural inputs (such as fertilizer) to boost production.
Table 3 also shows a significant positive relationship between the proportion of the nonagricultural population and agricultural plastic sheeting per unit of arable land. Assuming that all the other factors remain constant, for every 1% increase in the proportion of nonagricultural population, agricultural plastic sheeting per unit of arable land will increase by 0.035%. China is witnessing rapid urbanization, and thus, investments in agricultural plastic sheeting per unit of arable land will continue to increase, which is conducive to improvements in agricultural infrastructure.
Moreover, Table 3 indicates that the estimated coefficient of agricultural policy is positive, which means that agricultural policies have positive impacts on total input and fertilizer input. This result confirms the hypothesis of the econometric model. Therefore, the implementation of the agricultural policy plays a highly influential role in improvements of land-use intensity in China. The cause of the small differences in the inputs of fertilizers is due to the influence of agricultural policy.
Due to the object of this study and the accessibility of data, this study only considers five input items of arable land, including renewable resources, non-renewable resources, industrial auxiliary goods, organic goods and labor. Especially in terms of import services, only labor is considered. Moreover, this paper did not analyze the emergy of arable land output. In a subsequent research project, we will improve the deficiencies of this study. The analysis of the emergy of arable land output, certain ratios and indices (including the emergy yield ratio (EYR), the environmental loading ratio (ELR) and the emergy sustainability index (ESI)) should be performed to evaluate the global performance of the agricultural production process in future studies.

4. Conclusions

The emergy intensity of arable land use in China showed a constantly increasing trend from 1999–2008. The provinces with high intensities of arable land use were mainly distributed in the eastern and central regions, and they recorded small increases in intensities. On the contrary, provinces with low intensities of arable land were mainly distributed in the western and northeastern regions, and these regions recorded larger increases in intensities.
An analysis of the internal structure of the emergy intensity of arable land use showed that fertilizers were the largest input item in the land-use process throughout the study period. While this trend, which is highly dependent on chemical fertilizer inputs, has slowed to some extent in the eastern and northeastern regions, it grew in the central and western regions during the study period.
The regional differences in the emergy intensities of arable land use from 1999 to 2008 and their internal structures exhibited a narrowing trend. The results showed large regional differences in the inputs of plastic sheeting, pesticides and diesel oil per unit of arable land. Conversely, the regional differences in the inputs of chemical fertilizers were small.
The per capita annual net income of rural household operations and the agricultural policies correlated significantly and positively with total inputs, fertilizer inputs, pesticide inputs and agricultural plastic sheeting per unit of arable land. The proportion of the nonagricultural population had a greater impact on the agricultural plastic sheeting. The results of this study effectively support the hypothesis of economic man.
Today, chemical fertilizer and agricultural diesel oil in agriculture are the two main input components in arable land use in China. Therefore, it is imperative to investigate the effects of fertilizer application on the surrounding ecological environment, especially in the main grain-producing provinces of the eastern, central and western regions. There is also an urgent need to focus on the effects of chemical fertilizer and pesticide inputs on the ecological environment. The agricultural policy, therefore, should be amended to benefit the poor agricultural production provinces, especially the 13 major grain-producing areas.

Acknowledgments

We thank two anonymous reviewers for their constructive comments. This study was supported by the National Natural Science Foundation of China (No. 41361111), the Fok Ying Tung Foundation (No.141084), the Major Research Plan of National Social Science Foundation of China (No. 12&ZD213), the Natural Science Foundation of Jiangxi Province (No. 2008GQH0067 and 20122BAB203025), the Social Science Foundation of Jiangxi Province (No. 13GL05 and No. 13YJ53) and the Technology Foundation of Jiangxi Education Department of China (No. GJJ14346 and GJJ09559).

Author Contributions

Hualin Xie and Jinlang Zou had the original idea for the study. Jinlang Zou and Hailing Jiang was responsible for data collecting. Hualin Xie, Jinlang Zou, Ning Zhang and Yongrok Choi carried out the analyses. All the authors drafted the manuscript, and approved the final one.

Conflicts of Interest

The authors declare no conflict of interest.

References

  1. Vitousek, P.M. Human domination of earth’s ecosystems. Science 1997, 277, 494–499. [Google Scholar] [CrossRef]
  2. Xie, H.L.; Kung, C.C.; Zhang, Y.T.; Li, X.B. Simulation of Regionally Ecological Land Based on a Cellular Automation Model: A Case Study of Beijing, China. Int. J. Environ. Res. Public Health 2012, 9, 2986–3001. [Google Scholar] [CrossRef]
  3. Long, H.L.; Hellig, G.K.; Li, X.B.; Zhang, M. Socio-economic development and land-use change: Analysis of rural housing land transition in the Transect of the Yangtse River, China. Land Use Policy 2007, 24, 141–153. [Google Scholar]
  4. Xie, H.; Liu, Z.; Wang, P.; Liu, G.; Lu, F. Exploring the Mechanisms of Ecological Land Change Based on the Spatial Autoregressive Model: A Case Study of the Poyang Lake Eco-Economic Zone, China. Int. J. Environ. Res. Public Health 2013, 11, 583–599. [Google Scholar] [CrossRef]
  5. Xie, H.; Wang, P.; Huang, H. Ecological Risk Assessment of Land Use Change in the Poyang Lake Eco-economic Zone, China. Int. J. Environ. Res. Public Health 2013, 10, 328–346. [Google Scholar]
  6. Li, X.B.; Zhu, H.Y.; Tan, M.H. Measurement of land use intensity. Prog. Geog. 2008, 27, 12–17. [Google Scholar]
  7. Tampakis, S.; Karanikola, P.; Koutroumanidis, T.; Tsitouridou, C. Protecting the productivity of cultivated land. The viewpoints of farmers in northern evros. J. Environ. Prot. Ecol. 2010, 11, 601–613. [Google Scholar]
  8. Tan, M.H.; Li, X.B. The changing settlements in rural areas under urban pressure in China: Patterns, driving forces and policy implications. Landscape Urban Plan. 2013, 120, 170–177. [Google Scholar] [CrossRef]
  9. Su, W.Z.; Gu, C.L.; Yang, G.S. Assessing the Impact of Land Use/Land Cover on Urban Heat Island Pattern in Nanjing City, China. J. Urban Plan. Dev. 2010, 136, 365–372. [Google Scholar] [CrossRef]
  10. Zhou, D.; An, P.; Pan, Z.; Zhang, F. Arable land use intensity change in China from 1985 to 2005: Evidence from integrated cropping systems and agro economic analysis. J. Agric. Sci. 2012, 150, 179–190. [Google Scholar] [CrossRef]
  11. Xin, L.J.; Fan, Y.Z.; Tan, M.H.; Jiang, L.G. Review of Arable Land-use Problems in Present-day China. Ambio 2009, 38, 112–115. [Google Scholar] [CrossRef]
  12. Long, H.L.; Liu, Y.S.; Wu, X.Q.; Dong, G.H. Spatio-temporal dynamic patterns of farmland and rural settlements in Su-Xi-Chang region: Implications for building a new countryside in coastal China. Land Use Policy 2009, 26, 322–333. [Google Scholar] [CrossRef]
  13. Dietrich, J.P.; Schmitz, C.; Muller, C.; Fader, M.; Lotze-Campen, H.; Popp, A. Measuring agricultural land-use intensity—A global analysis using a model-assisted approach. Ecol. Model. 2012, 232, 109–118. [Google Scholar] [CrossRef]
  14. Erb, K.H. How a socio-ecological metabolism approach can help to advance our understanding of changes in land-use intensity. Ecol. Econ. 2012, 76, 8–14. [Google Scholar] [CrossRef]
  15. Long, H.L.; Tang, G.P.; Li, X.B.; Heilig, G.K. Socio-economic driving forces of land-use change in Kunshan, the Yangtze River Delta economic area of China. J. Environ. Manag. 2007, 83, 351–364. [Google Scholar] [CrossRef]
  16. Xie, Z.L.; Liu, J.Y.; Ma, Z.W.; Duan, X.F.; Cui, Y.P. Effect of surrounding land-use change on the wetland landscape pattern of a natural protected area in Tianjin, China. Int. J. Sustain. Dev. World Ecol. 2012, 19, 16–24. [Google Scholar] [CrossRef]
  17. Chen, Y.Q.; Li, X.B.; Tian, Y.J. Structural change of agricultural land use intensity and its regional disparity in China. J. Geogr. Sci. 2009, 19, 545–556. [Google Scholar] [CrossRef]
  18. Odum, H.T. Environmental Accounting: Emergy and Environmental Decision Making; Wiley: New York, NY, USA, 1996. [Google Scholar]
  19. Pulselli, F.M.; Coscieme, L.; Bastianoni, S. Ecosystem services as a counterpart of emergy flows to ecosystems. Ecol. Model. 2011, 222, 2924–2928. [Google Scholar] [CrossRef]
  20. Li, Q.; Yan, J.M. Assessing the health of agricultural land with emergy analysis and fuzzy logic in the major grain-producing region. Catena 2012, 99, 9–17. [Google Scholar]
  21. Wang, Q.; Jin, X.B.; Zhou, Y.K. Spatial differences and its driving factors of emergy indices on cultivated land eco-economic system in Hebei Provence. Acta Ecol. Sin. 2011, 31, 247–256. [Google Scholar]
  22. Xie, H.L.; Zou, J.L. Spatial-temporal difference analysis of cultivated land use intensity based on emergy in Poyang Lake Eco-economics Zone. J. Geogr. Sci. 2012, 67, 889–902. [Google Scholar]
  23. Rydberg, T.; Haden, A.C. Emergy evaluations of Denmark and Danish agriculture: Assessing the influence of changing resource availability on the organization of agriculture and society. Agr. Ecosyst. Environ. 2006, 117, 145–158. [Google Scholar] [CrossRef]
  24. Zhu, Y. Research on the Sustainable Development of Agricultural Eco-economic System Based on Emergy; Intellectual Property Press: Beijing, China, 2012. (In Chinese) [Google Scholar]
  25. Brandt-Williams, S. Handbook of Emergy Evaluation Folio 4: Emergy of Florida Agriculture. In Proceedings of the 2rd Biennial Emergy Conference, Gainesville, FL, USA, 20–22 September 2001; Center for Environmental Policy, University of Florida: Gainesville, FL, USA, 2001. [Google Scholar]
  26. Brown, M.T.; Bardi, E.; Campbell, D.E.; Comar, V.; Huang, S.; Rydberg, T.; Tilley, D.; Ulgiati, S. (Eds.) Emergy Synthesis 3: Theory and Applications of the Emergy Methodology. In Proceedings of the 3rd Biennial Emergy Conference, Gainesville, FL, USA, 29–31 January 2004; Center for Environmental Policy, University of Florida: Gainesville, FL, USA, 2004.
  27. Lan, S.F.; Qin, P.; Lu, H.F. Emergy Analysis of Ecological-Economic System; Chemical Industry Press: Beijing, China, 2002. (In Chinese) [Google Scholar]
  28. Yang, H.S. Agricultural Ecology; Agriculture Press: Beijing, China, 1992. (In Chinese) [Google Scholar]
  29. Theil, H. Economics and Information Theory; Rand McNally and Company: Chicago, IL, USA, 1967. [Google Scholar]

