Article

Trends and Spatial Distribution Characteristics of Sustainability in Eastern Anhui Province, China

1
Nanjing Institute of Geography and Limnology, Chinese Academy of Sciences, Nanjing 210008, China
2
State Key Laboratory of Lake Science and Environment, Nanjing Institute of Geography and Limnology, Chinese Academy of Sciences, Nanjing 210008, China
3
School of Geographic and Oceanographic Sciences, Nanjing University, Nanjing 210093, China
*
Author to whom correspondence should be addressed.
Sustainability 2014, 6(12), 8398-8414; https://doi.org/10.3390/su6128398
Submission received: 14 May 2014 / Revised: 11 October 2014 / Accepted: 13 November 2014 / Published: 25 November 2014
(This article belongs to the Section Sustainable Urban and Rural Development)

Abstract

:
This study analyzes and evaluates the status and long-term trend of regional economic sustainability in eastern Anhui Province, China. Based on the triangle model and the definition of economic sustainable development, this study evaluates the interrelationship among regional economic development, resource-energy consumption, environmental pollution, and ecological performance. The sustainable and comprehensive utilization situation in the study region from 1975–2012 is examined. The results show that in 2012, the comprehensive development in the study region had a general status in terms of sustainability. The sustainable development trend of the seven administrative subunits inside the region had a weak and general status in terms of sustainability, while the status of sustainability in the southeastern part of the region was better than that in the northwest. During the period from 1975–1998, the study region’s comprehensive development presented a trend of general sustainability. In the period from 1998–2012, the region experienced a trend of very strong sustainability in its development. These statuses and trends have a certain relationship with the study region’s strong economic development and environmental protection over the past 37 years. The triangle method, as an intuitive platform for illustrating sustainability status and trends in economic development, seems to hold promise as an analytical management tool given its simplicity, ease of use, and flexibility.

1. Introduction

The term sustainable development was introduced in the 1980s as a new development concept and mode based upon comprehensive summaries of the development process and on a re-examination of the social economic behavior. It was declared publicly that this new development concept and guidelines would be endlessly pursued [1,2,3]. The aim of sustainable development is to meet the demands of contemporary people without endangering future generations [4,5]. Achieving this goal will require that economic and ecological systems of human society operate within limits that the earth’s ecological system can tolerate [6,7]. It also requires that social development yields a relatively high economic income and a good ecological performance [8], which refer to comparatively low resource-energy consumption and environmental pollution [9,10,11]. The dynamic variation of the complicated social, economic and ecological system imposes difficulties in the study of sustainable development [12,13,14]. To realize sustainable development, we must conduct dynamic monitoring, analysis and regulation through systematic quantitative analysis and quantitative evaluation [15,16]. China and other countries have conducted a large amount of research on sustainable development [17,18,19,20,21], establishing evaluation models and index systems [22,23], as well as conducting empirical analyses [24,25]. The established study methods are as follows:
(1)
Method of target [26]. First, the target for sustainable development must be set, and then several sub-objectives should be established.
(2)
Method of intersection [27,28]. Through the intersection of two-D, three-D and multi-D, a series of indexes is generated and is then used to form an index system. This method is usually used to evaluate the coordination of several different aspects [29].
(3)
Method of analysis [30]. The evaluated objectives and targets are divided into several different parts and sides, and then gradually subdivide the parts and sides (form subsystems at all levels) until each can be described by a specific statistical index. This method subdivides the study targets into different aspects so as to determine their sustainable development with a relatively comprehensive consideration [31].
The aforementioned methods, which are usually utilized comprehensively [32], will be used to conduct determination and crossing analyses on study targets [33]. These achievements and methods provide the reference and practical application value for this article.
The triangle model, as a visual platform, is applied to illustrate the status and trend of the sustainable and comprehensive development, which accompanies the implementation of various kinds of policies and measures [34]. Thanks to its visual features, it is easy for researchers to study and apply this model at different levels. The application of such models will make basic analyses flexible; therefore, it will be easy for decision makers to manage and understand it. In addition, computing the status and trend is simple. The triangle model is adopted in this study to conduct a quantitative evaluation on the trend of regional comprehensive development, to systematically study the status of regional sustainable development, and to verify the sustainability of regional development. This study has a practical value for the settlement of problems in current regional economic development and in the methodological significance of regional economic sustainability and comprehensive utilization.

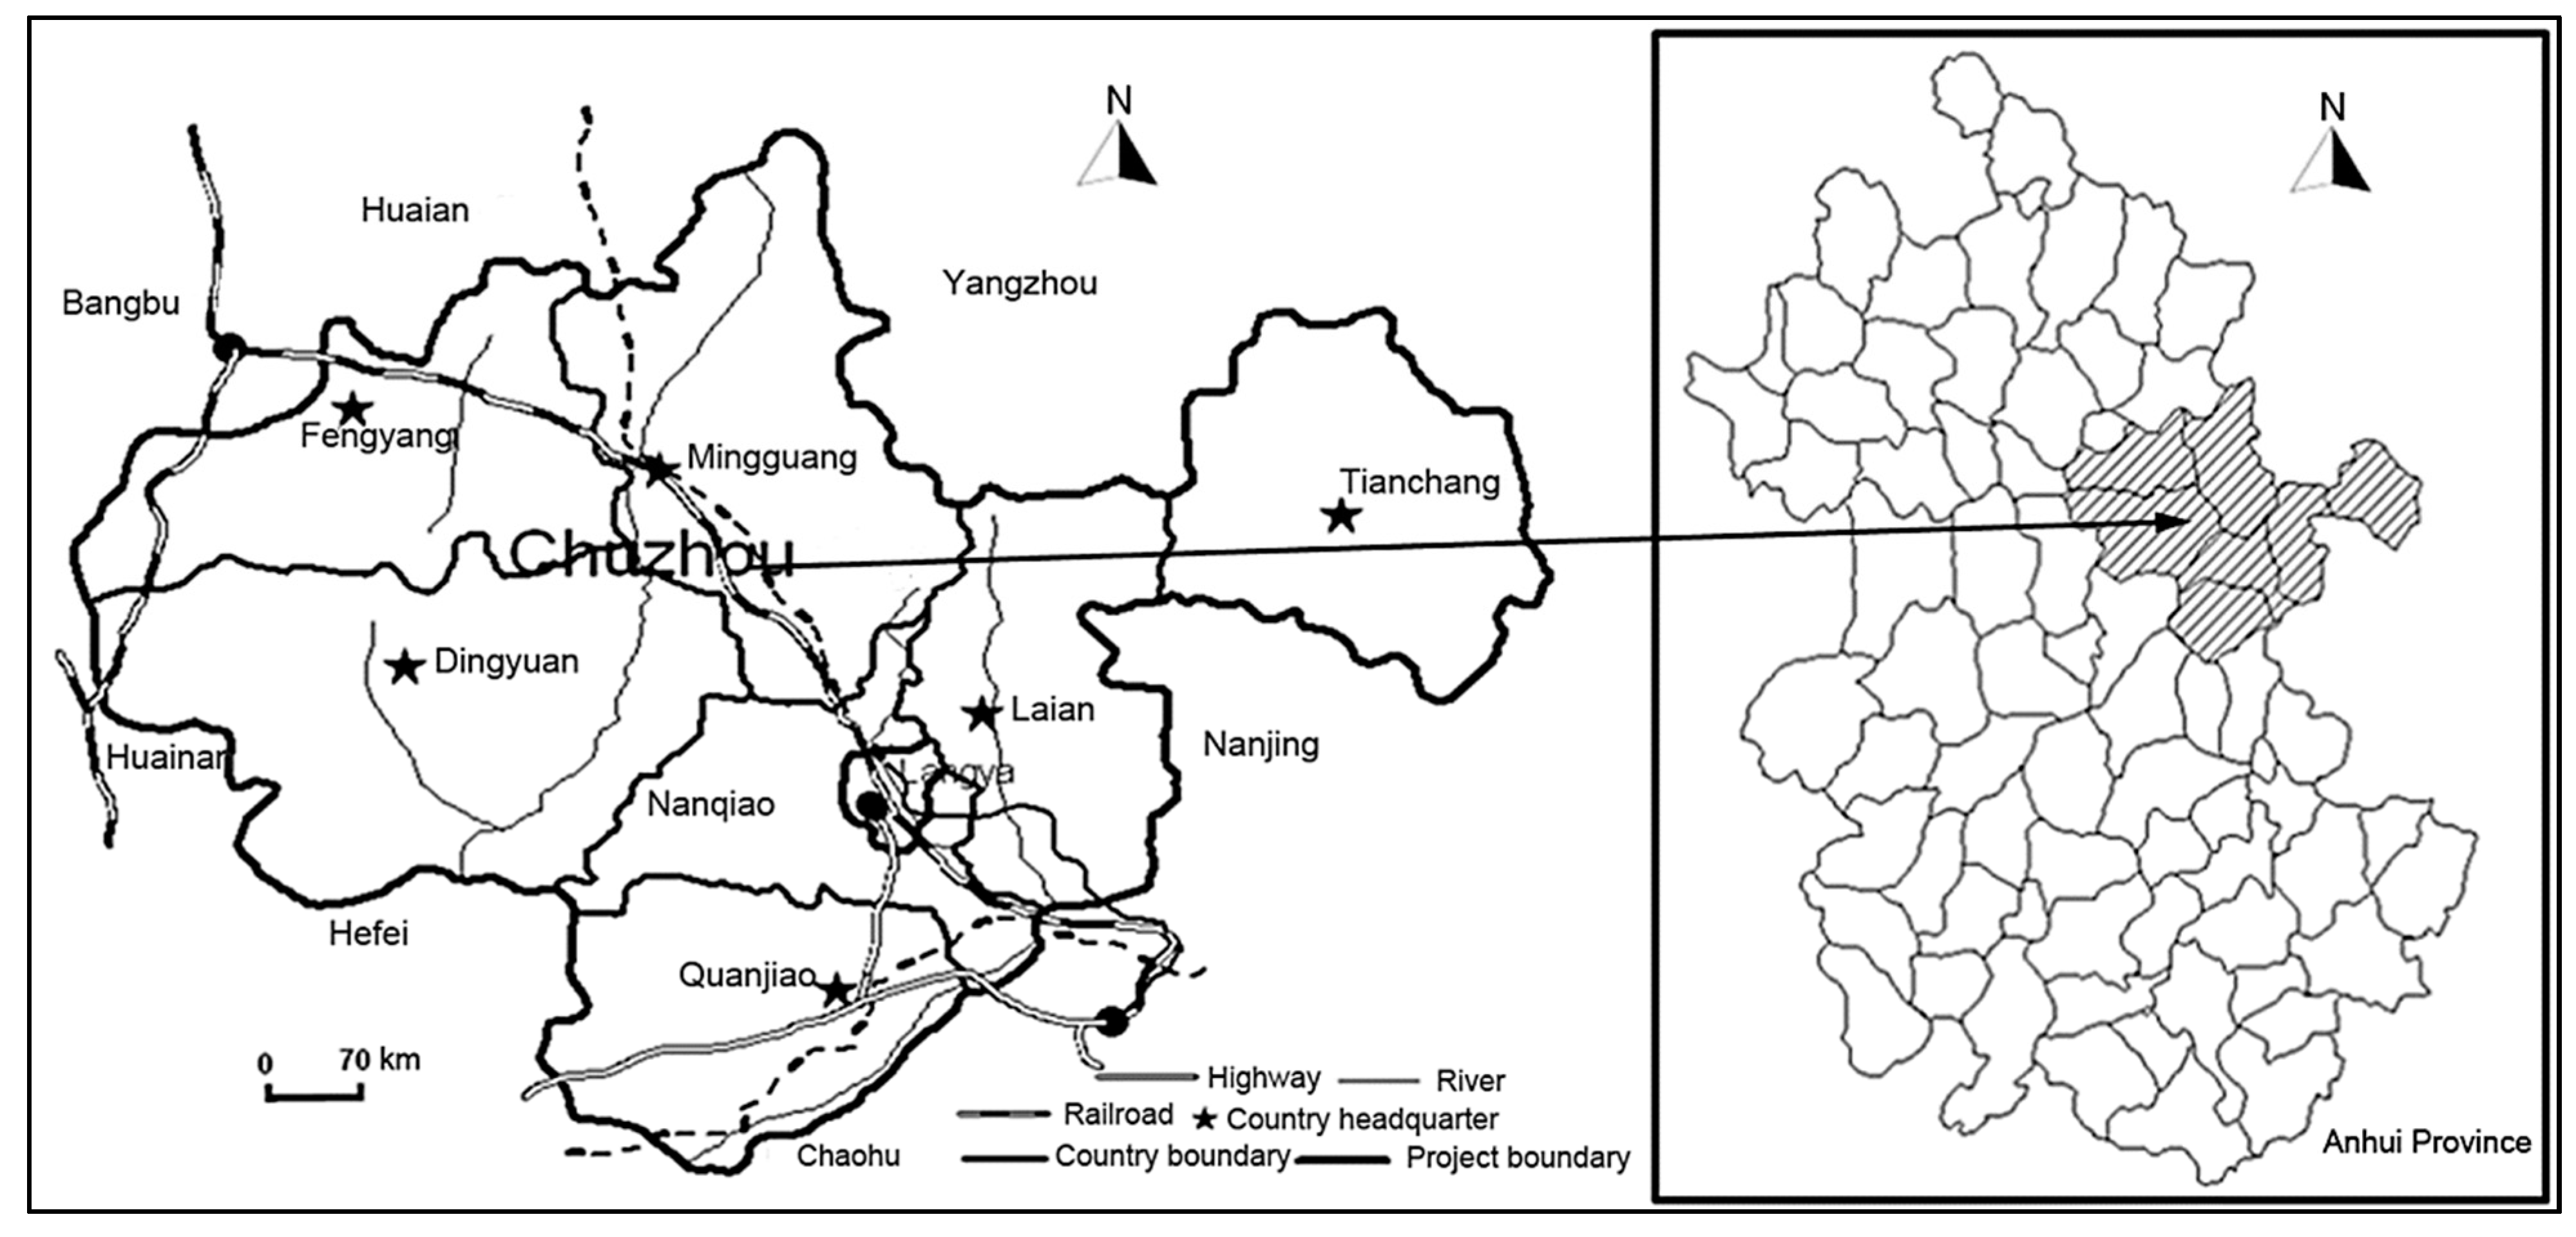
2. Profile of the Study Region

Chuzhou City is situated in the eastern part of Anhui Province (Figure 1), between the Chinese traditional eastern coastal economic developed region and the western economic backward region. In recent years, the economy in this region experienced continuous and rapid development. Therefore, the study on the sustainable utilization illustrates certain typical features. Since late 1970s, Chuzhou’s economy has seen significant growth. The GDP in the last year (2012) of study is 176.04 times that observed in the initial year (1975) of study (Figure 2). The acceleration of the city’s per capita GDP and economic development also experienced a steady upward trend. This rapid economic development, however, has come with an equally impressive increase in many environmental problems related to pollution and resource loss [35,36]. As such, it is critically important to know whether Chuzhou’s economic development over the past 37 years has been on a sustainable path, or whether it is moving toward or away from sustainability. This article systematically studies the sustainable utilization status, development trend and spatial distribution characteristics of Chuzhou’s economy in the period from 1975–2012. If the regional economy experienced sustainable development, what can we learn from the experience of economic development and ecological performance to insure development remains on a sustainable path? If it did not, what policies are available and which policies should be chosen to guide its development toward a more sustainable future? In order to answer these questions, we need to evaluate the current situation and examine the long-term implications of the present economic development path in ways relevant to the issue of sustainability. The triangle model will be used to perform such tasks. This article will provide scientific reference to the study region’s future sustainable development and will provide references and help to the sustainable and comprehensive development of other regions.
Figure 1. Maps of the study area.
Sustainability 06 08398 g001
Figure 2. Per capita GDP and economy accelerates in Chuzhou City from 1975–2012.
Sustainability 06 08398 g002

3. Study Methods and Source of Data

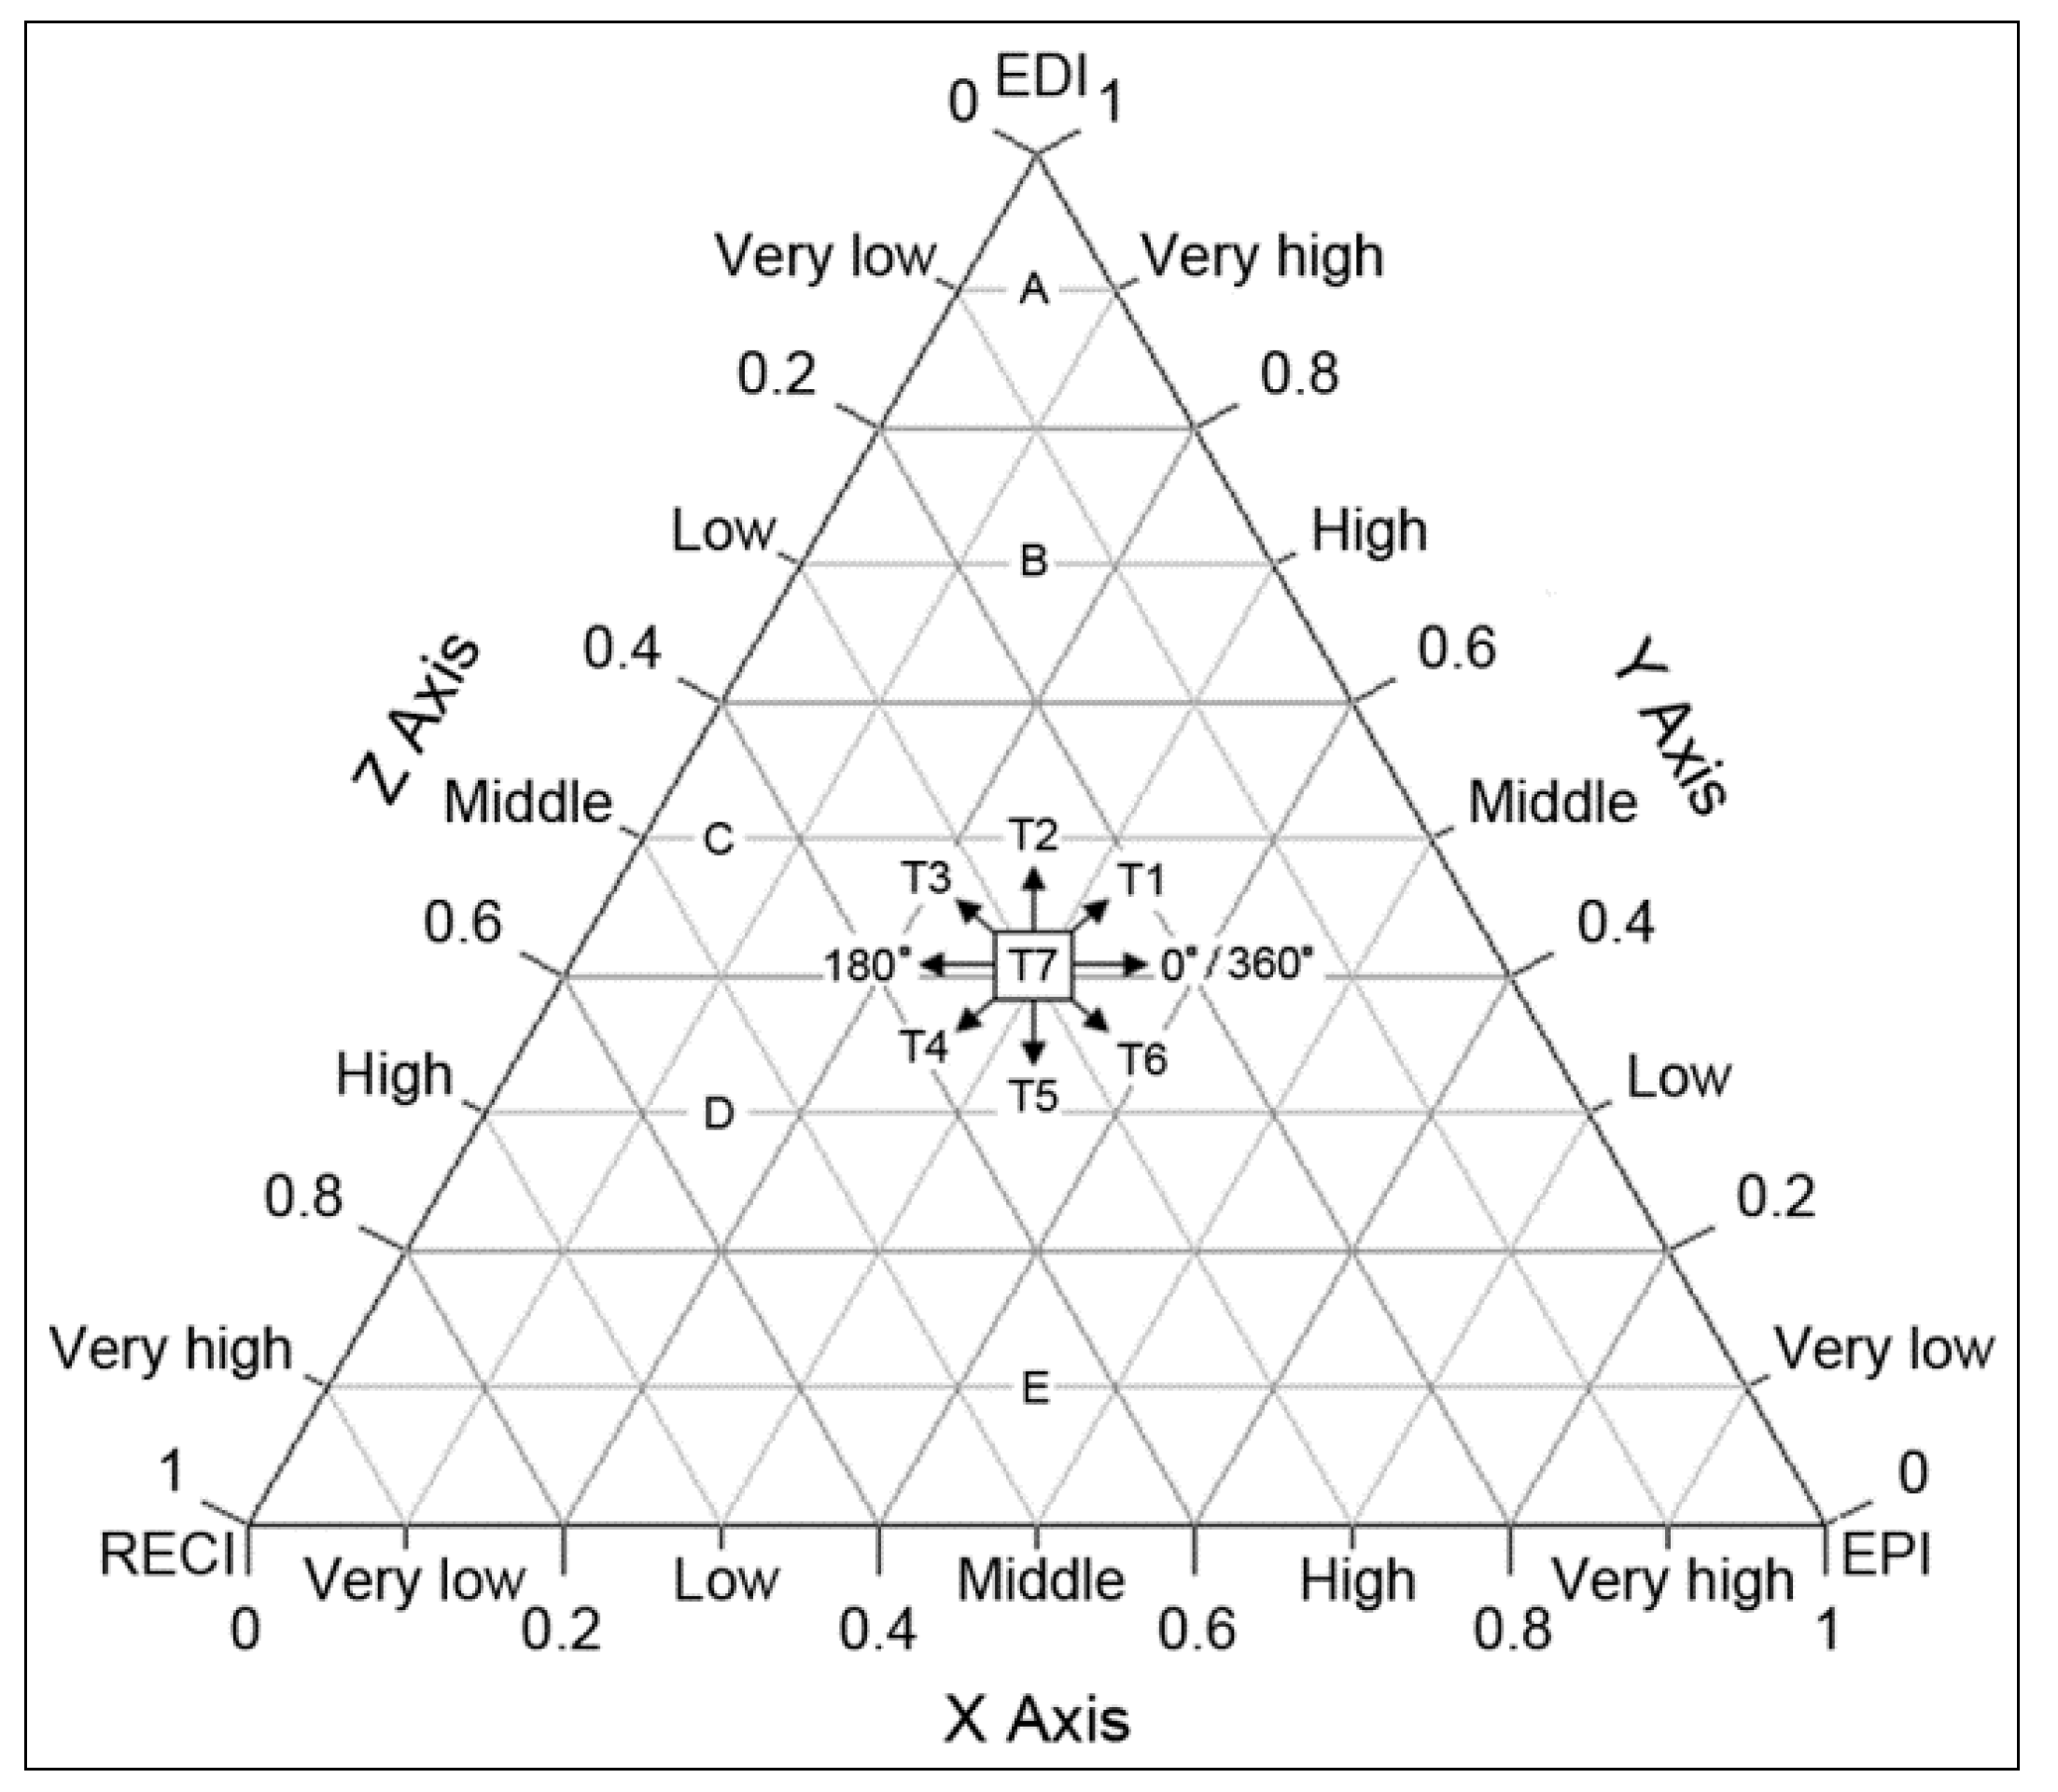
3.1. Introduction to Triangle Model

To reflect on the interrelationship among economic development, resource-energy consumption and environmental pollution, the triangle model method was applied in a quantitative evaluation of the status and trend of the sustainability of the regional economic development. According to the definition of the ecological performance of sustainable economic development, we applied the following three aspects to evaluate the regional economic development’s sustainable status and trends: the economic development index (EDI), which adopts a single index in its measurements, such as the GDP and the per capita GDP; the resource-energy consumption index (RECI), which adopts a single index in its measurements (e.g., energy consumption of CNY 10,000 industrial output value, water consumption of CNY 10,000 industrial output value, surface water resources and per capita land occupation); and the environmental pollution index (EPI), which adopts single index in the measurements (e.g., the total volume of industrial waste gas, the total volume of industrial waste water, the volume of industrial solid waste produced and the average value of the main road noise). The advantage of these three indexes lies in their simplicity. The triangle model was applied to conduct visual descriptions on the interrelationship among economic development, resource-energy consumption and environmental pollution, and the plane figure was used to reflect the development characteristics and the trend of sustainable development spaces. The “Grapher for Windows” software was used to compose and draw a triangle figure, and then “Microsoft Word” was used for revision. The final triangle figure is described in Figure 3. In the figure, A, B, C, D and E represent the relative sustainability status (Table 1), while T1, T2, T3, T4, T5, T6 and T7 represent the relative sustainability trends (Table 2).
The triangle in Figure 3 is an equilateral triangle. EDI is at the highest apex, RECI is at the left hand lower apex and EPI is at the right hand lower apex. Each axis, ranging from 0 to 1 in an anticlockwise direction, is divided into five categories: very low: 0~0.2; low: 0.20~0.40; middle: 0.40~0.60; high: 0.60~0.80; and very high: 0.80~1. A triangle was applied to illustrate the integration of the relative proportions of EDI, RECI and EPI. In addition, the triangle is further subdivided into five parts: A, B, C, D and E, expressing five different sustainability status each representing a slightly different ecological performance level (Figure 3 and Table 1).Within any one triangle, there are seven possible trends in movement according to the relative percentage changes in the three aggregate indexes, representing seven different sustainability trends (Figure 3 and Table 2). Depending on the relative position of data points associated with alternative data sets, we can evaluate the corresponding sustainability status and trends.
Table 1. Relative sustainability status of economic development based on ecological performance a.
StateIndex value scopes aRelative index value bEcological performanceRelative sustainability
EDIRECIEPIEDIRECIEPI
A0.8~1.00.0~0.20.0~0.2Very highVery lowVery low~lowVery goodVery strong sustainability
B0.6~0.80.0~0.40.0~0.4HighVery low~lowVery low~middleGoodStrong sustainability
C0.4~0.60.0~0.60.0~0.6MiddleVery low~middleVery low~highFairGeneral sustainability
D0.2~0.40.0~0.80.0~0.8LowMiddle~highVery low/Very highBadWeak unsustainability
E0.0~0.20.0~1.00.0~1.0Very lowVery low/Very highVery low~lowVery badUnsustainability
a From the references of [8], revised according to the local situation of Chuzhou City; and b EDI: economic development index; RECI: resource-energy consumption index; and EPI: environmental pollution index.
Table 2. Relative sustainability trends of economic development based on ecological performance.
TrendMoving directionRelative percentage change of index aEcological performanceRelative sustainability b
EDIRECIEPI
T10~60°FairGeneral sustainability
T260~120°Very goodVery strong sustainability
T3120~180°FairGeneral sustainability
T4180~240°BadWeak sustainability
T5240~300°Very badUnsustainability
T6300~360°BadWeak sustainability
T7 cNo movingBadWeak sustainability
BadWeak sustainability
Original performanceOriginal state
a EDI: economic development index; RECI: resource and energy consumption index; EPI: environmental pollution index; “↑”: increasing; “↓”: decreasing; and “–”: no change; b If economic growth was observed, resource and energy consumption as well as environmental pollution were increased or decreased simultaneously at the same rate and the relative percentage for EDI, RECI, and EPI was left unchanged, ecological performances were bad, indicating weak sustainability; and c If economic growth, resource-energy consumption, and environmental pollution did not change for the same period of time, the ecological performance and sustainability status were maintained as previously.

3.2. Triangle Model Evaluation

When applying the triangle model to evaluate the sustainability of economic development, we took the following six necessary steps: (1) Select the single index needed to calculate EDI, RECI and EPI; (2) Collect and standardize the data; (3) Set the weight coefficients for the selected single index; (4) Calculate three comprehensive indexes, EDI, RECI and EPI, respectively; (5) Compose a triangle; and (6) Evaluate the status and trend of sustainability.
Figure 3. The relative sustainability status and trends of economic development based on environmental performances. EPI (X Axis): environmental pollution index; EDI (Y Axis): economic development index; and RECI (Z Axis): resource and energy consumption index.
Sustainability 06 08398 g003

3.3. Principles for Selecting a Single Index

The following principles for selecting single index should be taken into consideration according to the different emphases of the data input into the triangle model:
(1)
Availability principle. The evaluated target in the triangle model is the development status of sustainability, and the development trend of sustainability will finally be decided. The evaluation index values in different time periods, which will be obtained through the existing statistics, must be guaranteed;
(2)
Pertinence principle. The selected indexes should be clearly defined and should have a relatively high relevance with specific studied targets. In addition, we should guarantee that the content of index measurements is important and meaningful for the evaluated objectives and targets;
(3)
Representative principle. The triangle model applies the interrelationship among EDI, RECI and EPI to illustrate the status and trend of sustainability. The index system should cover and represent three aspects; namely, economic development, resource-energy consumption and environmental pollution;
(4)
Comparative principle. The testability, standardization and consistency should be taken into account when selecting the indexes. We should try to apply the quantitative indexes [37], which can be obtained easily, are identically statistically and are comparable in terms of the temporal and spatial criterion;
(5)
Dynamic principle. When selecting the indexes, we should try to use relatively long-term datasets and statistics, so as to conduct studies comparing the data and statistics over different periods and to reflect the dynamic nature of sustainable development [38].

3.4. Collect and Standardize Data

All the data to be applied in the indexes are obtained from the study region’s statistical yearbook and the annual report on environment in the corresponding year. In addition, the economic development, resource-energy consumption and environmental pollution indexes are converted into a two-D data matrix as described below.
E D y i = ( d y i ) = [ d 11 d 12  ... d 1n d 21 d 22 ... d 2n ...    ...    ...    ... d s 1    d s2  ... d sn ]
R E C y j = ( r y j ) = [ r 11 r 12  ... r 1m r 21 r 22 ... r 2m ...    ...    ...    ... r s 1    r s2  ... r sm ]
E P y h = ( t y h ) = [ t 11     t 12  ...    t 1k t 21     t 22  ...    t 2k ...    ...    ...    ... t s 1       t s2   ...     t sk ]
E D y i , R E C y j and E P y h represent the original data matrix of economic development, the resource-energy consumption and the environmental pollution index, respectively. The variable “y” is the yth studied targets, which represents different administrative subunits used to evaluate the status of sustainable development and represents different years used to evaluate the trend of sustainability during the period from 1975–2012; “i” is the ith selected economic development index; “j” is the jth selected resource-energy consumption index; “h” is the hth selected environmental pollution index; d y i is a specific original data for the yth studied object and the ith selected economic development index; r y j is a specific original data for the yth studied object and the jth selected resource-energy consumption index; and t y h is a specific original data for the yth studied object and the hth selected environmental pollution index.
To make the data comparable [39], we conducted standardized treatments on E D y i , R E C y j and E P y h according to Formulas (4)–(6).
E D y i = ( d y i ) = d y i M a x ( d y i ) y = 1 s    ( y = 1 , 2 , ... , s ; i = 1 , 2 , ... , n )
R E C y j = ( r y j ) = r y j M a x ( r y j ) y = 1 s    ( y = 1 , 2 , ... , s ; j = 1 , 2 , ... , m )
E P y h = ( t y h ) = t y h M a x ( t y h ) y = 1 s    ( y = 1 , 2 , ... , s ; h = 1 , 2 , ... , k )
E D y i , R E C y j and E P y h are the standardized data matrices of economic development, resource-energy consumption and the environmental pollution index, respectively. M a x ( d y i ) y = 1 s is the maximum value of the ith selected economic development index from the E D y i matrix; M a x ( r y j ) y = 1 s is the maximum value of the jth selected resource-energy consumption index from the R E C y j and M a x ( t y h ) y = 1 s is the maximum value of the hth selected environmental pollution index from the E P y h . The variables “y”, “i”, “j”, “h”, d y i , r y j and t y h have the same meaning as matrices (1)–(3).
According to the original data in matrices (1)–(3), E D y i , R E C y j and E P y h can be acquired through Formulas (4)–(6) as follows:
E D y i = ( d y i ) = [ d 11 d 12 ... d 1 n d 21 d 22 ... d 2 n ...    ...    ...    ... d s 1 d s 2 ... d s n ]
R E C y j = ( r y j ) = [ r 11 r 12 ... r 1 m r 21 r 22 ... r 2 m ...    ...    ...    ... r s 1 r s 2 ... r s m ]
E P y h = ( t y h ) = [ t 11     t 12 ... t 1 k t 21     t 22 ... t 2 k ...     ...    ...    ... t s 1     t s 2    ...    t s k ]
d y i is the specific standardized data of the yth studied target’s ith economic development index, while r y j is the specific standardized data of the yth studied target’s jth resource-energy consumption index. Similarly, t y h is the specific standardized data of the yth studied target’s hth environmental pollution index, while E D y i , R E C y j , E P y h , “y”, “i”, “j” and “h” have the same meaning as Formulas (4)–(6).

3.5. Set Weight Coefficients

The weight coefficients will exert different effects on the evaluation of sustainability. The selected index is required to be assigned to the weight coefficient [40,41]. It is possible to set the weight coefficients through many different kinds of methods, including the experimental analysis method [20], expert consultation (the Delphi method) [42], and the analytical hierarchy process [43] or through a combination of these methods. To enhance the accuracy of weight coefficients, it is better to combine two or three methods together in an application [44,45]. This article combines the “experimental analysis” method with the “Delphi” method to set the weight coefficients for the selected indexes [46].

3.6. Calculation of the Comprehensive Index of EDI, RECI and EPI

It is possible to calculate EDI, RECI and EPI through Formulas (10)–(12) as described below.
E D I y = i = 1 n ( E D y i * W i )
R E C I y = j = 1 m ( R E C y j * W j )
E P I y = h = 1 k ( E P y h * W h )
E D I y , R E C I y and E P I y refer to the yth studied target’s economic development, resource-energy consumption and environmental pollution index (namely, department, region and year), respectively. W i is the ith economic development index’s weight coefficient; the sum of the selected economic development index’s a number of n weight coefficients is 1, namely, i = 1 n W i = 1 . W j is the jth resource-energy consumption index’s weight coefficient; and the sum of the selected resource-energy consumption index’s m weight coefficients is 1, namely, j = 1 m W j = 1 . W h is the hth environmental pollution index’s weight coefficient; and the sum of the selected environmental pollution index’s k weight coefficients is 1, namely, h = 1 k W h = 1 . E D y i , R E C y j and E P y h have the same meaning in Formulas (4)–(9).

3.7. Compose Triangle Figure

Based on the calculated corresponding data, the triangle figure was composed and “MS Word” was used to make marks, add trend lines and change labels on the triangle and finally, to adopt the optimized triangle figure to evaluate the sustainability of the development trends.

4. Sustainability of the Economic Development

4.1. Status of Sustainability in Chuzhou in 2012

We applied the index of Chuzhou’s industrial and economic development and ecological characteristics in 2012 (Table 3) to illustrate the status of economic development’s sustainability in Chuzhou. We also considered the changes to the industrial and economic and ecological characteristics in the city over the last 37 years (from 1975–2012) to demonstrate the long-term trend of Chuzhou’s economic sustainable development (Table 4).
Table 3. Index of industrial economic development and ecological performance in 2012 a.
Indicator bChuzhou c,dNanqiaoLaianQuanjiaoTianchangDingyuanFengyangMingguangWeighting factor
ED1970.7457.697.1590.68211.28116.63116.6392.480.50
ED224650220351939419458332841193615287143860.50
REC10.770.411.070.940.212.712.590.350.25
REC225.321.0410.302.230.6113.544.962.970.25
REC330.063.83 4.02 3.60 4.69 5.82 2.92 5.18 0.15
REC414.6037.20 11.80 17.90 6.20 8.60 12.50 18.40 0.15
REC50.300.47 0.30 0.34 0.28 0.31 0.25 0.28 0.20
EP12041.74 67.65 63.15 111.75 102.32 72.98 1004.38 13.10 0.15
EP25088.78 417.74 898.20 747.08 485.08 542.55 842.63 350.72 0.15
EP3193.001.0052.005.0012.0013.0043.0014.000.15
EP465.9542.40 38.27 40.06 56.52 46.13 47.25 45.23 0.10
EP55.87 0.60 0.44 0.85 0.17 0.79 8.35 0.16 0.10
EP614.63 3.72 6.26 5.71 0.80 5.86 7.01 4.16 0.10
EP70.55 0.01 0.36 0.04 0.02 0.14 0.36 0.17 0.10
EP84976.77416.22895.25746.81485.08506.48811.90191.380.10
EP997.8099.6499.6799.96100.0093.3596.3554.570.05
a At the current price in 2012; b The value of the industrial output of Chuzhou City accounted for 50% of the total GDP in 2012, and more than 75% of pollution measured was produced by industry. Industrial energy consumption accounts for 85% of the total energy consumption. Therefore, industrial development sustainability represents the sustainability of economic development of Chuzhou City; c Because Langya District was the central urban area of Chuzhou City, characteristics of resources and ecology were not obvious, and thus we studied Chuzhou City instead of the Langya District; d Sources: Statistical Yearbook of Chuzhou City and Environmental Communiqué of Chuzhou City (2013); ED1: GDP (100 million CNY); ED2: Per capita GDP (CNY/person); REC1: Per 10,000 CNY GDP energy consumption (ton of SCE); REC2: Water demand Per 10,000 CNY industrial output value (t); REC3: Surface water resources (100 million cu. m); REC4: Forest-coverage rate (%); REC5: Per capita land resources (ha); EP1: Total volume of industrial waste gas emission (100 million cu. m); EP2: Total volume of waste water discharge (10,000 t); EP3: Industrial solid wastes generated (10,000 t); EP4: Average noise pollution of the main roads (db); EP5: Industrial waste gas emission per 10,000 CNY industrial output value (10,000 cu.m/ CNY); EP6: Industrial solid waste generated per 10,000 CNY industrial output value (t/CNY); EP7: Industrial solid waste generated per 10,000 CNY industrial output value (t/CNY); EP8: Industrial waste water up to discharge standards (10,000 t); and EP9: Rate of industrial waste water up to discharge standards (%).
We calculated three composite indexes, namely, the EDI, RECI and EPI, in Chuzhou’s seven administrative subunits according to the above formula and data in Table 3. We calculated the EDI through ED1 and ED2, combining the weight coefficients, calculated the RECI through the five indexes, namely, REC1, REC2, REC3, REC4 and REC5. Finally we calculated EPI by applying the nine indexes, EP1~EP9.
We calculated the three groups of indexes, namely, the EDI, RECI and EPI of the sustainability of economic development in Chuzhou, during the period from 1975–2012 in accordance with Table 4 and the above formula. We calculated the EDI according to the indexes ED1 and ED2, calculated the RECI based on the five indexes, REC1, REC2, REC3, REC4 and REC5, and calculated the EPI through the nine indexes, EP1~EP9, and the equal weight coefficients. The sources of the data used to calculate the indexes were Chuzhou’s Fifty Years and Chuzhou Statistical Yearbook (1999–2012) and the Report on Chuzhou’s Environment (1995–2012). We calculated each index’s unitage according to the data collected and finally acquired the three composite indexes, EDI, RECI and EPI, and the three groups of composite index results, EDI, RECI and EPI.
Table 4. The changes of industrial economic growth and ecological performance in Chuzhou during the different periods.
IndicatorWeighting factor a1975~1991 b1992~2012 b
Yearly averageYearly changeYearly averageYearly change
ED10.50+2.74 +12.68%+45.39 +14.66%
ED20.50+69.50 +11.18%+1151.00 +14.55%
REC10.25+0.004 +13.32%+0.03 +10.86%
REC20.25+12.77 +14.55%–5.92 –8.32%
REC30.15–0.02 –0.06%–0.59 –1.65%
REC40.15+0.12+0.67%–0.20 –1.22%
REC50.20–0.005–1.25%–0.002 –0.64%
EP10.15+2.27 +3.96%+97.46 +16.73%
EP20.15+258.63 +6.40%–123.71 –1.96%
EP30.15+0.44 +2.29%+7.75 +8.46%
EP40.10+0.27 +0.43%–0.04 –0.06%
EP50.10–0.04 –0.76%+0.06 +1.21%
EP60.10+5.61 +1.57%–18.16 –15.00%
EP70.10–0.04 –2.35%–0.07 –6.01%
EP80.10+103.19 +18.38%+185.64 +7.09%
EP90.05+1.38 +11.26%+4.05 +9.24%
a Considering that the changes of some factors were small, some indexes and the corresponding weight coefficients were adjusted; b “+” represents increase, “–” represents reduction. ED1: GDP (100 million CNY); ED2: Per capita GDP (CNY/person); REC1: Per 10,000 CNY GDP energy consumption (ton of SCE); REC2: Water demand Per 10,000 CNY industrial output value (t); REC3: Surface water resources (100 million cu.m); REC4: Forest-coverage rate (%); REC5: Per capita land resources (ha); EP1: Total volume of industrial waste gas emission (100 million cu.m); EP2: Total volume of waste water discharge (10,000 t); EP3: Industrial solid waste generated (10,000 t); EP4: Average noise pollution of the main roads (db); EP5: Industrial waste gas emission per 10,000 CNY industrial output value (10,000 cu.m/CNY); EP6: Industrial solid waste generated per 10,000 CNY industrial output value (t/CNY); EP7: Industrial solid waste generated per 10,000 CNY industrial output value (t/CNY); EP8: Industrial waste water up to discharge standards (10,000 t); and EP9: Rate of industrial waste water up to discharge standards (%).
According to specific factors in the different areas, the results are non-optimistic. We can conclude from Figure 4 that among the seven administrative subunits, the present sustainability of the relative economic development is maintained in areas C and D, representing a general level of sustainability and weak sustainability, respectively. Even within the same region, there is significant variation in the sustainability of economic relative development. The results acquired are closely related to the practical situation. In terms of environmental performance, economic development in the southeastern part of Chuzhou (Tianchang City, Laian Country and Quanjiao County) is better than that in the northwestern part of the city (Dingyuan County, Mingguang City and Fengyang County). This is due to the fact that the average and per capita economic output value in southeastern regions is comparatively high, the energy consumption in these regions is relatively low, and the discharge of industrial waste water, gas and solid waste is also relatively low. Based on our analysis, the status of sustainability is mainly related to the region’s location and position, the industrial policies and the natural resources present in this area.
Figure 4. The relative sustainability status of different industrial sectors of Chuzhou in 2012. “A” represents an area showing very strong sustainability, “B” represents a strongly sustainable area, “C” represents an area with general sustainability, “D” represents a weakly sustainable area, and “E” represents an unsustainable area. “C1” represents Chuzhou City, “C2” represents Tianchang City, “C3” represents Laian County, “C4” represents Quanjiao County, “D1” represents the Nanqiao District, “D2” represents Mingguang City, “D3” represents Fengyang County, and “D4” represents Dingyuan County. EPI (X Axis): environmental pollution index; EDI (Y Axis): economic development index; and RECI (Z Axis): resource and energy consumption index.
Sustainability 06 08398 g004

4.2. Analysis of the Trend of Sustainable Development

Based on the above formula and on Table 4, we calculated the trend of sustainability of economic development in Chuzhou during the period from 1975–2012 (Figure 5). Our calculation shows that during this period, Chuzhou’s economic development experienced a trend from weak unsustainability to weak sustainability and general level of sustainability. In recent years, Chuzhou’s economy rapidly evolved into general and strong sustainability. Three of these trends are relatively apparent (levels T1, T2 and T3). During the period from 1975–1991, Chuzhou’s economic development experienced general sustainability (T3), and its ecological reflection is at average level. During 1991–1998 period, the city’s economic development maintained a trend of general sustainability (T1), and its ecological reflection falls within an average level, while development improved in comparison to that in the previous stage. During 1998–2005 period, its economic development becomes increasingly sustainable and achieves a status of strong sustainability (T2), and its ecological reflection stays at an excellent level. Chuzhou’s economy has maintained a sustained, rapid and sound growth since the beginning of 2005. Its economic development maintains an increasingly sustainable and strong sustainability status (T2), and its ecological reflection stays at an excellent level. The results demonstrate that economic growth in 1991–2012 improved significantly in comparison to that in the 1975–1991 period. In addition, when comparing the status of development in the 1991–2012 period with that in the 1975–1991 period, the economic development index experienced a high annual average change and a high annual average rate of change. Conversely, the energy consumption and pollution index experienced a low annual change and low annual rate of change, which are basically in agreement with the results of the ecological reflection.
Figure 5. The long-term relative sustainability trends of economic development in Chuzhou from 1975–2012. “A” represents a very strongly sustainable area, “B” represents a strongly sustainable area, “C” represents an area showing general sustainability, “D” represents a weakly sustainable area, and “E” represents an unsustainable area. “T1” represents general sustainability, “T2” represents strong sustainability, and “T3” represents an general level of sustainability. EPI (X Axis): environmental pollution index; EDI (Y Axis): economic development index; and RECI (Z Axis): resource and energy consumption index.
Sustainability 06 08398 g005

5. Conclusions and Discussions

The sustainability of economic development refers to concurrent high economic returns, low resource-energy consumption and low environmental pollution in economic development [47,48,49]. To evaluate the sustainability of economic development in the long term, we composed a triangle model using the interrelationship among the three composite indexes (EDI, RECI and EPI).We then applied this triangle figure to illustrate the relative proportion portfolio of EDI, RECI and EPI. The triangle is further subdivided into five areas, which represent the status of sustainability. The seven possible scopes represent seven different trends of sustainability. According to the relative positions of data points in the triangle, we can evaluate the status and trend of sustainability. The triangle model, as an intuitive platform for illustrating sustainability status and trends in economic development, seems to have the following main advantages: (1) simplicity in its basic calculation and visual representation; (2) flexibility in the selection of individual indicators and basic analytical units, with a potential range from the very simple to the very complex depending on the focus of a study and data availability; (3) ease of understanding and use by researchers and policy-makers from many different levels whether local or global. Therefore, the triangle model could serve as a promising analytical and management tool for economic development sustainability.
The triangle model has been successfully used to evaluate the sustainability status and long-term trends of Chuzhou’s economic development. Chuzhou’s economic development in 2012 represents a relatively weak and general state of sustainability, and the status of sustainability in the southeastern part of the city was better than that in the northwest of the city. The Chuzhou’s economic development from 1975–1991 and from 1991–1998 shows a general sustainability trend, while that from 1998–2012 demonstrates a relatively strong sustainable trend. These results reflects well Chuzhou’s actual situation in the sustainability status and long-term trends of Chuzhou’s economic development in conjunction with ecological performances over the past 37 years.
During the past 37 years, especially in the years since 1991, the ecological reflection of Chuzhou’s economic development had enjoyed a great deal of improvement, thanks to the unremitting efforts made in environmental protection and as a result of the continuous integration of environmental protection and economic development. Environmental protection in Chuzhou experienced a process which can be described as follows: non protection → planned protection → showing concern to improve environment → strong protection. In particular, the promulgation and implementation of “Chuzhou’s Eco-city Construction Plan” in 2005 and Chuzhou City was named as National Garden City in 2013 will be more favorable for launching the city’s environmental protection work, promoting the sound development of the economy, reducing resource-energy consumption and improving the ecological environment. Although the city has made some progress, in terms of concerns regarding sustainable development and its current unpromising status of economic development, the city must increase its energy utilization rate and decrease its pollution discharge to further improve its relative regional sustainable development status. In the meantime, in urban and rural construction, vegetation, waters and the natural landscape shall be protected and attention paid to the construction of gardens, green land and historic sites and scenic spots in the cities in the light of the special features of the local natural environment.

Acknowledgments

This work has been supported by the State Key Program of National Natural Science of China (No. 41030745) and the National Natural Science Foundation of China (No. 41071354). The authors wish to thank the anonymous reviewers for reading the manuscript.

Author Contributions

Jian Zhang conceived and designed the study, modified the model, collected the data and wrote the paper. Guishan Yang provided academic advice throughout the process and helped to revise manuscript. Lijie Pu provided academic advice throughout the process. Buzhuo Peng provided some useful advices and modified the draft. All authors read and approved the final manuscript.

Conflicts of Interests

The authors declare no conflict of interest.

References

  1. Farrow, S. Environmental equity and sustainability: Rejecting the Kaldor-Hicks criteria. Ecol. Econ. 1998, 27, 183–188. [Google Scholar] [CrossRef]
  2. Haberl, H.; Wackernagel, M.; Wrbka, T. Land use and sustainability indicators. An introduction. Land Use Policy 2004, 21, 193–198. [Google Scholar] [CrossRef]
  3. Brundiers, K.; Wiek, A. Do we teach what we preach? An international comparison of problem- and project-based learning courses in sustainability. Sustain. Sci. 2013, 5, 1725–1746. [Google Scholar] [CrossRef]
  4. Iwaniec, D.M.; Childers, D.L.; VanLehn, K.; Wiek, A. Studying, teaching and applying sustainability visions using systems modeling. Sustain. Sci. 2014, 6, 4452–4469. [Google Scholar] [CrossRef]
  5. Sneddon, C.; Howarth, R.B.; Norgaard, R.B. Sustainable development in a post-Brundtland world. Ecol. Econ. 2006, 57, 253–268. [Google Scholar] [CrossRef]
  6. Gorman, M.E. Earth systems engineering management: Human behavior, technology and sustainability. Resour. Conserv. Recy. 2005, 44, 201–213. [Google Scholar] [CrossRef]
  7. Rasul, G.; Thapa, G.B. Sustainability analysis of ecological and conventional agricultural systems in Bangladesh. World. Dev. 2003, 31, 1721–1741. [Google Scholar] [CrossRef]
  8. Xu, F.L.; Zhao, S.S.; Dawson, R.W.; Hao, J.Y.; Zhang, Y.; Tao, S. A triangle model for evaluating the sustainability status and trends of economic development. Ecol. Model. 2006, 195, 327–337. [Google Scholar] [CrossRef]
  9. Doran, J.W.; Zeiss, M.R. Soil health and sustainability: Managing the biotic component of soil quality. Appl. Soil. Ecol. 2000, 15, 3–11. [Google Scholar] [CrossRef]
  10. Hartanto, H.; Prabhu, R.; Widayat, A.S.; Asdak, C. Factors affecting runoff and soil erosion: Plot-level soil loss monitoring for assessing sustainability of forest management. Forest. Ecol. Manag. 2003, 180, 361–374. [Google Scholar]
  11. Neumayer, E. The human development index and sustainability: A constructive proposal. Ecol. Econ. 2001, 39, 101–114. [Google Scholar] [CrossRef]
  12. Banuelos, G.S. Phyto-products may be essential for sustainability and implementation of phytoremediation. Environ. Pollut. 2006, 144, 19–23. [Google Scholar] [CrossRef] [PubMed]
  13. Hezri, A.A.; Dovers, S.R. Sustainability indicators, policy and governance: Issues for ecological economics. Ecol. Econ. 2006, 60, 86–99. [Google Scholar] [CrossRef]
  14. Mariolakos, I. Water resources management in the framework of sustainable development. Desalination 2007, 213, 147–151. [Google Scholar] [CrossRef]
  15. Waas, T.; Hugé, J.; Block, T.; Wright, T.; Benitez-Capistros, F.; Verbruggen, A. Sustainability assessment and indicators: Tools in a decision-making strategy for sustainable development. Sustain. Sci. 2014, 6, 5512–5534. [Google Scholar] [CrossRef] [Green Version]
  16. Lopez, R.E.; Anriquez, G.; Gulati, S. Structural change and sustainable development. J. Environ. Econ. Manag. 2007, 53, 307–322. [Google Scholar] [CrossRef]
  17. Compendium of Sustainable Development Indicator Initiatives. Available online: http://www.iisd.org/measure/compendium/ (accessed on 2 July 2014).
  18. Langston, C.; Wong, F.K.; Hui, E.C.; Shen, L.Y. Strategic assessment of building adaptive reuse opportunities in Hong Kong. Build. Environ. 2008, 43, 1709–1718. [Google Scholar] [CrossRef]
  19. Moldan, B.; Billharz, S. Sustainability Indicators: Report of the Project on Indicators of Sustainable Development; John Wiley and Sons: Chichester, UK, 1997. [Google Scholar]
  20. Sarmento, M.; Durão, D.; Duarte, M. Study of environmental sustainability: The case of Portuguese polluting industries. Energy 2005, 30, 1247–1257. [Google Scholar] [CrossRef]
  21. Orecchini, F.; Santiangeli, A.; Valitutti, V. Sustainability science: Sustainable energy for mobility and its use in policy making. Sustain. Sci. 2011, 3, 1855–1865. [Google Scholar] [CrossRef]
  22. Rosenstrom, U.; Kyllonen, S. Impacts of a participatory approach to developing national level sustainable development indicators in Finland. J. Environ. Manag. 2007, 84, 282–298. [Google Scholar] [CrossRef]
  23. Wilson, J.; Tyedmers, P.; Pelot, R. Contrasting and comparing sustainable development indicator metrics. Ecol. Indic. 2007, 7, 299–314. [Google Scholar] [CrossRef]
  24. Alfsen, K.H.; Greaker, M. From natural resources and environmental accounting to construction of indicators for sustainable development. Ecol. Econ. 2007, 61, 600–610. [Google Scholar] [CrossRef]
  25. Halog, A.; Manik, Y. Advancing integrated systems modelling framework for life cycle sustainability assessment. Sustain. Sci. 2011, 3, 469–499. [Google Scholar] [CrossRef]
  26. Wiggering, H.; Rennings, K. Sustainability indicators: Geology meets economy. Environ. Geol. 1997, 32, 71–78. [Google Scholar] [CrossRef]
  27. Alexander, G. Information-based tools for building community and sustainability. Future 2000, 32, 317–337. [Google Scholar] [CrossRef]
  28. Yuan, W.; James, P.; Hodgson, K.; Hutchinson, S.M.; Shi, C. Development of sustainability indicators by communities in China: A case study of Chongming County, Shanghai. J. Environ. Manag. 2003, 68, 253–261. [Google Scholar] [CrossRef]
  29. Yigitcanlar, T.; Dur, F. Developing a sustainability assessment model: The sustainable Infrastructure, land-use, environment and transport model. Sustain. Sci. 2010, 2, 321–340. [Google Scholar]
  30. Johnson, K.; Hays, C.; Center, H.; Daley, C. Building capacity and sustainable prevention innovations: A sustainability planning model. Eval. Prog. Plan. 2004, 27, 135–149. [Google Scholar] [CrossRef]
  31. Clift, R. Sustainable development and its implications for chemical engineering. Chem. Eng. Sci. 2006, 61, 4179–4187. [Google Scholar] [CrossRef]
  32. Ferrarini, A.; Bodini, A.; Becchi, M. Environmental quality and sustainability in the province of Reggio Emilia (Italy): Using multi-criteria analysis to assess and compare municipal performance. J. Environ. Manag. 2001, 63, 117–131. [Google Scholar] [CrossRef]
  33. Nichols, K. Alternative urban futures: Planning for sustainable development in cities throughout the world. Ecol. Econ. 2006, 59, 182–183. [Google Scholar] [CrossRef]
  34. Dey, D.K.; Wang, Y.Z. Wavelet modeling of priors on triangles. J. Multivariate Anal. 2004, 89, 338–350. [Google Scholar] [CrossRef]
  35. Crabtree, B.; Bayfield, N. Developing sustainability indicators for mountain ecosystems: A study of the Cairgorms, Scotland. J. Environ. Manag. 1998, 52, 1–14. [Google Scholar] [CrossRef]
  36. Intergovernmental Panel on Climate Change (IPCC). Climate change 2001: The scientific basis. In Summary for Policymakers and Technical Summary of the Working Group I Report; Cambridge University Press: Cambridge, UK, 2001. [Google Scholar]
  37. O’Dwyer, B.; Owen, D.L. Assurance statement practice in environmental, social and sustainability reporting: A critical evaluation. Br. Acc. Rev. 2005, 37, 205–229. [Google Scholar] [CrossRef]
  38. Federici, M.; Ulgiati, S.; Verdesca, D.; Basosi, R. Efficiency and sustainability indicators for passenger and commodities transportation systems: The case of Siena, Italy. Ecol. Indic. 2003, 3, 155–169. [Google Scholar] [CrossRef]
  39. Tisdell, C. Globalisation and sustainability: Environmental Kuznets curve and the WTO. Ecol. Econ. 2001, 39, 185–196. [Google Scholar] [CrossRef]
  40. Altrichter, M. The sustainability of subsistence hunting of peccaries in the Argentine Chaco. Biol. Conserv. 2005, 126, 351–362. [Google Scholar] [CrossRef]
  41. Painter, D.J. Forty-nine shades of green: Ecology and sustainability in the academic formation of engineers. Ecol. Eng. 2003, 20, 267–273. [Google Scholar] [CrossRef]
  42. Scott, K.; Park, J.; Cocklin, C. From ‘sustainable rural communities’ to ‘social sustainability’: Giving voice to diversity in Mangakahia Valley, New Zealand. J. Rural Stud. 2000, 16, 433–446. [Google Scholar] [CrossRef]
  43. Marcotullio, P.J. Asian urban sustainability in the era of globalization. Habitat. Int. 2001, 25, 577–598. [Google Scholar] [CrossRef]
  44. Anand, S.; Sen, A. Human Development and Economic Sustainability. World. Dev. 2000, 28, 2029–2049. [Google Scholar] [CrossRef]
  45. Simms, V.M.; Makalo, P.; Bailey, R.L.; Emerson, P.M. Sustainability and acceptability of latrine provision in The Gambia. Trans. R. Soc. Trop. Med. Hyg. 2005, 99, 631–637. [Google Scholar] [CrossRef] [PubMed]
  46. AboulNaga, M.M.; Elsheshtawy, Y.H. Environmental sustainability assessment of buildings in hot climates: The case of the UAE. Renew. Energy 2001, 24, 553–563. [Google Scholar] [CrossRef]
  47. Horwitz, P.; Wilcox, B.A. Parasites, ecosystems and sustainability: An ecological and complex systems perspective. Int. J. Parasitol. 2005, 35, 725–732. [Google Scholar] [CrossRef] [PubMed]
  48. Li, C.Z.; Löfgren, K.G. Renewable resources and economic sustainability: A dynamic analysis with Heterogeneous Time Preferences. J. Environ. Econ. Manag. 2000, 40, 236–250. [Google Scholar] [CrossRef]
  49. Rogers, P.L.; Jeon, Y.J.; Svenson, C.J. Application of biotechnology to industrial sustainability. Process. Saf. Environ. Protect. 2005, 83, 499–503. [Google Scholar] [CrossRef]

