The “Bad Labor” Footprint: Quantifying the Social Impacts of Globalization

Abstract
:
1. Introduction
2. Methods
2.1. Bad Labor Measures
2.1.1. Occupational Health Damage

| Measure | Indicators | Unit | Definition | Spatial Detail of Original Data | Temporal Detail | Source |
|---|---|---|---|---|---|---|
| Total labor | Total labor | Persons-year equivalent (p-yeq) | Total employment required for the production of goods and services | EXIOBASE (1) | 2007 | [19,46] |
| Occupational health damage | Incidence of burden of disease for cancer of the trachea, bronchus and lung; leukemia; chronic obstructive pulmonary disease; asthma; noise-induced hearing loss; low back pain; and injuries | Disability-Adjusted Life Years (DALY) | Measures the gap between the current situation and an ideal situation in which everyone lives up to the standard life expectancy in perfect health. It combines the time lived with disabilities and the time lost due to premature mortality | Africa, Middle East, North America OECD, Latin America and the Caribbean, Europe OECD, Europe Other, Asia and the Pacific | 2000 | [43,47,48] |
| Vulnerable employment | Persons in total labor without employee status | Persons-year equivalent (p-yeq); Share of total labor (%) | Workers without proper coverage of labor regulations and guarantees. It comprises unpaid contributing family workers and own-account workers. | EXIOBASE (1) | 2007 | [19,46] |
| Gender inequality | Women in workforce, as a share of total labor | Share of total labor (%) | Share of women in the labor market | EXIOBASE (1) | 2007 | [19] |
| Incidence of unskilled and low-skilled workers | Low-skilled labor, in absolute values and as a share of total labor | Persons-year equivalent (p-yeq); Share of total labor (%) | Employment in elementary occupations [49] and/or employees with educational attainment levels until (and including) primary education [50] | EXIOBASE (1) | 2007 | [19] |
| Child labor | Children in child labor and in hazardous child labor | Persons-year equivalent (p-yeq) | Work done by children who are younger than the designated minimum working age and children in hazardous labor, that is, in worst forms of labor due to moral, health, and safety risks. Can include children in forced labor. | Asia and the Pacific, Latin America and the Caribbean, Sub-Saharan Africa, Other regions | 2004 to 2008 | [18] |
| Forced labor | Workers in forced labor | Persons-year equivalent (p-yeq) | All work or service which is not performed voluntarily, including debt bondage. Can include children in forced labor. | Asia and the Pacific, Latin America and the Caribbean, Africa, Middle East, Central and South-Eastern Europe (non-EU) and CIS, Developed economies and the EU | 2002 to 2011 | [51] |
2.1.2. Vulnerable Employment
2.1.3. Gender Inequality
2.1.4. Incidence of Unskilled and Low-Skilled Workers
2.1.5. Child Labor
2.1.6. Forced Labor
2.2. Multi-Regional Input-Output Model
- (1)
- the inter-industry model (Z), which shows the flows of products between industries;
- (2)
- the final demand matrix (Y), which contains direct expenditures to both domestic and imported products from households and governments and to capital formation; and
- (3)
- a matrix (F) comprised of factors of production associated with each economic sector. Factors of production are requirements, such as labor, and burdens, such as pollution, expressed per unit of output from each industry.

2.3. Data and Allocation
3. Results
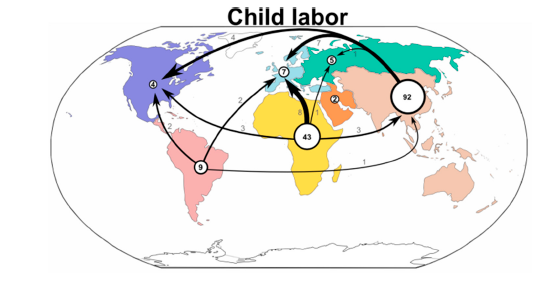
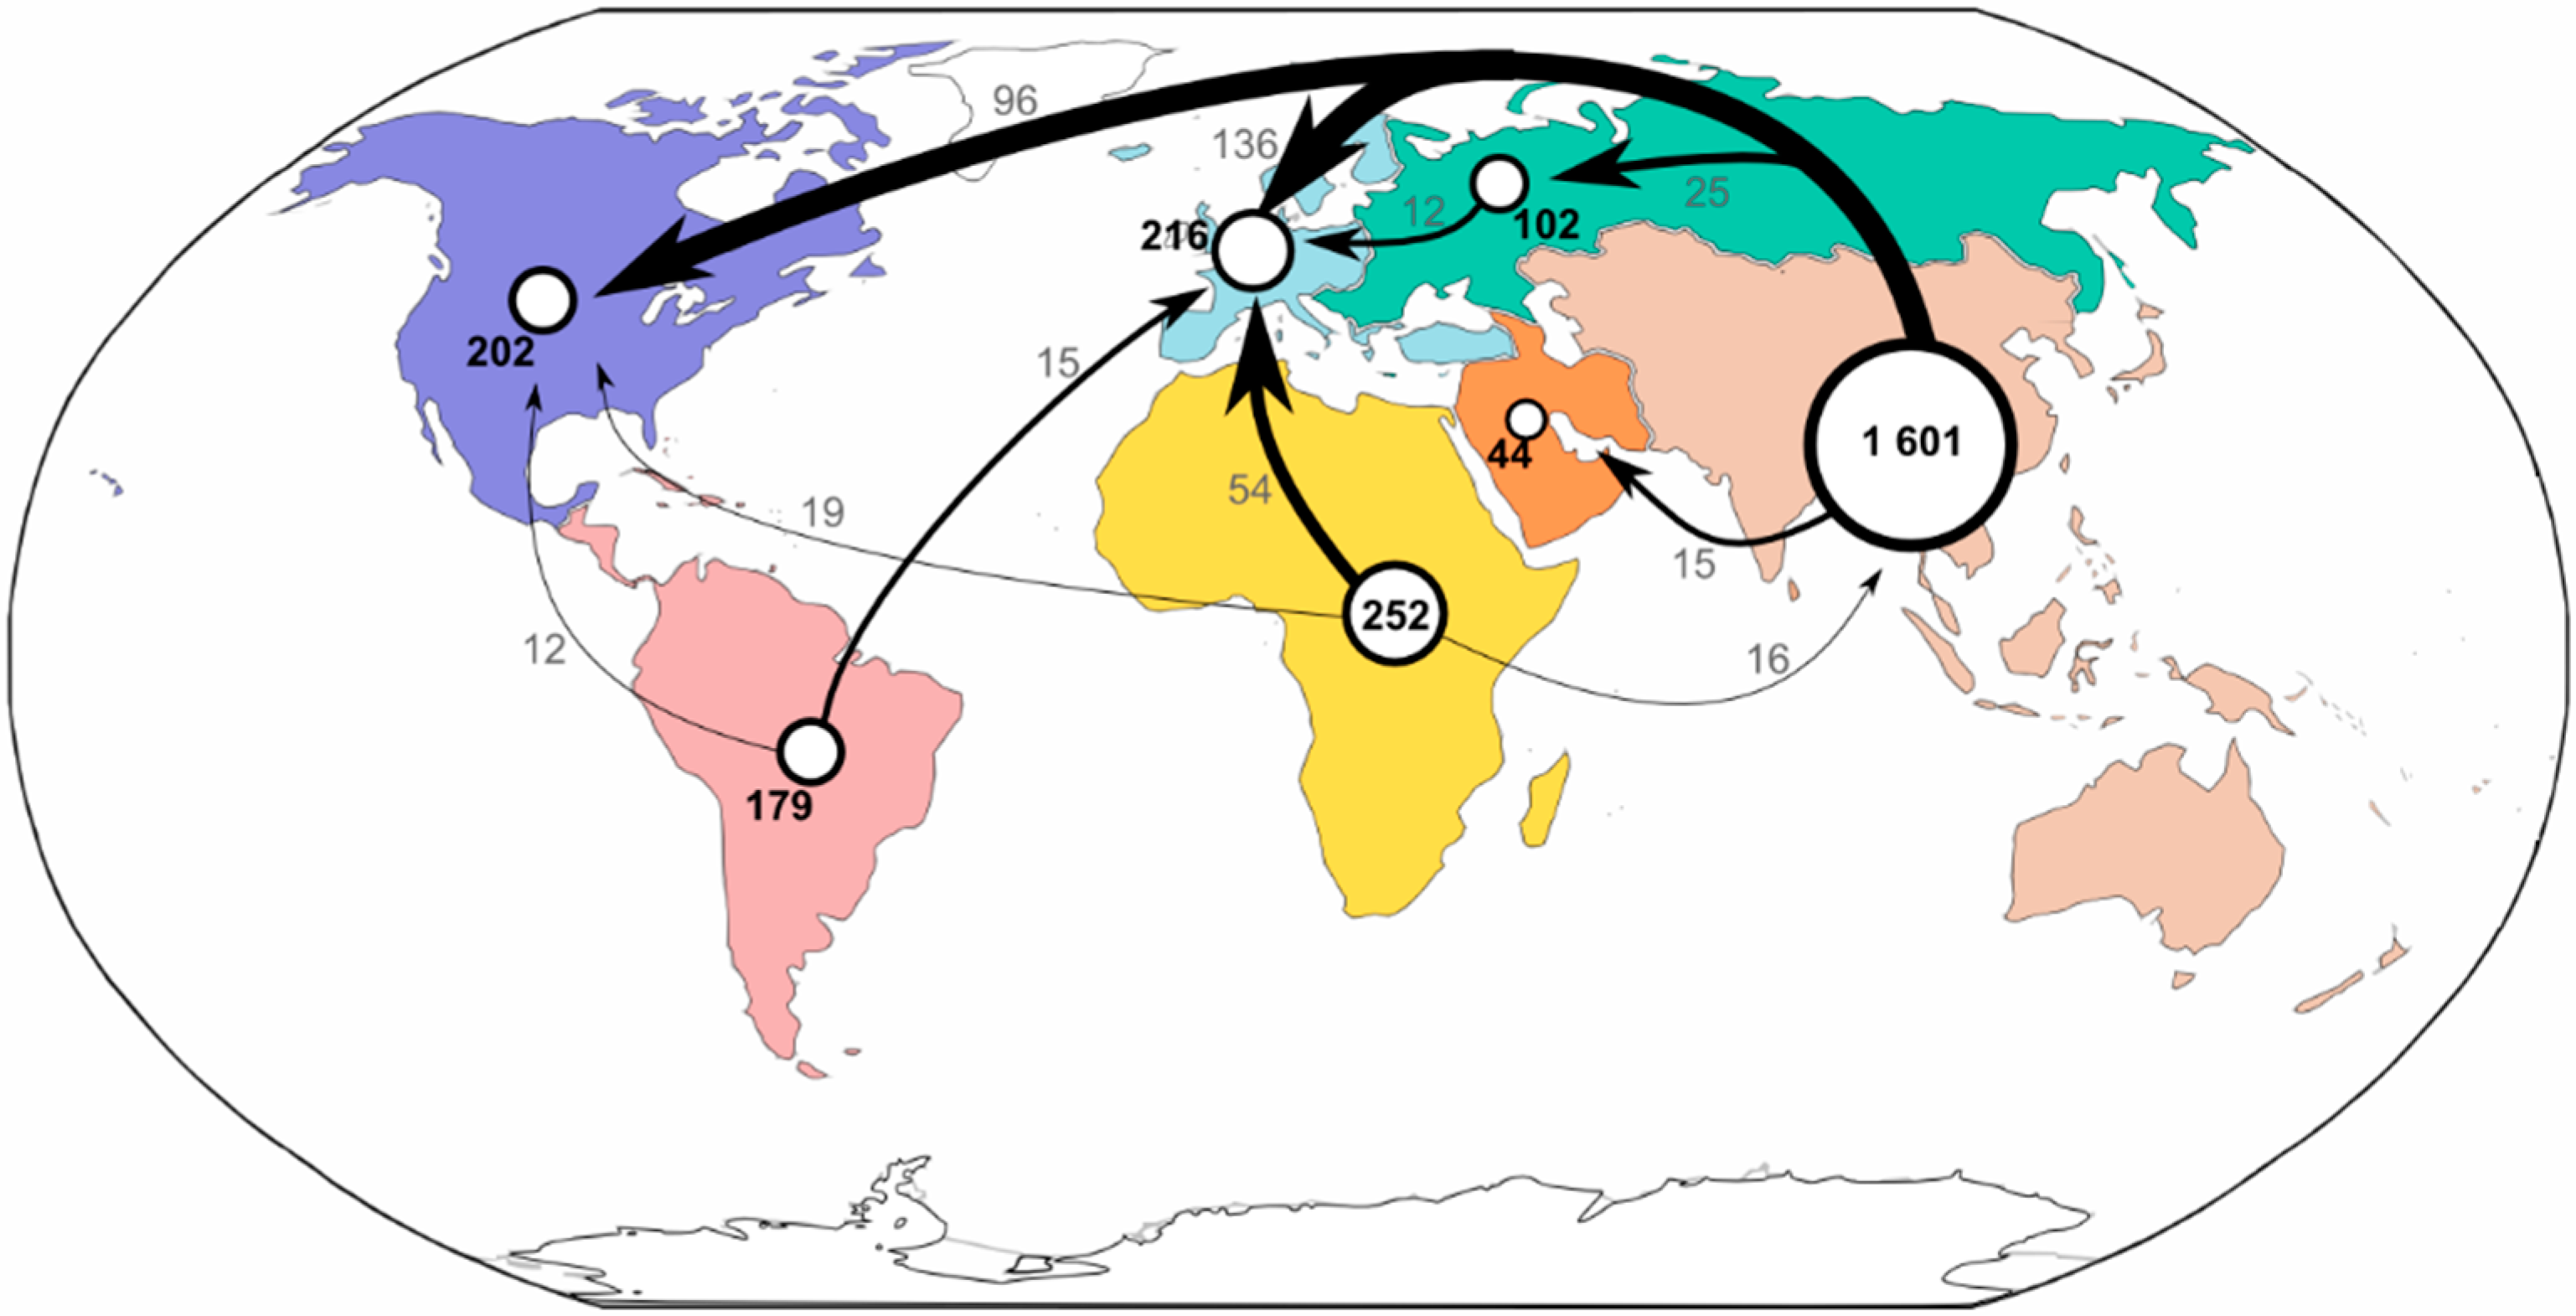
3.1. Consumption in Affluent Countries Drives Bad Labor Transfer
| North America | Europe | Non-OECD | Middle | Latin | Asia and the Pacific | Africa | ||
|---|---|---|---|---|---|---|---|---|
| OECD | Europe | East | America | |||||
| Total employment | Footprint (1000 p-yeq) | 340,597 | 442,142 | 140,138 | 64,629 | 193,651 | 1,643,781 | 261,241 |
| Domestic share of footprint | 59% | 49% | 73% | 68% | 92% | 97% | 96% | |
| Imports share of footprint | 41% | 51% | 27% | 32% | 8% | 3% | 4% | |
| Exports footprint | 10,732 | 23,263 | 22,692 | 15,243 | 36,583 | 283,298 | 99,223 | |
| Exports share of production | 5% | 10% | 18% | 26% | 17% | 15% | 28% | |
| Vulnerable employment | Footprint (1000 p-yeq) | 77,436 | 135,302 | 27,759 | 24,443 | 64,262 | 539,060 | 149,147 |
| Domestic share of footprint | 33% | 28% | 49% | 66% | 93% | 97% | 98% | |
| Imports share of footprint | 67% | 72% | 51% | 34% | 7% | 3% | 2% | |
| Exports footprint | 1367 | 3821 | 3047 | 5955 | 16,010 | 99,916 | 66,816 | |
| Exports share of production | 5% | 9% | 18% | 27% | 21% | 16% | 31% | |
| Low-skilled labor | Footprint (1,000 p-yeq) | 69,642 | 104,618 | 25,589 | 9858 | 36,885 | 768,777 | 75,923 |
| Domestic share of footprint | 32% | 22% | 45% | 48% | 89% | 99% | 97% | |
| Imports share of footprint | 68% | 78% | 55% | 52% | 11% | 1% | 3% | |
| Exports footprint | 1,136 | 2,166 | 2,450 | 1,493 | 4,058 | 118,907 | 32,602 | |
| Exports share of production | 5% | 9% | 18% | 24% | 11% | 14% | 31% | |
| Occupational health | Footprint (1000 DALYs) | 2138 | 3616 | 1540 | 697 | 1590 | 15,444 | 3814 |
| Domestic share of footprint | 36% | 29% | 76% | 78% | 91% | 97% | 98% | |
| Imports share of footprint | 64% | 71% | 24% | 22% | 9% | 3% | 2% | |
| Exports footprint | 34 | 96 | 286 | 235 | 374 | 2,458 | 1,707 | |
| Exports share of production | 4% | 8% | 20% | 30% | 21% | 14% | 31% | |
| Child labor | Footprint (1000 p-yeq) | 13,149 | 26,524 | 8,025 | 3,037 | 9,632 | 96,437 | 43,016 |
| Domestic share of footprint | 28% | 27% | 66% | 67% | 91% | 96% | 99% | |
| Imports share of footprint | 72% | 73% | 34% | 33% | 9% | 4% | 1% | |
| Exports footprint | 238 | 585 | 922 | 902 | 4,375 | 13,098 | 17,807 | |
| Exports share of production | 6% | 8% | 15% | 31% | 33% | 12% | 29% | |
| Hazardous child labor | Footprint (1000 p-yeq) | 8276 | 16,807 | 5966 | 2270 | 6352 | 41,788 | 25,589 |
| Domestic share of footprint | 38% | 36% | 75% | 76% | 92% | 94% | 99% | |
| Imports share of footprint | 62% | 64% | 25% | 24% | 8% | 6% | 1% | |
| Exports footprint | 201 | 494 | 779 | 761 | 2,923 | 5,553 | 10,601 | |
| Exports share of production | 6% | 8% | 15% | 31% | 33% | 12% | 29% | |
| Forced labor | Footprint (1000 p-yeq) | 901 | 1822 | 897 | 332 | 728 | 6822 | 1678 |
| Domestic share of footprint | 34% | 38% | 81% | 80% | 92% | 97% | 98% | |
| Imports share of footprint | 66% | 62% | 19% | 20% | 8% | 3% | 2% | |
| Exports footprint | 20 | 52 | 126 | 112 | 353 | 938 | 688 | |
| Exports share of production | 6% | 7% | 15% | 30% | 34% | 12% | 29% |
3.2. The Contribution of Consumption to Bad Labor Footprints

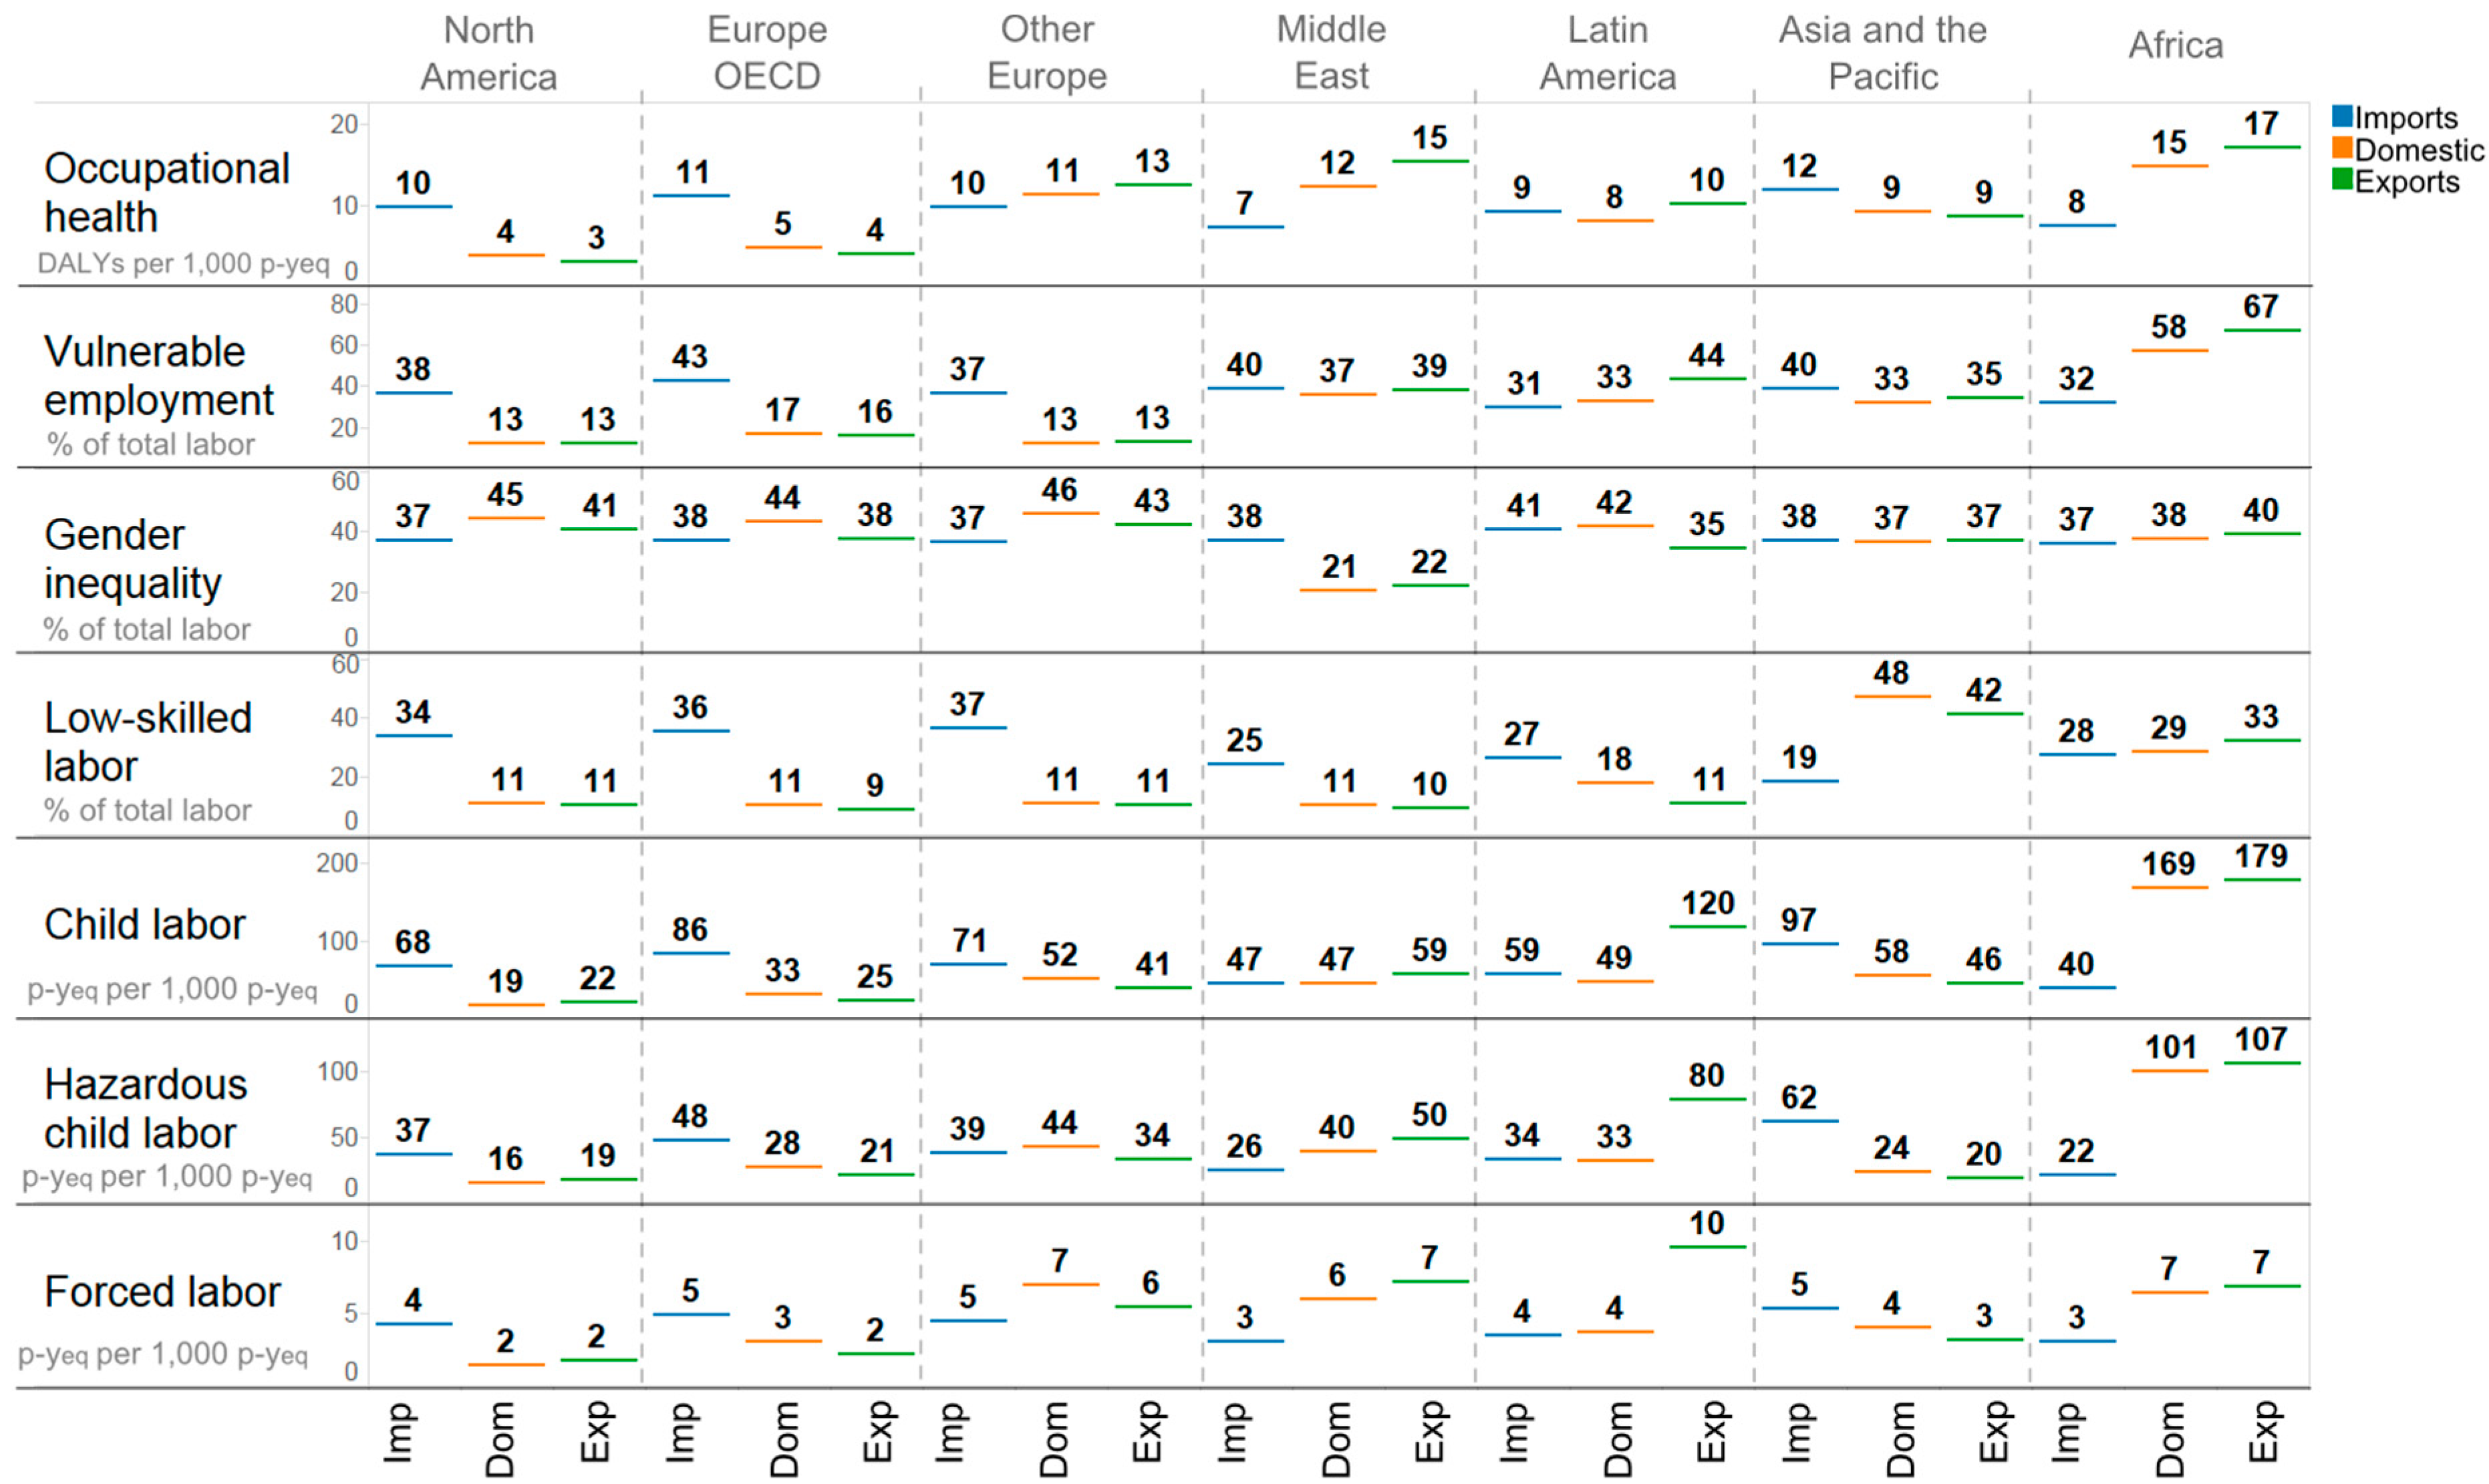
3.3. Bad Labor Intensities

| North America | Europe OECD | Non-OECD Europe | Middle East | Latin America | Asia Pacific | Africa | ||
|---|---|---|---|---|---|---|---|---|
| Occupational health damage (DALYs) | per GDP (1) | 0.2 | 0.3 | 1.0 | 0.8 | 0.9 | 1.7 | 5.6 |
| per GDE (2) | 0.2 | 0.3 | 1.1 | 0.9 | 0.9 | 1.8 | 5.7 | |
| per 1000 inhabitants | 4.8 | 6.7 | 5.9 | 2.5 | 3.4 | 4.1 | 4.4 | |
| per 1000 p-yeq | 6.3 | 8.2 | 11.0 | 10.8 | 8.2 | 9.4 | 14.6 | |
| Vulnerable employment (p-yeq) | per GDP (1) | 7 | 11 | 19 | 27 | 37 | 60 | 220 |
| per GDE (2) | 6 | 11 | 19 | 30 | 37 | 61 | 225 | |
| per 1000 inhabitants | 173 | 250 | 106 | 89 | 139 | 143 | 171 | |
| per 1000 p-yeq | 227 | 306 | 198 | 378 | 332 | 328 | 571 | |
| Women in workforce (p-yeq) | per GDP (1) | 12 | 15 | 42 | 19 | 47 | 68 | 148 |
| per GDE (2) | 12 | 14 | 42 | 21 | 47 | 70 | 151 | |
| per 1000 inhabitants | 319 | 331 | 234 | 62 | 177 | 162 | 115 | |
| per 1000 p-yeq | 419 | 406 | 438 | 265 | 423 | 371 | 383 | |
| Low-skilled workers (p-yeq) | per GDP (1) | 6 | 8 | 17 | 11 | 21 | 85 | 112 |
| per GDE (2) | 6 | 9 | 18 | 12 | 21 | 88 | 114 | |
| per 1000 inhabitants | 156 | 193 | 98 | 36 | 80 | 204 | 87 | |
| per 1000 p-yeq | 205 | 237 | 183 | 153 | 191 | 468 | 291 | |
| Child labor (p-yeq) | per GDP (1) | 1 | 2 | 5 | 3 | 6 | 11 | 64 |
| per GDE (2) | 1 | 2 | 6 | 4 | 6 | 11 | 65 | |
| per 1000 inhabitants | 30 | 49 | 31 | 11 | 21 | 26 | 49 | |
| per 1000 p-yeq | 39 | 60 | 57 | 47 | 50 | 59 | 165 | |
| Hazardous child labor (p-yeq) | per GDP (1) | 1 | 1 | 4 | 3 | 4 | 5 | 38 |
| per GDE (2) | 1 | 1 | 4 | 3 | 4 | 5 | 39 | |
| per 1000 inhabitants | 19 | 31 | 23 | 8 | 14 | 11 | 29 | |
| per 1000 p-yeq | 24 | 38 | 43 | 35 | 33 | 25 | 98 | |
| Forced labor (p-yeq) | per GDP (1) | 0.1 | 0.1 | 0.6 | 0.4 | 0.4 | 0.8 | 2.5 |
| per GDE (2) | 0.1 | 0.1 | 0.6 | 0.4 | 0.4 | 0.8 | 2.5 | |
| per 1000 inhabitants | 2.0 | 3.4 | 3.4 | 1.2 | 1.6 | 1.8 | 1.9 | |
| per 1000 p-yeq | 2.6 | 4.1 | 6.4 | 5.1 | 3.8 | 4.2 | 6.4 | |
| Total labor (p-yeq) | per GDP (1) | 29 | 36 | 95 | 71 | 111 | 183 | 386 |
| per GDE (2) | 28 | 37 | 36 | 80 | 112 | 187 | 394 | |
| per 1000 inhabitants | 761 | 815 | 535 | 235 | 420 | 435 | 300 | |
| per 1000 p-yeq | - | - | - | - | - | - | - |
4. Discussion
4.1. The Social Footprints of Trade
4.2. Limitations and Further Research
5. Conclusions
Acknowledgments
Author Contributions
Supplementary Materials
Appendix
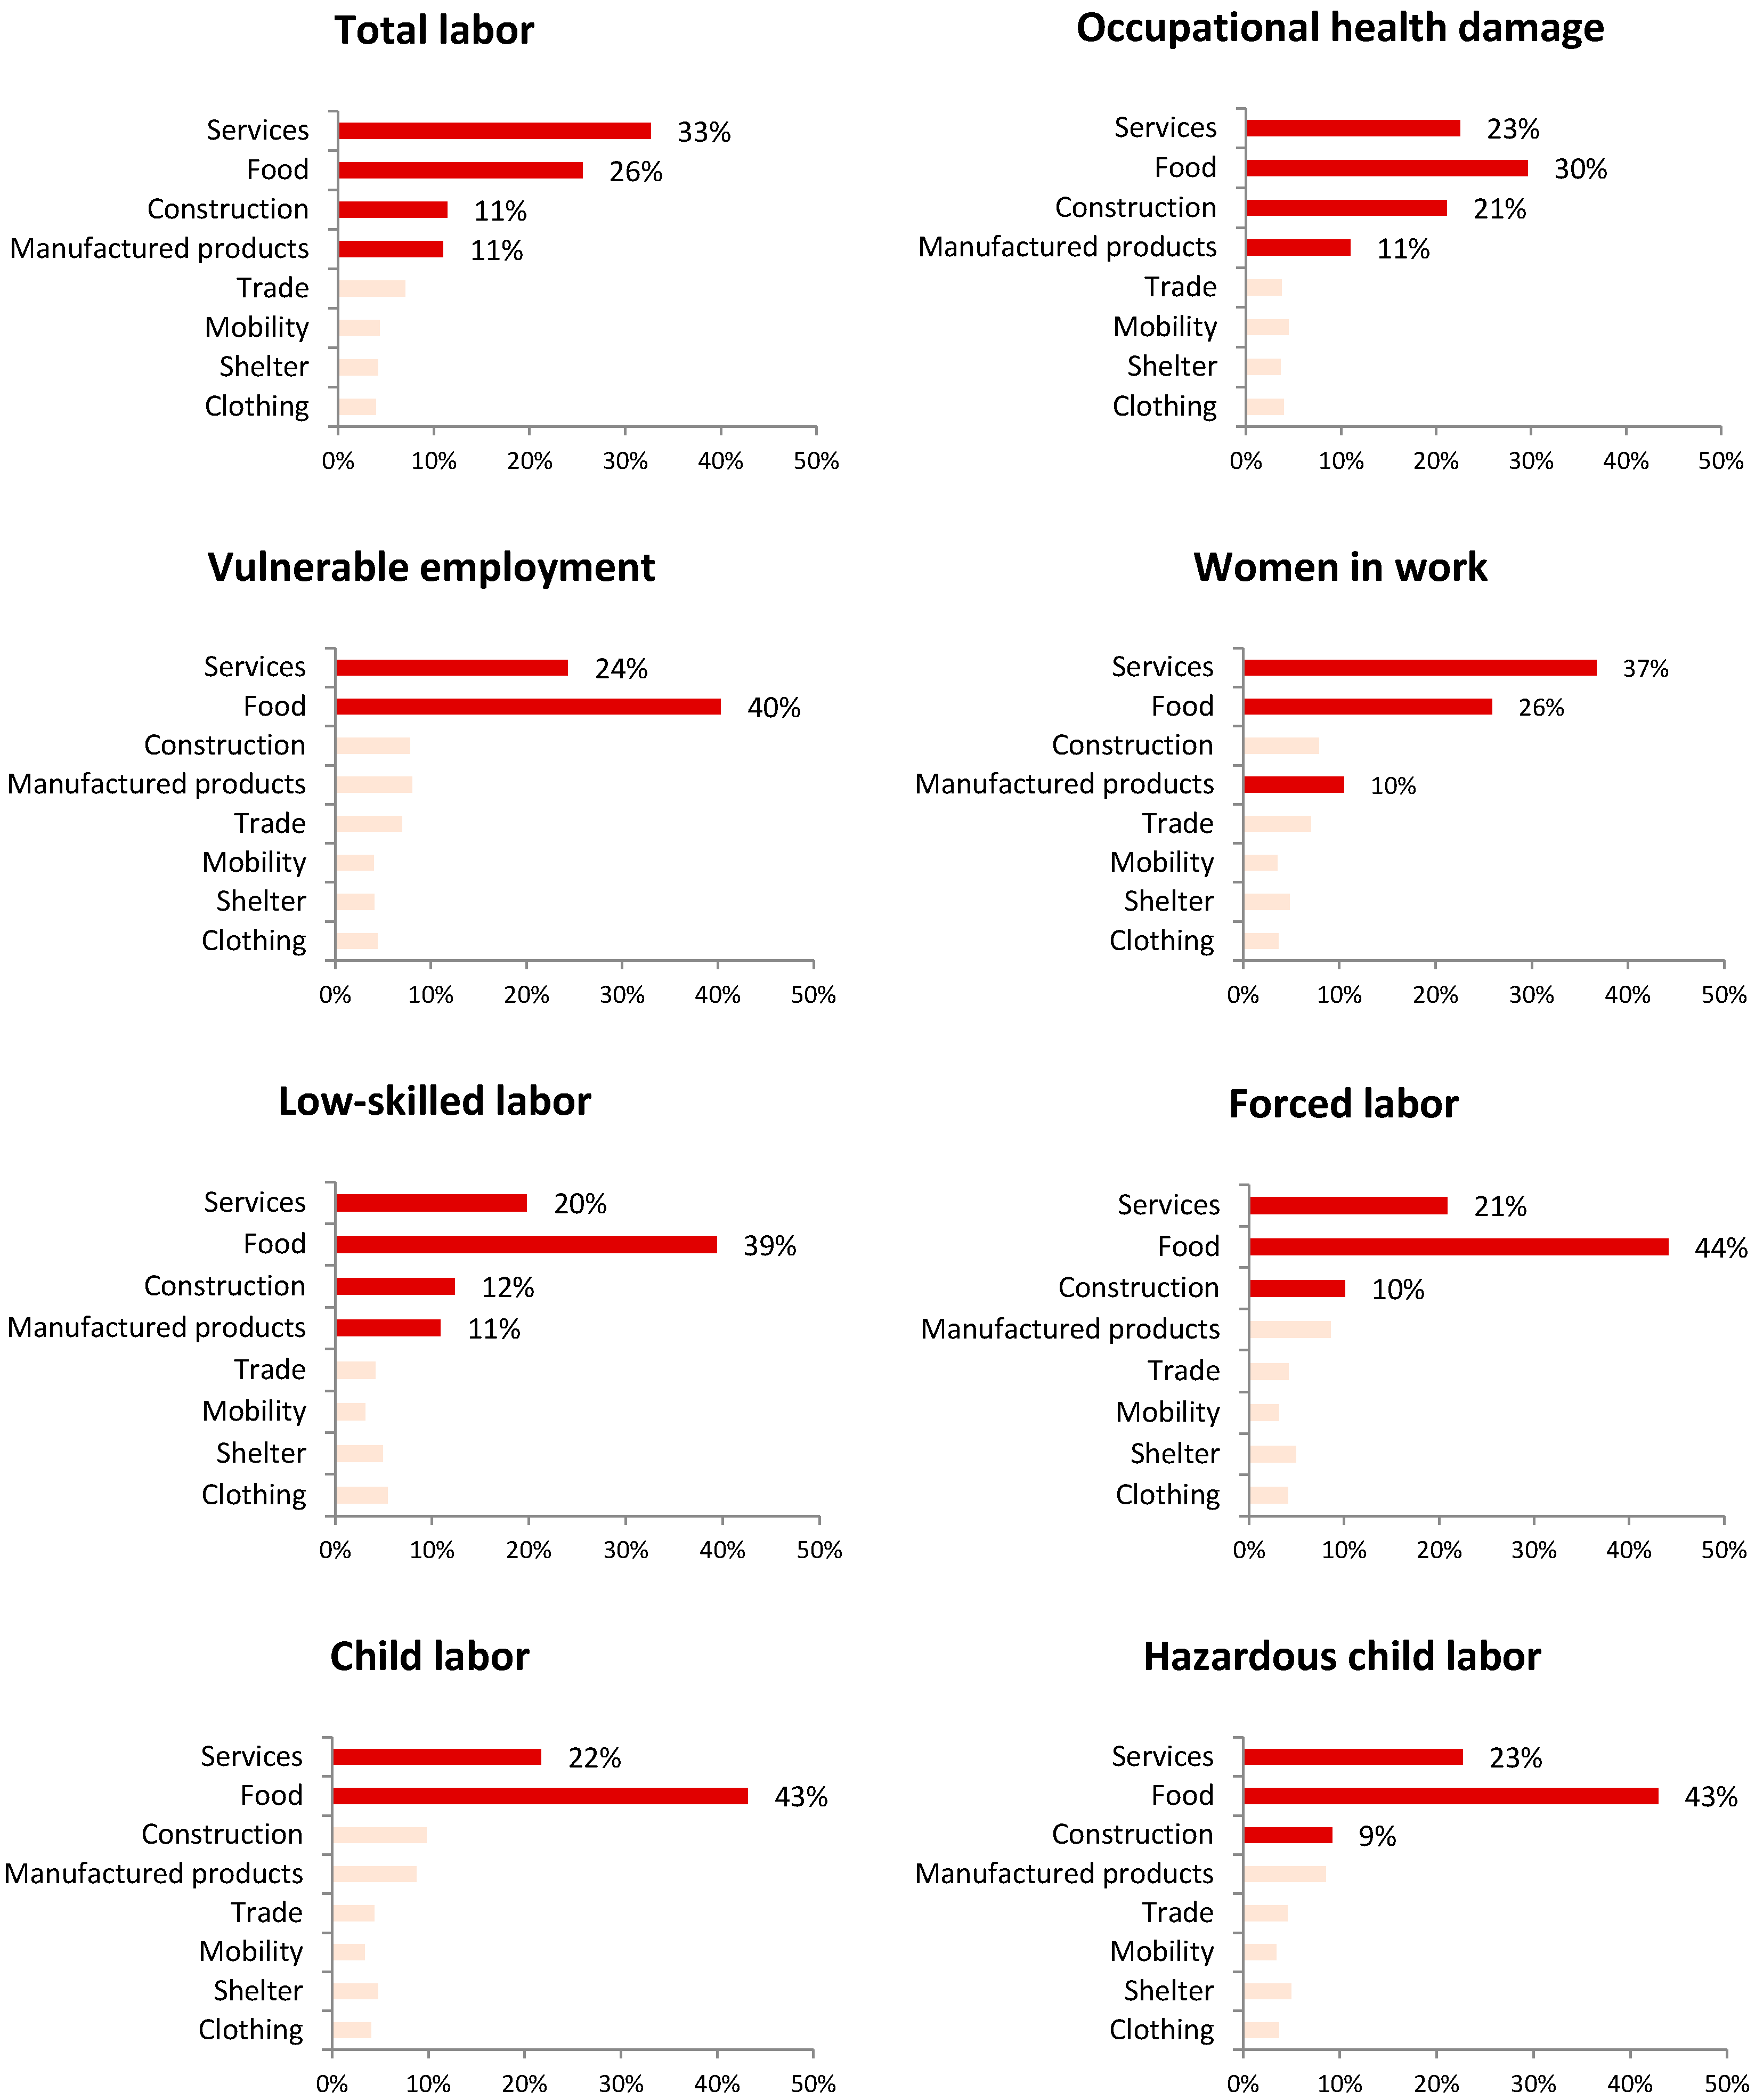
| Vulnerable employment (*) | Low-skilled labor (*) | Gender inequality (*) | Occupational health (**) | Child labor (*) | Hazardous child labor (*) | Forced labor (*) | |||||||||||||||||||||||||||||||||
|---|---|---|---|---|---|---|---|---|---|---|---|---|---|---|---|---|---|---|---|---|---|---|---|---|---|---|---|---|---|---|---|---|---|---|---|---|---|---|---|
| Reg | Cat | V | Reg | Cat | V | Reg | Cat | V | Reg | Cat | V | Reg | Cat | V | Reg | Cat | V | Reg | Cat | V | |||||||||||||||||||
| 1 | Af | Food | 819 | AP | Food | 691 | NA | Cons | 123 | AP | Cons | 30 | Af | Food | 192 | ME | Food | 133 | OE | Food | 17 | ||||||||||||||||||
| 2 | ME | Food | 752 | AP | Cons | 581 | EU | Cons | 129 | OE | Cons | 26 | OE | Food | 178 | OE | Food | 132 | ME | Food | 16 | ||||||||||||||||||
| 3 | LA | Food | 636 | AP | Cloth | 539 | AP | Cons | 135 | Af | Cons | 20 | LA | Food | 173 | Af | Food | 114 | LA | Food | 14 | ||||||||||||||||||
| 4 | EU | Food | 625 | AP | Man | 504 | Af | Cons | 196 | Af | Cons | 20 | ME | Food | 172 | LA | Food | 114 | OE | Shelt | 11 | ||||||||||||||||||
| 5 | NA | Food | 580 | LA | Shelt | 491 | ME | Serv | 218 | EU | Cons | 20 | EU | Food | 146 | EU | Food | 93 | EU | Food | 10 | ||||||||||||||||||
| 6 | OE | Food | 531 | AP | Shelt | 482 | LA | Cons | 218 | Af | Food | 18 | Af | Shelt | 144 | Af | Shelt | 85 | NA | Food | 8.2 | ||||||||||||||||||
| 7 | AP | Food | 459 | OE | Cloth | 403 | OE | Cons | 245 | NA | Cons | 18 | Af | Trade | 141 | Af | Trade | 84 | Af | Food | 7.5 | ||||||||||||||||||
| 8 | AP | Trade | 395 | EU | Food | 400 | ME | Man | 249 | LA | Cons | 17 | Af | Serv | 139 | Af | Serv | 83 | AP | Food | 6.5 | ||||||||||||||||||
| 9 | Af | Cloth | 376 | NA | Cloth | 397 | ME | Mob | 250 | ME | Food | 16 | Af | Mob | 134 | Af | Mob | 80 | LA | Shelt | 5.9 | ||||||||||||||||||
| 10 | Af | Shelt | 371 | Af | Food | 395 | AP | Mob | 259 | Af | Mob | 16 | Af | Cloth | 134 | Af | Cloth | 79 | Af | Shelt | 5.7 | ||||||||||||||||||
| 11 | ME | Trade | 362 | NA | Food | 365 | NA | Mob | 267 | Af | Shelt | 14 | Af | Man | 132 | Af | Man | 79 | Af | Trade | 5.5 | ||||||||||||||||||
| 12 | AP | Cloth | 354 | NA | Shelt | 364 | EU | Mob | 270 | Af | Man | 14 | Af | Cons | 118 | OE | Shelt | 76 | Af | Cloth | 5.4 | ||||||||||||||||||
| 13 | LA | Cons | 348 | EU | Cloth | 363 | ME | Trade | 284 | ME | Mob | 13 | NA | Food | 114 | Af | Cons | 70 | Af | Serv | 5.4 | ||||||||||||||||||
| 14 | LA | Trade | 347 | OE | Food | 327 | ME | Cloth | 293 | OE | Shelt | 13 | OE | Shelt | 95 | NA | Food | 69 | Af | Mob | 5.3 | ||||||||||||||||||
| 15 | AP | Shelt | 337 | EU | Shelt | 322 | EU | Cloth | 308 | OE | Mob | 13 | AP | Food | 93 | LA | Shelt | 54 | Af | Man | 5.2 | ||||||||||||||||||
| 16 | Af | Trade | 337 | NA | Man | 314 | AP | Cloth | 313 | ME | Man | 13 | EU | Shelt | 82 | EU | Shelt | 52 | EU | Shelt | 5.1 | ||||||||||||||||||
| 17 | Af | Mob | 328 | AP | Mob | 296 | LA | Food | 313 | EU | Shelt | 13 | LA | Shelt | 82 | NA | Shelt | 44 | AP | Cons | 5.0 | ||||||||||||||||||
| 18 | Af | Serv | 318 | ME | Cloth | 293 | Af | Mob | 319 | OE | Food | 13 | NA | Shelt | 71 | AP | Food | 40 | NA | Shelt | 4.9 | ||||||||||||||||||
| 19 | ME | Shelt | 317 | Af | Cloth | 269 | OE | Mob | 334 | OE | Man | 13 | AP | Cons | 69 | AP | Cons | 29 | Af | Cons | 4.6 | ||||||||||||||||||
| 20 | LA | Mob | 300 | EU | Man | 261 | NA | Food | 341 | Af | Cloth | 12 | AP | Shelt | 63 | AP | Shelt | 28 | AP | Shelt | 4.4 | ||||||||||||||||||
| 21 | EU | Cloth | 297 | NA | Cons | 252 | EU | Man | 343 | EU | Food | 12 | ME | Shelt | 41 | ME | Shelt | 26 | ME | Shelt | 3.7 | ||||||||||||||||||
| 22 | ME | Mob | 291 | AP | Trade | 234 | Af | Serv | 345 | LA | Food | 12 | AP | Mob | 37 | NA | Cons | 23 | ME | Cloth | 3.0 | ||||||||||||||||||
| 23 | ME | Serv | 290 | Af | Shelt | 232 | Af | Trade | 350 | NA | Food | 11 | AP | Cloth | 34 | LA | Man | 19 | OE | Cons | 3.0 | ||||||||||||||||||
| 24 | EU | Shelt | 283 | ME | Food | 221 | NA | Cloth | 350 | LA | Mob | 11 | EU | Cloth | 33 | ME | Cloth | 18 | OE | Serv | 2.9 | ||||||||||||||||||
| 25 | AP | Mob | 279 | LA | Mob | 206 | ME | Shelt | 350 | NA | Shelt | 11 | AP | Man | 31 | EU | Cloth | 17 | AP | Mob | 2.6 | ||||||||||||||||||
| 26 | LA | Serv | 263 | LA | Trade | 195 | ME | Food | 355 | AP | Shelt | 11 | AP | Trade | 31 | LA | Cloth | 16 | ME | Serv | 2.6 | ||||||||||||||||||
| 27 | ME | Cloth | 260 | Af | Trade | 195 | LA | Mob | 356 | AP | Man | 10 | NA | Cons | 30 | LA | Mob | 16 | OE | Trade | 2.6 | ||||||||||||||||||
| 28 | Af | Cons | 259 | LA | Serv | 194 | NA | Man | 357 | ME | Cloth | 10 | NA | Cloth | 30 | AP | Mob | 16 | OE | Mob | 2.6 | ||||||||||||||||||
| 29 | EU | Trade | 258 | Af | Mob | 190 | LA | Man | 363 | ME | Shelt | 10 | ME | Cloth | 30 | NA | Cloth | 16 | AP | Cloth | 2.5 | ||||||||||||||||||
| 30 | NA | Cloth | 248 | AP | Serv | 184 | OE | Man | 364 | AP | Food | 9.9 | LA | Man | 29 | NA | Man | 16 | ME | Trade | 2.5 | ||||||||||||||||||
| 31 | LA | Cloth | 245 | OE | Shelt | 184 | LA | Cloth | 365 | AP | Mob | 9.8 | OE | Cloth | 29 | OE | Cloth | 15 | ME | Man | 2.5 | ||||||||||||||||||
| 32 | NA | Shelt | 241 | ME | Shelt | 183 | AP | Trade | 370 | OE | Cloth | 9.7 | NA | Man | 27 | LA | Serv | 15 | OE | Cloth | 2.4 | ||||||||||||||||||
| 33 | Af | Cons | 235 | Af | Serv | 181 | Af | Cons | 372 | LA | Shelt | 9.2 | EU | Man | 26 | EU | Man | 15 | NA | Cloth | 2.4 | ||||||||||||||||||
| 34 | Af | Man | 224 | LA | Cons | 166 | EU | Food | 377 | LA | Man | 9.1 | EU | Mob | 26 | LA | Trade | 15 | ME | Mob | 2.3 | ||||||||||||||||||
| 35 | LA | Man | 218 | ME | Trade | 164 | AP | Man | 381 | AP | Cloth | 9.1 | LA | Cloth | 25 | EU | Mob | 15 | AP | Man | 2.3 | ||||||||||||||||||
| 36 | NA | Trade | 212 | EU | Mob | 160 | AP | Shelt | 381 | Af | Serv | 9.0 | LA | Mob | 24 | AP | Cloth | 14 | EU | Cloth | 2.3 | ||||||||||||||||||
| 37 | EU | Cons | 209 | OE | Man | 154 | OE | Food | 382 | EU | Mob | 8.8 | AP | Serv | 23 | EU | Cons | 14 | AP | Trade | 2.2 | ||||||||||||||||||
| 38 | AP | Serv | 203 | ME | Man | 152 | Af | Cloth | 388 | EU | Man | 8.5 | NA | Mob | 23 | ME | Trade | 14 | OE | Man | 2.0 | ||||||||||||||||||
| 39 | NA | Cons | 198 | NA | Mob | 152 | Af | Man | 389 | ME | Serv | 8.2 | ME | Trade | 23 | AP | Man | 14 | Af | Cons | 2.0 | ||||||||||||||||||
| 40 | EU | Mob | 193 | Af | Man | 150 | AP | Food | 400 | EU | Cloth | 8.2 | LA | Serv | 22 | LA | Cons | 14 | NA | Man | 1.9 | ||||||||||||||||||
| 41 | ME | Man | 189 | Af | Cons | 145 | OE | Shelt | 400 | NA | Man | 8.0 | LA | Trade | 22 | AP | Trade | 13 | NA | Cons | 1.9 | ||||||||||||||||||
| 42 | LA | Shelt | 180 | NA | Trade | 144 | OE | Cloth | 402 | NA | Cloth | 7.9 | EU | Trade | 21 | NA | Trade | 13 | LA | Man | 1.8 | ||||||||||||||||||
| 43 | OE | Trade | 180 | EU | Cons | 139 | Af | Food | 409 | NA | Mob | 7.8 | EU | Cons | 21 | NA | Mob | 13 | LA | Mob | 1.7 | ||||||||||||||||||
| 44 | OE | Shelt | 177 | ME | Mob | 136 | AP | Serv | 417 | LA | Cloth | 7.3 | LA | Cons | 20 | OE | Man | 13 | EU | Mob | 1.7 | ||||||||||||||||||
| 45 | NA | Mob | 168 | OE | Cons | 125 | EU | Shelt | 428 | Af | Trade | 6.4 | NA | Trade | 19 | EU | Trade | 13 | LA | Trade | 1.7 | ||||||||||||||||||
| 46 | EU | Serv | 143 | ME | Serv | 123 | EU | Trade | 432 | OE | Serv | 6.1 | ME | Man | 18 | OE | Cons | 12 | AP | Serv | 1.7 | ||||||||||||||||||
| 47 | AP | Cons | 131 | EU | Serv | 122 | LA | Trade | 432 | LA | Serv | 5.9 | OE | Man | 17 | ME | Man | 12 | EU | Man | 1.6 | ||||||||||||||||||
| 48 | NA | Serv | 113 | OE | Mob | 121 | NA | Shelt | 433 | ME | Trade | 4.9 | ME | Mob | 17 | EU | Serv | 11 | LA | Cloth | 1.6 | ||||||||||||||||||
| 49 | OE | Mob | 113 | LA | Man | 119 | Af | Shelt | 438 | AP | Serv | 4.5 | EU | Serv | 16 | ME | Mob | 11 | LA | Serv | 1.6 | ||||||||||||||||||
| 50 | OE | Cloth | 102 | OE | Trade | 118 | NA | Trade | 439 | OE | Trade | 4.3 | OE | Trade | 16 | ME | Serv | 11 | EU | Cons | 1.5 | ||||||||||||||||||
| 51 | AP | Man | 98 | EU | Trade | 117 | LA | Serv | 487 | LA | Trade | 4.2 | OE | Mob | 15 | OE | Trade | 11 | NA | Mob | 1.4 | ||||||||||||||||||
| 52 | OE | Cons | 89 | OE | Serv | 115 | EU | Serv | 523 | AP | Trade | 3.4 | OE | Cons | 15 | OE | Serv | 11 | LA | Cons | 1.4 | ||||||||||||||||||
| 53 | NA | Man | 88 | LA | Cloth | 100 | NA | Serv | 527 | EU | Serv | 3.2 | ME | Serv | 14 | OE | Mob | 11 | EU | Trade | 1.4 | ||||||||||||||||||
| 54 | EU | Man | 86 | NA | Serv | 93 | OE | Trade | 532 | EU | Trade | 2.8 | OE | Serv | 14 | AP | Serv | 10 | NA | Trade | 1.2 | ||||||||||||||||||
| 55 | OE | Serv | 75 | Af | Cons | 85 | OE | Serv | 578 | NA | Serv | 2.7 | NA | Serv | 13 | NA | Serv | 9 | EU | Serv | 1.1 | ||||||||||||||||||
| 56 | OE | Man | 69 | LA | Food | 84 | LA | Shelt | 644 | NA | Trade | 2.3 | Af | Cons | 11 | Af | Cons | 9 | NA | Serv | 0.8 | ||||||||||||||||||
Conflicts of Interest
References
- BBC. Bangladesh factory collapse toll passes 1000. BBC News, 10 May 2013. [Google Scholar]
- BBC. Qatar migrant workers “treated like animals”—Amnesty. BBC News, 17 November 2013. [Google Scholar]
- BBC. Indian worker death rate in Qatar “normal.”. BBC News, 19 February 2014. [Google Scholar]
- McGrath, S. Fuelling global production networks with slave labour? Migrant sugar cane workers in the Brazilian ethanol GPN. Geoforum 2013, 44, 32–43. [Google Scholar] [CrossRef]
- Benoit-Norris, C.; Cavan, D.A.; Norris, G. Identifying Social Impacts in Product Supply Chains: Overview and Application of the Social Hotspot Database. Sustainability 2012, 4, 1946–1965. [Google Scholar] [CrossRef]
- Kolk, A.; van Tulder, R. Ethics in international business: Multinational approaches to child labor. J. World Bus. 2004, 39, 49–60. [Google Scholar] [CrossRef]
- Raynolds, L.T. Mainstreaming Fair Trade Coffee: From Partnership to Traceability. World Dev. 2009, 37, 1083–1093. [Google Scholar] [CrossRef]
- Smith, S.; Barrientos, S. Fair trade and ethical trade: Are there moves towards convergence? Sustain. Dev. 2005, 13, 190–198. [Google Scholar]
- Fairphone. Social Assessment Program—December 2013; Fairphone: Amsterdam, The Netherlands, 2013. Available online: http://www.fairphone.com/ (accessed on 7 January 2014).
- BBC. Intel vows to stop using “conflict minerals” in new chips. BBC News, 7 January 2014. [Google Scholar]
- O’Rourke, D. The science of sustainable supply chains. Science 2014, 344, 1124–1127. [Google Scholar]
- Baland, J.M.; Duprez, C. Are labels effective against child labor? J. Public Econ. 2009, 93, 1125–1130. [Google Scholar] [CrossRef]
- Busse, M. Do Labor Standards Affect Comparative Advantage in Developing Countries? World Dev. 2002, 30, 1921–1932. [Google Scholar] [CrossRef]
- Chakrabarty, S.; Grote, U. Child Labor in Carpet Weaving: Impact of Social Labeling in India and Nepal. World Dev. 2009, 37, 1683–1693. [Google Scholar]
- Fung, A. Can We Put an End to Sweatshops? New Democracy Forum Series; Beacon Press: Boston, MA, USA, 2001. [Google Scholar]
- Phillips, N.; Sakamoto, L. Global Production Networks, Chronic Poverty and “Slave Labour” in Brazil. Stud. Comp. Int. Dev. 2012, 47, 287–315. [Google Scholar]
- Polaski, S. Combining global and local forces: The case of labor rights in Cambodia. World Dev. 2006, 34, 919–932. [Google Scholar] [CrossRef]
- ILO. Accelerating Action against Child Labour: Global Report Under the Follow-Up to the ILO Declaration on Fundamental Principles and Rights at Work: Report of the Director-General; International Labour Organization: Geneva, Switzerland, 2010. [Google Scholar]
- ILO LABORSTA—Database on Labour Statistics. Available online: http://laborsta.ilo.org/ (accessed on 7 January 2013).
- ILO. Global Employment Trends 2014: Risk of a Jobless Recovery? International Labor Organization: Geneva, Switzerland, 2014. [Google Scholar]
- Contreras, S. Child labor participation, human capital accumulation, and economic development. J. Macroecon. 2008, 30, 499–512. [Google Scholar] [CrossRef]
- Davies, R.B.; Voy, A. The effect of FDI on child labor. J. Dev. Econ. 2009, 88, 59–66. [Google Scholar] [CrossRef]
- Neumayer, E.; de Soysa, I. Trade Openness, Foreign Direct Investment and Child Labor. World Dev. 2005, 33, 43–63. [Google Scholar]
- Ranjan, P. An economic analysis of child labor. Econ. Lett. 1999, 64, 99–105. [Google Scholar]
- Ranjan, P. Credit constraints and the phenomenon of child labor. J. Dev. Econ. 2001, 64, 81–102. [Google Scholar] [CrossRef]
- Thorbecke, E.; Nissanke, M. Introduction: The impact of globalization on the world’s poor. World Dev. 2006, 34, 1333–1337. [Google Scholar]
- Wade, R.H. Is Globalization Reducing Poverty and Inequality? World Dev. 2004, 32, 567–589. [Google Scholar]
- Basu, K. Globalization, poverty, and inequality: What is the relationship? What can be done? World Dev. 2006, 34, 1361–1373. [Google Scholar]
- Ravallion, M. Looking beyond averages in the trade and poverty debate. World Dev. 2006, 34, 1374–1392. [Google Scholar] [CrossRef]
- Basu, K.; Zarghamee, H. Is product boycott a good idea for controlling child labor? A theoretical investigation. J. Dev. Econ. 2009, 88, 217–220. [Google Scholar] [CrossRef]
- Swaminathan, M. Economic growth and the persistence of child labor: Evidence from an Indian city. World Dev. 1998, 26, 1513–1528. [Google Scholar]
- Fisher, E.O. Introduction to Heckscher–Ohlin theory: A modern approach. Int. Rev. Econ. Financ. 2011, 20, 129–130. [Google Scholar]
- Ruffin, R.J. A note on the Heckscher-Ohlin theorem. J. Int. Econ. 1977, 7, 403–405. [Google Scholar] [CrossRef]
- Nishioka, S. R&D, trade in intermediate inputs, and the comparative advantage of advanced countries. J. Jpn. Int. Econ. 2013, 30, 96–110. [Google Scholar]
- Reimer, J.J. The domestic content of imports and the foreign content of exports. Int. Rev. Econ. Finance 2011, 20, 173–184. [Google Scholar] [CrossRef]
- Alsamawi, A.; Murray, J.; Lenzen, M. The Employment Footprints of Nations: Uncovering Master-Servant Relationships. J. Ind. Ecol. 2014, 18, 59–70. [Google Scholar] [CrossRef]
- Simas, M.; Wood, R.; Hertwich, E. Labor Embodied in Trade: The Role of Labor and Energy Productivity and Implications for Greenhouse Gas Emissions. J. Ind. Ecol. 2014, in press. [Google Scholar]
- U.S. DOL. List of Goods Produced by Child Labor or Forced Labor 2012—Report Required by the Trafficking Victims Protection Reauthorization Act of 2005; U.S. Department of Labor: Washington, DC, USA, 2012. [Google Scholar]
- Bales, K.; David, F.; Datta, M.; Grono, N. The Global Slavery Index 2013; The Walk Free Foundation: Perth, Australia, 2013. [Google Scholar]
- Made in a Free World the Slavery Footprint. Available online: http://slaveryfootprint.org/ (accessed on 7 March 2014).
- Tukker, A.; Dietzenbacher, E. Global multiregional input–output frameworks: An introduction and outlook. Econ. Syst. Res. 2013, 25, 1–19. [Google Scholar]
- Concha-Barrientos, M.; Nelson, D.I.; Fingerhut, M.; Driscoll, T.; Leigh, J. The global burden due to occupational injury. Am. J. Ind. Med. 2005, 48, 470–481. [Google Scholar] [CrossRef]
- Nelson, D.I.; Concha-Barrientos, M.; Driscoll, T.; Steenland, K.; Fingerhut, M.; Punnett, L.; Prüss-Ustün, A.; Leigh, J.; Corvalan, C. The global burden of selected occupational diseases and injury risks: Methodology and summary. Am. J. Ind. Med. 2005, 48, 400–418. [Google Scholar] [CrossRef]
- Lopez, A.D.; Mathers, C.D.; Ezzati, M.; Jamison, D.T.; Murray, C.J. Global and regional burden of disease and risk factors, 2001: Systematic analysis of population health data. Lancet 2006, 367, 1747–1757. [Google Scholar] [CrossRef]
- Murray, C.J.; Lopez, A.D. The Global Burden of Disease: A Comprehensive Assessment of Mortality and Disability from Diseases, Injuries, and Risk Factors in 1990 and Projected to 2020; Global Burden of Disease and Injury Series; Harvard University Press: Cambridge, MA, USA, 1996. [Google Scholar]
- OECD. STAN Indicators Database Rev. 3, 2011; Organisation for Co-operation and Development, 2011. Available online: http://www.oecd-ilibrary.org/industry-and-services/data/stan-oecd-structural-analysis-statistics/stan-indicators_data-00561-en (accessed on 7 January 2013).
- Concha-Barrientos, M.; Nelson, D.I.; Driscoll, T.; Steenland, K.; Punnett, L.; Fingerhut, M.; Prüss-Ustün, A.; Leigh, J.; Tak, S.; Corvalan, C. Selected occupational risk factors. In Comparative Quantification of Health Risks: Global and Regional Burden of Disease Attributable to Selected Major Risk Factors; World Health Organization: Geneva, Switzerland, 2004. [Google Scholar]
- European Commission. Work and Health in the EU: A Statistical Portrait, Data 1994–2002Theme 3—Population and Social Conditions, 2003 ed.; Office for Official Publications of the European Communities: Luxembourg, Luxembourg, 2004. [Google Scholar]
- ILO. International Standard Classification of Occupations: ISCO-08; ILO: Geneva, Switzerland, 2012. [Google Scholar]
- UNESCO. International Standard classification of Education ISCED 2011; UNESCO Institute for Statistics: Montreal, PQ, Canada, 2012. [Google Scholar]
- ILO. ILO Global Estimate of Forced Labour: Results and Methodology; International Labour Office: Geneva, Switzerland, 2012. [Google Scholar]
- ILO. Guide to the Millennium Development Goals Employment Indicators, 2nd ed.; International Labour Office, Employment Sector: Geneva, Switzerland, 2013. [Google Scholar]
- Bales, K.; Trodd, Z. Addressing Contemporary Forms of Slavery in EU External Policy; European Parliament—Directorate-General for External Policies of the Union: Brussels, Belgium, 2013. [Google Scholar]
- Tukker, A.; de Koning, A.; Wood, R.; Hawkins, T.; Lutter, S.; Acosta, J.; Rueda Cantuche, J.M.; Bouwmeester, M.; Oosterhaven, J.; Drosdowski, T.; et al. Exiopol—Development and illustrative analyses of a detailed global MR EE SUT/IOT. Econ. Syst. Res. 2013, 25, 50–70. [Google Scholar] [CrossRef]
- Tukker, A.; Bulavskaya, T.; Giljum, S.; de Koning, A.; Lutter, S.; Simas, M.; Stadler, K.; Wood, R. The Global Resource Footprint of Nations: Carbon, Water, Land and Materials Embodied in Trade and Final Consumption Calculated with EXIOBASE 2.1; The Netherlands Organisation for Applied Scientific Research; Leiden University’ Vienna University of Economics and Business; Norwegian University of Science and Technology: Leiden, The Netherlands; Delft/Vienna, Austria; Trondheim, Norway, 2014. [Google Scholar]
- Peters, G.; Hertwich, E. Production Factors and Pollution Embodied in Trade: Theoretical Development; Industrial Ecology Programme, Norwegian University of Science and Technology (NTNU): Trondheim, Norway, 2004. [Google Scholar]
- Miller, R.E.; Blair, P.D. Input-Output Analysis: Foundations and Extensions, 2nd ed.; Cambridge University Press: Cambridge, UK & New York, NY, USA, 2009. [Google Scholar]
- The World Bank World Development Indicators. Available online: http://data.worldbank.org/ (accessed on 20 July 2014).
- Datta, M.N.; Bales, K. Slavery in Europe: Part 1, Estimating the Dark Figure. Hum. Rights Q. 2013, 35, 817–829. [Google Scholar]
- Dillon, A.; Bardasi, E.; Beegle, K.; Serneels, P. Explaining variation in child labor statistics. J. Dev. Econ. 2012, 98, 136–147. [Google Scholar] [CrossRef]
- Alvarez, R.; Lopez, R.A. Exporting and performance: Evidence from Chilean plants. Can. J. Econ. Can. Econ. 2005, 38, 1384–1400. [Google Scholar]
- Lai, H.; Zhu, S.C. Technology, endowments, and the factor content of bilateral trade. J. Int. Econ. 2007, 71, 389–409. [Google Scholar]
- Timmer, M.P.; Los, B.; Stehrer, R.; de Vries, G.J. Fragmentation, incomes and jobs: An analysis of European competitiveness. Econ. Policy 2013, 28, 613–661. [Google Scholar] [CrossRef]
- Andrew, R.; Peters, G.P.; Lennox, J. Approximation and regional aggregation in multi-regional input–output analysis for national carbon footprint accounting. Econ. Syst. Res. 2009, 21, 311–335. [Google Scholar]
- Bouwmeester, M.C.; Oosterhaven, J. Specification and Aggregation Errors in Environmentally Extended Input–Output Models. Environ. Resour. Econ. 2013, 56, 307–335. [Google Scholar]
- Stadler, K.; Steen-Olsen, K.; Wood, R. The “Rest of the World”—Estimating the economic structure of missing regions in global MRIO tables. Econ. Syst. Res. 2014, 26, 303–326. [Google Scholar]
- Su, B.; Ang, B.W. Input-output analysis of CO2 emissions embodied in trade: The effects of spatial aggregation. Ecol. Econ. 2010, 70, 10–18. [Google Scholar]
- Xu, Y.; Dietzenbacher, E. Does the Rest of the World Matter? A Sensitivity Analysis with the WIOD Tables (Sensitivity of Model Results with Respect to Data Availability). In Proceedings of the 19th International Input-Output Conference, Alexandria, VI, USA, 13 June–7 July 2011.
- IBGE. Censo Agropecuário 2006 [Agricultural Census 2006]; Instituto Brasileiro de Geografia e Estatística [Brazilian Institute of Geography and Statistics]: Brasilia, 2007. Available online: http://www.ibge.gov.br/ (accessed on 4 June 2014).
- Salami, A.; Kamara, A.B.; Brixiova, Z. Smallholder Agriculture in East Africa: Trends, Constraints and Opportunities; African Development Bank: Tunis, Tunisia, 2010. [Google Scholar]
- Statistics South Africa. Quarterly Labour Force Survey, Quarter 4, 2013; Statistics South Africa: Pretoria, South Africa, 2014. [Google Scholar]
- Bussolo, M.; de Hoyos, R.; Medvedev, D. Free Trade in Agriculture and Global Poverty. World Econ. 2011, 34, 2019–2043. [Google Scholar]
- Edmonds, E.V.; Pavcnik, N. Child Labor in the Global Economy. J. Econ. Perspect. 2005, 19, 199–220. [Google Scholar]
- Webbink, E.; Smits, J.; de Jong, E. Hidden Child Labor: Determinants of Housework and Family Business Work of Children in 16 Developing Countries. World Dev. 2012, 40, 631–642. [Google Scholar] [CrossRef]
© 2014 by the authors; licensee MDPI, Basel, Switzerland. This article is an open access article distributed under the terms and conditions of the Creative Commons Attribution license (http://creativecommons.org/licenses/by/4.0/).
Share and Cite
Simas, M.S.; Golsteijn, L.; Huijbregts, M.A.J.; Wood, R.; Hertwich, E.G. The “Bad Labor” Footprint: Quantifying the Social Impacts of Globalization. Sustainability 2014, 6, 7514-7540. https://doi.org/10.3390/su6117514
Simas MS, Golsteijn L, Huijbregts MAJ, Wood R, Hertwich EG. The “Bad Labor” Footprint: Quantifying the Social Impacts of Globalization. Sustainability. 2014; 6(11):7514-7540. https://doi.org/10.3390/su6117514
Chicago/Turabian StyleSimas, Moana S., Laura Golsteijn, Mark A. J. Huijbregts, Richard Wood, and Edgar G. Hertwich. 2014. "The “Bad Labor” Footprint: Quantifying the Social Impacts of Globalization" Sustainability 6, no. 11: 7514-7540. https://doi.org/10.3390/su6117514
APA StyleSimas, M. S., Golsteijn, L., Huijbregts, M. A. J., Wood, R., & Hertwich, E. G. (2014). The “Bad Labor” Footprint: Quantifying the Social Impacts of Globalization. Sustainability, 6(11), 7514-7540. https://doi.org/10.3390/su6117514