Article

Influence of Strong Diurnal Variations in Sewage Quality on the Performance of Biological Denitrification in Small Community Wastewater Treatment Plants (WWTPs)

Department of Science and High Technology, Insubria University, Via G.B. Vico 46, Varese I-21100, Italy
*
Author to whom correspondence should be addressed.
Sustainability 2013, 5(9), 3679-3689; https://doi.org/10.3390/su5093679
Submission received: 10 July 2013 / Revised: 11 August 2013 / Accepted: 19 August 2013 / Published: 28 August 2013

Abstract

:
The great diurnal variation in the quality of wastewater of small communities is an obstacle to the efficient removal of high nitrogen with traditional activated sludge processes provided by pre-denitrification. To verify this problem, the authors developed a pilot plant, in which the domestic wastewater of community of 15,000 inhabitants was treated. The results demonstrate that average and peak nitrogen removal efficiencies of over 60% and 70%, respectively, are difficult to obtain because of the strong variations in the BOD5/NO3-N ratios and the unexpected abnormal accumulation of dissolved oxygen during denitrification when the BOD5 load is low. These phenomena cause inhibitory effects and BOD5 deficiency in the denitrification process. The results demonstrate the need for a more complex approach to designing and managing small wastewater treatment plants (WWTPs) provided with denitrification than those usually adopted for medium- and large-size plants.

1. Introduction

The influence of variations in sewage quality on the WWTP performance of biological processes has been studied since the 70s. Of particular interest are [1], which shows how to upgrade plants in order to achieve fluctuation control, and [2], in which more cautious design criteria are recommended for WWTPs serving small communities. With specific reference to the effects on biological denitrification, the scientific literature provides abundant information on nitrogen removal [3,4,5,6,7], but rarely refers to small WWTPs. The effects of raw sewage C/N ratio variations in small community WWTPs are highlighted in [8,9,10], which also show the possible negative side effects of dissolved oxygen accumulation in the denitrification stage. In addition, in 2006, in a Life project, the EU emphasized the effects of sharp fluctuations in the quality of raw sewage on the efficiency of biological processes [11].
There are several studies concerning new technologies for improving existing WWTPs [12,13,14,15,16]. However, the choice of the appropriate upgrading strategy first needs to focus on the causes of the poor efficiency of WWTPs. Such a general concept has specific relevance for the denitrification applied to small community sewage treatments [17,18]. In fact, the raw sewage of small communities is characterized by great variations in flow rates and quality, which affect the entire treatment. This is particularly significant for biological denitrification, where the typical removal efficiency achieved in medium-large activated sludge plants without primary sedimentation (about 90%) is very difficult to obtain. We found denitrification yields of 60%–80% in several operating plants serving 5,000–20,000 inhabitants.
An inadequate nitrogen removal efficiency (as well as other nutrients and micropollutants [19,20,21,22]) can impact negatively on sensitive river bodies (e.g., the Po river in northern Italy), thus compromising water pollution reduction policies and related risk communication campaigns addressed at the population [23,24].
This paper deals with the influence of the great diurnal variation in sewage quality on the denitrification performance of a WWTP serving a community of 15,000 inhabitants in the Po river basin. An experimental study on a pilot plant was carried out, monitoring both influent and effluent main parameters through both daytime single and continuous samplings.

2. Materials and Methods

2.1. Pilot Plant Description

The study was based on the use of an activated sludge pilot plant (Figure 1) with biological pre-denitrification (DEN), an oxidation-nitrification (OX-NIT) stage and a final sedimentation (SED). Raw sewage pre-treatments are based on screening as well as grit and fat removal, followed by an aeration chamber. Aeration of DEN and OX-NIT stages are guaranteed, respectively, by four slow vertical-axis mixers (power input: 11 W·m−3) and a micro-bubble aeration system.
Figure 1. Pilot plant layout.
Sustainability 05 03679 g001
The features of the pilot plant are:
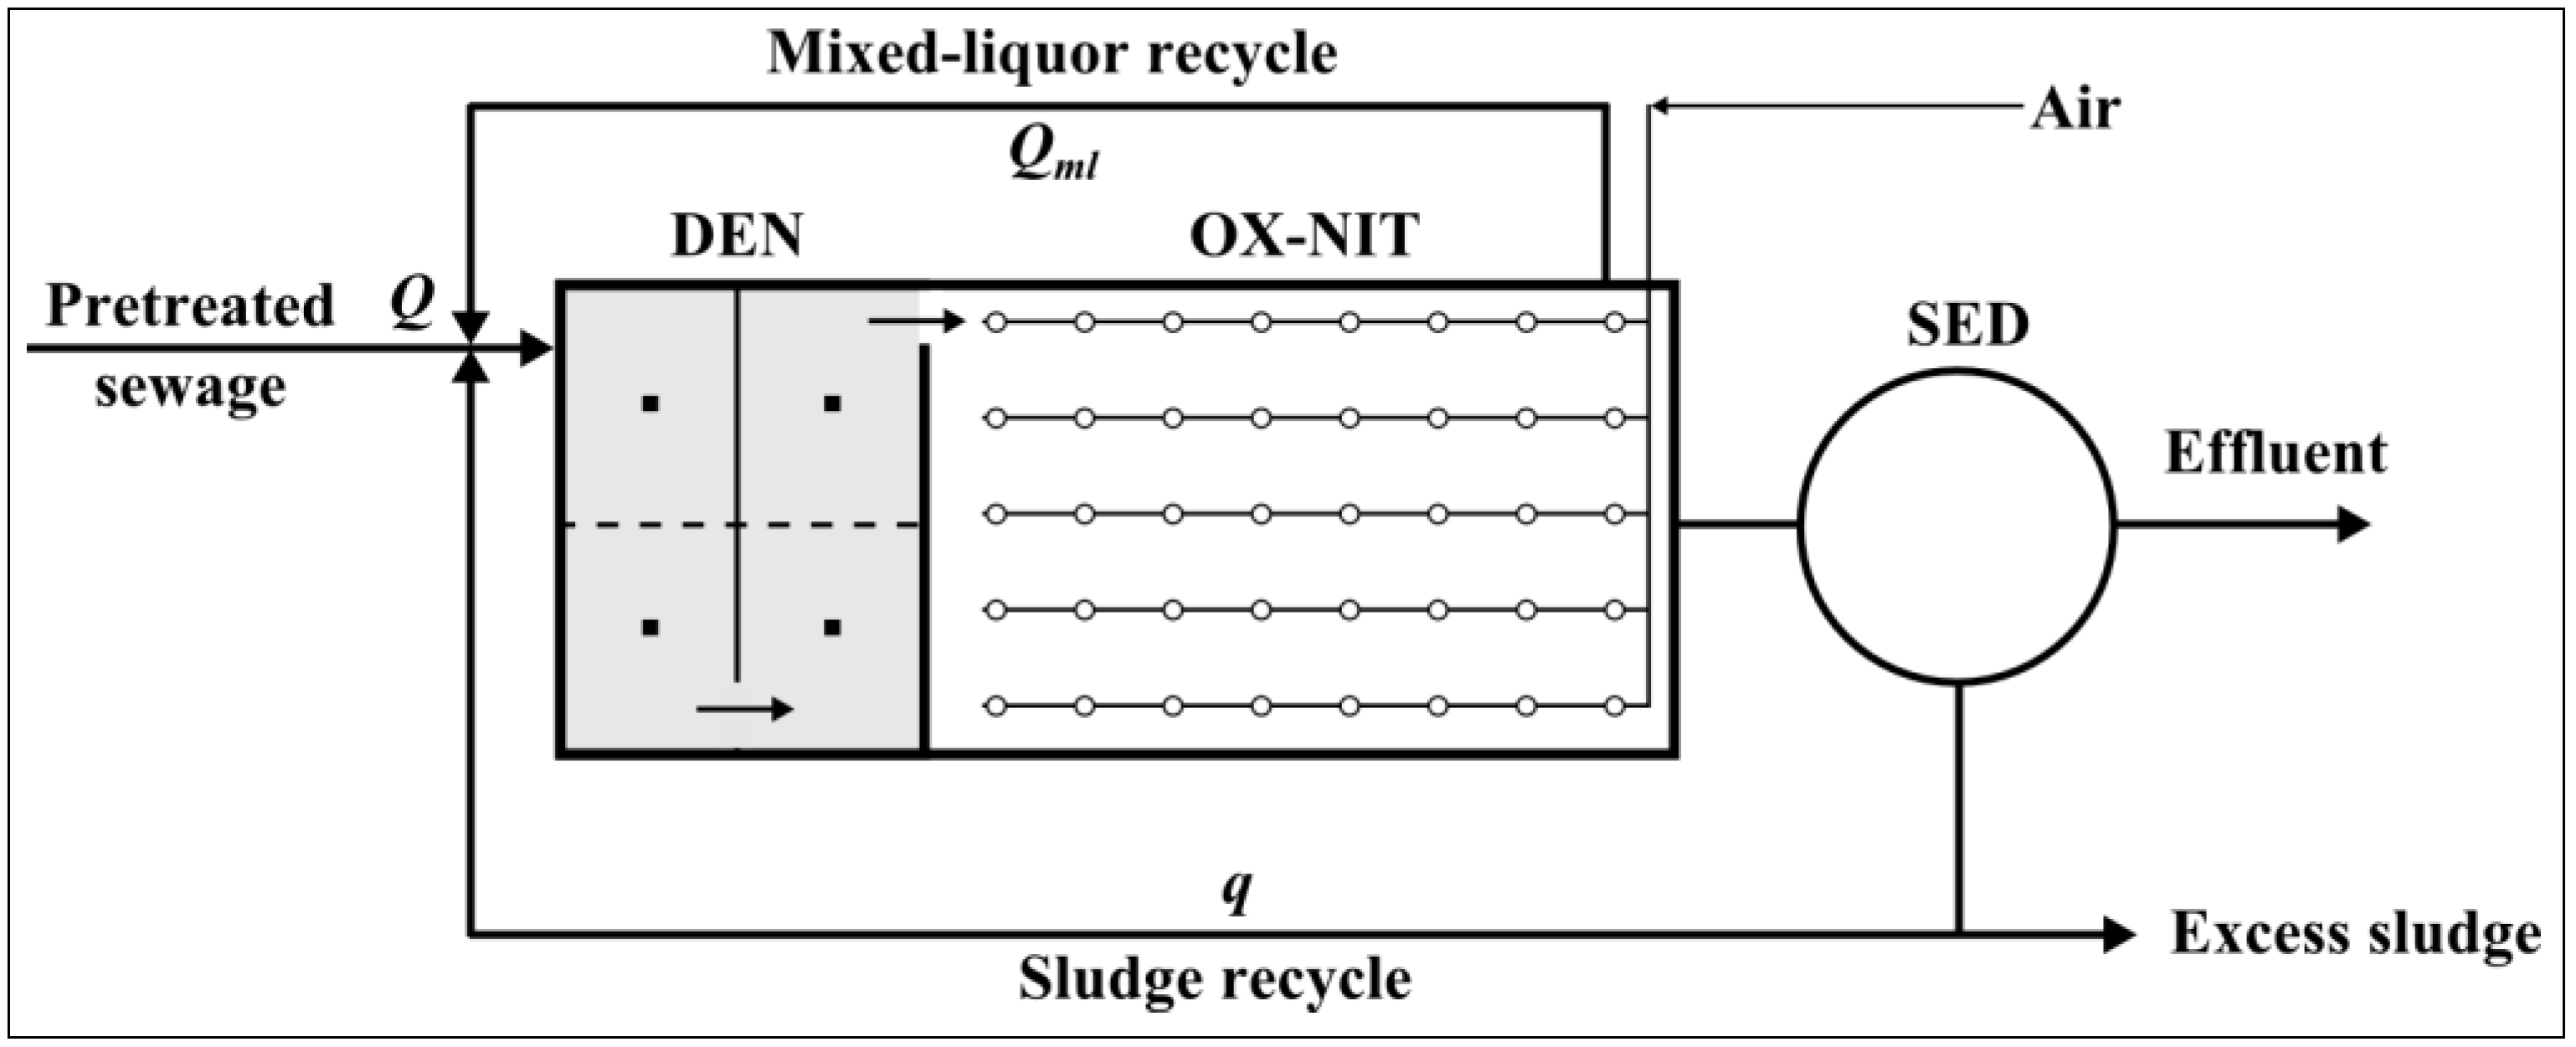
  • Pre-denitrification (DEN) tank: volume 10 m3; liquid height 1.8 m;
  • Biological oxidation-nitrification (OX-NIT) tank: volume 20 m3; liquid height 1.8 m;
  • Final sedimentation (SED): diameter 2 m; volume 6 m3;
  • Sewage flow rate, Q = 1.5 m3·h−1;
  • Mixed-liquor recycle rate, Qml = 4 Q = 6 m3·h−1;
  • Sludge recycle rate, q = Q = 1.5 m3·h−1.

2.2. Pilot Plant Operating Conditions and Testing Methods

2.2.1. Operating Conditions and Samplings

The pilot plant ran for a continuous period of seven months, providing operating controls and analysis for 90 days consecutively under the operating conditions listed in Table 1.
Table 1. Operating conditions.
ParameterUnitValue
Overall biological process (DEN + OX-NIT) sludge loadkg BOD5·d−1·kg−1 VSS0.068
kg BOD5·d−1·kg−1 SS0.043
Denitrification (DEN) load kg BOD5·d−1·kg−1 VSS0.204
kg BOD5·d−1·kg−1 SS0.129
DEN retention time (for the whole inlet flowrate, Q + q + Qml)h1.11
OX-NIT retention time (for the whole inlet flowrate, Q + q + Qml)h2.22
DEN + OX-NIT retention time (for the whole inlet flowrate, Q + q + Qml)h3.33
Mixed-liquor temperature °C15
The average mixed liquor solid concentration and the VSS/SS ratio were, respectively, 2.2 kg VSS·m−3 and 0.63.
In order to assess the effects of quality variations in daytime raw sewage on the denitrification efficiency, two types of sampling were performed:
  • Automatic daily average samplings of the raw wastewater and the treated effluent;
  • Manual instantaneous samplings (at 8 AM, 12 AM and 4 PM respectively) at the input and the output of the denitrification reactor as well as on the treated effluent.
For each of the described locations, a total of 80 automatic and 360 manual samples were taken.
Half way through the study, a supplemental carbon source (130 mg·L−1, as glucose solution) was added to the raw sewage in order to evaluate the effect of the increased BOD5/NO3-N ratio on the denitrification performance.

2.2.2. Testing Methods

PH, COD, BOD5 NO3-N, NH4-N, TN were sampled and analyzed following official Italian methods [25] while the mixed-liquor temperature of , dissolved oxygen in DEN and in OX-NIT stages, SS and VSS in the mixed-liquor as well as sludge volume index were analyzed with standard methods [7].

3. Results and Discussion

3.1. Raw Sewage Quality

3.1.1. Mean Values

Mean and standard deviations of the raw sewage main parameters (COD, BOD5 and TN = TKN) are listed in Table 2.
Table 2. COD, BOD5 and TN concentrations (means and standard deviations) of the raw sewage (subscript: in) and the treated effluent (subscript: out).
ParameterUnitSampling time (1)
Daily average8.00 AM12.00 AM4.00 PM
CODin[mg·L−1]226.589.9372.7324.6
σ ± 60.1σ ± 21.3σ ± 135.2σ ± 74.6
CODout[mg·L−1]40.538.038.838.8
σ ± 18.9σ ± 19.1σ ± 19.8σ ± 19.6
BOD5 in[mg·L−1]125.039.9208.3187.7
σ ± 45.0σ ± 13.1σ ± 72.0σ ± 37.4
BOD5 out[mg·L−1]4.94.54.14.6
σ ± 1.7σ ± 1.6σ ± 1.6σ ± 1.7
TNin = TKNin[mg·L−1]27.718.035.624.5
σ ± 5.4σ ± 3.6σ ± 7.9σ ± 5.2
TNout (*)[mg·L−1]11.09.89.610.6
σ ± 2.7σ ± 2.1σ ± 1.7σ ± 2.6
(1) Mean and standard deviation of 40 samples for each parameter.* All NO3-N because TKN detected in the effluent is always less than 0.5 mg·L−1.
The results show a “low strength” influent, with a mean BOD5 = 125 mg·L−1, COD = 226.5 mg·L−1 and TN = TKN = 27.8 mg·L−1.
The BOD5/TKN ratio of 4.5 is almost 10% less than the value normally expected in Italian sewage (5) [5,18,26]. The value can be explained by the presence of several old houses with septic tanks that are connected to the sewage system. The incidence of these units on sewage quality may be more, or less, significant with respect to the type (septic tanks with one or more chambers), size and maintenance criteria. When these septic tanks work normally, a BOD5 and suspended solids reduction of about 10% and 40% is reasonable [27]. In contrast, the reduction in TKN should, in practice, be considered as zero because the nitrogen subtracted from the settled solids is then released as NH4+ by the sediment fermentation. The release takes place by enzymatic hydrolysis, at a rate of 0.02–0.06 mg NH4-N·mg−1 COD [27].
Moreover, these septic tanks explain the very low mean value of the COD/BOD5 ratio (only 1.81).

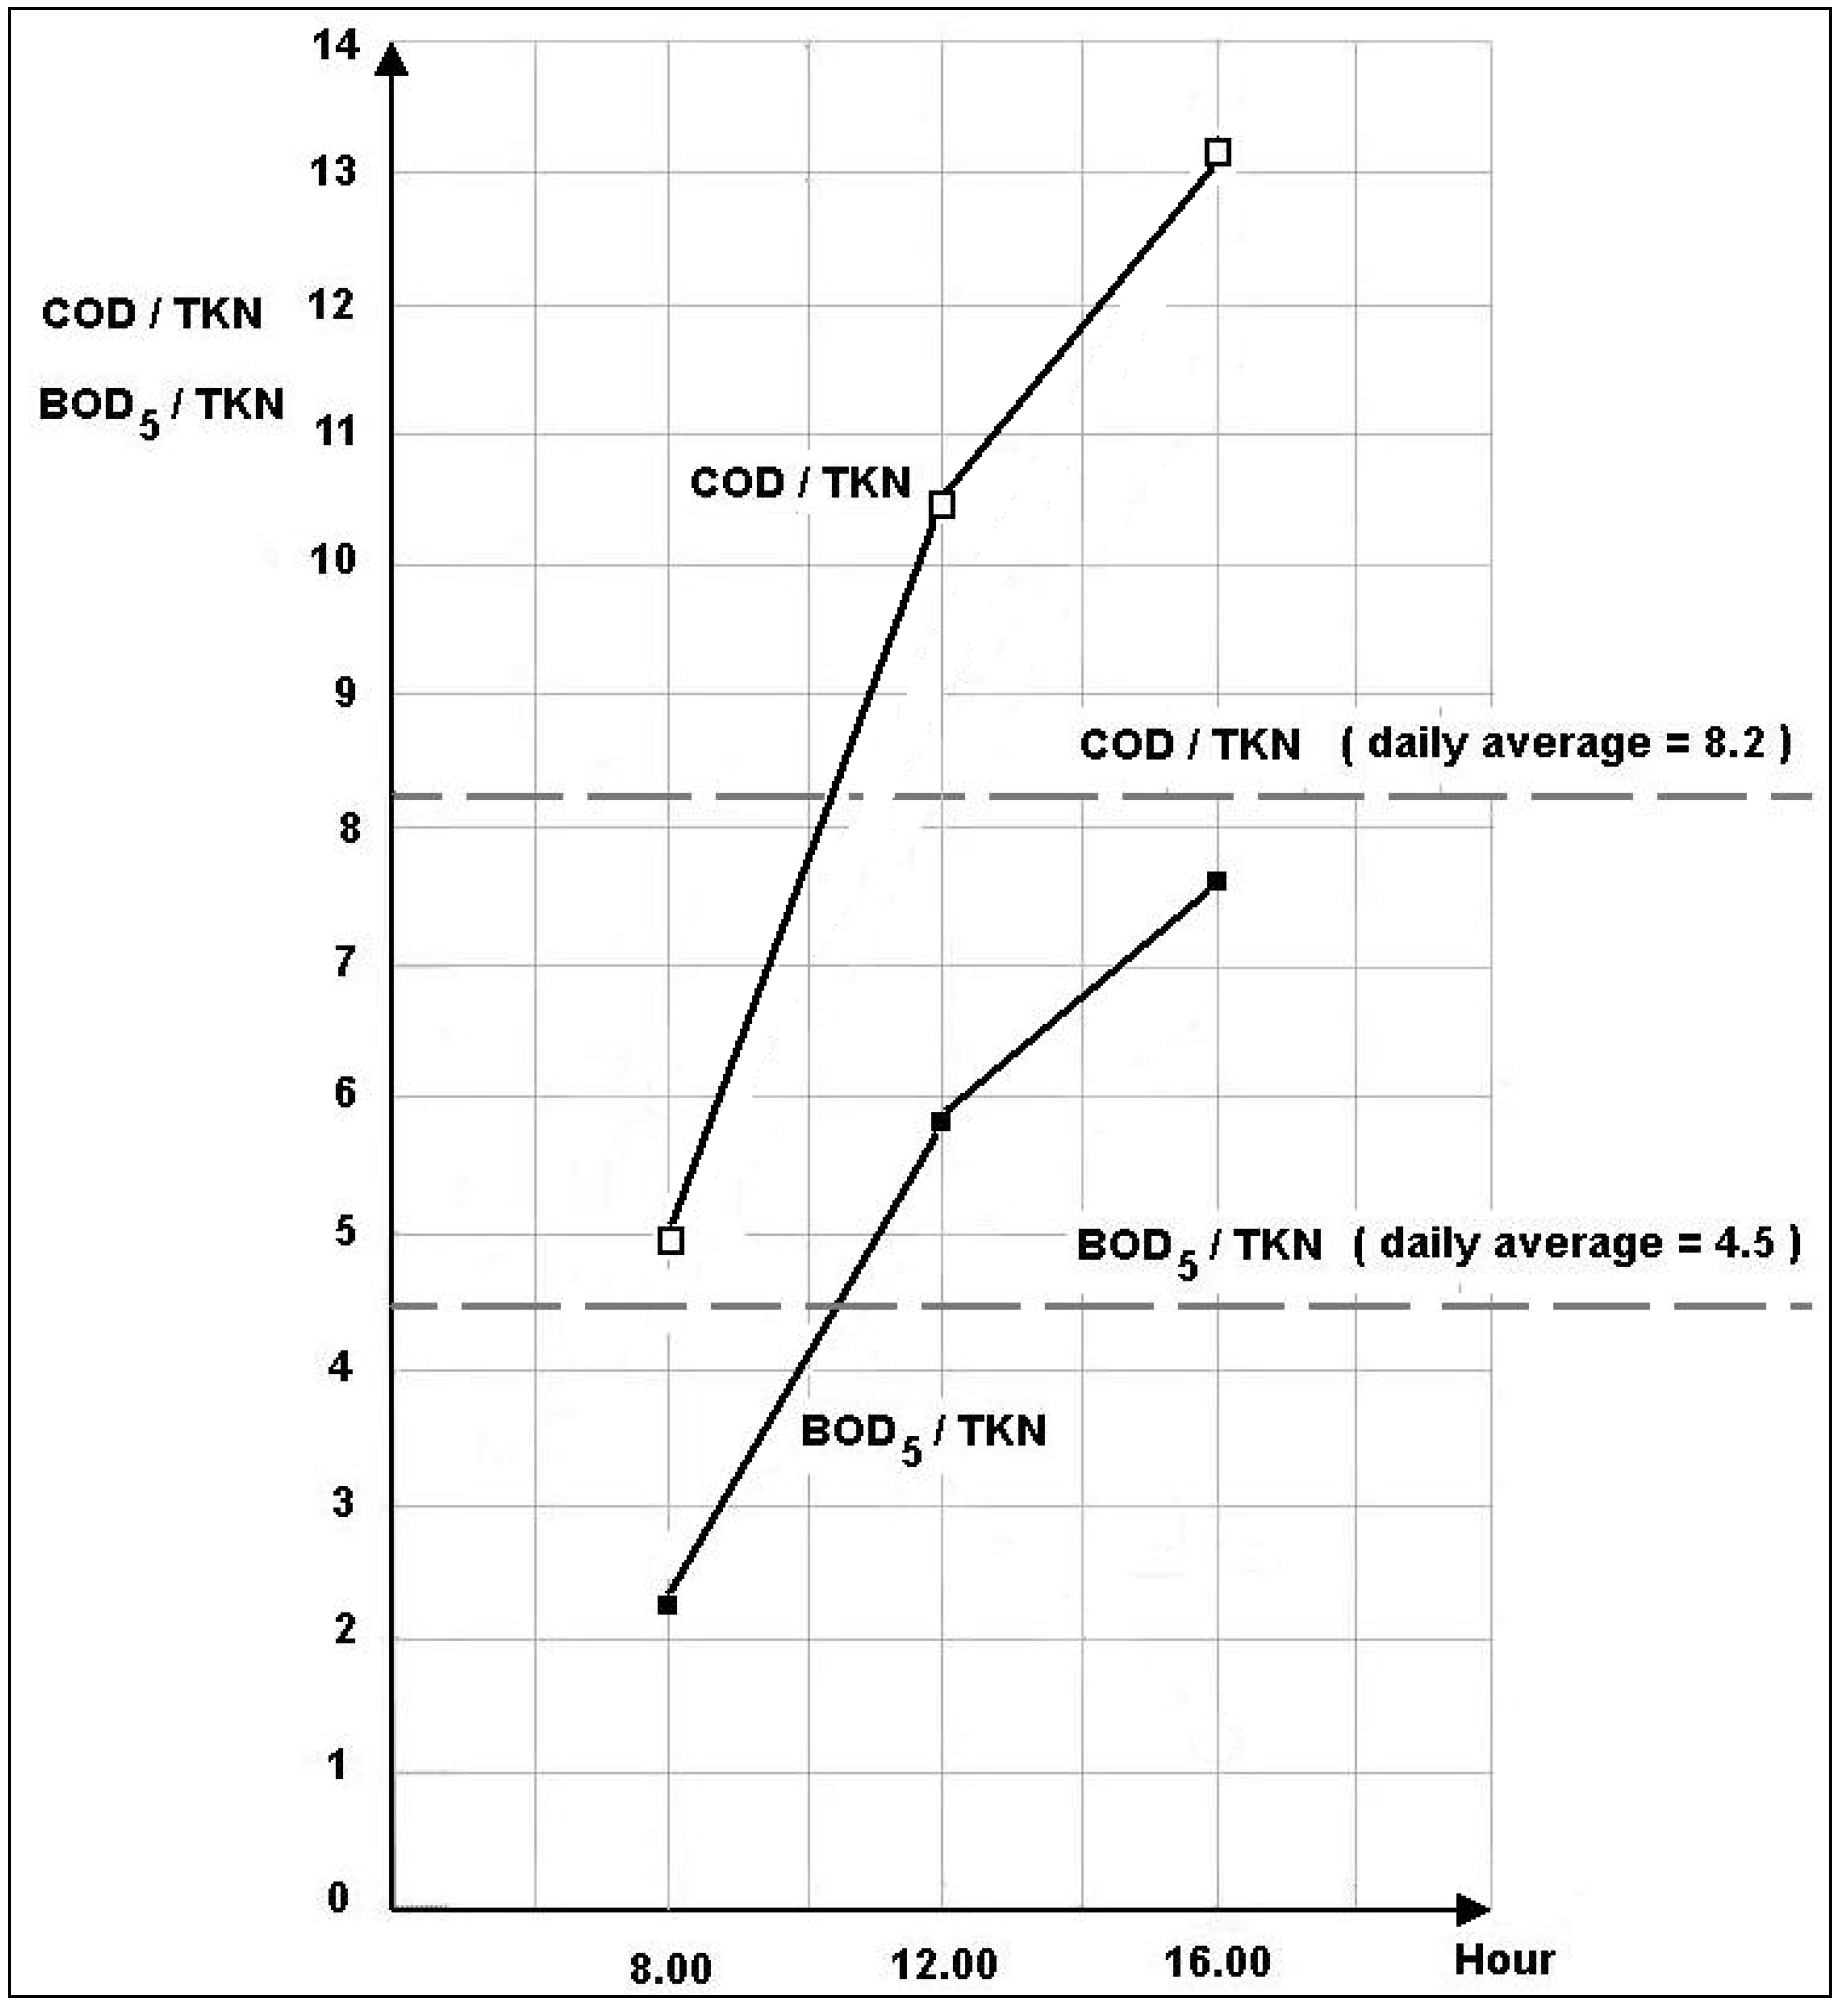
3.1.2. Daytime Variations

Table 2 shows large variations, throughout the day, of the organic parameters (COD and BOD5) in terms of the daily average values. COD and BOD5 peaks (occurring at 12.00 AM) are, respectively, 64.5% and 66.6% greater than the daily average values. In contrast, minimum values (occurring at 8 AM) in the COD and BOD5 are, respectively, 60.3% and 68.1% less than the daily average values. Such variations are smaller for the TN parameter.
Figure 2 shows the trends of both the mean COD/TKN and BOD5/TKN ratios.
Figure 2. Trends of day-time mean COD/TKN and BOD5/TKN ratios in the raw sewage.
Sustainability 05 03679 g002
The lowest values occur at 8.00 AM (4.99 and 2.21, respectively), while more than fourfold higher values occur at 12.00 AM (10.47; 5.85) and 4.00 PM (13.25; 7.66).

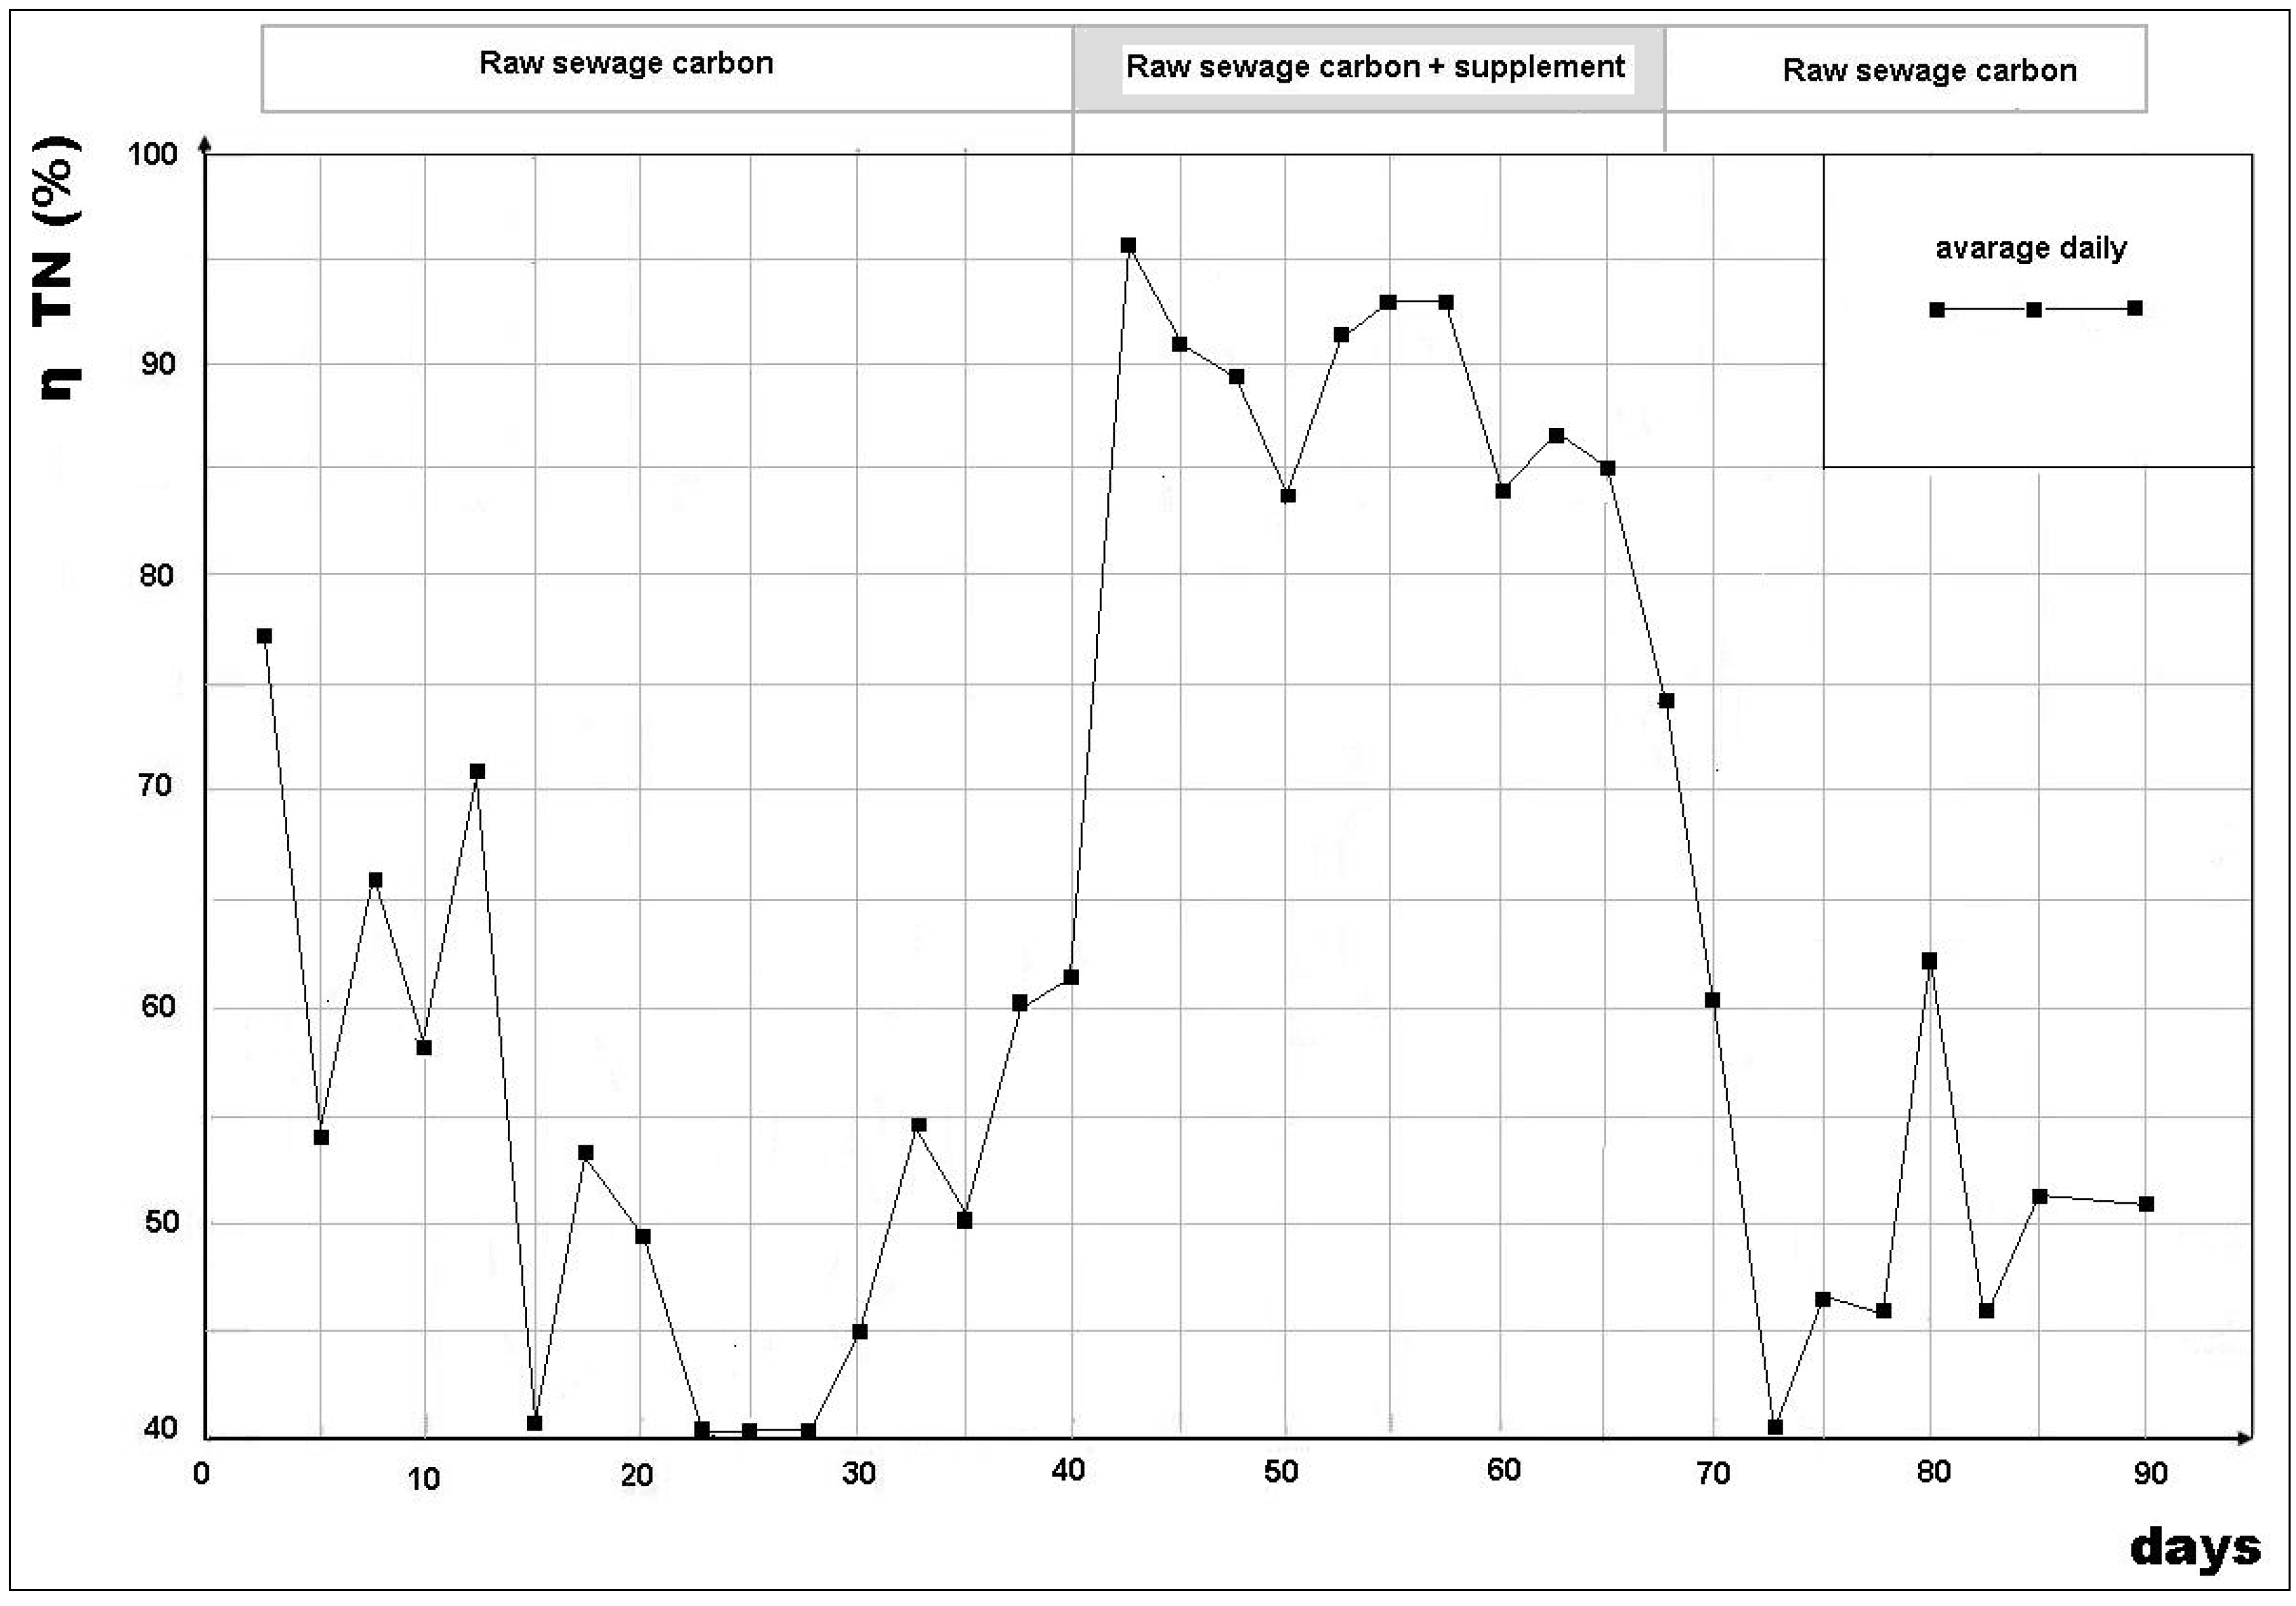
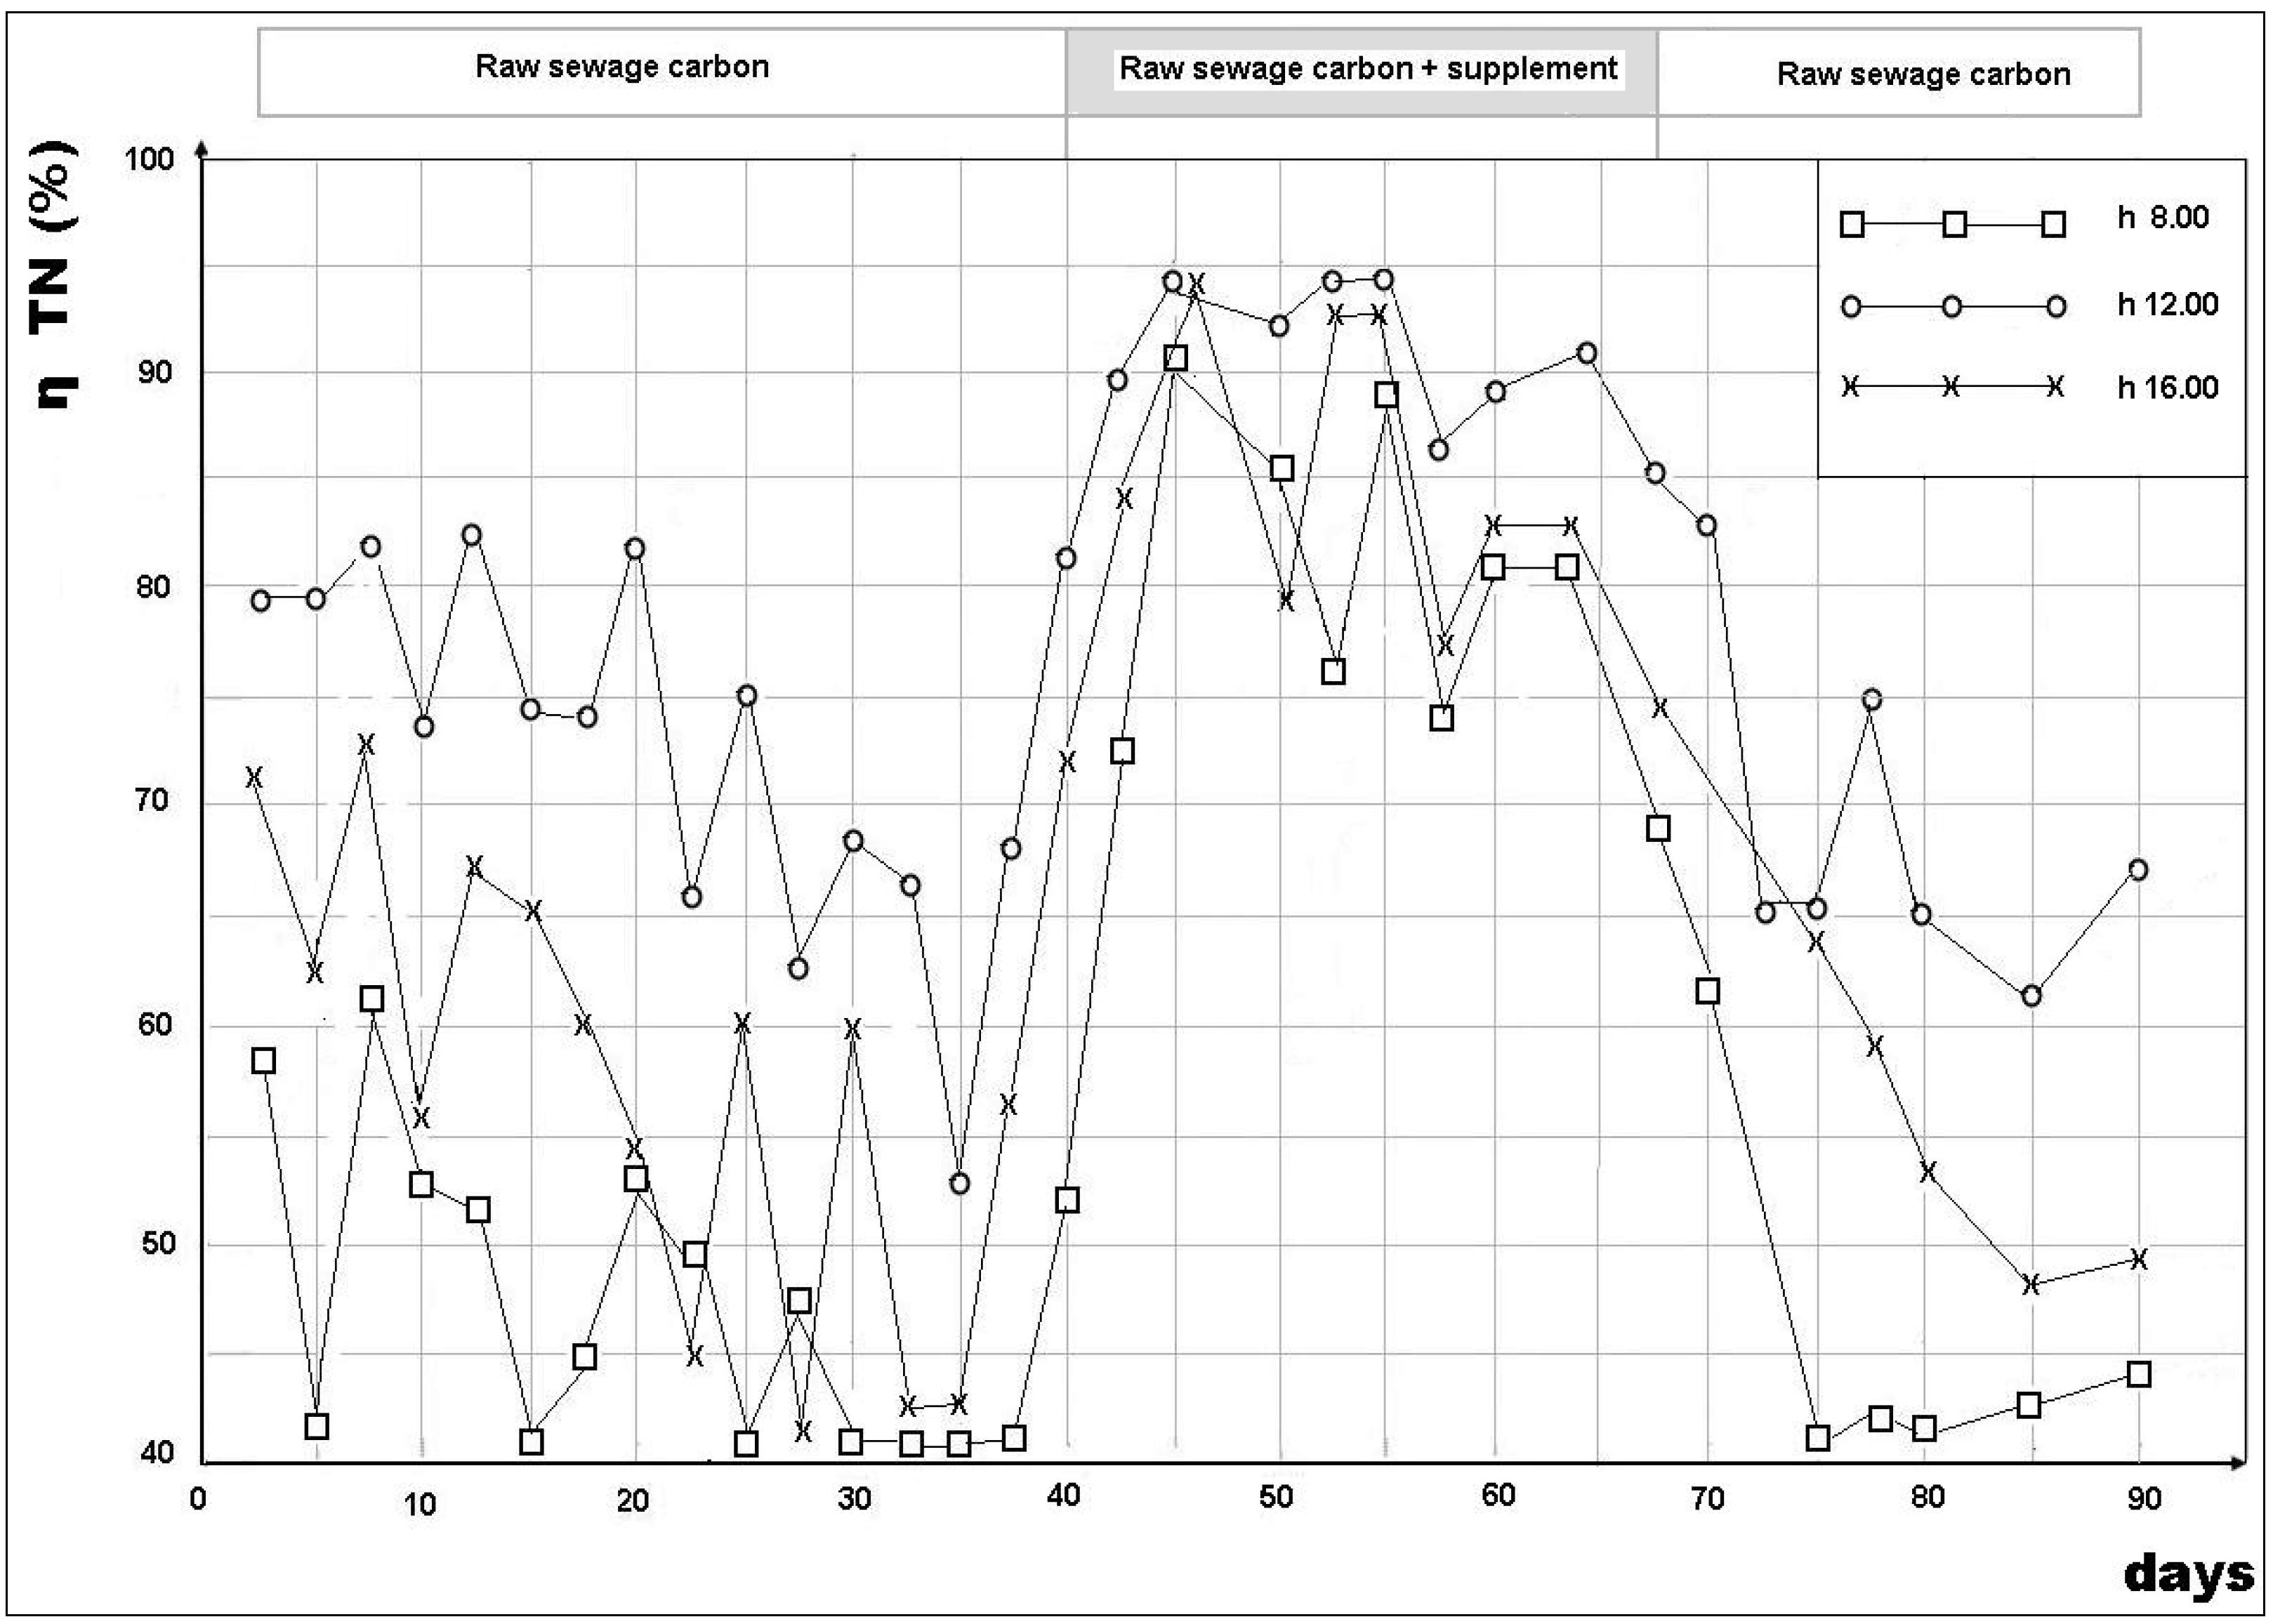
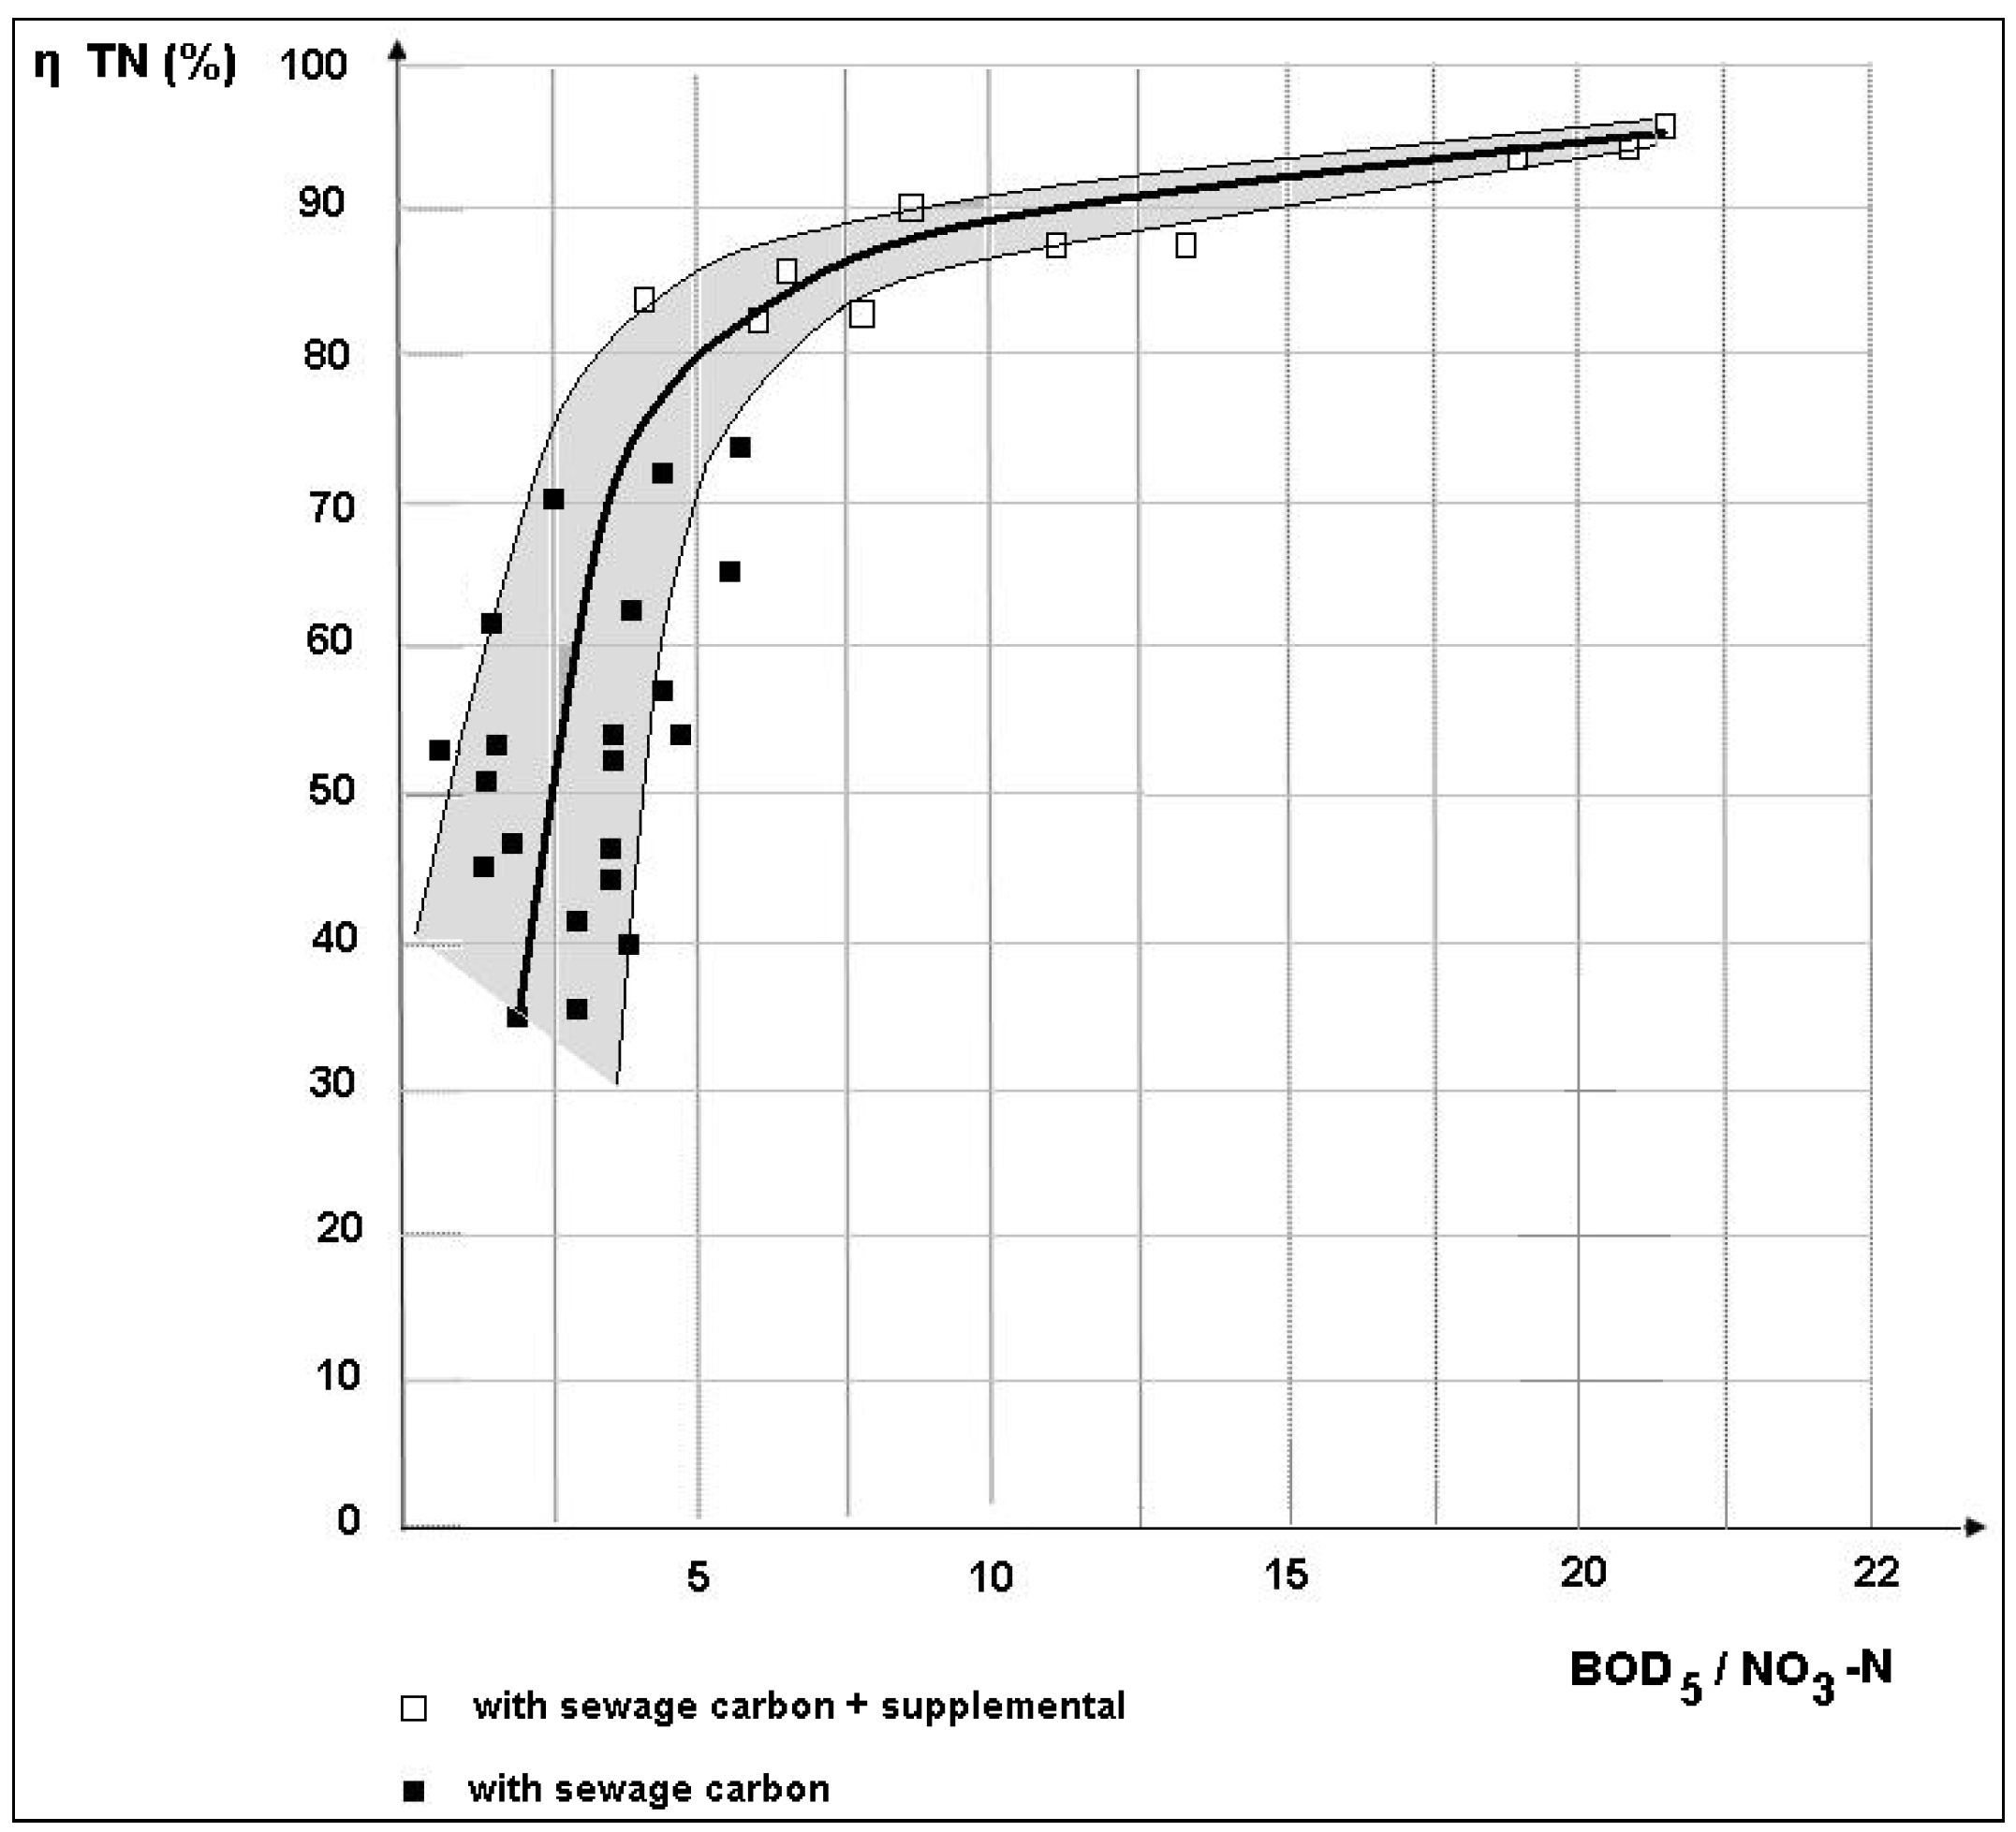
3.2. Removal Efficiency

The data listed in Table 2 demonstrate that the efficiency in reducing COD and BOD5 is very high, but the average removal efficiency for TN is only 60.2%.
There are no significant variations in the quality of the effluent during the day for TN because of the buffer effect of the OX-NIT volume. Under the operating conditions (listed in Table 1), a biological denitrification efficiency, ηTN, above 90% was theoretically expected (as has been the general rule since the 70s [28,29,30,31]).
It is important to highlight that the denitrification efficiency is related to the daytime BOD5 trend and not to the BOD5/TKN ratio. Indeed, what is relevant for biological denitrification is the BOD5/NO3-N ratio achieved inside the anoxic reactor. This is influenced by the BOD5 load, associated with the raw sewage, and the NO3-N loads, conveyed in the denitrification tank by the sludge recycle as well as the mixed-liquor recycle. The optimal value for this ratio for domestic sewage is 4 [32]. In this specific case:
  • Daily mean BOD5/NO3-N = 3.78 (40 samples);
  • 8.00 AM BOD5/NO3-N = 1.35 (40 samples);
  • 12.00 AM BOD5/NO3-N = 7.2 (40 samples);
  • 4.00 PM BOD5/NO3-N = 5.9 (40 samples).
In practice, at the beginning of the day, the availability of carbon for denitrification is too low (the same should be for the nighttime period), but becomes very high over the course of the day, with a peak value at 12.00 AM.
This situation is reflected in the biological denitrification efficiency. Figure 3 shows the trend of the mean daily efficiency over a 90-day period. The center of the curve represents the point when a supplemental carbon source was added to verify the effects on the efficiency of the rise in BOD. The amount of supplemental carbon added was such that it would increase the BOD5 by 75 mg·L−1. Without the supplemental carbon, the denitrification efficiency varied greatly, around a mean value of 60.2%, with peak of 77.5% and minimum value of 40%. When the supplemental carbon was added, the efficiency was more stable, around a mean value of 90% (peak of 96%).
Figure 3. Trend in the mean daily denitrification efficiency.
Sustainability 05 03679 g003
Figure 4 shows a similar trend in the denitrification efficiency, but evaluated at different times of the day (8.00 AM, 12.00 AM, 4.00 PM) comparing the input and output of the denitrification stage alone. The manual samplings were taken from the whole flow rate entering the reactor (Q + q + Qml) and also at the exit, considering the short retention time. The parameter NO3-N was analyzed to evaluate the denitrification efficiency.
Also in this case, without the supplemental carbon, the trend in the curves appears to be a direct consequence of the BOD5/NO3-N ratio achieved in the denitrification reactor. It clearly shows a low efficiency at 8.00 AM, whereas considerably higher values were achieved at 12.00 AM and at 4.00 PM, which are, however, still insufficient. However, when the supplemental carbon was added, the efficiency rose dramatically, even to values close to 95% (12.00 AM).
Figure 4. Trend in denitrification efficiency during the day.
Sustainability 05 03679 g004
Figure 5 shows the trend in the biological denitrification efficiency as a function of the BOD5/NO3-N ratio with and without the addition of supplemental carbon. The figure clearly shows that it is possible to achieve a stable 90% efficiency (or greater), but only with the addition of supplemental carbon, and, in any case, with BOD5/NO3-N ratios greater than 6. Obviously, the results expressed by this efficiency curve are related to our specific study, and, in particular, to the adverse effects of the great variations in the quality of the raw sewage on the denitrification efficiency.
Figure 5. Denitrification efficiency, as a function of the BOD5/NO3-N ratio in the denitrification tank (mean value and confidence interval 95%).
Sustainability 05 03679 g005

3.3. Effect of Dissolved Oxygen in the Denitrification Reactor

During the study, concentrations of dissolved oxygen were found in the oxidation-nitrification tank in the range 1.5–7.0 mg·L−1, with lower values in the hours of greatest BOD5 load (middle of the day), and higher values at the beginning of the morning (and night time). These concentrations were also found in the mixed-liquor recycle in denitrification. Much lower concentrations were found in the sludge recycle (0.2–1.1 mg·L−1).
Significant concentrations of dissolved oxygen were also recorded in the denitrification reactor, with a mean concentration of 0.5 mg·L−1 and variations in the range 0.2–1.2 mg·L−1, over the course of the day. The highest values were found at 8.00 AM, and the lowest, at 12.00 AM. These concentrations are the result of the addition of oxygen by the recycles (in particular by the mixed-liquor) and the consumption by the BOD5 loads of the sewage.
These concentrations undoubtedly have a detrimental effect on the denitrification efficiency, because of the aerobic consumption of an amount of BOD5 and because of the inhibiting effect of the dissolved oxygen on the denitrification rate. According to the US-EPA [33], the denitrification rate is influenced by an inhibition factor represented as follows:
Sustainability 05 03679 i001
where:
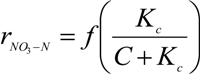
  • Kc = inhibition constant of dissolved oxygen (typical value: 0.02 mg·L−1)
  • C = concentration of dissolved oxygen in denitrification (mg·L−1).
The value of the constant Kc appears to be very restrictive, to the extent that it has a significant effect on the denitrification rate with concentrations of a little over 0.02 mg·L−1 of dissolved oxygen. In practice, DO inhibition on denitrification was shown with a DO concentration of 0.2 mg·L−1 [34]. We are currently completing a study on the effects of iron (II) addition in the denitrification tank for both consuming dissolved oxygen, through oxidation, and precipitating phosphorus as ferric-ortophosphate.

4. Conclusions

Large variations in the quality of raw sewage, which are typical of small communities, make high biological denitrification efficiencies (η ≥ 90%) hard to achieve. With a pre-denitrification pilot plant, fed by the sewage of a community of 15,000 inhabitants, an average efficiency of 60.2% was achieved, with isolated peaks of 75%. Essentially there were two factors that affected this result:
  • The great variability in the BOD5/NO3-N ratio in the denitrification reactor, such that, at certain times of the day, there was a strong shortage of BOD5 for denitrification (BOD5/NO3-N = 1.75, recorded, on average, in the early morning) and, at other times, an excess of BOD5 with respect to the availability of NO3-N (BOD5/NO3-N = 7.2 achieved, on average, in the middle of the day);
  • The considerable accumulation of oxygen in denitrification, mainly in the periods of lower BOD5 input at the beginning of the day and at night time (peak values of 1.2 mg·L−1) which induced inhibitory effects on the denitrification rate, which were significant at concentrations over 0.2 mg·L−1.
In this specific case, there was a third factor: the presence of septic tanks in many old houses that were connected to the sewerage, which led to a reduction in the BOD5/TKN sewage ratio, estimated at about 10%.
We found that by adding supplemental carbon, it was possible to overcome the difficulties encountered, and to achieve denitrification efficiencies of over 90%.
A practical solution could be to use an equalization tank before treatment, but exploiting a simultaneous denitrification process might also be effective. In addition, it is important to minimize the presence of dissolved oxygen in the reactor mainly through the control of dissolved oxygen in the mixed-liquor recycle.
We believe that our results also demonstrate the need for a more complex and structured approach to both the design and operation of small WWTPs provided with denitrification than those usually adopted for medium and large plants.

Conflicts of Interest

The authors declare no conflict of interest.

References

  1. United States Environmental Protection Agency, Process Design Manual for Upgrading Existing Wastewater Treatment Plant; Water Resource Center: Jefferson, MO, USA, 1974.
  2. United States Environmental Protection Agency, Wastewater Treatment Facilities for Sewered Small Communities—Process Design Manual; Water Resource Center: Jefferson, MO, USA, 1977.
  3. United States Environmental Protection Agency, Process Design Manual for Nitrogen Control; Water Resource Center: Jefferson, MO, USA, 1975.
  4. United States Environmental Protection Agency, Manual: Nitrogen Control; Water Resource Center: Jefferson, MO, USA, 1993.
  5. Cadmus Group, Nutrient Control Design Manual: State of Technology Review Report; The Cadmus Group, Inc.: Watertown, MA, USA; p. 2009.
  6. Cadmus Group, Nutrient Control Design Manual; The Cadmus Group, Inc.: Watertown, MA, USA, 2010.
  7. Tchobanoglous, F.L.; Burton, H.D.; Stensel, H.D. Wastewater Engineering: Treatment and Reuse, 4th ed.; Metcalf & Eddy, Inc., Ed.; McGraw-Hill Professional: New York, NY, USA, 2003. [Google Scholar]
  8. Urbini, G. Advanced biological treatments for small communities. In Proceedings of the conference on WWTP for sewered small communities, Capri, Italy, 22–23 October 1992.
  9. Watanabe, Y.; Matsuda, S.; Ishiguro, M. Simultaneous nitrification and denitrification in micro-aerobic biofilms. Wat. Sci. Tech. 1992, 26, 511–522. [Google Scholar] [CrossRef]
  10. Yang, P.Y.; Zhang, Z. Nitrification and denitrification in the wastewater treatment system. In Proceedings of the UNESCO—University of Tsukuba International Seminar on Traditional Technology for Environmental Conservation and Sustainable Development in the Asian-Pacific Region, Tsukuba Science City, Japan, 11–14 December 1995.
  11. Wastewater treatment improvement and efficiency in small communities. Available online: http://www.wise-rtd.info/en/info/waste-water-treatment-improvement-and-efficiency-small-communities/ (accessed on 10 July 2013).
  12. Gernaey, K.V.; van Loosdrecht, M.C.M.; Henze, M.; Lind, M.; Jørgensen, S. Activated sludge wastewater treatment plant modelling and simulation: State of the art. Environ. Modell. Softw. 2004, 19, 763–783. [Google Scholar] [CrossRef]
  13. Joss, A.; Siegrist, H.; Ternes, T.A. Are we about to upgrade wastewater treatment for removing organic micropollutants? Water Sci. Technol. 2008, 57, 251–255. [Google Scholar] [CrossRef]
  14. Luciano, A.; Viotti, P.; Mancini, G.; Torretta, V. An integrated wastewater treatment system using a BAS reactor with biomass attached to tubular supports. J. Environ. Manage. 2012, 113, 51–60. [Google Scholar] [CrossRef] [Green Version]
  15. Hao, R.; Li, S.; Li, J.; Meng, C. Denitrification of simulated municipal wastewater treatment plant effluent using a three-dimensional biofilm-electrode reactor: Operating performance and bacterial community. Bioresource Technol. 2013, 143, 178–186. [Google Scholar] [CrossRef]
  16. Torti, E.; Sibilla, S.; Raboni, M. An Eulerian–Lagrangian method for the simulation of the oxygen concentration dissolved by a two-phase turbulent jet system. Comput. Struct 2013, in press. [Google Scholar]
  17. Ye, F.; Li, Y. Enhancement of nitrogen removal in towery hybrid constructed wetland to treat domestic wastewater for small rural communities. Ecol. Eng. 2009, 35, 1043–1050. [Google Scholar] [CrossRef]
  18. Bonomo, L.; Pastorelli, G.; Zambon, N. Advantages and limitations of duckweed-based wastewater treatment systems. Water Sci. Technol. 1997, 35, 239–246. [Google Scholar]
  19. Pasquini, L.; Munoz, J.F.; Rimlinger, N.; Dauchy, X.; France, X.; Pons, M.N.; Görner, T. Assessment of the fate of some household in urban wastewater treatment plant micropollutants. Chem. Pap. 2013, 67, 601–612. [Google Scholar] [CrossRef]
  20. Torretta, V. PAHs in wastewater: Removal efficiency in a conventional wastewater treatment plant and comparison with model predictions. Environ. Technol. 2012, 33, 851–855. [Google Scholar] [CrossRef] [Green Version]
  21. Torretta, V.; Katsoyiannis, A. Occurrence of polycyclic aromatic hydrocarbons in sludges from different stages of a wastewater treatment plant in Italy. Environ. Technol. 2013, 34, 937–943. [Google Scholar] [CrossRef]
  22. Torretta, V.; Urbini, G.; Raboni, M.; Copelli, S.; Viotti, P.; Luciano, A.; Mancini, G. Effect of powdered activated carbon to reduce fouling in membrane bioreactors: A sustainable solution. Case study. Sustainability 2013, 5, 1501–1509. [Google Scholar] [CrossRef] [Green Version]
  23. Morris, M.W.; Su, S.K. Social psychological obstacles in environmental conflict resolution. Am. Behav. Sci. 1999, 42, 1322–1349. [Google Scholar] [CrossRef]
  24. Di Mauro, C.; Bouchon, S.; Torretta, V. Industrial risk in the Lombardy Region (Italy): What peopleperceive and what are the gaps to improve the risk communication and the partecipatory processes. Chem. Eng. Trans. 2012, 26, 297–302. [Google Scholar]
  25. IRSA-CNR. Available online: http://www.irsa.cnr.it/ShPage.php?lang=it&pag=metod/ (accessed on 10 July 2013).
  26. Lee, N.M.; Welander, T. The effect of different carbon sources on respiratory denitrification in biological wastewater treatment. J. Ferment. Bioeng. 1996, 82, 277–285. [Google Scholar] [CrossRef]
  27. Bonomo, L. Trattamento Delle Acque Reflue (Wastewater Treatment); McGraw Hill: Milan, Italy, 2008. [Google Scholar]
  28. Sutton, P.M.; Murphy, K.L.; Jank, B.E. Nitrogen control: A basis for design with activated sludges systems. In Proceedings of IAWPR Conference, Copenhagen, Denmark, 18–20 August 1975.
  29. Sutton, P.M.; Murphy, K.L.; Dawson, R.N. Low temperature biological denitrification of waste water. Water Pollut. Control Fed. 1975, 47, 122–134. [Google Scholar]
  30. Barnard, J.L. Biological denitrification. Water Pollut. Control 1975, 74, 178–186. [Google Scholar]
  31. Christensen, M.H.; Harremoes, P. A literature review of biological denitrification of sewage. In Proceedings of the International Nitrogen as a Water Pollutant, Copenhagen, Denmark, 18–20 August 1975.
  32. Rössle, W.H.; Pretorius, W.A. A review of characterization requirements for in-line prefermenters: Paper 1: Wastewater characterization. Water SA 2001, 27, 405–412. [Google Scholar]
  33. Cadmus Group US-EPA, Nutrient Control Design Manual Environmental Protection Development; The Cadmus Group, Inc.: Watertown, MA, USA, 2010.
  34. Song, S.H.; Choi, S.S.; Park, K.; Yoo, Y.J. Novel hybrid immobilization of microorganisms and its applications to biological denitrification. Enzyme Microb. Tech. 2005, 37, 567–573. [Google Scholar] [CrossRef]

