Russian Olive (Elaeagnus angustifolia) Removal in the Western United States: Multi-Site Findings and Considerations for Future Research

Abstract
:1. Introduction
2. Methods
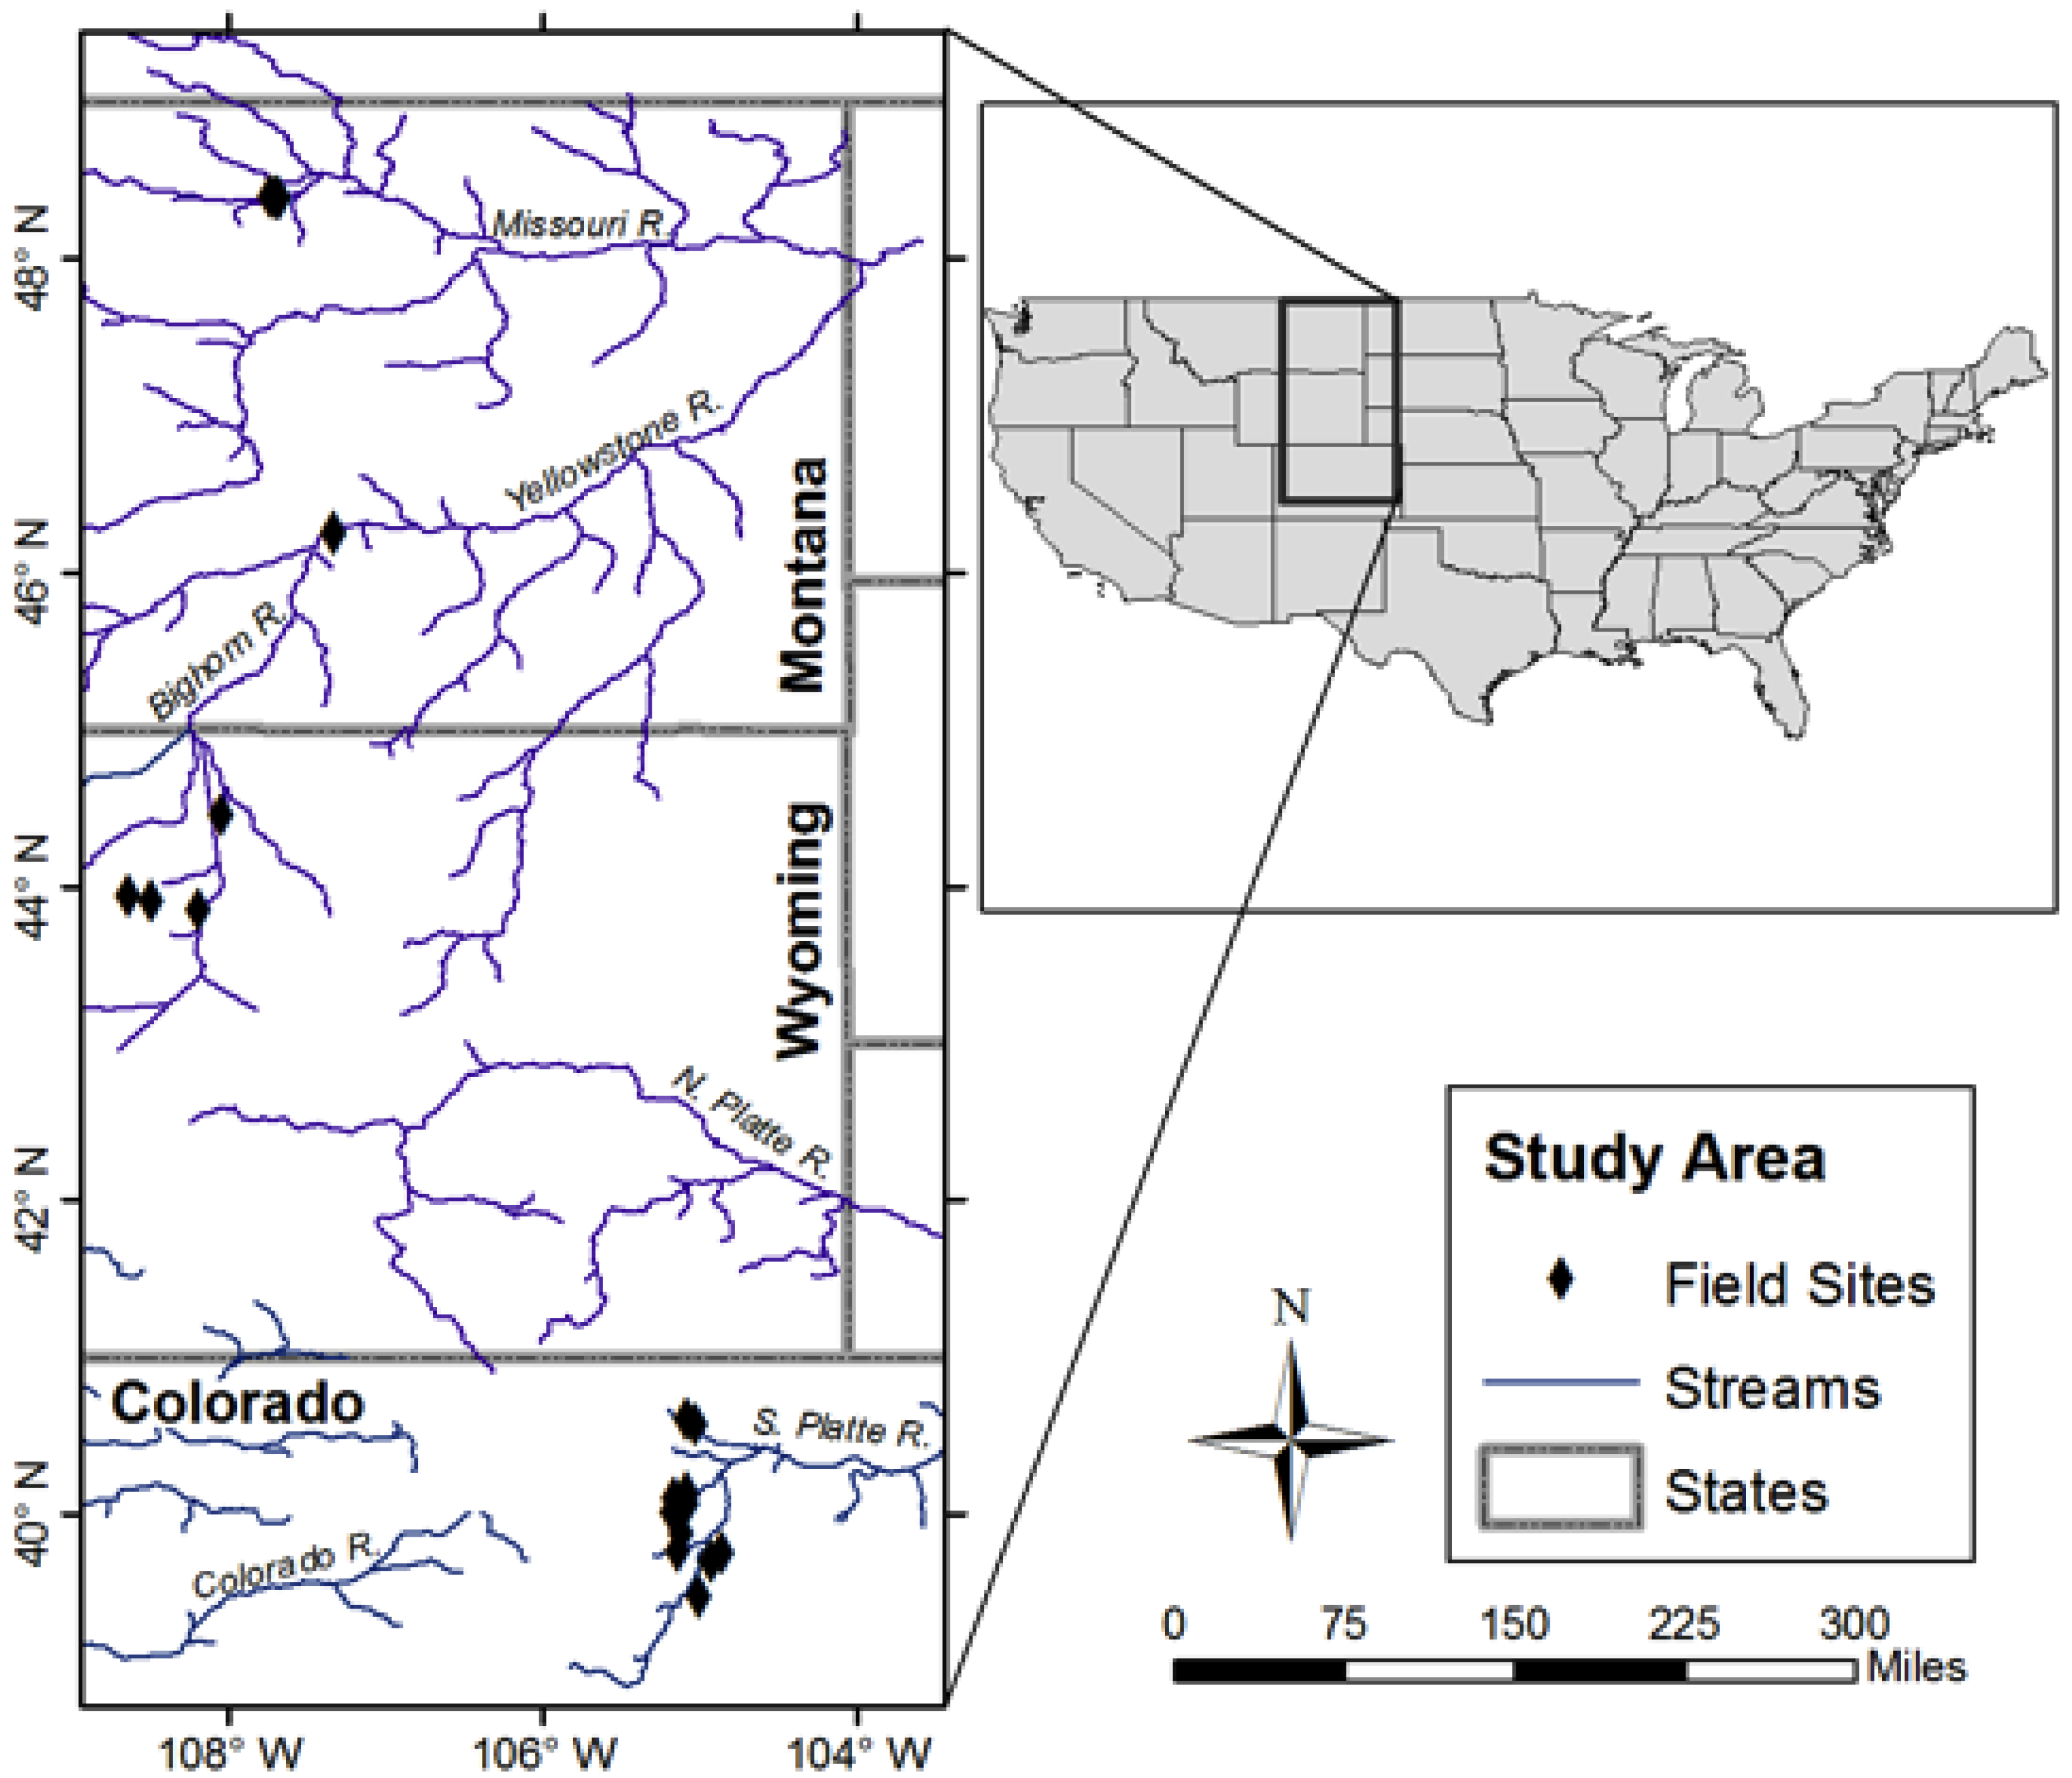
2.1. Site Selection
2.2. Data Collection

| Category | Data Collected |
|---|---|
| Geography | - Slope |
| Climate [27Error! Reference source not found.] | - Mean annual precipitation (in) |
| - Mean annual minimum temperature (F°) | |
| - Mean growing season maximum temperature (F°) | |
| Hydrology | - Distance from stream channel (m) |
| - Distance to permanent water (m) | |
| Soil | - electroconductivity (mmhos) |
| - Percent organic matter | |
| - Texture |
2.3. Data Analysis
3. Results
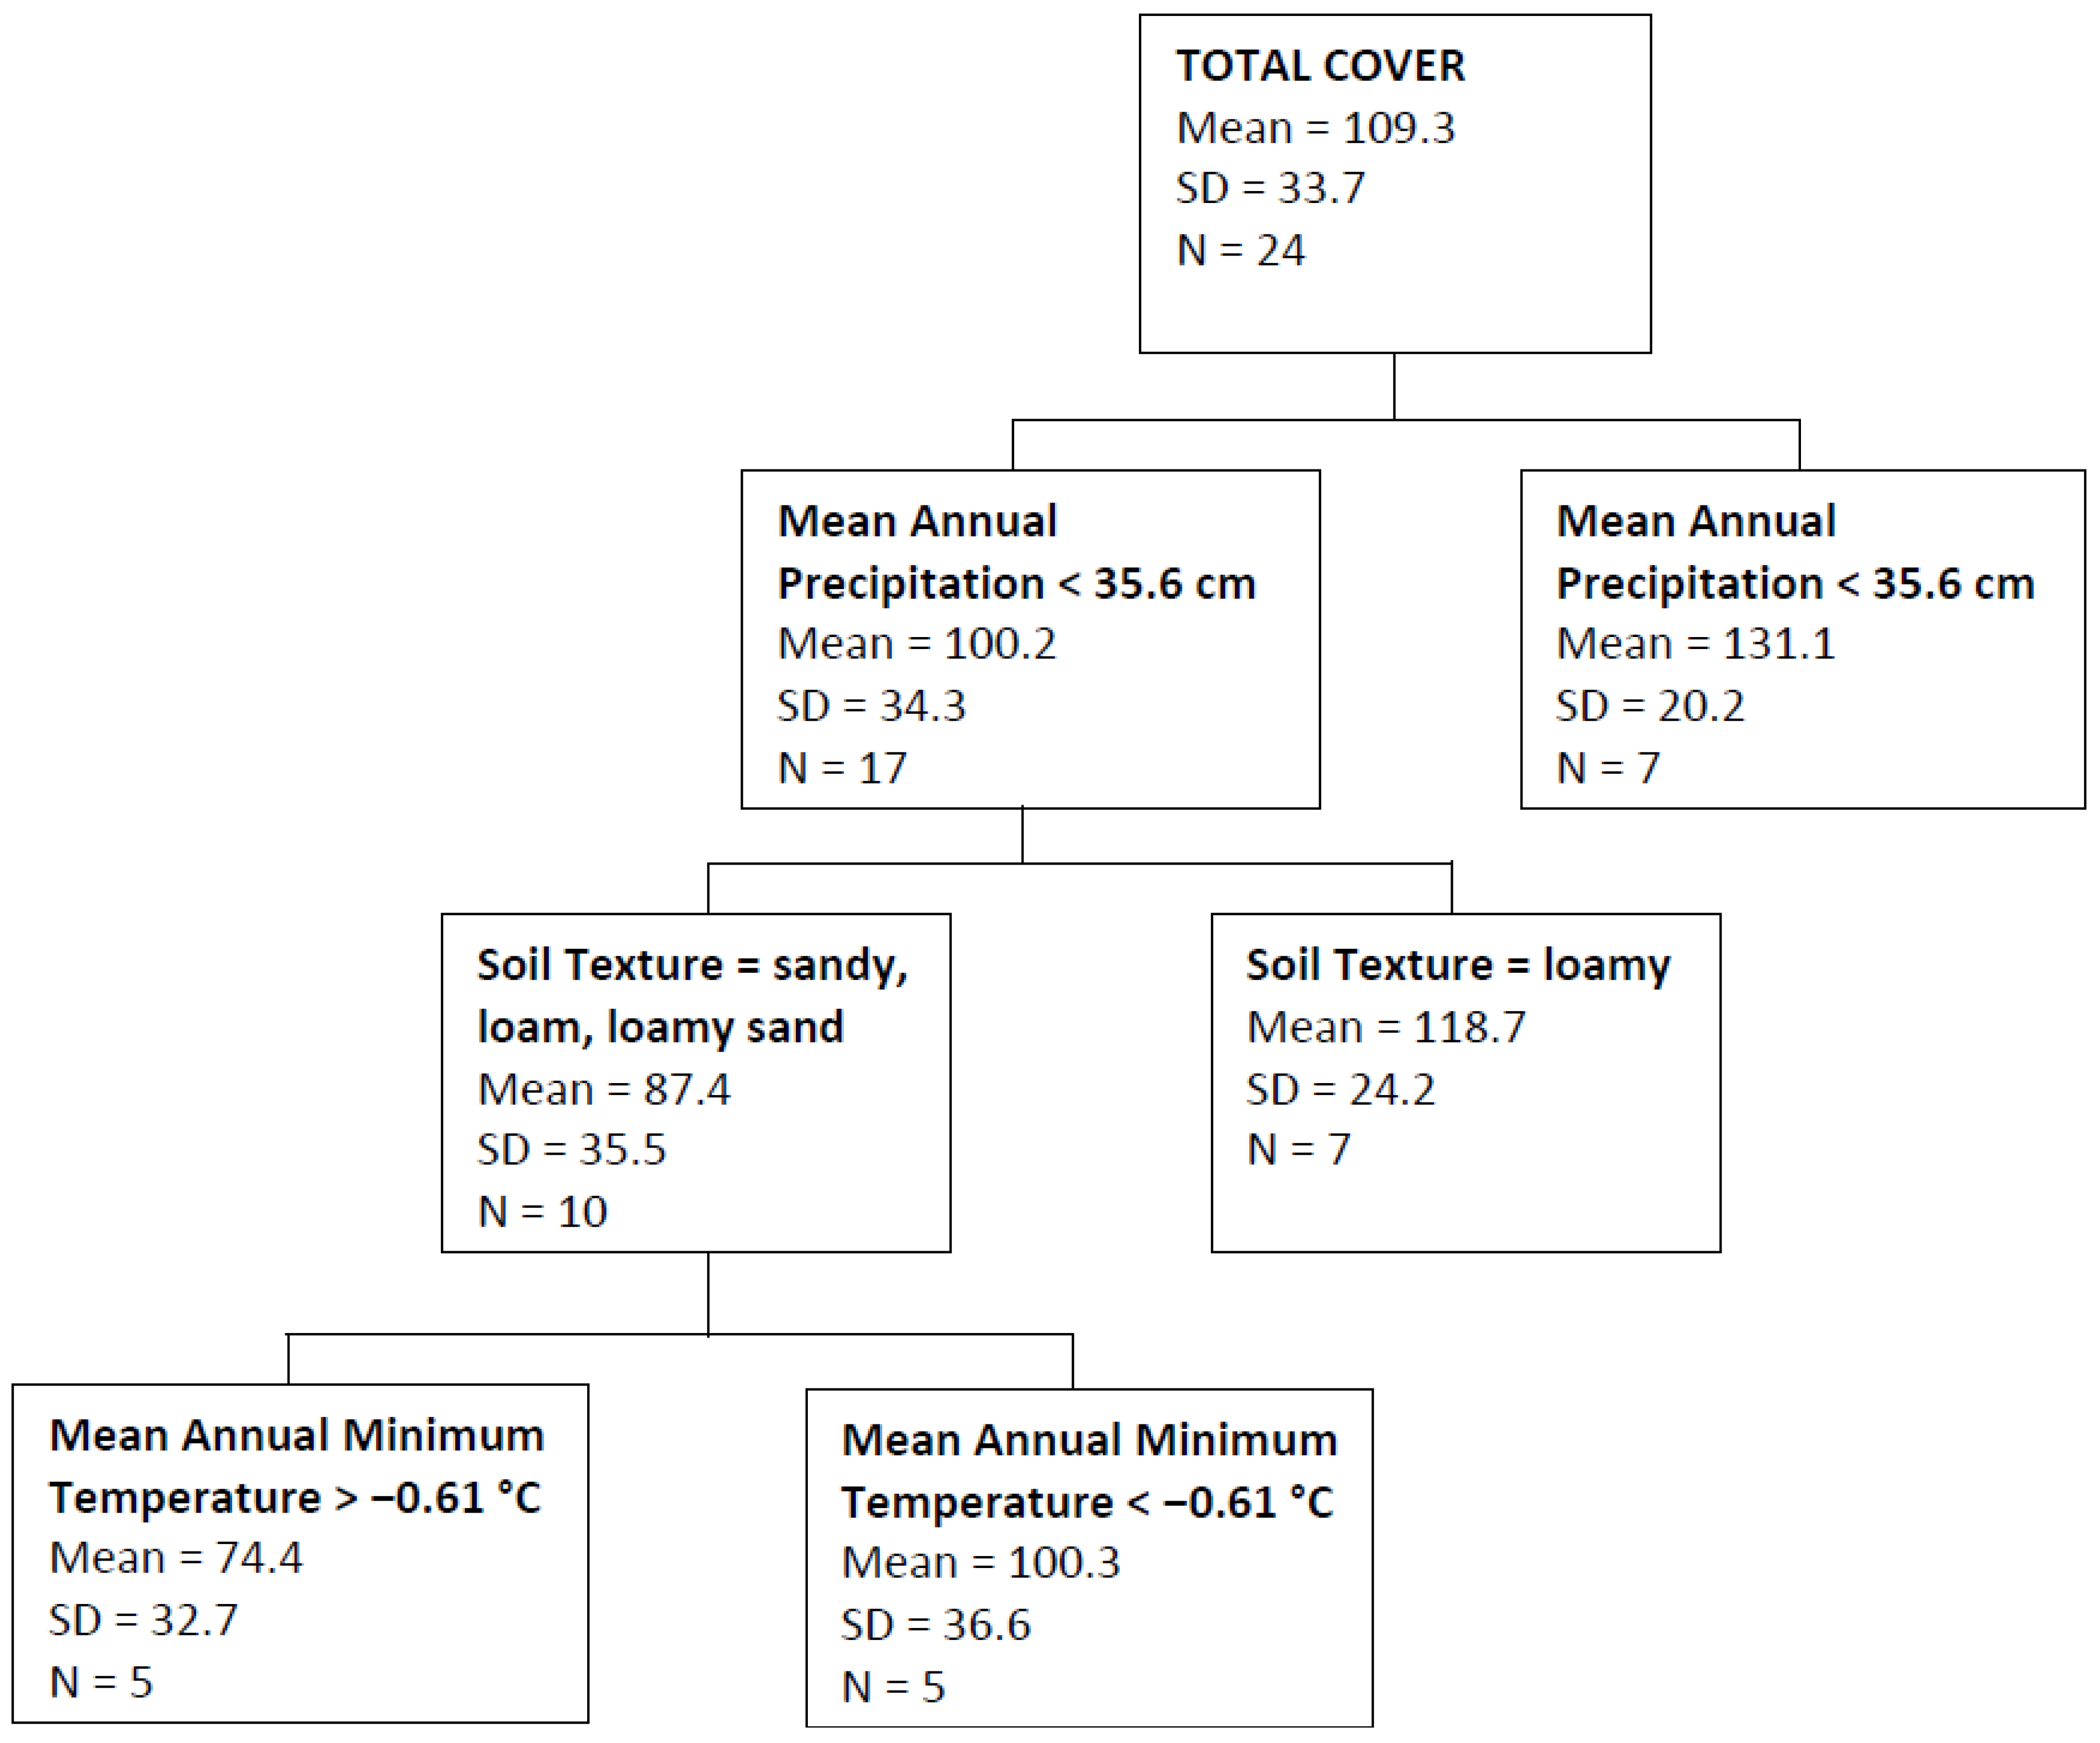
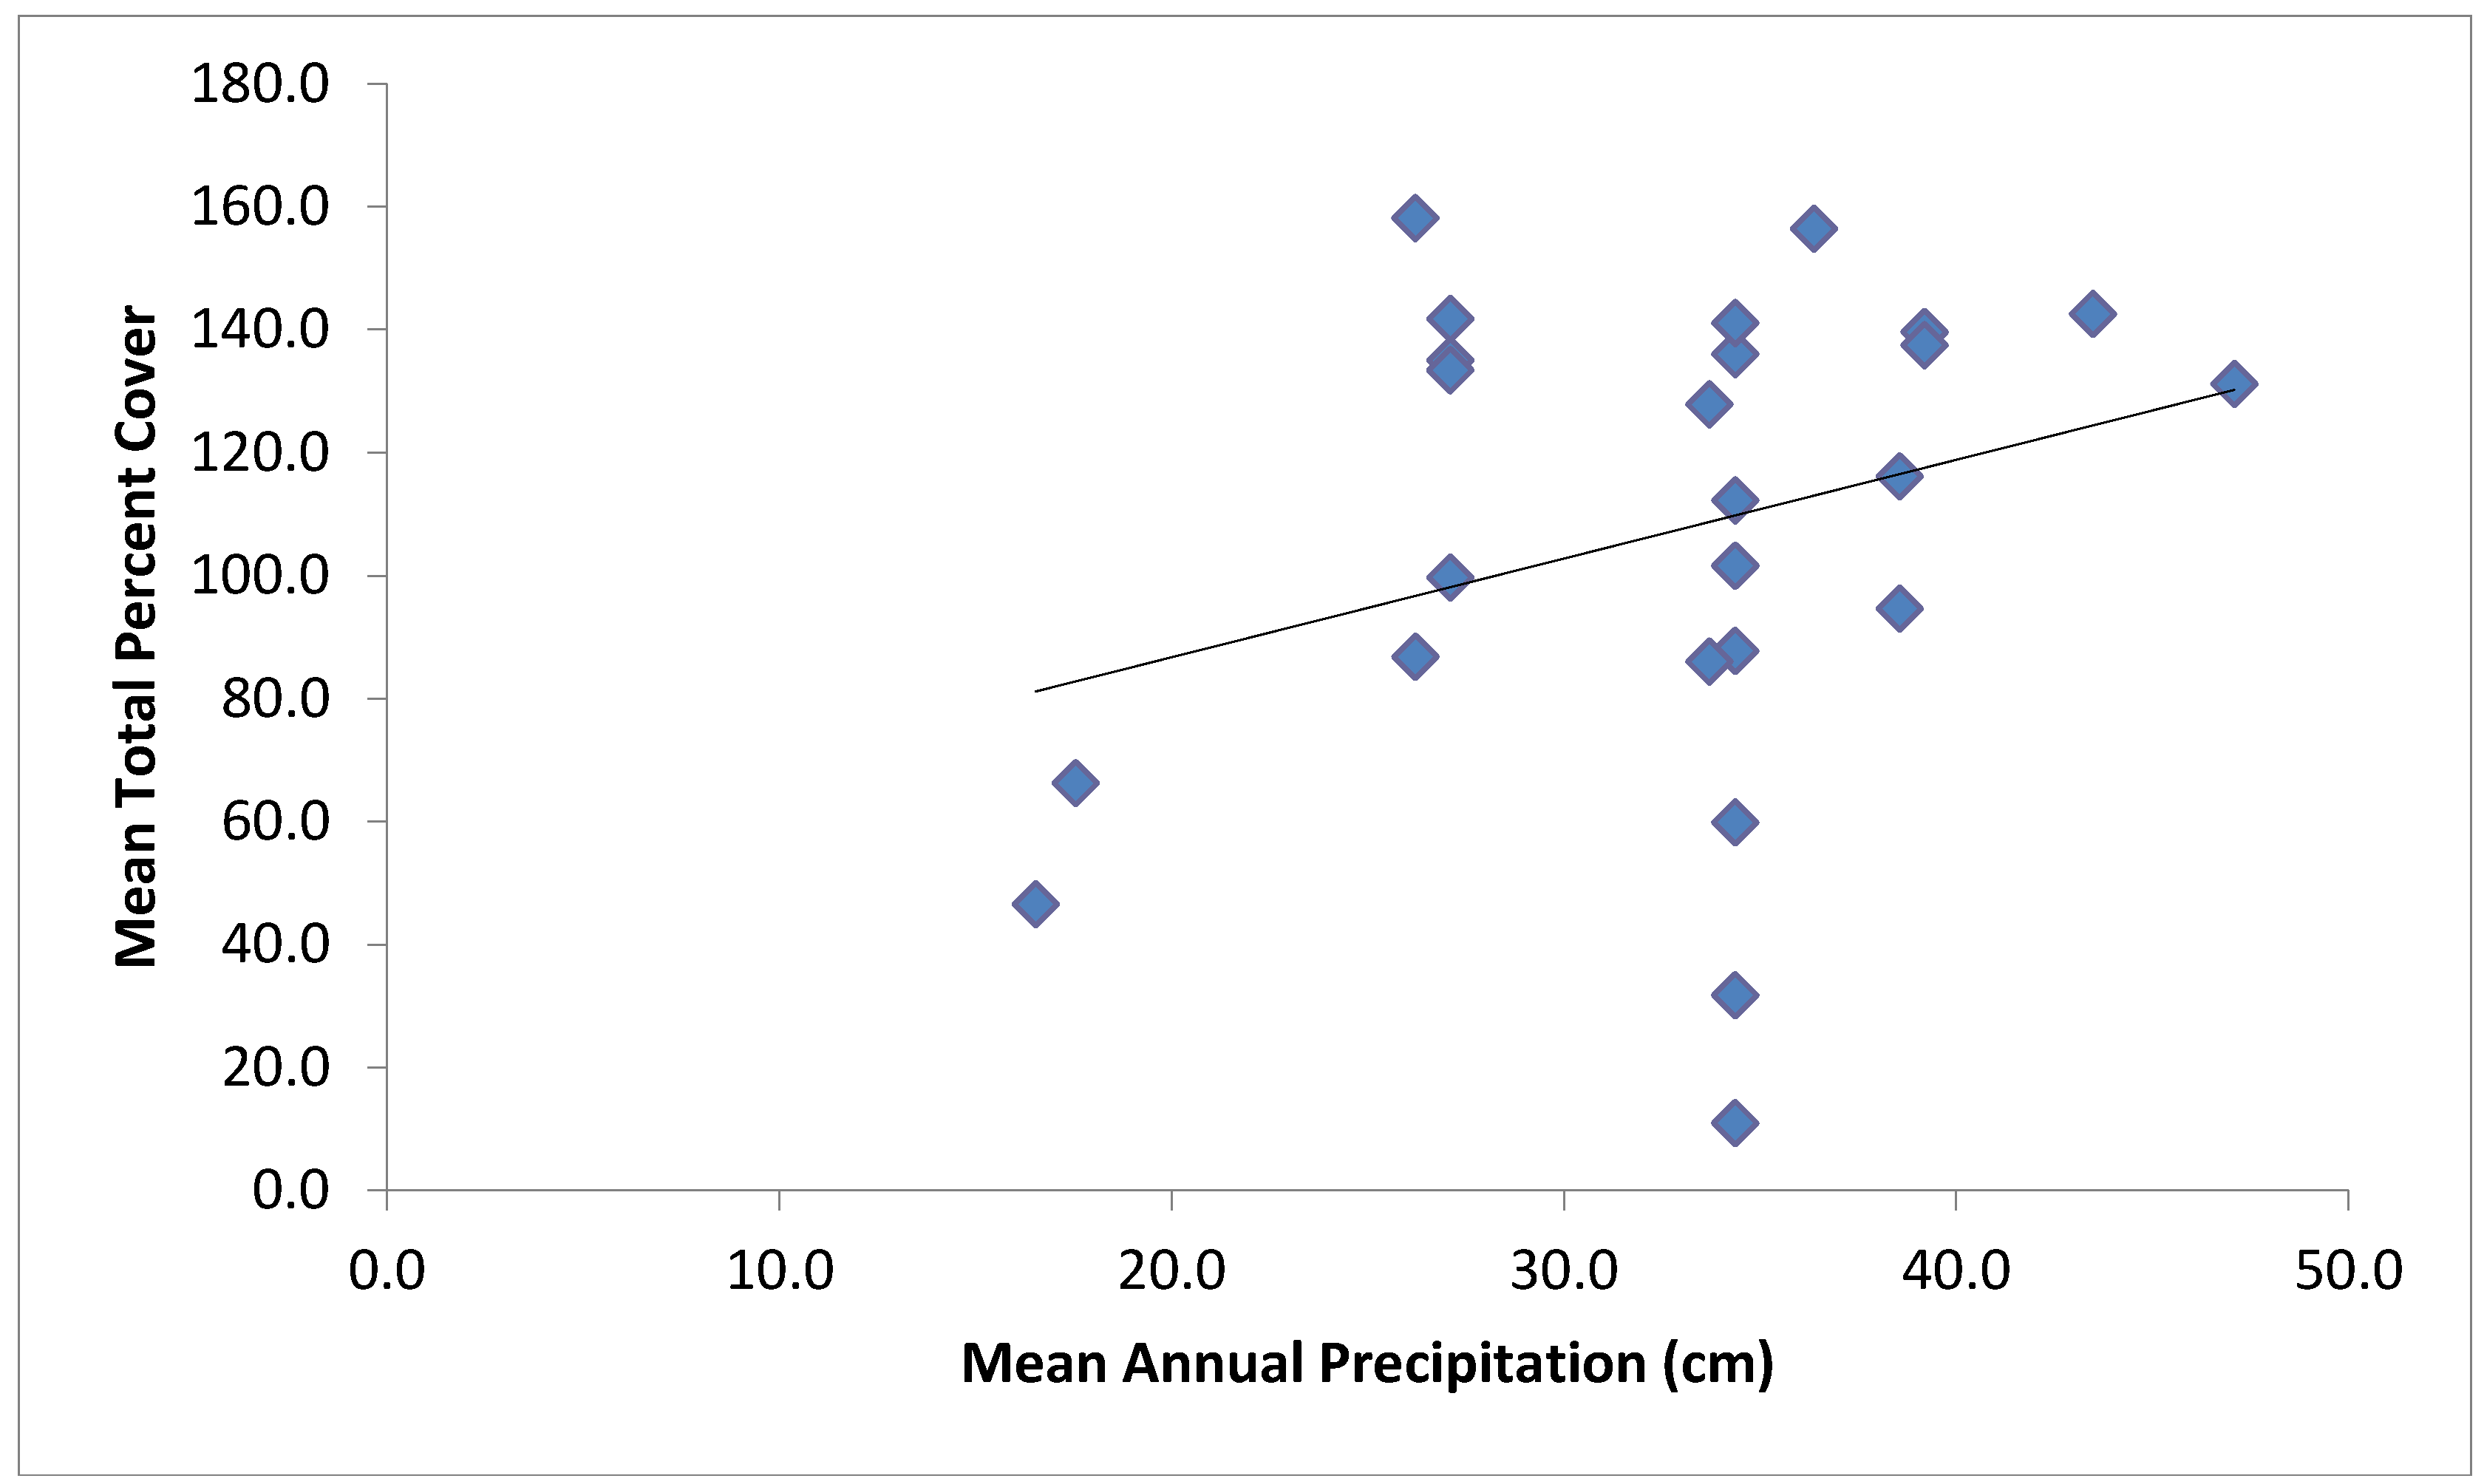
| Response Variable Used | Predictor variables used in the model | PRE |
|---|---|---|
| Total Cover | Mean annual precipitation, soil texture, mean annual minimum temperature | 0.40 |
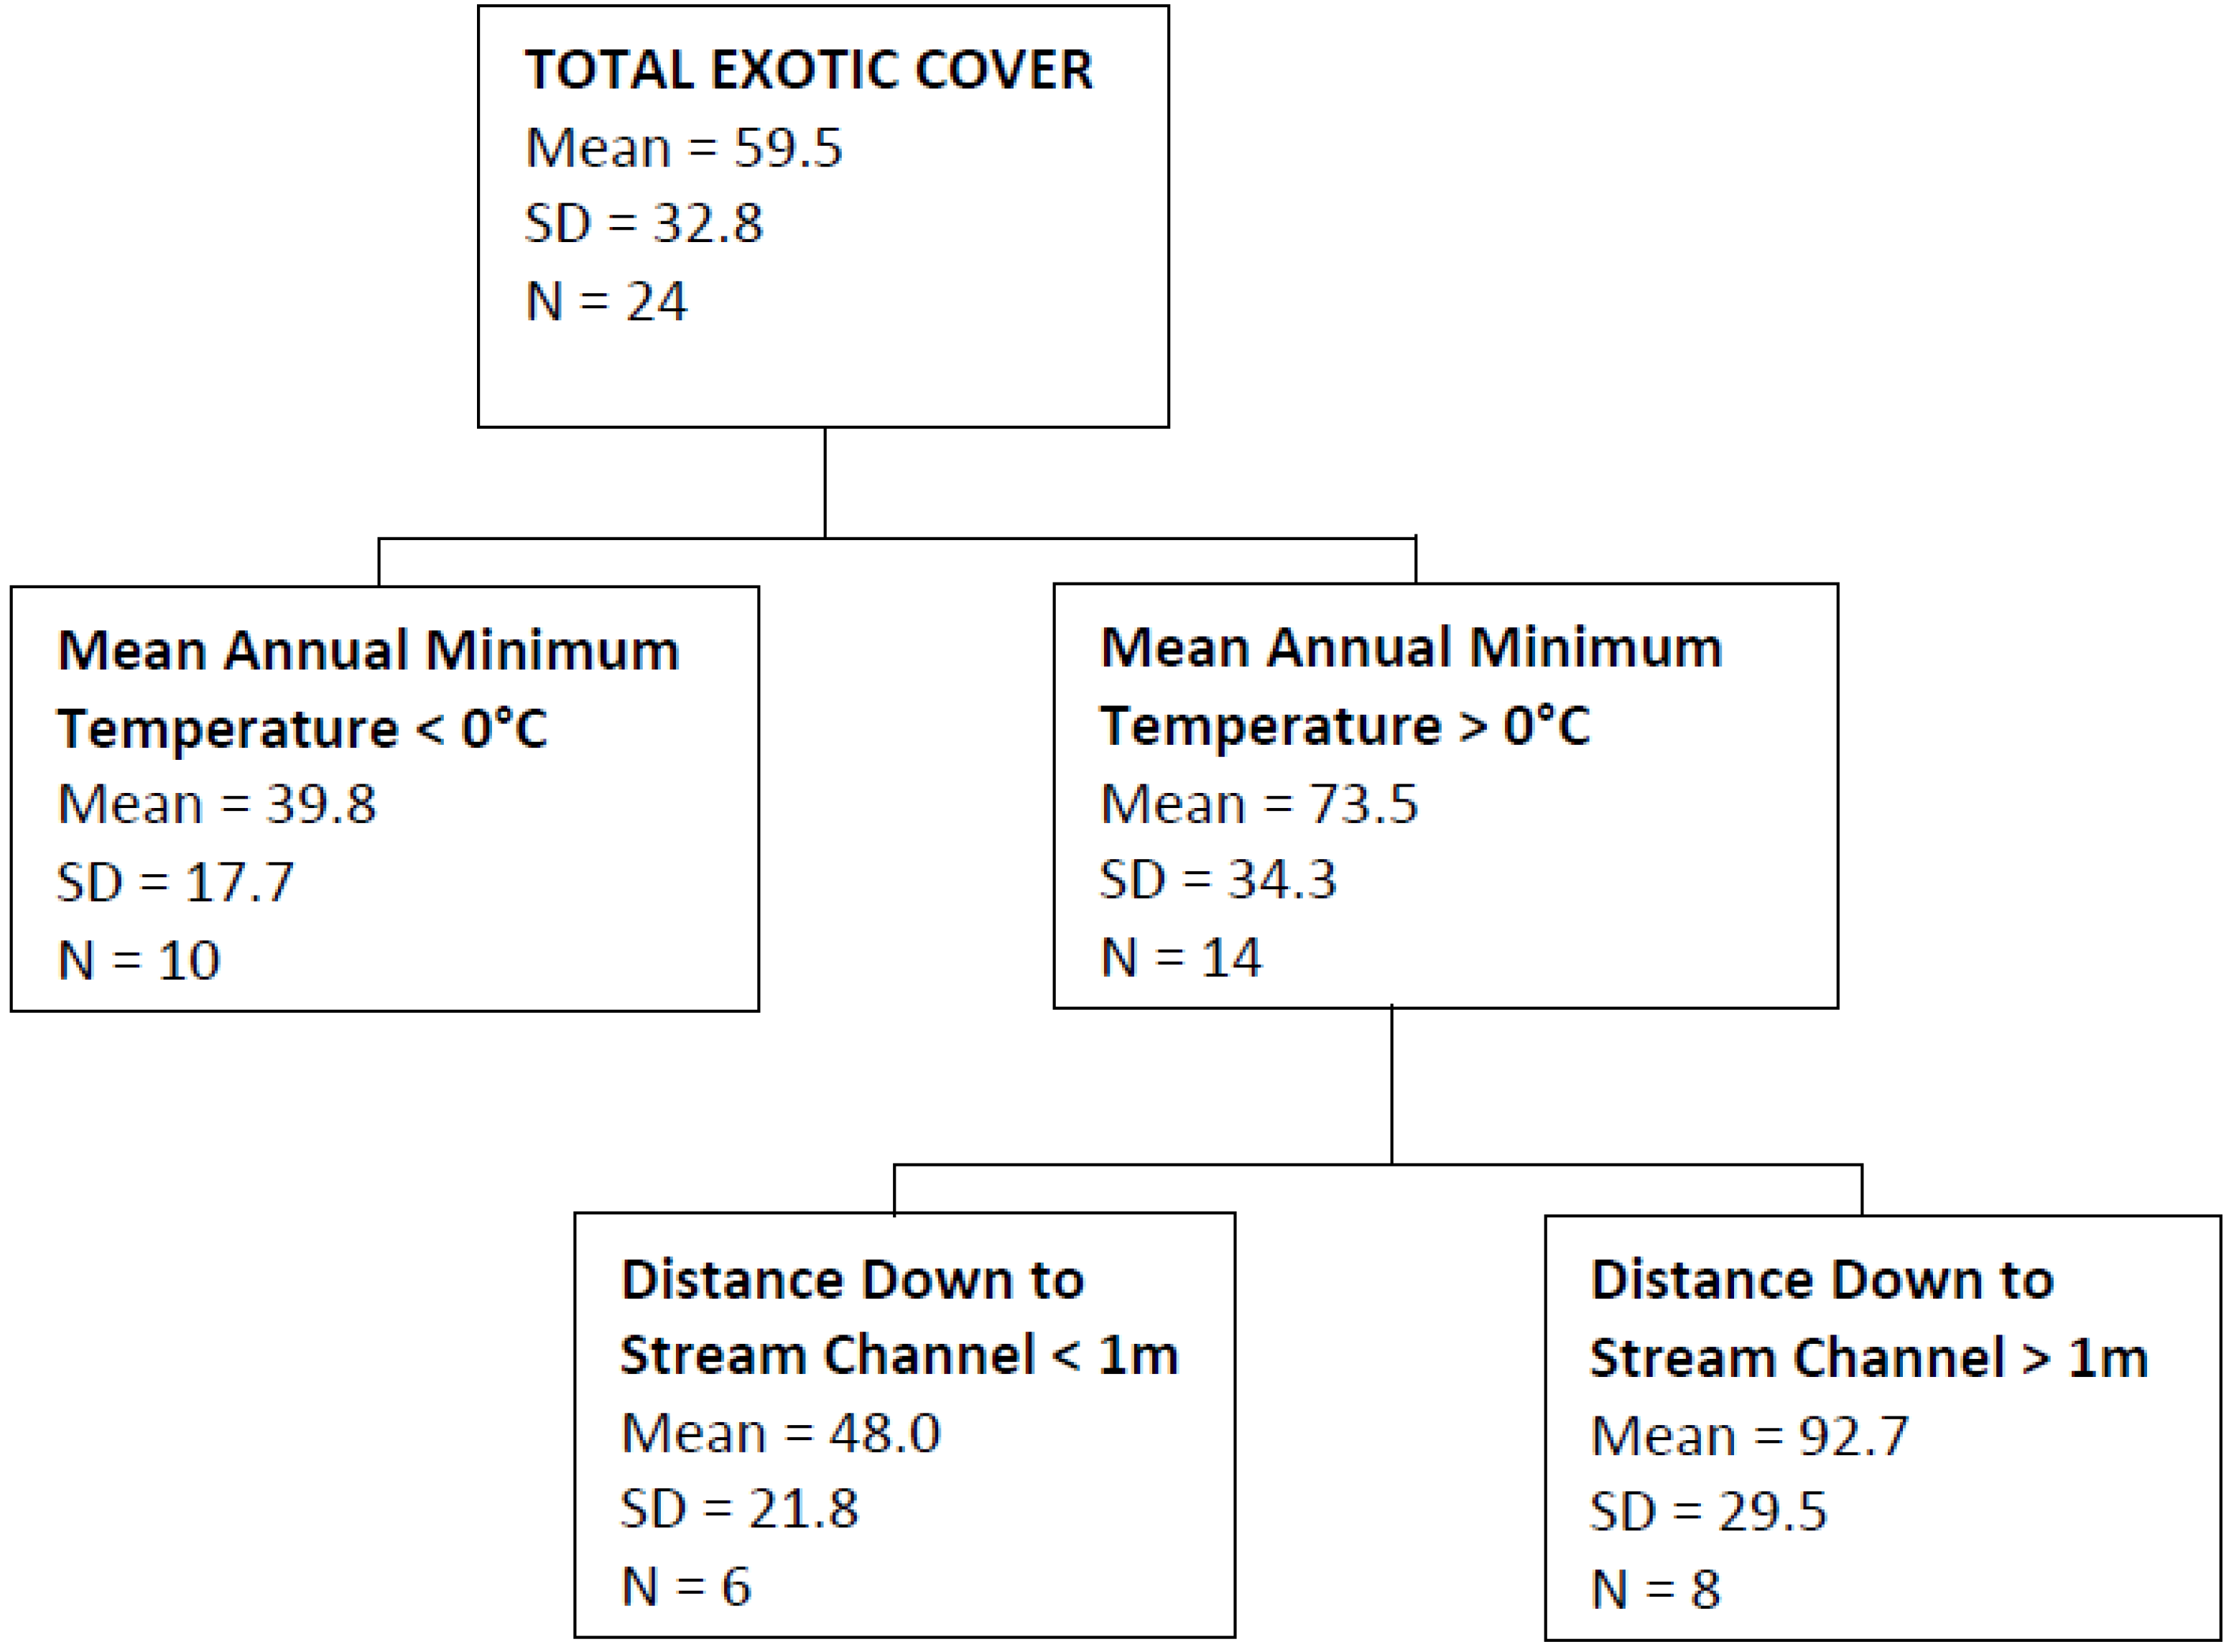
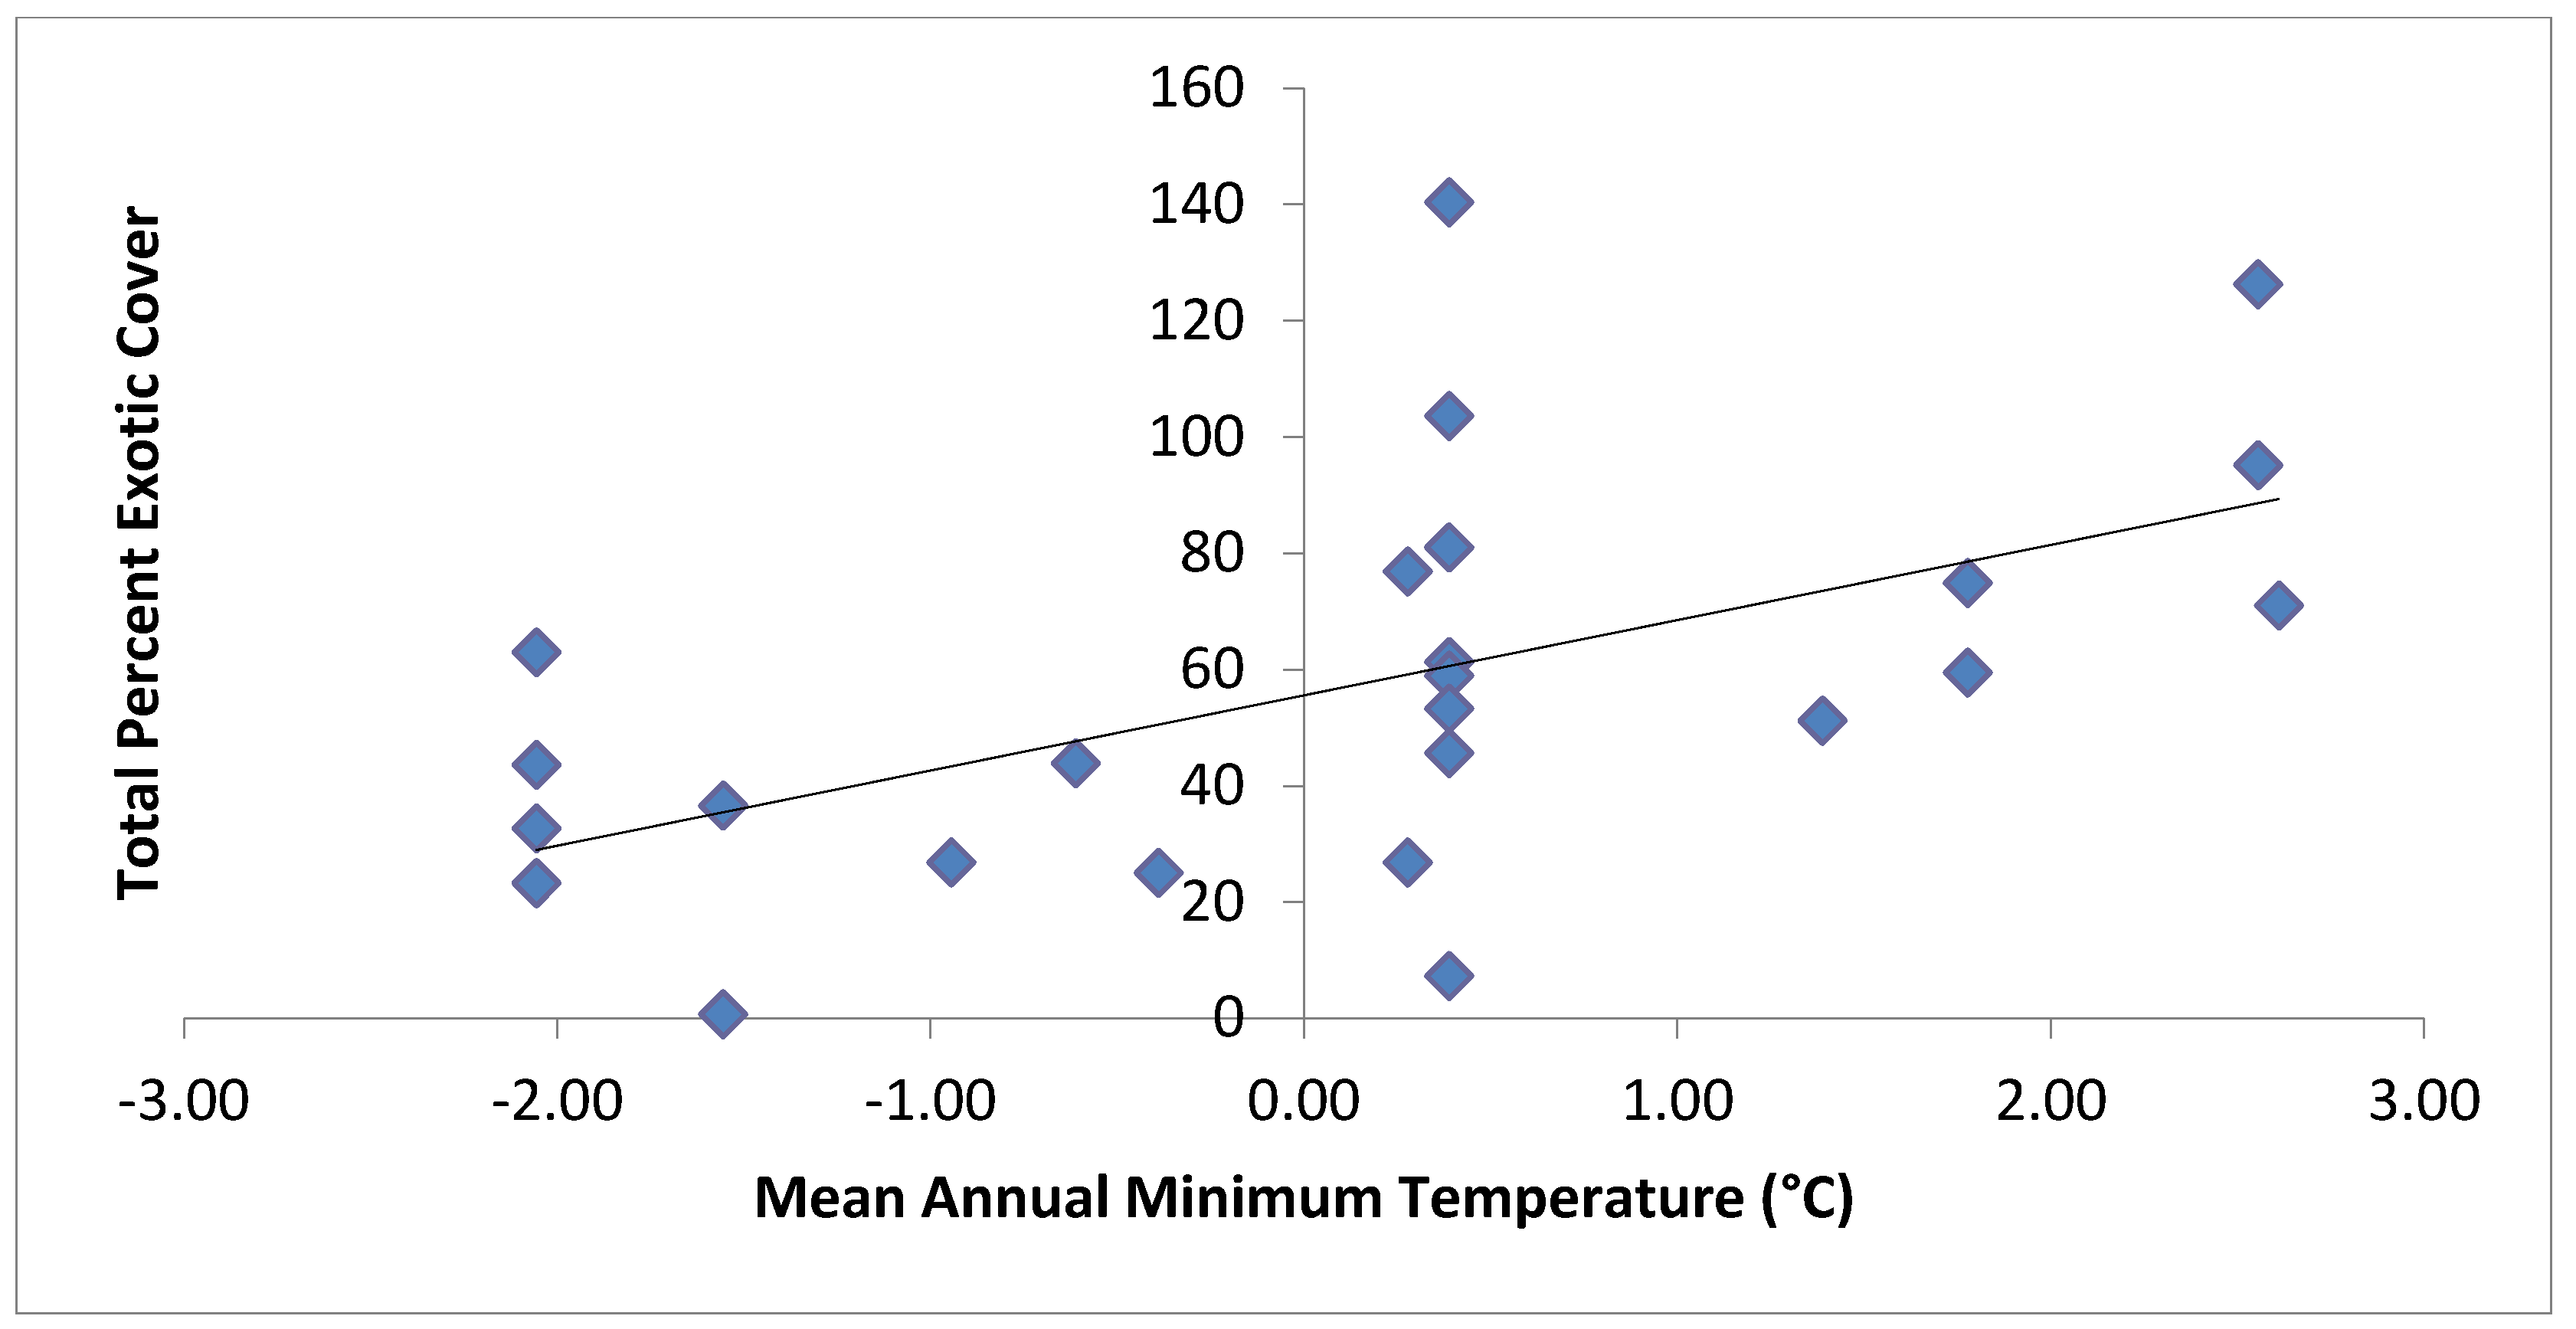
| Total Exotic Cover | Mean annual minimum temperature, distance down to stream channel | 0.54 |
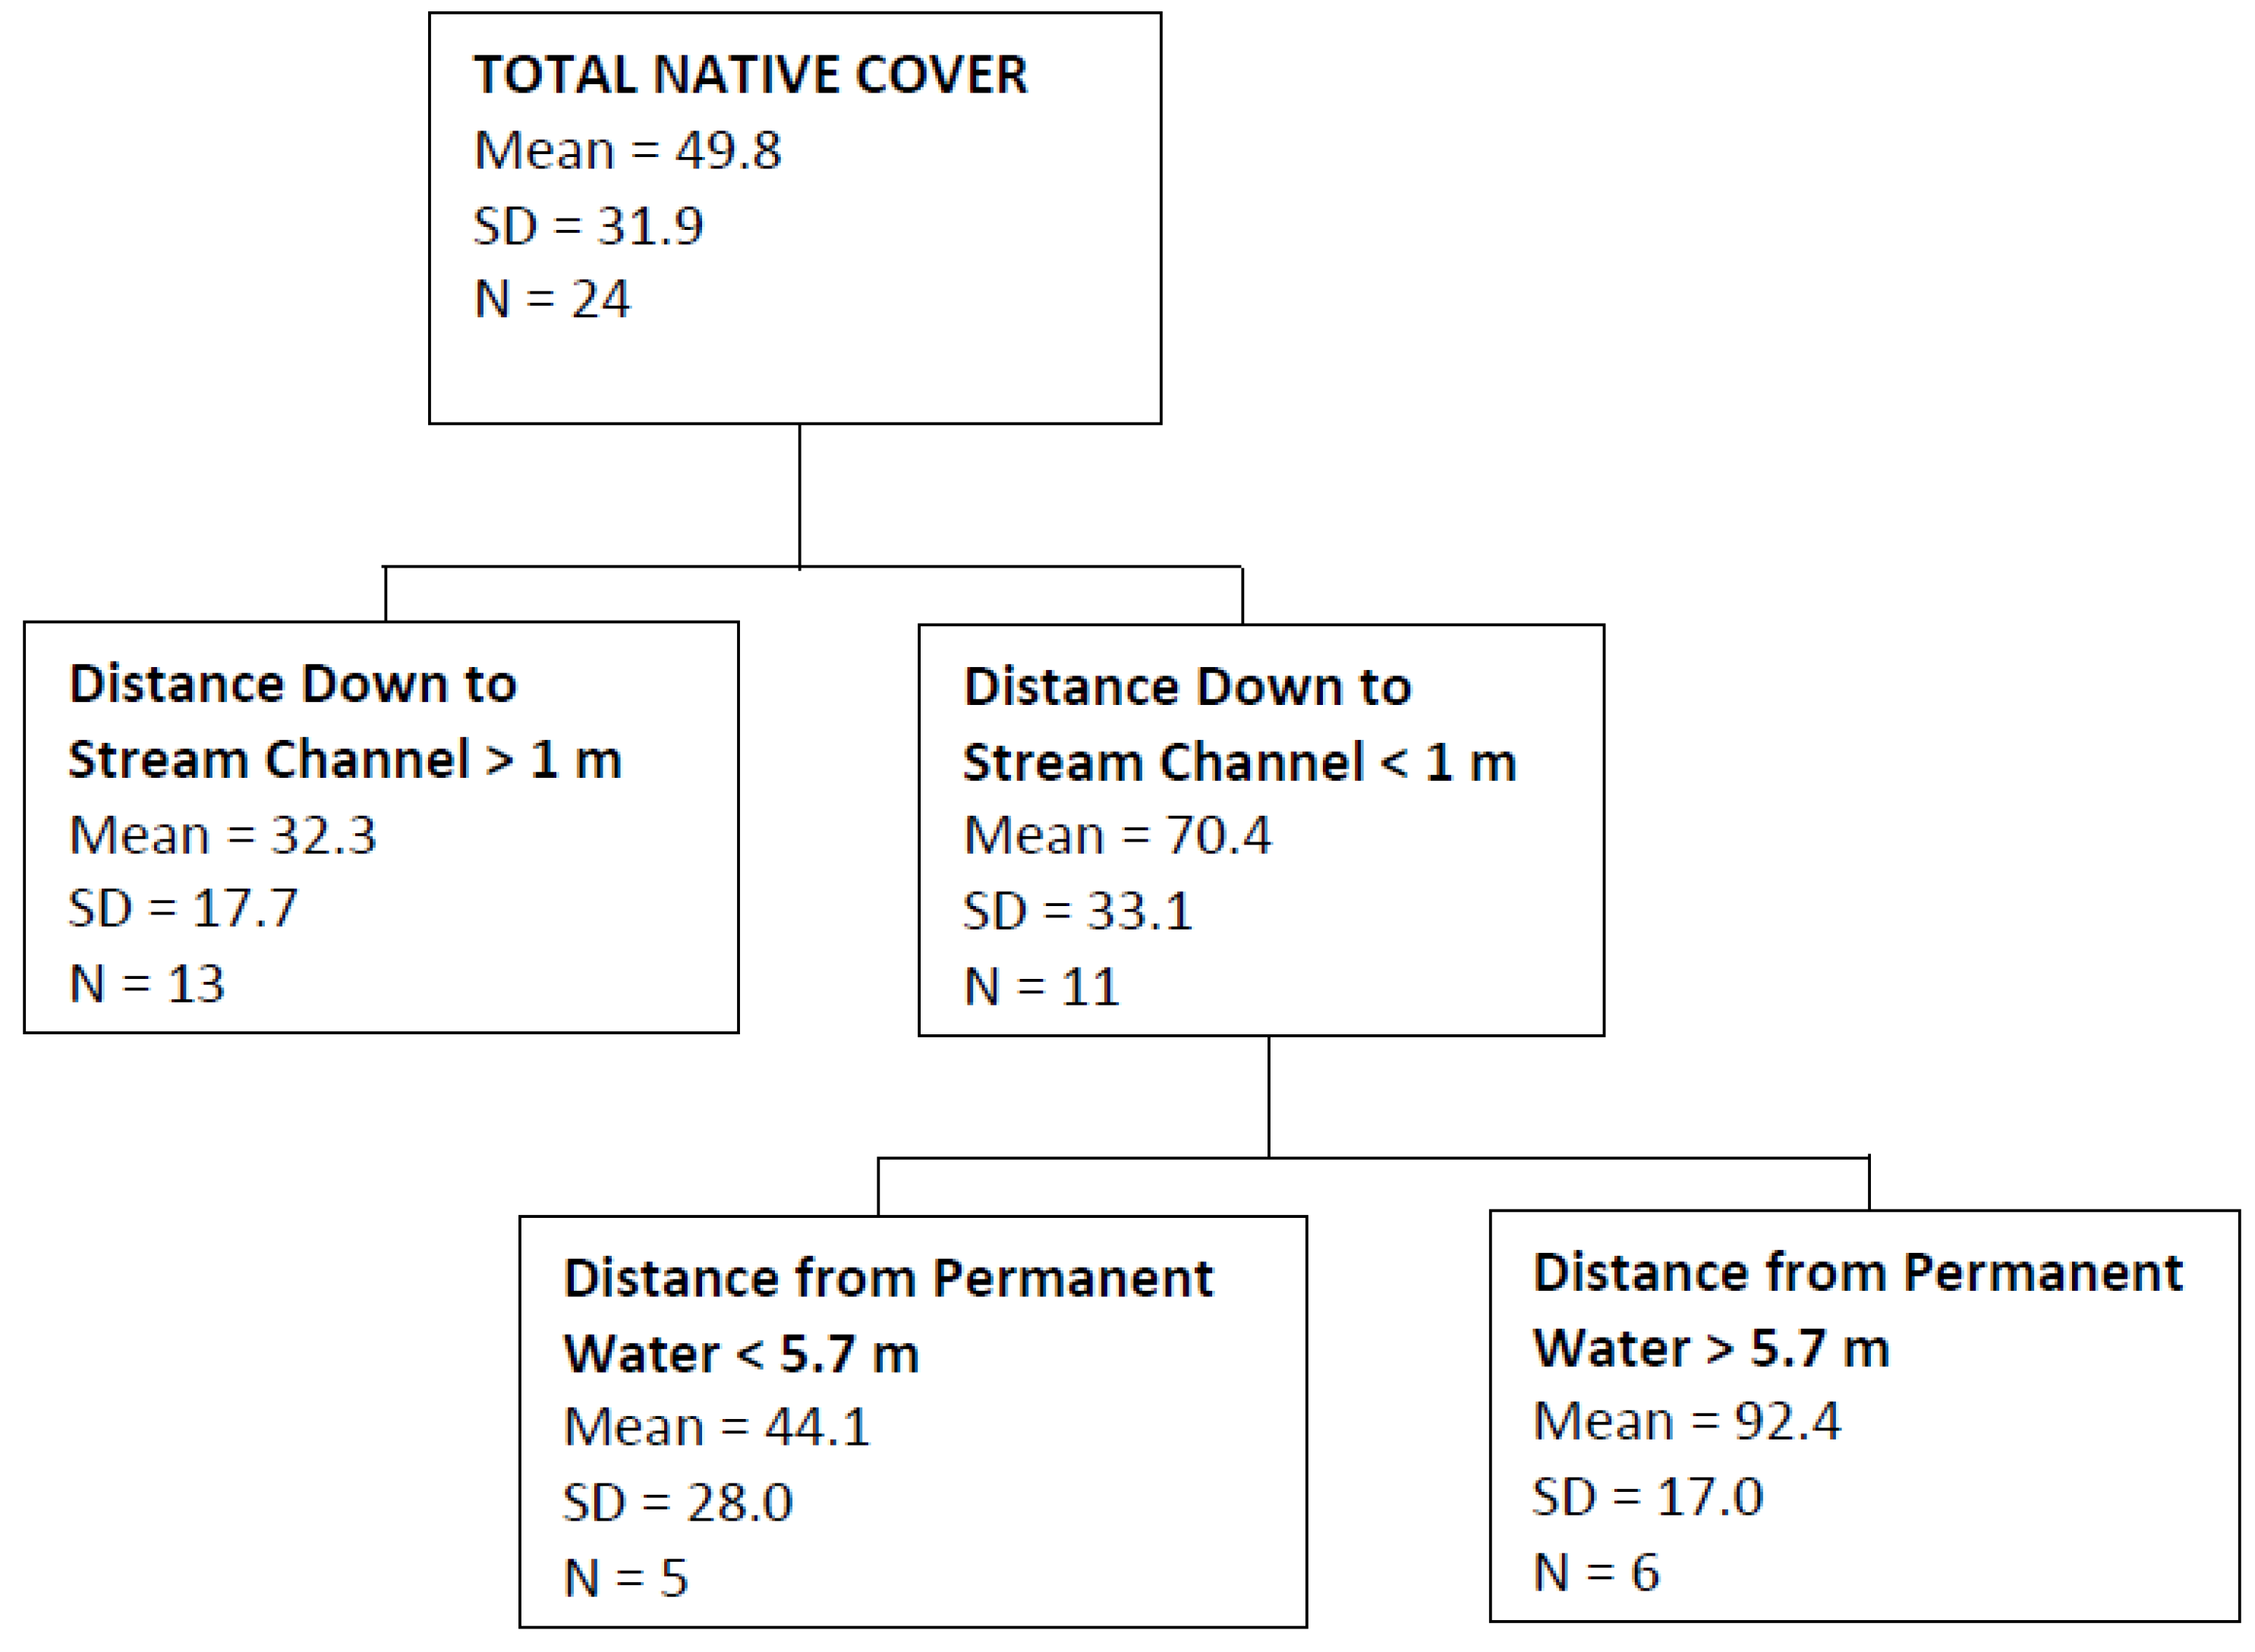
| Total Native Cover | Distance down to stream channel, distance from permanent water | 0.64 |
| Relative Native Cover | Distance down to stream channel, mean annual minimum temperature | 0.58 |
| Shannon-Wiener Diversity Index | Soil organic matter, soil texture, mean annual precipitation | 0.39 |
| Richness | Electroconductivity, soil organic matter, mean annual precipitation | 0.36 |

4. Discussion
5. Conclusions
Acknowledgments
Conflict of Interest
References and Notes
- Mack, R.N.; Simberloff, D.; Lonsdale, W.M.; Evans, H.; Clout, M.; Bazzaz, F.A. Biotic Invasions: Causes, Epidemiology, Global Consequences, and Contrl. Ecol. Appl. 2000, 10, 689–710. [Google Scholar] [CrossRef]
- DeCant, J.B. Russian olive, Elaeagnus angustifolia, alters patterns in soil nitrogen pools along the Rio Grande River, New Mexico, USA. Wetlands 2008, 28, 896–904. [Google Scholar] [CrossRef]
- Gaddis, M.L.; Sher, A.A. Environmental impact of restoration of riparian ecosystems: Fitting Russian olive (Elaeagnus angustifolia) into the picture. M.S. Thesis, University of Denver, Denver, CO, USA, 2008. [Google Scholar]
- Vitousek, P.M.; Walker, L.R. Biological invasion by Myrica faya in Hawai’i: Plant demography, nitrogen fixation, ecosystem effects. Ecol. Monogr. 1989, 59, 247–265. [Google Scholar] [CrossRef]
- Friedman, J.M.; Auble, G.T.; Shafroth, P.B.; Scott, M.L.; Merigliano, M.F.; Freehling, M.D.; Griffin, E.R. Dominance of non-native riparian trees in western USA. Biol. Invasions 2005, 7, 747–751. [Google Scholar] [CrossRef]
- Nagler, P.L.; Glenn, E.P.; Jarnevich, C.S.; Shafroth, P.B. Distribution and Abundance of Saltcedar and Russian olive in the Western United States. Crit. Rev. Plant Sci. 2011, 30, 508–523. [Google Scholar] [CrossRef]
- Katz, G.L.; Shafroth, P.B. Biology, ecology and management of Elaeagnus angustifolia L. (Russian olive) in western North America. Wetlands 2003, 23, 763–777. [Google Scholar] [CrossRef]
- Shafroth, P.B.; Auble, G.T.; Scott, M.L. Germination and establishment of the native plains cottonwood (Populus deltoides Marshall subsp. Monilifera) and the exotic Russian olive (Elaeagnus angustifolia L.). Conserv. Biol. 1995, 9, 1169–1175. [Google Scholar]
- Friedman, J.M.; Scott, M.L.; Auble, G.T. Water management and cottonwood dynamics along prairie streams. Ecology 1997, 125, 49–71. [Google Scholar]
- Poff, N.L.; Allan, J.D.; Bain, M.B.; Karr, J.R.; Prestegaard, K.L.; Richter, B.D.; Stromberg, J.C. The natural flow regime: A paradigm for river conservation and restoration. BioScience 1997, 47, 769–784. [Google Scholar]
- Stromberg, J.C. Restoration of riparian vegetation in the south-western United States: Importance of flow regimes and fluvial dynamism. J. Arid Environ. 2001, 49, 17–34. [Google Scholar] [CrossRef]
- Reynolds, L.V.; Cooper, D.J. Ecosystem response to removal of exotic riparian shrubs and a transition to upland vegetation. Plant Ecol. 2011, 212, 1243–1261. [Google Scholar] [CrossRef]
- Pollen-Bankhead, N.; Simon, A.; Jaeger, K.; Wohl, E. Destabilization of streambanks by removal of invasive species in Canyon de Chelly National Monument, Arizona. Geomorphology 2009, 103, 363–374. [Google Scholar] [CrossRef]
- Scott, R.L.; Cable, W.L.; Huxman, T.E.; Nagler, P.L. Multiyear riparian evapotranspiration and groundwater use for a semiarid watershed. J. Arid Environ. 2008, 72, 1232–1246. [Google Scholar] [CrossRef]
- Jaeger, K.L.; Wohl, E. Channel response in a semiarid stream to removal of tamarisk and Russian olive. Water Resour. Res. 2011, 47, W02536. [Google Scholar] [CrossRef]
- Glenn, E.; Nagler, P. Comparative ecophysiology of saltcedar and native trees in western U.S. riparian zones. J. Arid Environ. 2005, 61, 419–446. [Google Scholar] [CrossRef]
- Harms, R.S.; Heibert, R.D. Vegetation response following invasive tamarisk (Tamarix spp.): Removal and implications for riparian restoration. Restor. Ecol. 2006, 14, 461–472. [Google Scholar] [CrossRef]
- Bay, R.F.; Sher, A.A. Success of active revegetation after Tamarix removal in riparian ecosystems of the southwestern United States: A quantitative assessment of past restoration projects. Restor. Ecol. 2008, 16, 113–128. [Google Scholar] [CrossRef]
- Huddle, J.A.; Awada, T.; Martin, D.L.; Zhou, X.H. Understory response following the removal of invasive woody species from a cottonwood riparian forest depends on overstory type. In Proceedings of the Meeting of the Ecological Society of America, Albuquerque, NM, USA, 2 August, 2009.
- Hummel, O.; Caplan, T. Evaluating restoration success and applying adaptive management in the Middle Rio Grande Bosque. In Proceedings of the Meeting of the Ecological Society of America, Albuquerque, NM, USA, 2 August 2009.
- Sher, A.A.; Lair, K.; DePrenger-Levin, M.; Dohrenwend, K. Best Management Practices for Revegetation in the Upper Colorado River Basin; Denver Botanic Gardens: Denver, CO, USA, 2010; p. 55. [Google Scholar]
- Shafroth, P.B.; Brown, C.A.; Merritt, D.M. Saltcedar and Russian olive control demonstration act science assessment. In Scientific Investigations Report 2009-5247; US Geological Survey: Reston, VA, USA, 2010; p. 143. [Google Scholar]
- Olson, T.E.; Knopf, F.L. Naturalization of Russian-olive in the western United States. West. J. Appl. Forestry 1986 1, 65–69.
- Shmida, A. Whittaker’s plant diversity sampling method. Isr. J. Bot. 1984, 33, 41–46. [Google Scholar]
- Stohlgren, T.J.; Falkner, M.B.; Schell, L.D. A Modified-Whittaker Nested Vegetation Sampling Method. Vegetation 1995, 117, 113–121. [Google Scholar] [CrossRef]
- Bradshaw, A.D.; Chadwick, M.J. The Restoration of Land: The Ecology and Reclamation of Derelict and Degraded Land; Anderson, D.J., Greig-Smith, P., Pitelka, F.A., Eds.; University of California Press: Berkeley and Los Angeles, CA, USA, 1980; p. 116. [Google Scholar]
- Western Regional Climate Center: Historical Climate Information. Available online: http://www.wrcc.dri.edu/summary/Climsmco.html (accessed on 29 August 2007).
- Quinn, G.P.; Keough, M.J. Experimental Design and Data Analysis for Biologists; Cambridge University Press: Cambridge, UK, 2002; p. 206. [Google Scholar]
- Systat Software Inc. SYSTAT 11 Statistical Software. Richmond, CA, USA, 2004.
- Sher, A.A.; Hyatt, L.H. The Disturbance-Invasion Matrix: A new framework for predicting plant invasions. Biol. Invasions 1999, 1, 109–114. [Google Scholar]
- Hobbs, R.J.; Huenneke, L.F. Disturbance, diversity, and invasion: implications for conservation. Conserv. Biol. 1992, 6, 324–337. [Google Scholar]
- Forcella, F.; Harvey, S.J. Relative abundance in an alien weed flora. Oecologia 1983, 59, 292–295. [Google Scholar] [CrossRef]
- Shafroth, P.B.; Stromberg, J.C.; Patten, D.T. Riparian vegetation response to altered disturbance and stress regimes. Ecol. Appl. 2002, 12, 107–123. [Google Scholar] [CrossRef]
- Sher, A.A.; Marshall, D.L. Competition between native and exotic floodplain tree species across water regimes and soil textures. Am. J. Bot. 2003, 90, 413–422. [Google Scholar] [CrossRef]
- Sher, A.A.; Marshall, D.L.; Taylor, J. Spatial partitioning within southwestern floodplains: Patterns of establishment of native Populus and Salix in the presence of invasive, non-native Tamarix. Ecol. Appl. 2002, 12, 760–772. [Google Scholar] [CrossRef]
- Sher, A.A.; Marshall, D.L.; Gilbert, S.A. Competition between native Populus deltoides and invasive Tamarix ramosissima and the implications of reestablishing flooding disturbance. Conserv. Biol. 2000, 14, 1744–1754. [Google Scholar] [CrossRef]
- Stromberg, J.C.; Lite, S.J.; Marler, R.; Paradzick, C.; Shafroth, P.B.; Shorrock, D.; White, J.M.; White, M.S. Altered stream-flow regimes and invasive plant species: The Tamarix case. Global Ecol. Biogeogr. 2007, 16, 381–393. [Google Scholar] [CrossRef]
- National Climate Data Center: Palmer Hydrological Drought Index. Available online: http://www.ncdc.noaa.gov/temp-and-precip/drought/historical-palmers.php (accessed on 2 February 2007).
- Didham, R.K.; Tylianakis, J.M.; Hutchison, M.A.; Ewers, R.M.; Gemmell, N.J. Are invasive species the drivers of ecological change? Trends Ecol. Evol. 2005, 20, 470–474. [Google Scholar] [CrossRef]
© 2012 by the authors; licensee MDPI, Basel, Switzerland. This article is an open-access article distributed under the terms and conditions of the Creative Commons Attribution license (http://creativecommons.org/licenses/by/3.0/).
Share and Cite
Gaddis, M.; Sher, A. Russian Olive (Elaeagnus angustifolia) Removal in the Western United States: Multi-Site Findings and Considerations for Future Research. Sustainability 2012, 4, 3346-3361. https://doi.org/10.3390/su4123346
Gaddis M, Sher A. Russian Olive (Elaeagnus angustifolia) Removal in the Western United States: Multi-Site Findings and Considerations for Future Research. Sustainability. 2012; 4(12):3346-3361. https://doi.org/10.3390/su4123346
Chicago/Turabian StyleGaddis, Margaret, and Anna Sher. 2012. "Russian Olive (Elaeagnus angustifolia) Removal in the Western United States: Multi-Site Findings and Considerations for Future Research" Sustainability 4, no. 12: 3346-3361. https://doi.org/10.3390/su4123346
APA StyleGaddis, M., & Sher, A. (2012). Russian Olive (Elaeagnus angustifolia) Removal in the Western United States: Multi-Site Findings and Considerations for Future Research. Sustainability, 4(12), 3346-3361. https://doi.org/10.3390/su4123346