Article

Dynamic Estimation of Travel Time Reliability for Road Network Using Trajectory Data

1
Department of Mechanical Engineering and Rail Transit, Changzhou University, Changzhou 213164, China
2
College of Management and Economics, Tianjin University, No. 92 Weijin Road, Nankai District, Tianjin 300072, China
3
School of Transportation and Civil Engineering, Nantong University, Nantong 226019, China
4
School of Transportation, Southeast University, Nanjing 211189, China
5
Smart Urban Mobility Institute, University of Shanghai for Science and Technology, Shanghai 200093, China
*
Author to whom correspondence should be addressed.
Sustainability 2025, 17(9), 4244; https://doi.org/10.3390/su17094244
Submission received: 3 April 2025 / Revised: 5 May 2025 / Accepted: 5 May 2025 / Published: 7 May 2025
(This article belongs to the Special Issue Sustainable Transportation and Logistics Optimization)

Abstract

:
To evaluate the operation of an urban transportation system by accurately analyzing the reliability of a road network, with the aim of reducing the substantial fluctuation of travel time, a method for dynamically estimating the reliability of road network travel time is proposed. First, the definition of travel time reliability is given by referring to system reliability theory: the possibility that all travelers in the road network reach their destination within a predetermined time. The travel time reliability is numerically expressed as the probability that the ratio of delay to travel time (RODT) is less than a certain value. Then, actual data are used to prove that the RODT of vehicles in the road network obeys the normal distribution, based on which a data-driven method of travel time reliability estimation is proposed. The travel time reliability of a real-world network is estimated based on the trajectory. Finally, the variation in travel time reliability under different road network capacities is studied, and the accuracy of the estimated travel time reliability under different trajectory data penetration rates is analyzed. The dynamic estimation method of travel time reliability proposed in this paper supports better understanding of the operation efficiency of urban road traffic systems, to help better evaluate the performance of road network systems and provide a basis for road network reliability optimization.

1. Introduction

Urban traffic facilities, traffic participants, and the traffic management control system constitute a typical open complex giant system. The system is often affected by periodic or random disturbances, resulting in traffic problems such as blocked supply chains and increased personal travel costs [1,2]. Road network reliability, representing the probability that the transportation system maintains a satisfactory level of service despite random disturbances, provides a probabilistic measure of transportation system risk. Existing valuation methods for assessing reliability in both empirical and theoretical studies can be broadly categorized into two types. The first type focuses on analyzing various aspects of travel time distribution to capture travel time reliability. This includes metrics such as standard deviation, variance, coefficient of variation, quantile differences of the travel time distribution, and unreliability areas, among others [3,4,5,6]. The second type involves the use of delay, which is defined as the difference between the actual arrival time and a specified reference point, such as the preferred arrival time, the most frequently observed travel time (usual travel time), or the scheduled time, among others [7,8,9].
Travel time reliability is an important index to measure the reliability of a road network. Reducing the travel time fluctuation is more beneficial than reducing the expected travel time for travelers [10,11]. Research on dynamic estimation of road network travel time reliability can be used as the basis for urban traffic network management and optimization, to further improve the level of service.
Travel time reliability derived from statistical measurement methods typically relies on historical data as an input, which limits its ability to be estimated dynamically [12,13]. With the widespread deployment of intelligent transportation systems, capturing variations in travel time has become increasingly important for predicting real-time traffic conditions. Consequently, there is a growing need for research focused on the dynamic estimation of travel time reliability. Free flow time and delay are major components of travel time. The fluctuation of delay leads to significant changes in travel times, in turn affecting the travel time reliability. Therefore, this study uses the ratio of delay to travel time (RODT) as a key factor to measure travel time reliability. Research on a dynamic estimation method of travel time reliability based on trajectory data is of great significance and value to the real-time management and control of urban road traffic networks.
This study proposes a dynamic estimation method for the travel time reliability of a road traffic network using trajectory data. The research contributions include (i) clarifying the dynamic estimation of travel time reliability as determining the probability distribution of the RODT for all vehicles during a given differential time in the road network; (ii) proposing a dynamic estimation method for travel time reliability supported by actual trajectory data confirming that the RODT follows a normal distribution; (iii) validating the effectiveness of the proposed method through its application in a real-world road network; (iv) establishing simulation experiments to explore the impact of trajectory data permeability on reliability estimation. This study employs trajectory data for the dynamic estimation of road network reliability, enriching travel time reliability models and contributing to the advancement of intelligent transportation systems through scalable, data-driven methodologies.
In the following section, existing research on estimation of travel time reliability and trajectory data is summarized based on the current literature. Section 3 presents the methodology. It begins with the parameter description and the necessary research assumptions, followed by the proposed trajectory-data-driven method for the dynamic estimation of travel time reliability. Section 4 focuses on the results and discussion. It starts with a detailed introduction of the experimental data sources, followed by hypothesis validation. Subsequently, a microscopic simulation experiment is conducted to analyze the applicability of the proposed method. Finally, travel time reliability is estimated for a real-world road network. Section 5 summarizes the research conclusions.

2. Brief Review of Previous Research

2.1. Estimation of Travel Time Reliability

The unpredictability of traffic demand and the inherent randomness of traffic supply pose significant challenges to accurately forecasting travel times, making travel time reliability (TTR) a core concern for all stakeholders in transportation systems. These stakeholders, including planners, travelers, service providers, and managers, increasingly recognize TTR as a critical factor influencing traveler behavior. In many cases, TTR is considered equally, if not more, important than travel time itself. Consequently, TTR has become a recommended or required component in transportation project evaluations and serves as a key performance indicator for assessing and improving network service quality.
To estimate TTR, researchers have developed several theoretical models that provide a foundation for understanding and quantifying reliability [14,15,16,17]. Among these, the mean–variance model examines the width of the travel time distribution by analyzing both the mean and variance, offering insights into the variability of travel times. The schedule delay model incorporates the expected arrival time and penalizes deviations from this expectation, including both early and late arrivals, emphasizing the disutility associated with such schedule delays. Building on this, the mean-lateness model simplifies the schedule delay approach by focusing solely on late arrivals, considering travel time and lateness as the primary components of reliability. These models predominantly operate at the trip level, although some also account for bottlenecks at specific road sections and intersections [18,19,20]. Beyond the trip level, the network utility maximization model extends the analysis to the network scale, incorporating network structure and traveler behavior to evaluate reliability across broader transportation systems.
Recent advancements in TTR research have expanded beyond these traditional models, introducing innovative methodologies and broader network-level considerations. For instance, emerging theoretical frameworks leverage concepts from game theory, such as cumulative prospect theory, regret theory, and fuzzy set theory, to model traveler decision-making under uncertainty and evaluate the impact of TTR on route choice [4,21]. The integration of multi-dimensional uncertainty modeling has further enriched this field. Building on segment-level travel time distribution estimation methods, which utilize fourth-order moment reconstruction and Ford-Kroft expansion theory, researchers have transcended traditional normal distribution assumptions of mean–variance models to achieve non-parametric distribution characterization [22]. This allows for a more nuanced understanding of travel time variability. Additionally, the incorporation of fuzzy-possibility approaches introduces membership functions to quantify traffic state ambiguity, offering novel paradigms for nonlinear decision preference modeling. The network utility maximization model can also be combined with game-theoretic frameworks to analyze the dynamic impacts of multi-agent interactions on TTR through the Nash equilibrium, forming a more complete theoretical construct [23].
Empirical applications demonstrate remarkable adaptability across various scenarios. The homogeneous period identification method has validated the feasibility of micro–macro data fusion by quantifying bottleneck spatiotemporal characteristics in systems like Florida’s Strategic Transportation System using INRIX Traffic probe data [24]. Furthermore, leveraging ride-hailing origin–destination data has revealed negative correlations between Buffer Index (BI) and traffic demand elasticity in polycentric cities, providing quantitative foundations for effective demand management. The application of machine learning techniques, such as random forest models, has achieved up to 92% TTR prediction accuracy in urban contexts like Chicago, showcasing the advantages of processing multi-source heterogeneous data [25].
Emerging technologies are reshaping TTR research paradigms. Digital twin technology, combined with dynamic traffic assignment simulations, facilitates real-time sensing data that enable closed-loop validation of TTR models [26]. Blockchain applications in bottleneck governance automate congestion pricing through smart contracts, fostering decentralized governance mechanisms [27]. Federated learning frameworks further facilitate cross-regional collaborative TTR model training while preserving data privacy, effectively overcoming information silos [28].

2.2. Trajectory Data

Trajectory data, defined as the directed paths formed by the purposeful movement of objects in space, has emerged as a critical resource in the field of intelligent transportation systems (ITSs) [29]. Collected at regular time intervals, trajectory data typically feature three key attributes: the time of collection, the geographic coordinates of the moving object, and the motion state of said object, which can encompass speed, acceleration, and direction [30]. Based on acquisition methodologies, trajectory data can be categorized into three primary types: time-based, location-based, and event-based trajectories [31]. Among these, time-based trajectory data are particularly relevant for dynamic traffic analysis and prediction due to their temporal granularity.
Regarding analysis methods for trajectory data, modern trajectory analysis employs a multi-layered methodological framework encompassing data enrichment, pattern discovery, and predictive modeling. Innovative approaches address sparse sampling challenges, utilizing improved k-NN algorithms and geometric–topological mapping to achieve high accuracy in trajectory reconstruction [32]. Pattern mining techniques, such as weighted periodicity analysis, reveal critical insights into traffic behavior, while advanced predictive modeling innovations, including constrained LSTM-Quantile regression frameworks, enhance travel time estimation and routing efficiency [33].
The application of trajectory data in ITSs has gained increasing attention due to its ability to provide detailed and dynamic insights into traffic flow. Through comprehensive analysis and mining of trajectory data, researchers have identified the origins of traffic congestion [34] and localized the impact of special social events [35]. For instance, studies have demonstrated the effectiveness of trajectory data in pinpointing the spatial and temporal characteristics of congestion, offering valuable insights for urban traffic management [36]. Furthermore, trajectory data have been leveraged to monitor the influence of large-scale events, such as concerts or sports games, on surrounding traffic conditions, enabling more efficient traffic control measures [37]. Recent studies indicate that the spatiotemporal continuity of trajectory data enables path reconstruction through interpolation algorithms [9]. By constructing multimodal data sets that integrate kinematic variables and coupling them with the transportation environment, the interactions between traffic signals and road features can be reflected, thereby providing deeper insights into the dynamic characteristics of traffic flow and user behavior patterns [22,38].
Dynamic prediction of traffic flow and travel time is another critical area where trajectory data have shown significant promise. By analyzing historical trajectory data and integrating it with real-time information, researchers have developed models that can predict traffic conditions and travel times with greater precision [39]. These predictions are particularly useful for applications such as route guidance, congestion management, and travel time reliability estimation [40]. Recent advancements in data-driven methodologies, including machine learning and artificial intelligence techniques, have further enhanced the utility of trajectory data [41]. Deep learning models have been applied to mine complex patterns from trajectory datasets, enabling more accurate predictions of travel time reliability.
Emerging applications of trajectory data are evolving from descriptive analytics to prescriptive decision support systems. For instance, spatiotemporal clustering techniques identify origin–propagation patterns, enabling targeted mitigation strategies for congestion [42]. Additionally, dynamic origin–destination estimation based on license plate recognition achieves high accuracy in station-level traffic volume prediction, providing actionable insights for traffic management [43].
This study focuses specifically on time-based trajectory data as the primary research object. By employing data-driven methods, the research aims to dynamically estimate travel time reliability, addressing the inherent uncertainties in traffic systems. This approach not only builds on existing applications of trajectory data but also contributes to advancing the understanding of travel time reliability in intelligent transportation systems.

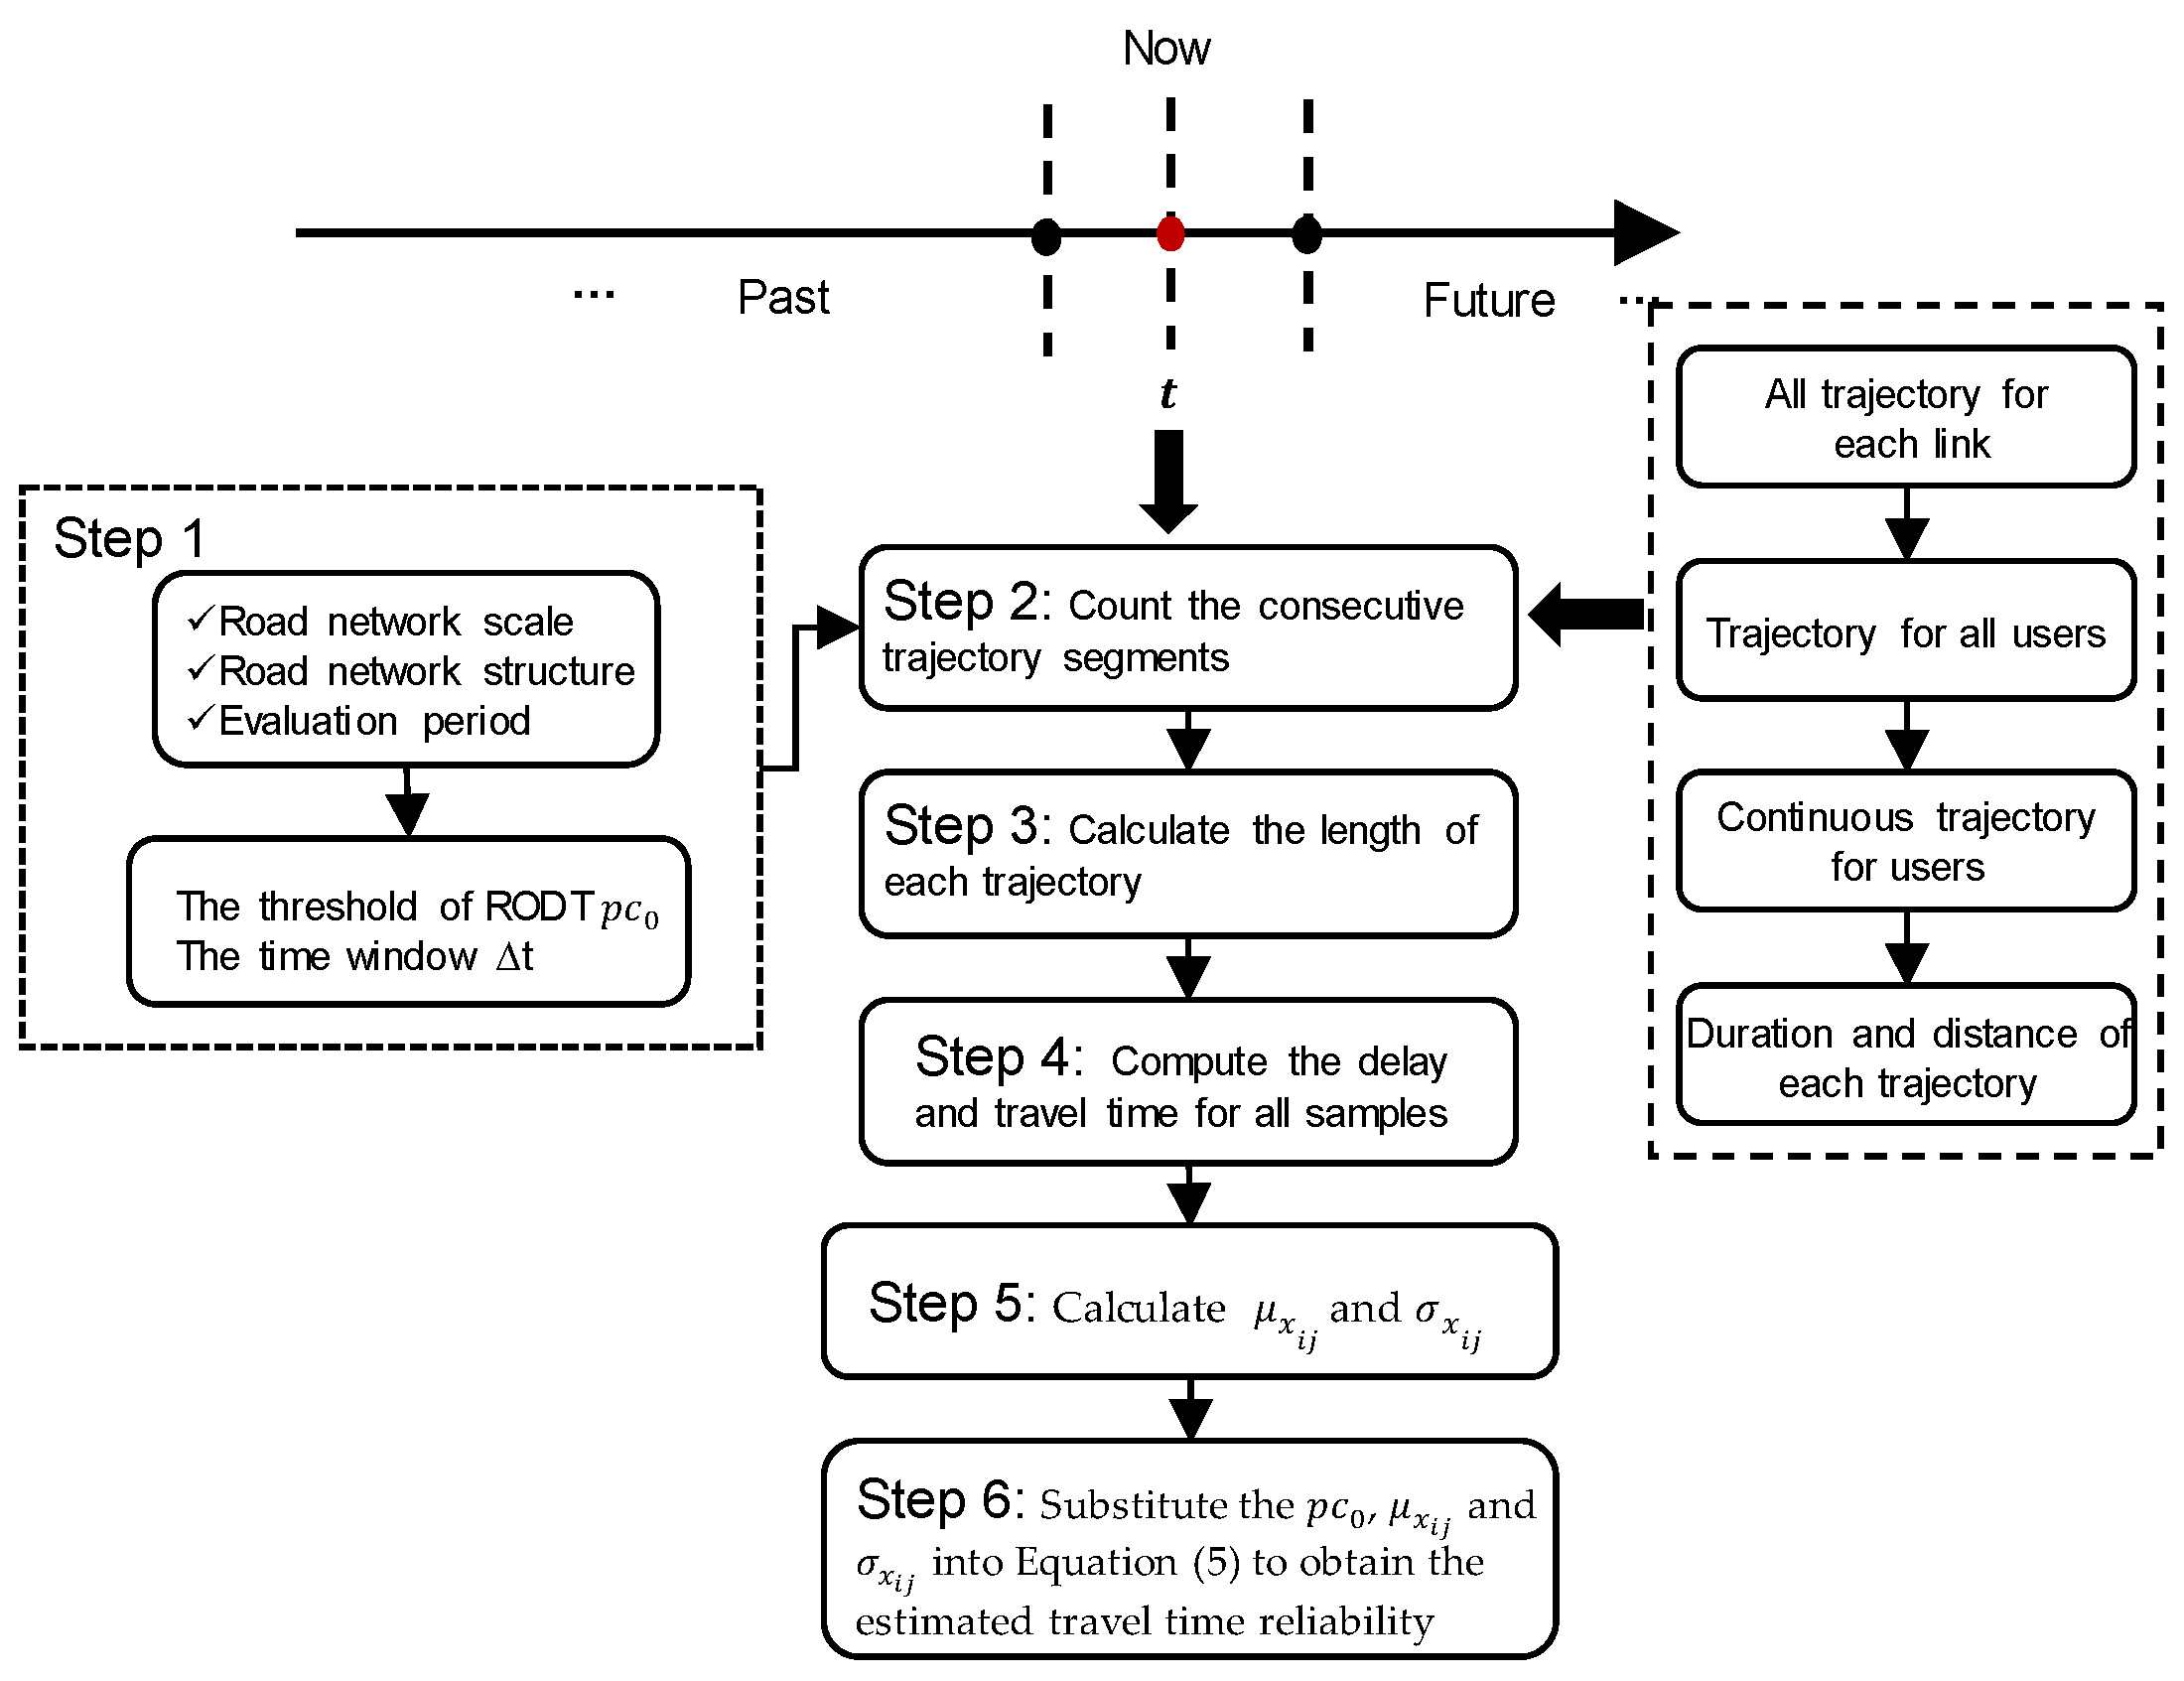
3. Dynamic Estimation Method of Travel Time Reliability by Trajectory Data

This study proposed a dynamic estimation method for the travel time reliability of a road network using trajectory data. This section first introduces the relevant variables and parameters required in this method, then the definition and theoretical calculation formula of travel time reliability are given, and finally the specific steps for the dynamic estimation of travel time reliability are presented.

3.1. Parameter Description

The parameters used in this study are described in Table 1. Model input is given in the parameters marked below “input”, and model output is given in the parameters marked below “output” in the following table.

3.2. Travel Time Reliability Estimation

It is often seen that travelers prefer to arrive at their destination at the expected time, and reducing the travel time fluctuation is more beneficial to travelers than reducing the expected travel time [44,45]. The travel time of travelers is mainly composed of delay and of time under free flow [22]. The fluctuation of delay leads to obvious changes in travel time [46]. Common assumptions regarding travel time distributions include the normal distribution, log-normal distribution, gamma distribution, exponential distribution, and mixed distributions [26]. Similarly, studies on delay distributions have explored models such as the normal distribution, log-normal distribution, and generalized extreme value (GEV) distribution [47,48]. In this study, the ratio of delay to travel time (RODT) is employed as an indicator of trip reliability. Intuitively, a smaller ratio indicates lower additional time cost losses for travelers. Here, it is hypothesized that the RODT follows a normal distribution. Based on this assumption, the study investigates the reliability of travel time within the road network. In subsequent experiments, the validity of this hypothesis will be analyzed and verified.
A threshold of the ratio of delay to travel time ( p c 0 ) is given. It is defined that the travel is reliable when the RODT is less than or equal to the threshold; conversely, when the RODT is greater than a given threshold, the travel is unreliable.
System reliability refers to the ability (or probability) of a system to perform a specified function within a predetermined time. Referring to system reliability theory, the quantification of travel time reliability is shown in Figure 1. The true value of travel time reliability refers to the proportion of vehicles that leave the road network with reliable travel during the i -th time window. The calculation formula is
R ( i ) = n i N i
During the continuous time window t , the estimated value of travel time reliability when given the threshold of RODT is as follows:
R ( i ) ¯ = F x = p c 0 = p x p c 0 = 0 p c 0 f ( x ) d x
Higher travel time reliability indicates a greater likelihood that the actual travel time will be less than or equal to the expected travel time. Meanwhile, higher travel time reliability signifies smaller fluctuations in travel time within the road network and a higher level of service in the transportation system.
The continuous time t is divided into equal lengths t according to the data-driven method, where i is the i -th time window, and i = 1,2 , 3 . The vehicle trajectory data are collected during every time window t . The RODT in the network is taken as a population. It is assumed that the RODT X obeys a normal distribution, that is, X ~ N ( μ , σ 2 ) . The RODT collected during the i -th time window is a sample of the population. The number of the sample x i j is w i . The mean of sample x i j obeys the normal distribution, that is, μ x i j ~ N ( μ , σ 2 w i ) , and the variance of the sample x i j is σ x i j . Thus, the estimated values of μ x i j and σ x i j are as follows:
μ x i j = μ
σ x i j = σ w i
The mean μ and variance σ 2 of the population X are calculated according to Equations (3) and (4), respectively. Subsequently, the estimated value of travel time reliability during the i -th time window is calculated by the following:
R ( i ) ¯ = P x p c 0 = 1 2 π σ 0 p c 0 e ( x μ ) 2 2 σ 2 d x
In practical applications, the determination of p c 0 plays a critical role in assessing the travel time reliability of road networks. When the probability distribution of RODT is known, a smaller p c 0 corresponds to a lower value of P x p c 0 . If p c 0 is set to 1, the travel time reliability of the road network will always equal 1, regardless of traffic conditions, which is clearly unreasonable. We propose that, given a parameter ω 0 < ω < 1 , if there exists an x ω such that p ( x x ω ) = ω , then p c 0 = x ω . The determination of ω is influenced by factors such as city size, road network structure, and peak-hour traffic conditions. In this study, we set the p c 0 corresponding to ω = 0.75 as the threshold of RODT for experimental analysis. The process of estimating the travel time reliability using trajectory data is shown in Figure 2.
Step 1: Determine the threshold of RODT and the time window t . In practical applications, the selection of the time window t can be based on the frequency of analyzing the travel time reliability of the road network as needed.
Step 2: Count the consecutive trajectory segments within each time window t . It is important to note that during a single time window, a vehicle may have more than one consecutive trajectory segment. In such cases, each consecutive trajectory segment is considered a sample. The update frequency of vehicle trajectory data is 5 s, which is shorter than the time window t .
Step 3: Calculate the length of each trajectory based on its latitude and longitude coordinates.
Step 4: Compute the delay and travel time for all samples within each time window t . The travel time is defined as the difference between the start and end times of a consecutive trajectory. The driving time can be obtained based on the trajectory distance and free-flow speed, and the delay is calculated as the travel time minus the driving time.
Step 5: Calculate the μ x i j and σ x i j for all samples within each time window t .
Step 6: Substitute the threshold for RODT, μ x i j and σ x i j into Equation (5) to obtain the estimated travel time reliability of the road network during the i -th time window.

4. Result and Discussion

4.1. Data Source

The data in this study are time-based trajectory data. There are three main data sources. The relevant parameters are shown in Table 2. Source 1 is the data of an approximately homogeneous road network area in Shanghai, and the sampling frequency is 120 s. The data of the real-road network are used to verify the hypothesis that RODT obeys the normal distribution. The trajectory data are from 4 normal days of a road network in Huangpu District, Shanghai, as shown in Figure 3. The data acquisition time is shown in Figure 4.
Source 2 consists of individual driving trajectory data from a real-world road network, collected during the COVID-19 pandemic. The outbreak of COVID-19 in China began in Wuhan at the end of 2019. By May 2020, the situation in Wuhan had improved, and the country gradually resumed normal daily activities. Therefore, the data used in this study reflect the distribution characteristics of the ratio of delay to travel time during the period of recovery following the resumption of regular work and daily life.
Source 3 is the vehicle trajectory data recorded and exported from the micro-simulation, and the sampling frequency is 60 s. The traffic data from micro-simulation are utilized to analyze the variation characteristics of the travel time reliability and the applicability of the proposed method. The road network, vehicle speed, detector location and other relevant information for the micro-simulation are shown in Figure 5.
A 3 × 3 grid road network was constructed for experimental simulations to examine how travel time reliability varies under different road network capacities. Since signal timing cycles influence road network capacity, this study uses signal cycles of 60 s, 90 s, and 120 s to represent low, medium, and high capacities, respectively. Additionally, the accuracy of travel time reliability estimation was analyzed under varying trajectory data penetration rates.

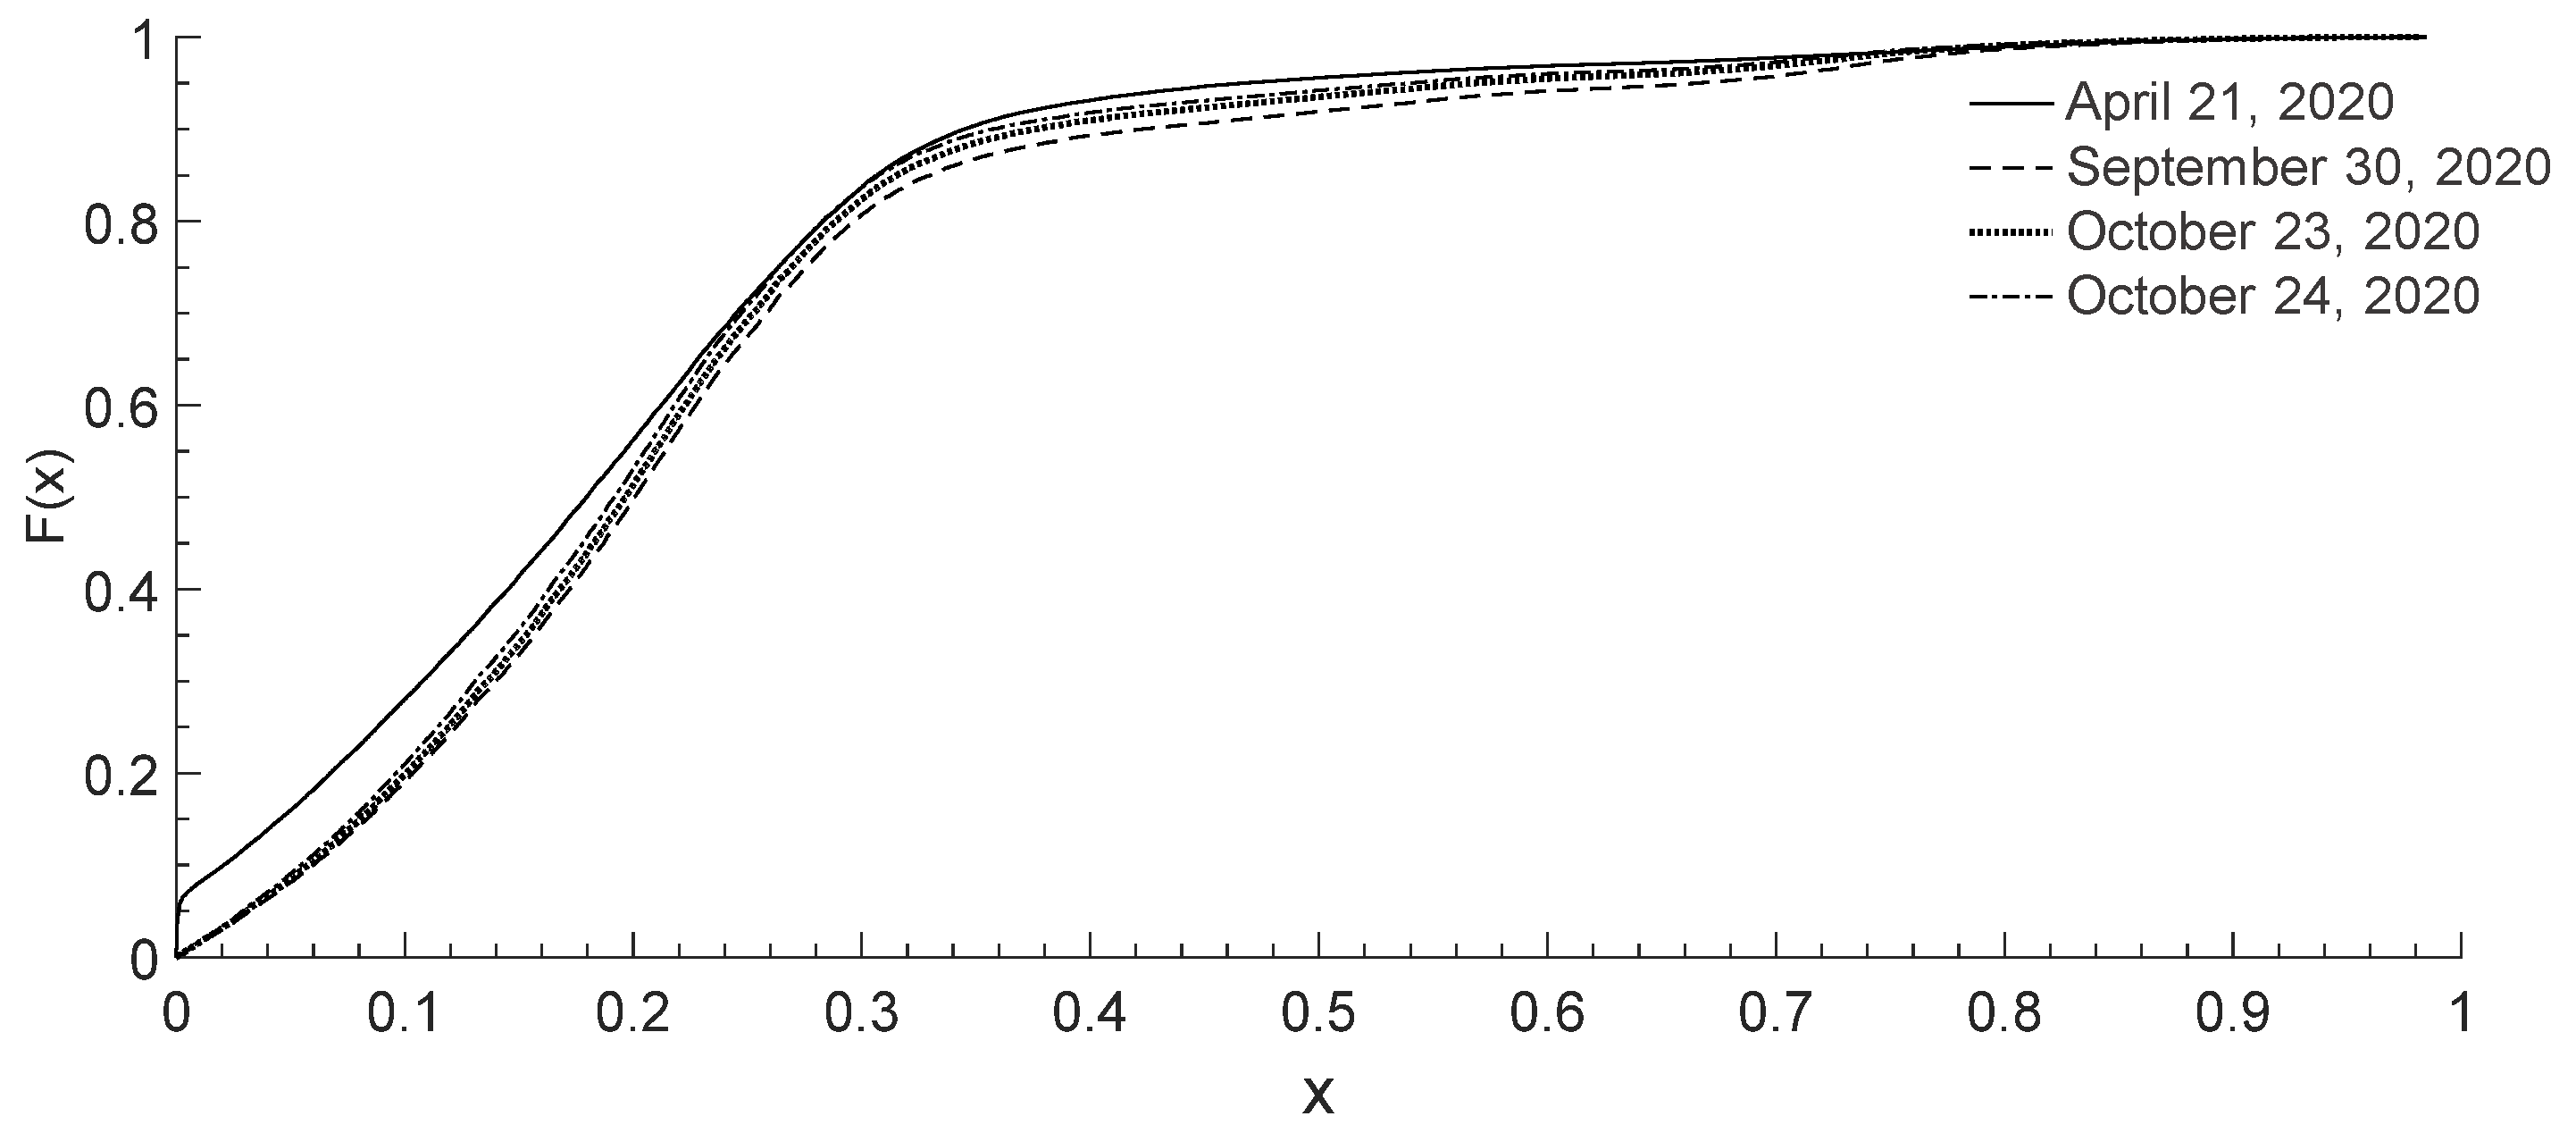
4.2. Hypothesis Verification

The proposed dynamic estimation method for travel time reliability is based on the assumption that the ratio of delay to travel time (RODT) follows a normal distribution. Therefore, prior to validating the effectiveness of the method, an analysis of the experimental data is conducted. A normal distribution fitting is performed on the RODT values of all vehicles. If the RODT exhibits strong characteristics of a normal distribution, the assumption is deemed acceptable; otherwise, the assumption is invalid, and the proposed dynamic estimation method will not hold.
The results of hypothesis verification are shown in Figure 4. The fitting results of RODT are presented in Table 3. The RODT data were fitted to a normal distribution, and the log-likelihood values indicate that the normal distribution provides a good fit to the observed data. However, the theoretical range of the normal distribution ( < y < + ) is not entirely consistent with the non-negative nature of RODT. This inconsistency was mitigated through a preprocessing step, ensuring that only non-negative values were used during the fitting process.

4.3. Applicability Analysis of the Proposed Method

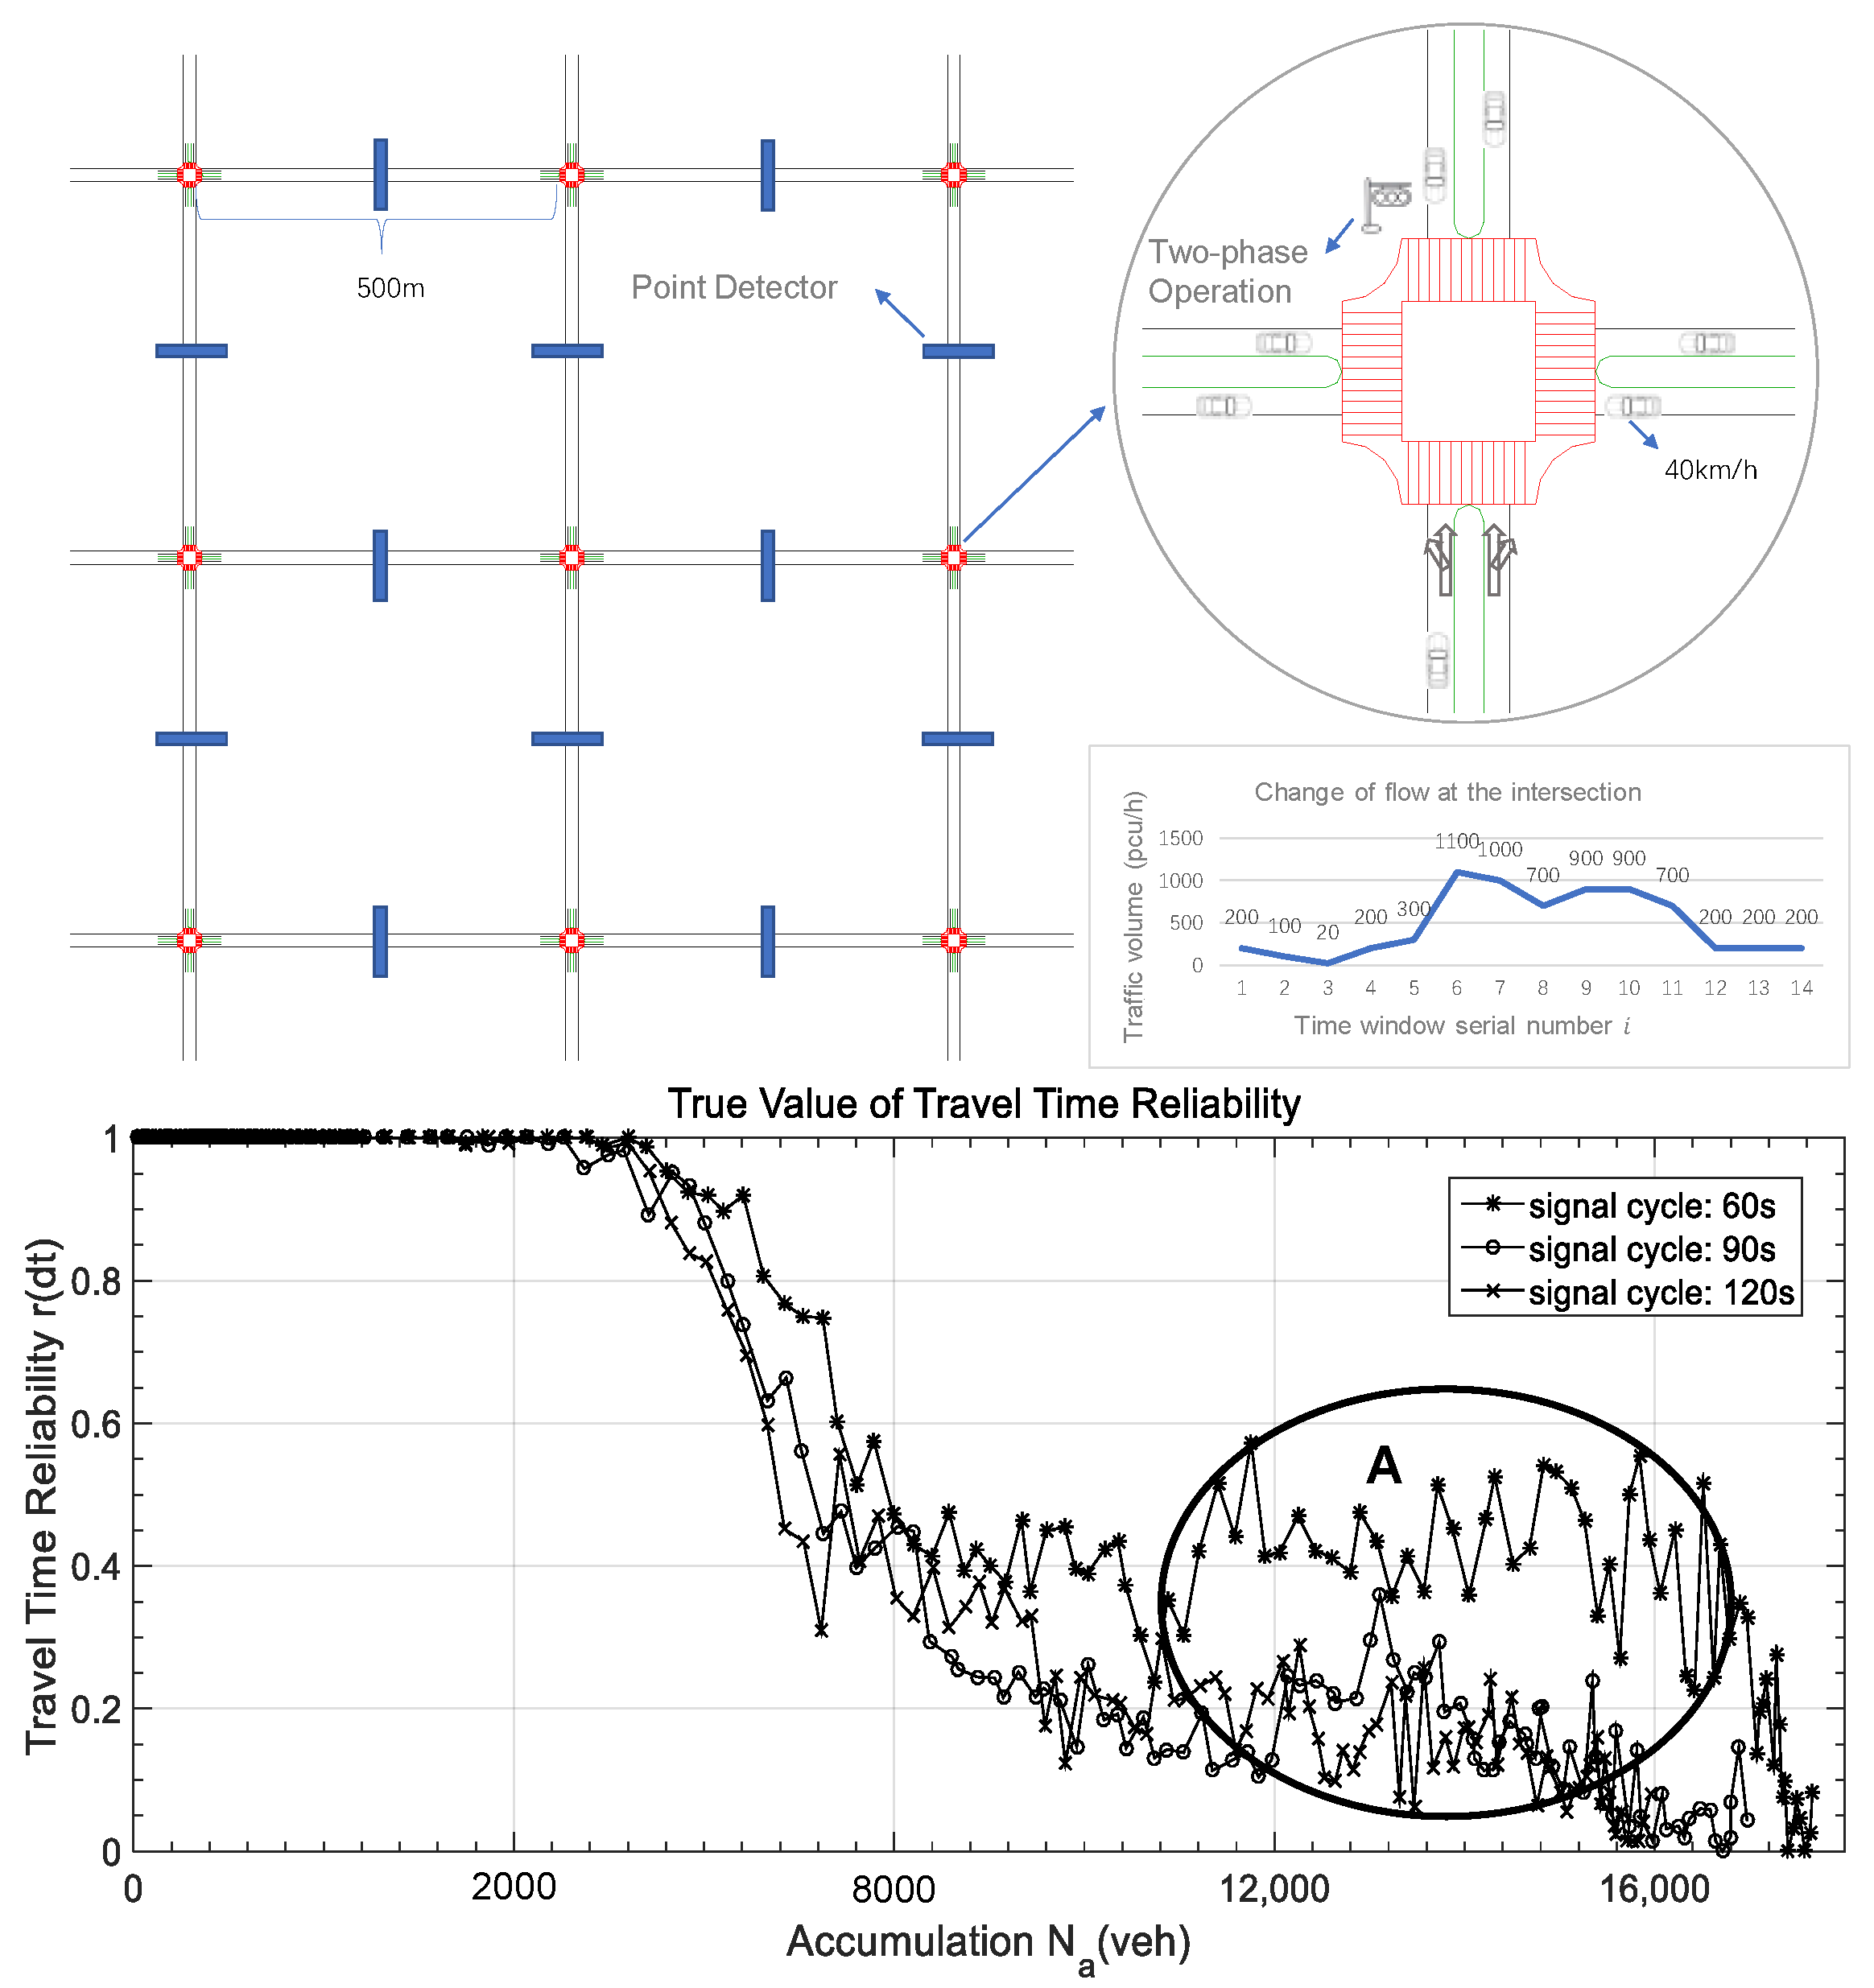
4.3.1. True Value of Travel Time Reliability Under Different Road Network Capacities

To validate the accuracy of the proposed model, an error analysis was conducted by comparing the estimated travel time reliability with the true values. To perform this analysis, the true values were first calculated using Equation (1) for each time window. Figure 5 presents a schematic diagram of the road network used in the simulation case, along with the variation in true travel time reliability values under different road network capacities.
Figure 5 illustrates the relationship between vehicle accumulation in the road network and the true travel time reliability under signal cycles of 60 s, 90 s, and 120 s, respectively. During the initial stages of vehicle accumulation, the vehicle density is low, resulting in a true travel time reliability value of 1. This indicates that when the number of vehicles in the road network is small, the RODT for vehicles exiting the network remains below the threshold, ensuring reliable travel conditions.
As the accumulation of vehicles in the road network gradually increased, and the number of vehicles exceeded a certain value, the reliability decreased rapidly. The circled area A in Figure 5 shows that when the accumulation of vehicles in the road network was large, that is, when the number of vehicles in the road network was large enough to cause congestion, the travel time reliability with a signal cycle of 60 s was higher than that with signal cycles of 90 s and 120 s. This shows that the road network with smaller capacity could better adapt to the congested traffic flow.

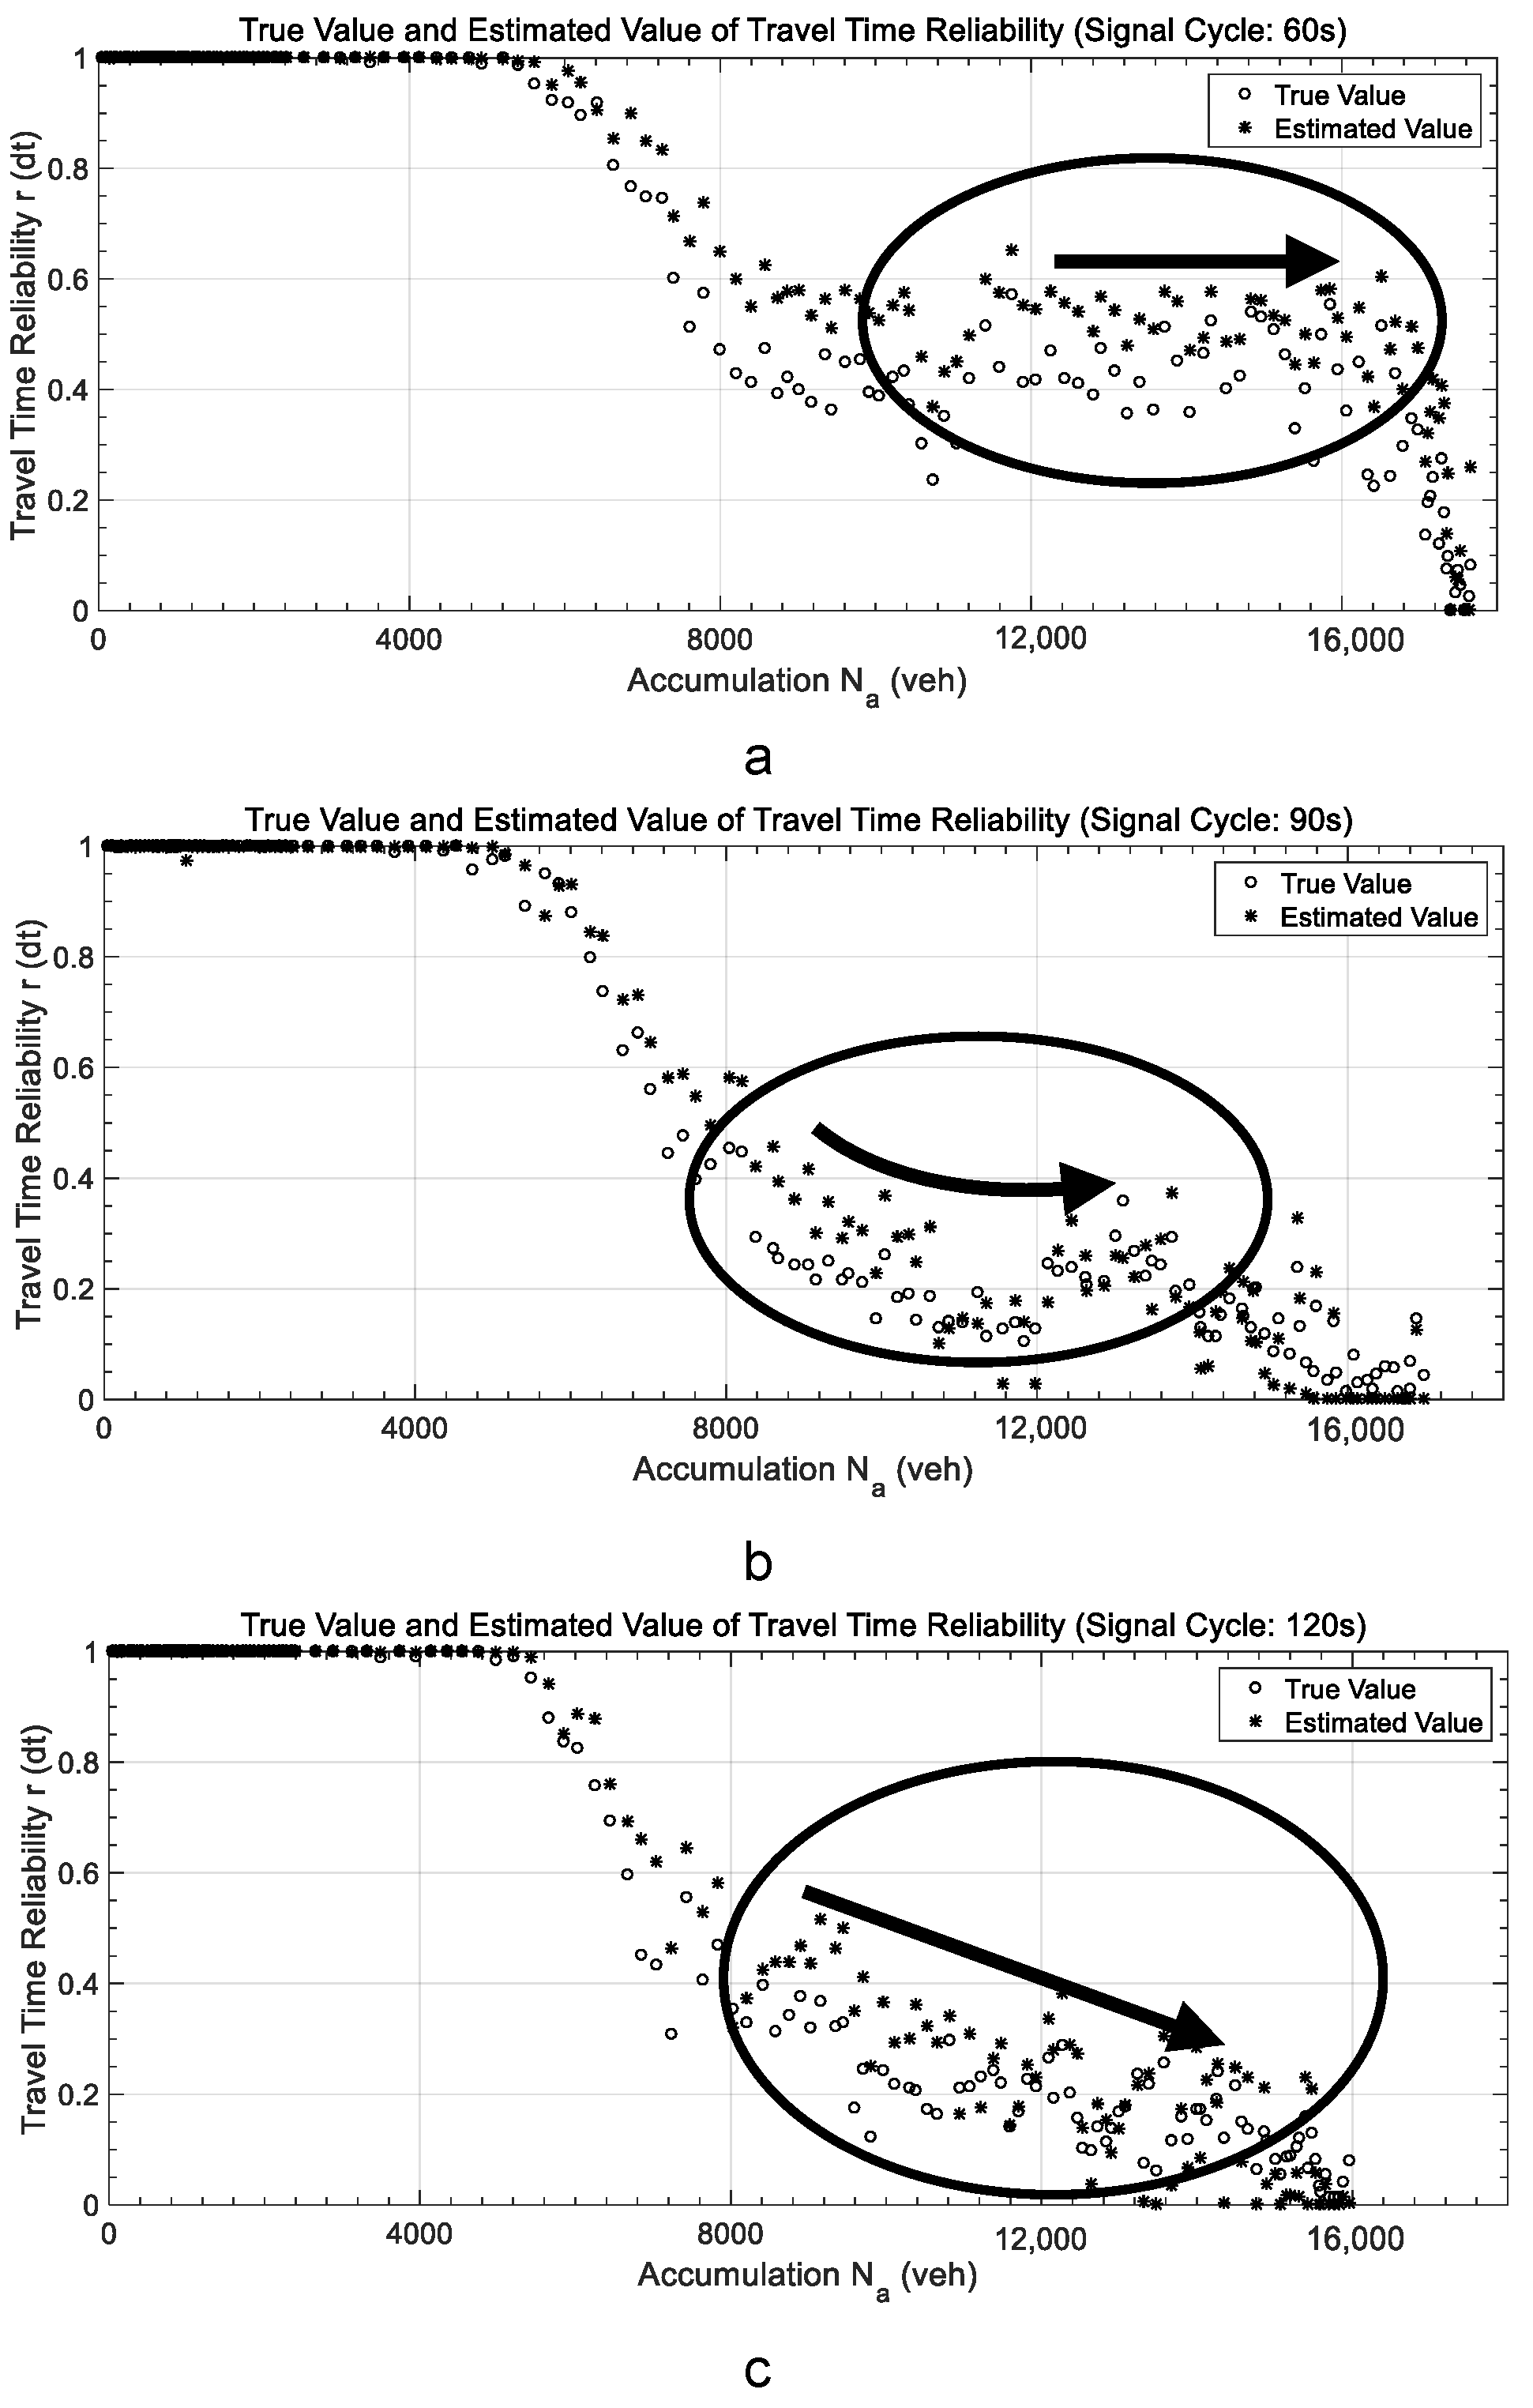
4.3.2. Estimated Value of Travel Time Reliability Under Different Road Network Capacities

Figure 6 shows the comparison between the true value and the estimated value of travel time reliability under different signal cycle lengths. As shown in Figure 6a, when the vehicle density in the road network was low, the estimated value of travel time reliability was consistent with the true value, both being 1. With the continuous increase in vehicle accumulation, the traffic flow gradually approached saturated flow, and the vehicles began to be congested. As shown in Figure 6a–c, when the accumulation exceeds five thousand, the value of travel time reliability decreases rapidly from 1, and the overall change trend was consistent. However, the estimated value was slightly larger than the true value. When the vehicle density in the road network further increased, the traffic flow gradually reached oversaturated flow. As shown in Figure 6a, when the cumulation of vehicles exceeds sixteen thousand, the reliability value rapidly decreases from 0.5 to 0. As shown in Figure 6b,c, when the cumulative amount of vehicles approaches sixteen thousand, the reliability decreased to 0. It is concluded that the travel was unreliable during this period, and the RODT of vehicles exiting the network was larger than the threshold of ROTD. Figure 6b,c show the comparison between the estimated value and the true value of travel time reliability under the circle length of 90 s and 120 s. The error analysis between the estimated value and the true value of travel time reliability under different cycle lengths is discussed in detail in the next section.
As shown by the arrow curve in Figure 6, when vehicle accumulation in the road network exceeded a certain threshold, travel time reliability remained stable despite further increases in vehicle accumulation under a signal cycle length of 60 s. For a cycle length of 90 s, reliability initially decreased, then increased, but ultimately dropped sharply to 0 as vehicle accumulation continued to rise. In contrast, under a cycle length of 120 s, travel time reliability steadily declined with increasing vehicle accumulation until it reached 0.
In accordance with this analysis, it is concluded that in a highly saturated or oversaturated network state, the road network was more reliable with a short signal cycle length. Comparing the reliability under a signal cycle length of 90s to that under a signal period of 120 s, the road network with a short cycle length could quickly adapt to the congested traffic flow state, and then automatically adjust to restore the reliability to a certain extent. However, the travel time reliability with a long cycle length kept decreasing as the traffic flow gradually became saturated.

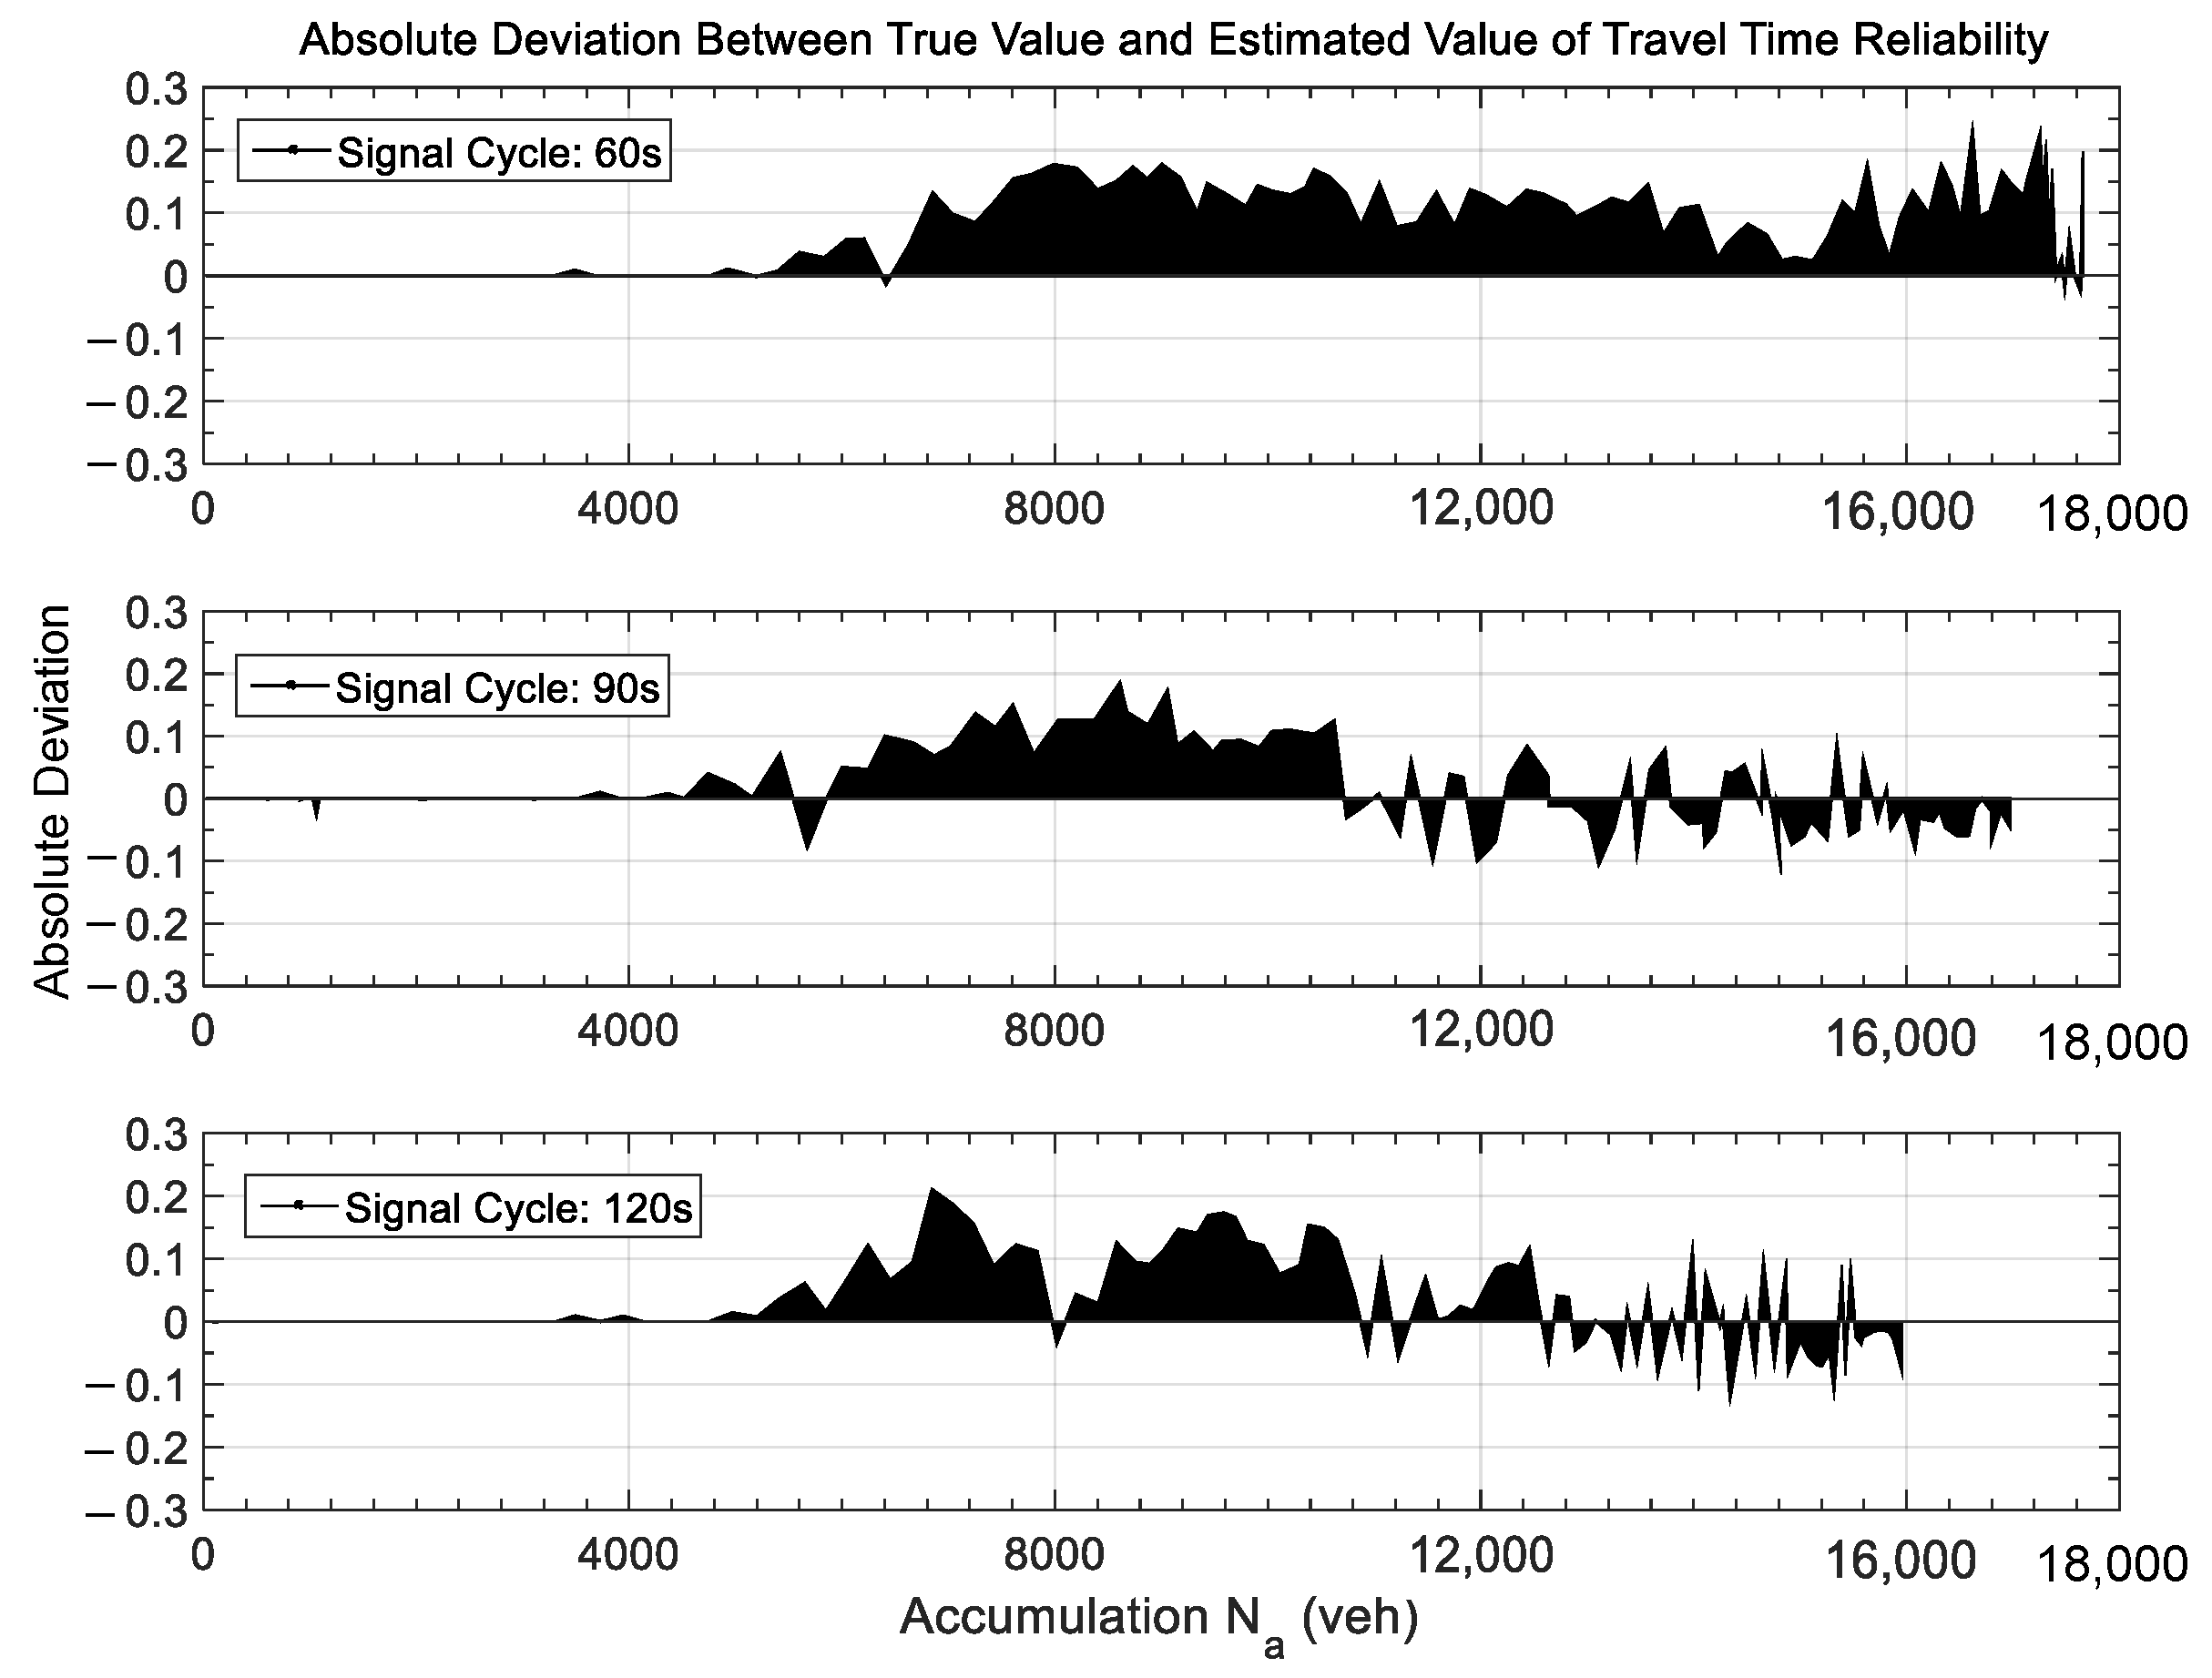
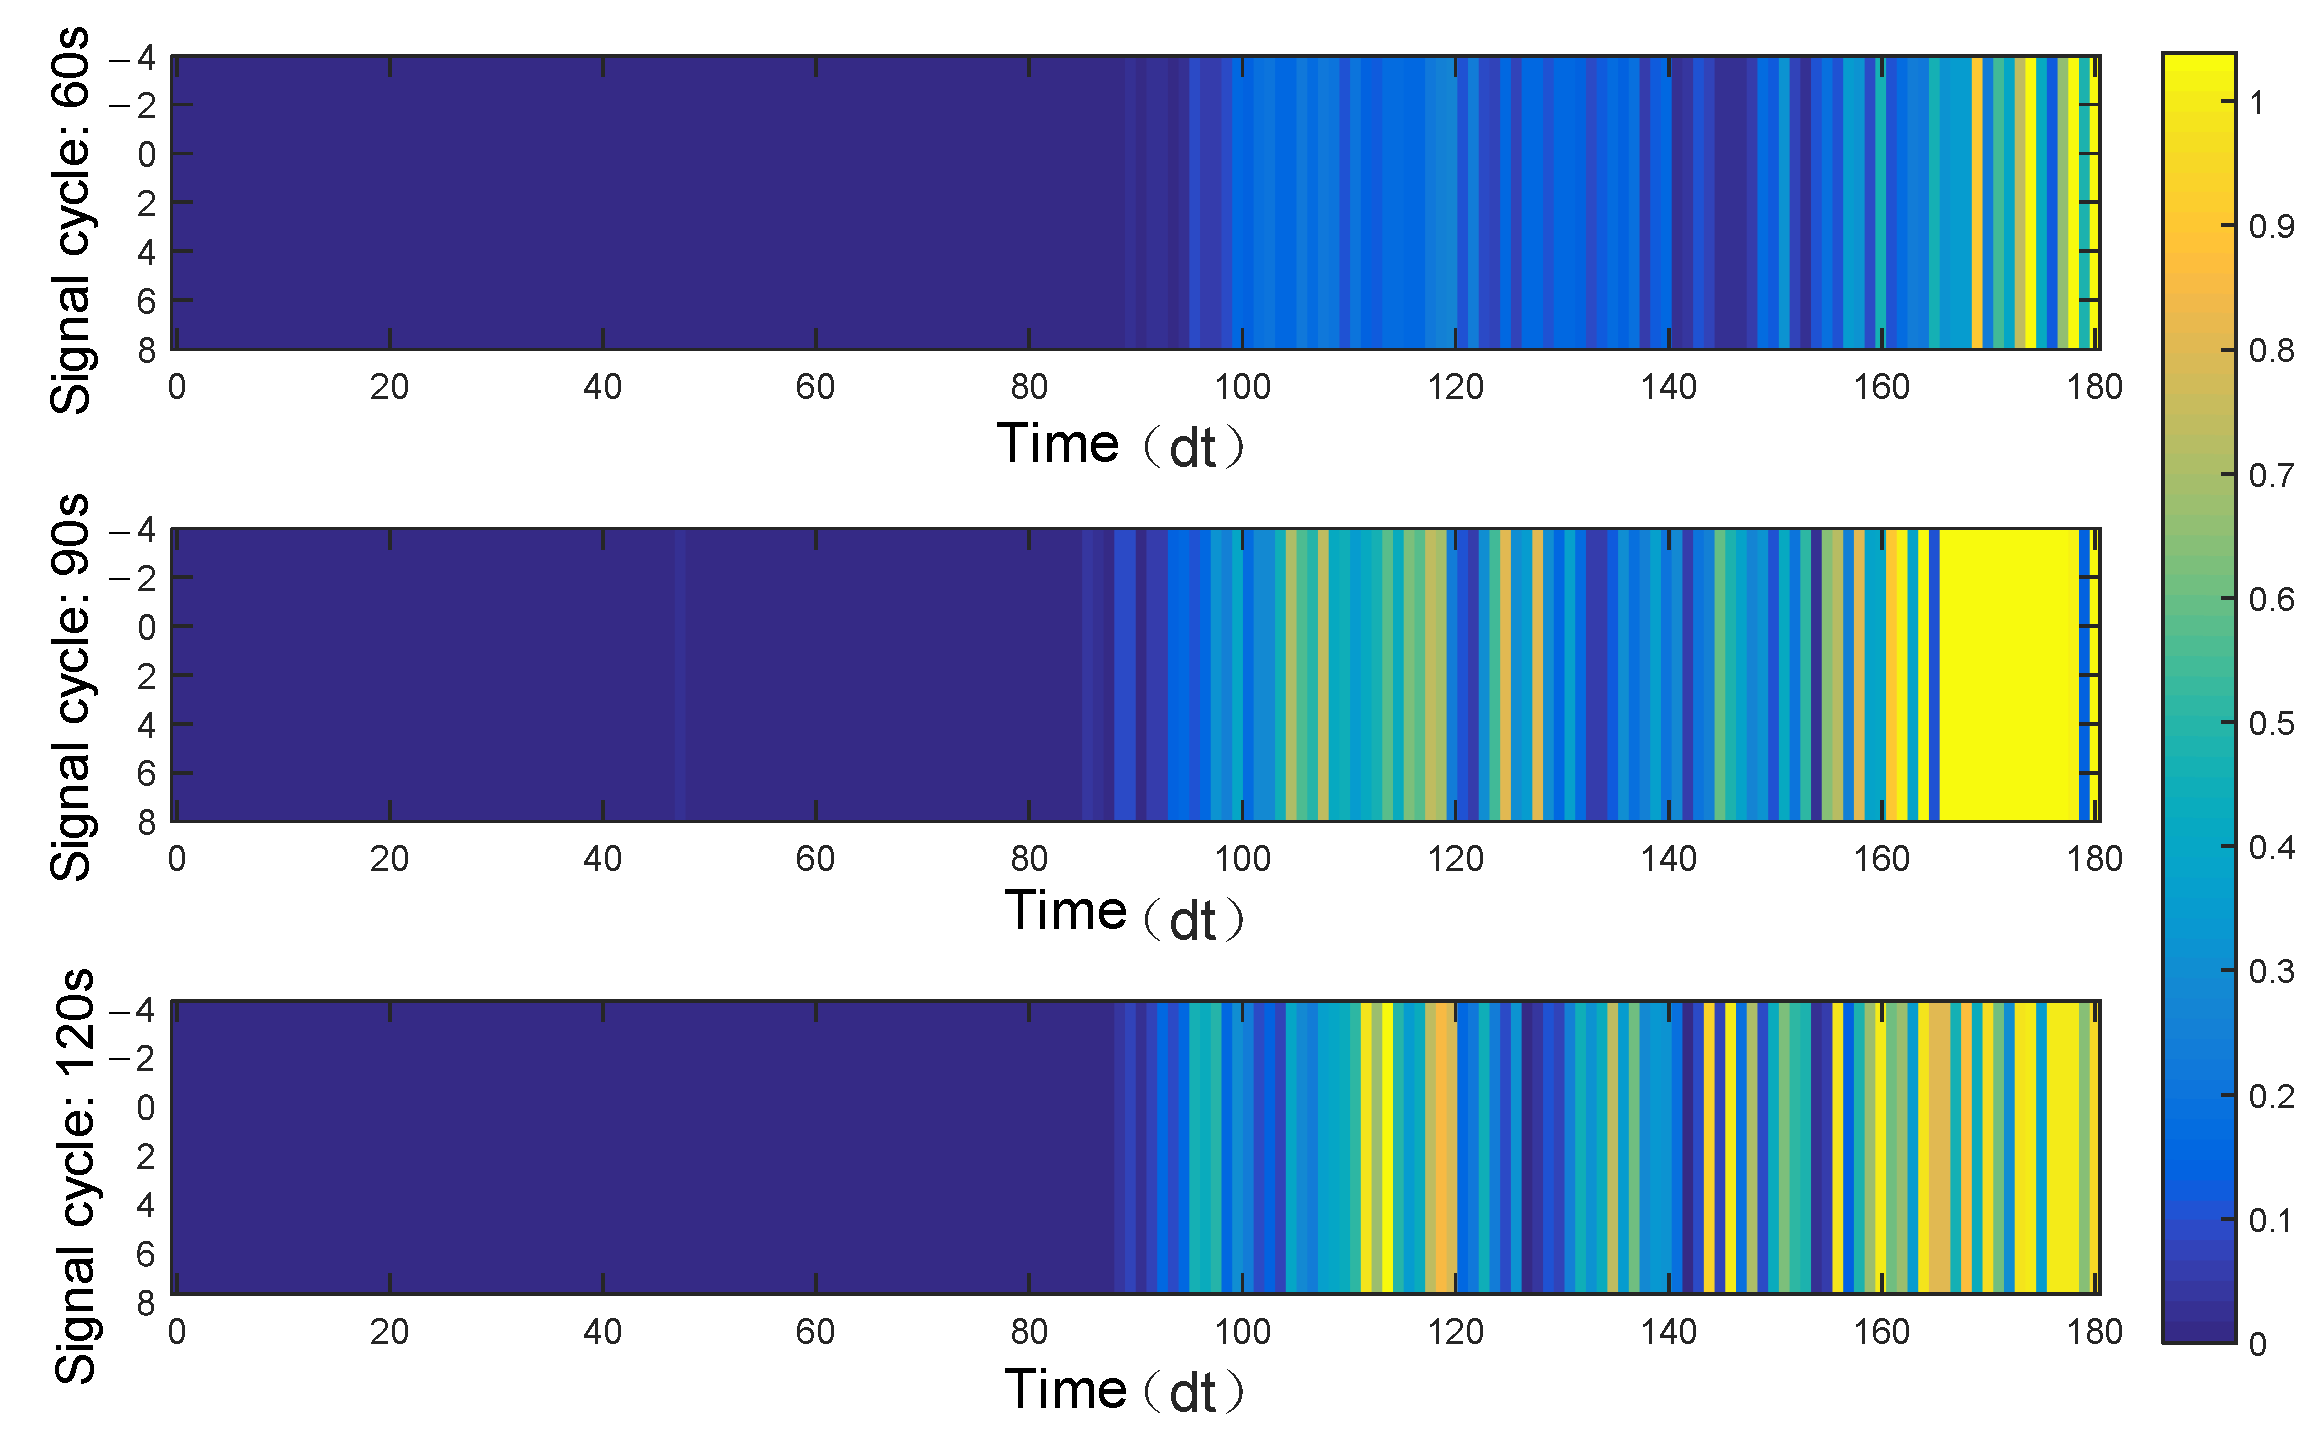
4.3.3. Error Analysis Between Estimated Value and True Value of Travel Time Reliability

The estimated value of travel time reliability obtained by the proposed method driven by the trajectory data can reflect the rule of change of network reliability. An error analysis between the estimated value and the true value was performed, and the results are shown in Figure 7 and Figure 8.
Figure 7 and Figure 8 show the mathematical error between the estimated value and the true value of travel time reliability. It can be concluded from Figure 7 that when vehicle density was low in the network, the absolute error of travel time reliability was basically 0. The estimated value of reliability produced an absolute error with increasing vehicle accumulation in the road network. The absolute error of the estimated value under a signal cycle length of 60 s was significantly higher than that of the other two cycle lengths. Under the condition of traffic congestion, the absolute error became smaller under a signal cycle length of 90 s and 120 s, and the absolute deviation when the signal period was 60 s was still large. However, the absolute error under the three signal periods was less than 0.23.
Figure 8 is a color difference diagram of the relative error between the estimated and the true value. The color axis represents the size of the error. A dark color indicates a small error, while light color indicates a large error. The picture shows that the relative error for a signal cycle length of 90 s and 120 s was significantly larger than that for 60 s. This is because when the cycle length was 90 s and 120 s, the true value was significantly smaller than the true value under the cycle length of 60 s. The relative error was obtained by dividing the absolute error by the actual value. In the case of equal absolute errors, the smaller the true value, the larger the relative error.

4.3.4. Estimated Value of Travel Time Reliability Under Different Trajectory Data Penetration Rates

As shown in area A in Figure 9, the estimated values obtained at 100% data penetration were slightly higher than the true value, and the other estimated values were significantly lower than the true value. However, with further increase in vehicle density on the road network, the estimated value of travel time reliability driven by trajectory data was generally higher than the true value. According to this rule, the estimated value of travel time reliability can be revised to obtain a more accurate estimate. As shown in Figure 10, the error of travel time reliability under 100% data penetration rate was the smallest. The absolute errors under different data penetration rates were less than 0.3. It is concluded that the dynamic estimation of travel time reliability for a road network driven by trajectory data is reasonable.

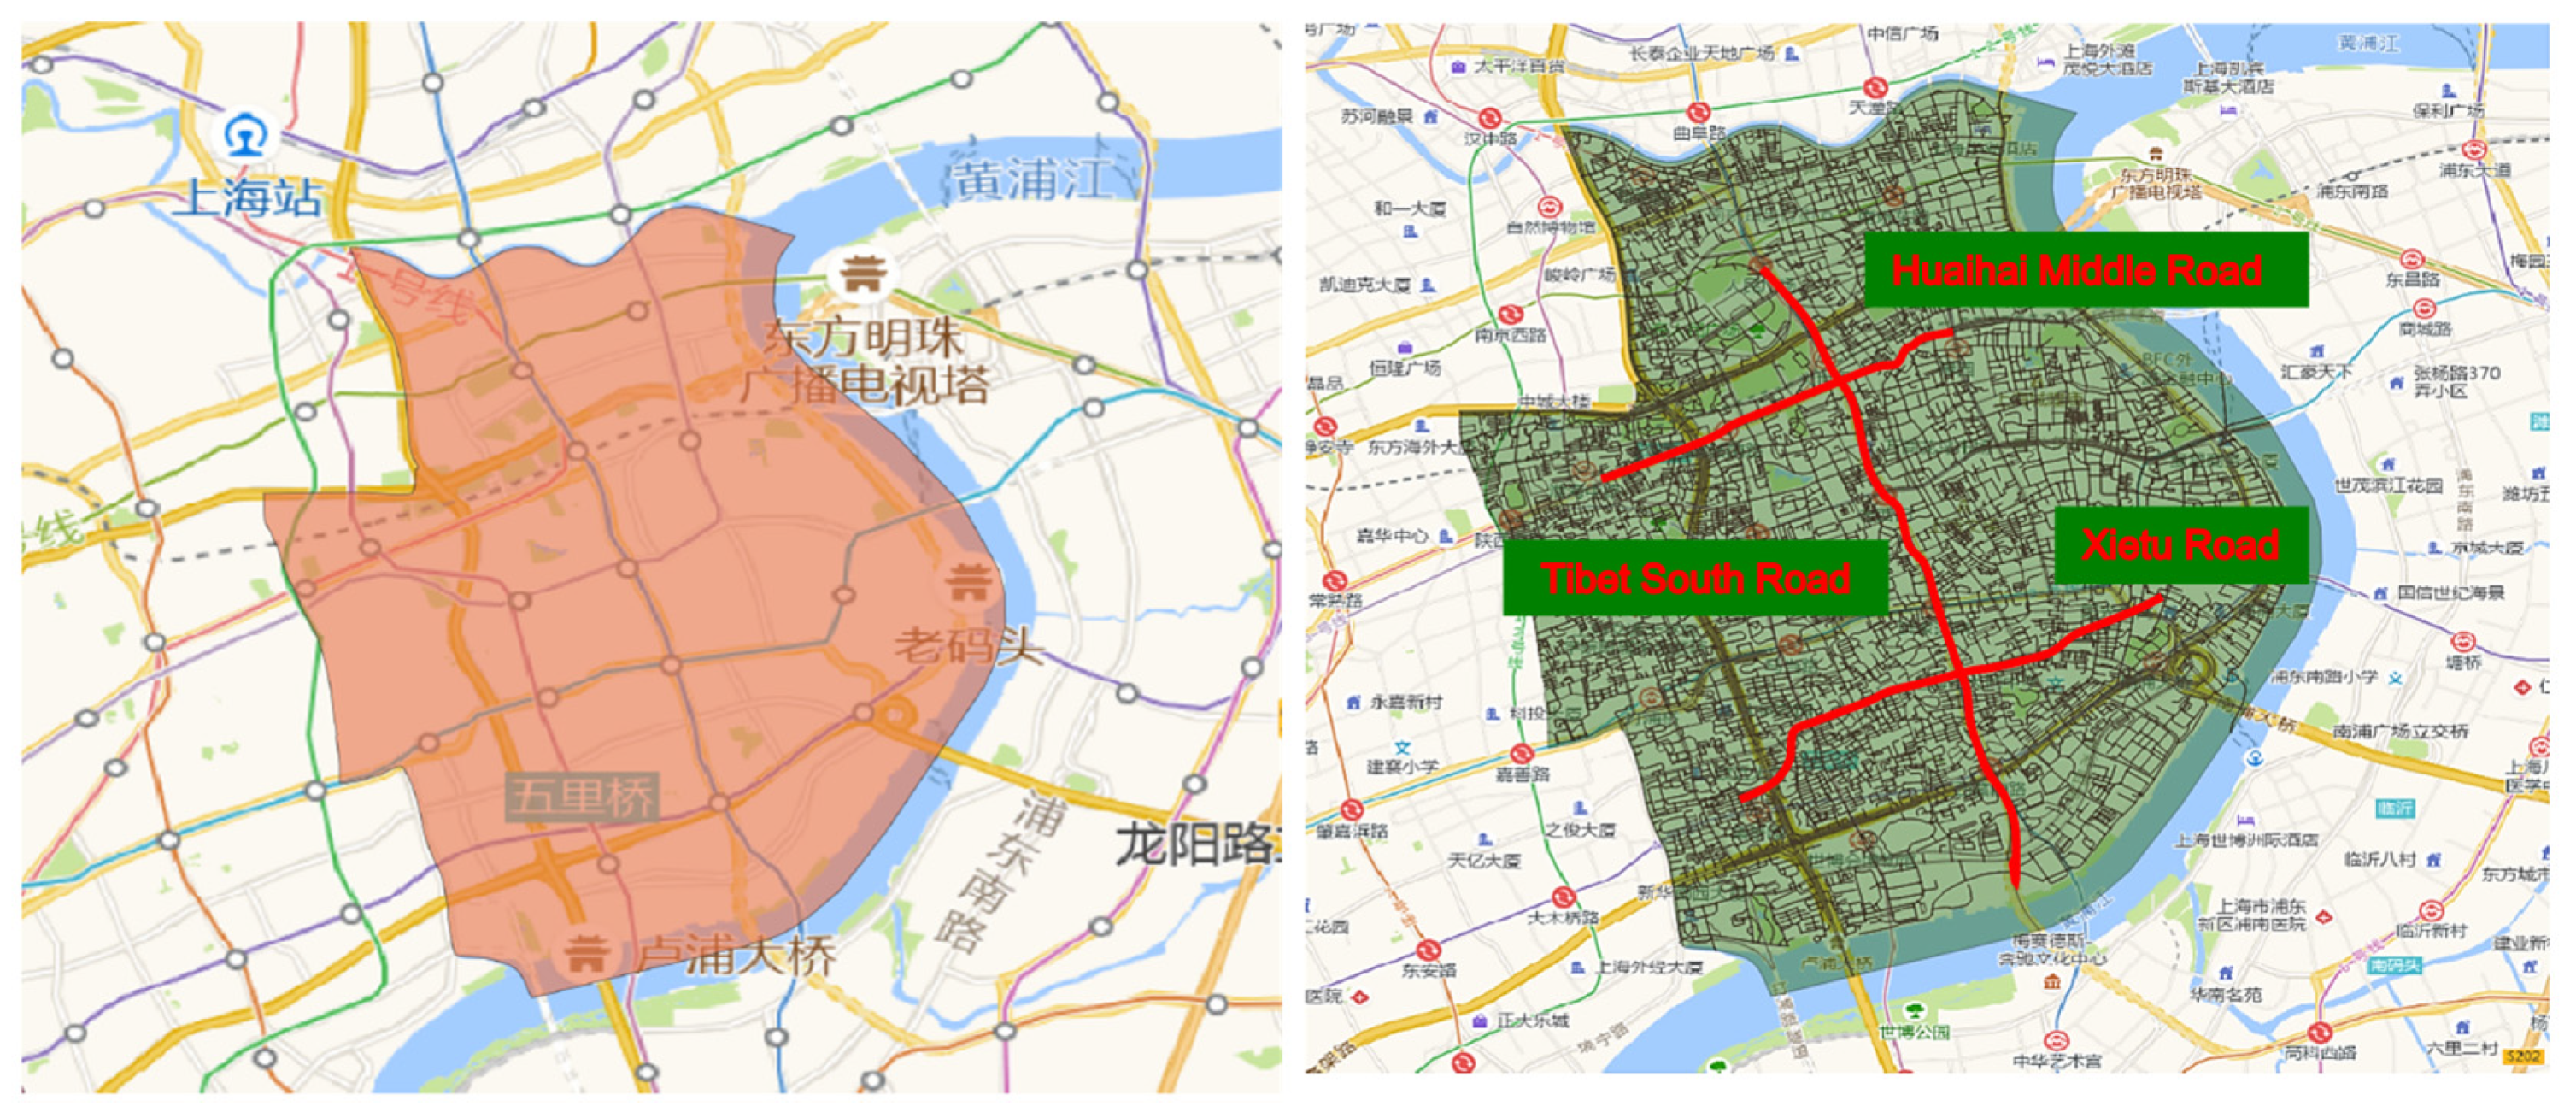
4.4. Travel Time Reliability of Real-World Road Network

In this section, based on these trajectory data, the proposed method is applied to dynamically estimate the dynamic travel time reliability of the real-word road network. This study conducted travel time reliability estimation for three specific roads as well as for the entire road network. The three selected roads are Tibet South Road, Huaihai Middle Road, and Xietu Road. Tibet South Road is a major arterial road with a high traffic volume, Huaihai Middle Road is a commercial street with mixed traffic patterns, and Xietu Road is a secondary road with moderate traffic flow. Geographically, Tibet South Road runs in the north–south direction, while Huaihai Middle Road and Xietu Road run in the east–west direction, all of which traverse the trajectory data coverage area. These three road segments contain a large number of continuous trajectory fragments, ensuring reliable data quality.
Figure 11 illustrates the trend of travel time reliability across four specific days for Tibet South Road, Huaihai Middle Road, Xie Tu Road, and the overall road network. To better capture the characteristics of traffic flow, the selected days include a weekday, the day before the National Day holiday, the day before a weekend, and a Saturday. These dates correspond to 21 April, 30 September, 23 October, and 24 October 2020, respectively. Based on the data presented in Figure 11, the travel time reliability trends for individual roads closely align with the overall trend observed for the road network. Additionally, travel time reliability is generally higher during the day compared to the nighttime.
Figure 12 presents travel time reliability across four specific days. A comparison of the three roads reveals that Huaihai Middle Road consistently exhibits higher travel time reliability compared to the other roads. These four days occurred during the COVID-19 pandemic, with 21 April representing a severe stage of the outbreak and October reflecting a period of relief. The analysis indicates that travel time reliability improved as the pandemic situation eased. Additionally, the data show that travel time reliability is higher during the day than at night, suggesting that the road network operates more efficiently during daytime hours.
In summary, it can be concluded that the dynamic estimation method of travel time reliability based on trajectory data proposed in this study can estimate the travel time reliability of the road network. It provides a basis for further evaluating the operational efficiency of the road network during different periods.

5. Conclusions

This study proposes a method for dynamically estimating travel time reliability in road networks using trajectory data. The study investigates changes in travel time reliability under low-, medium-, and high-road-network-capacity conditions and conducts an error analysis of the reliability estimates. Furthermore, the accuracy of the estimates is analyzed under varying penetration rates of trajectory data. Finally, the method is applied to dynamically estimate travel time reliability in a real-world road network based on trajectory data. The conclusions of the study are summarized as follows:
(1)
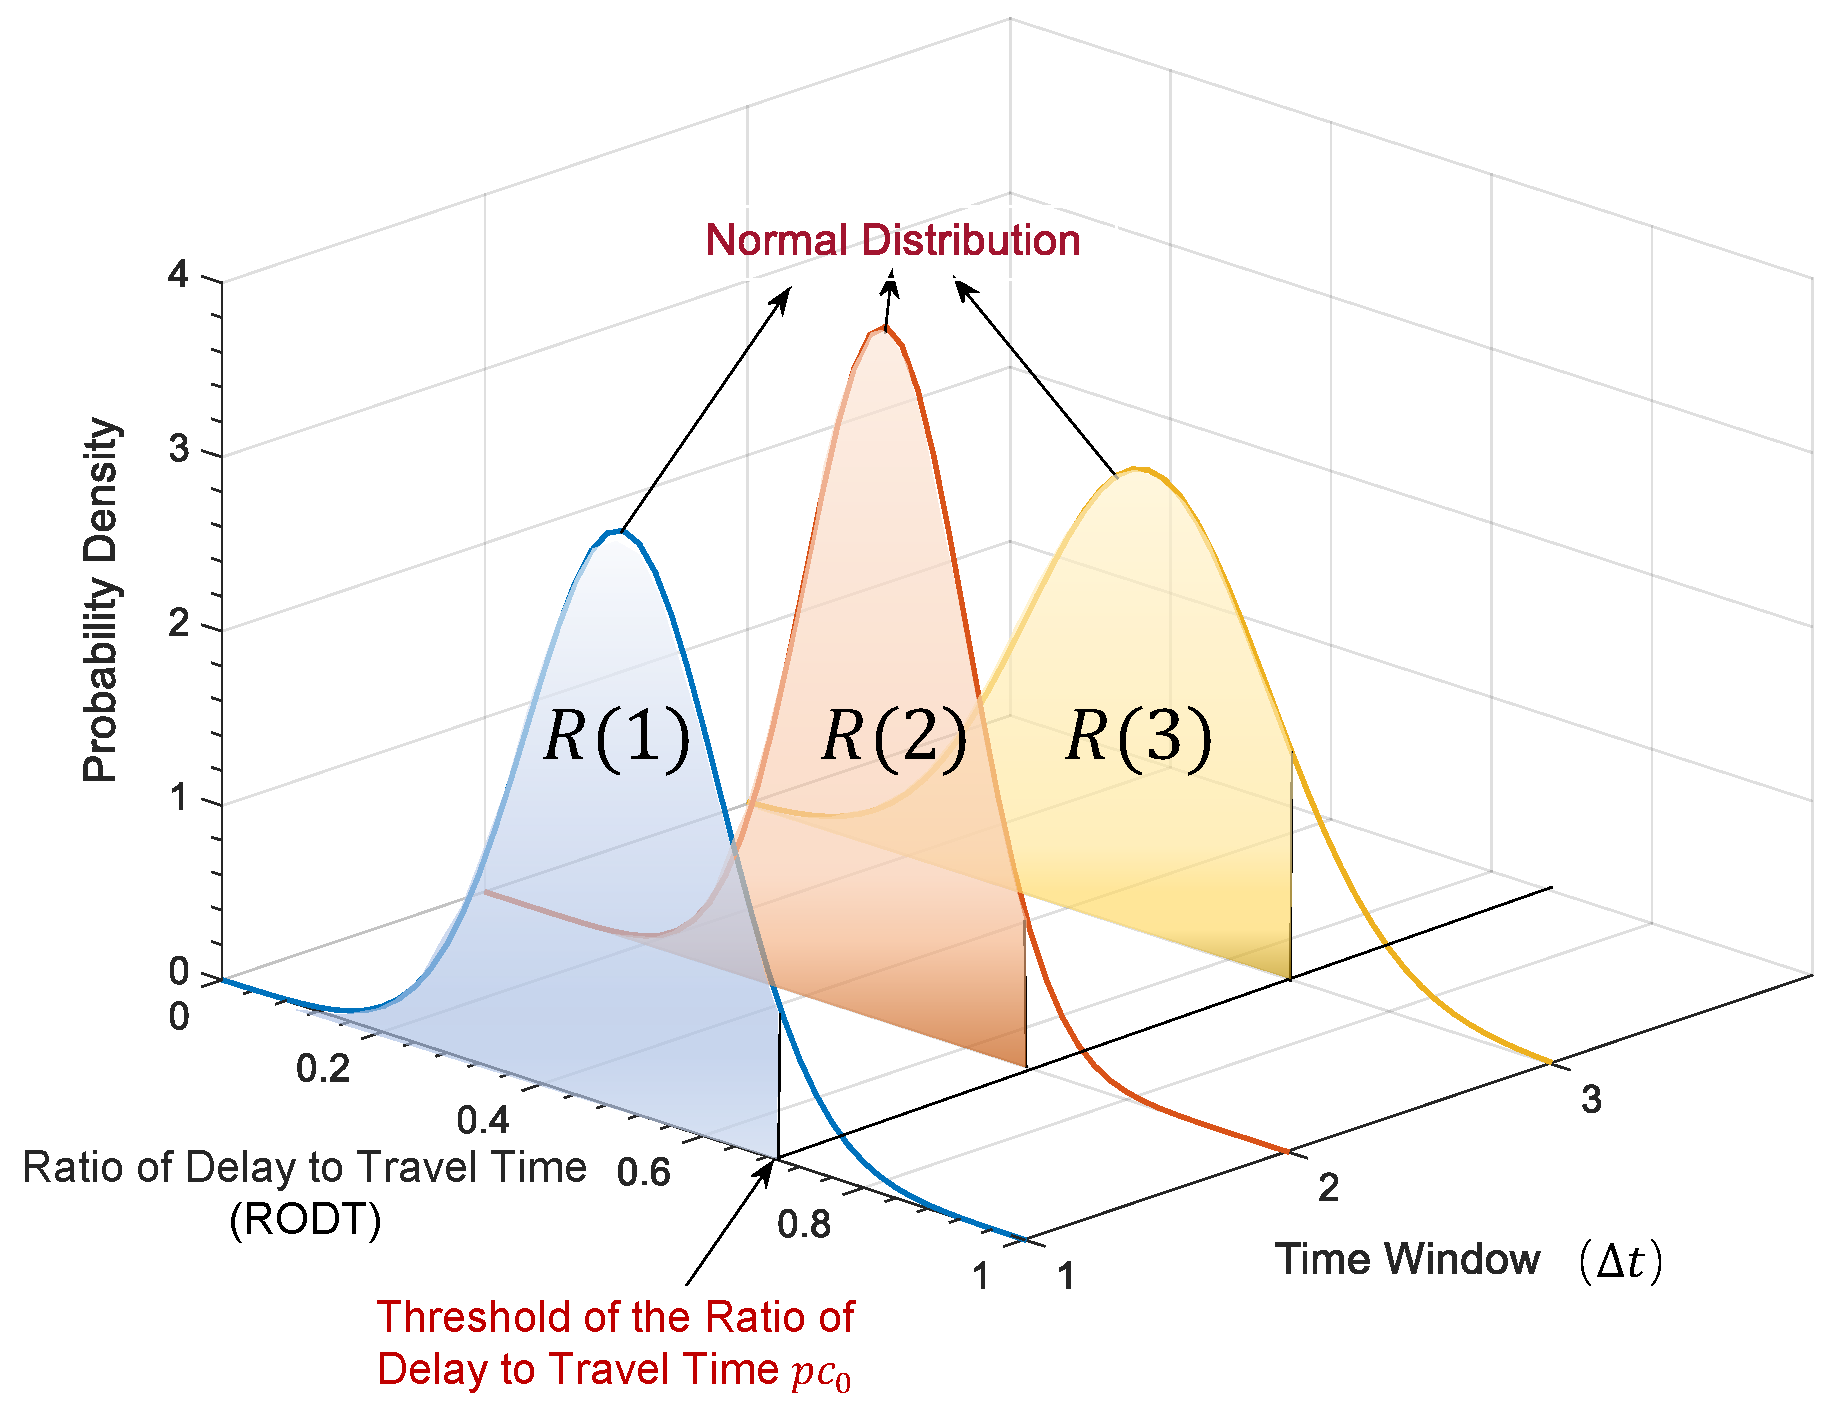
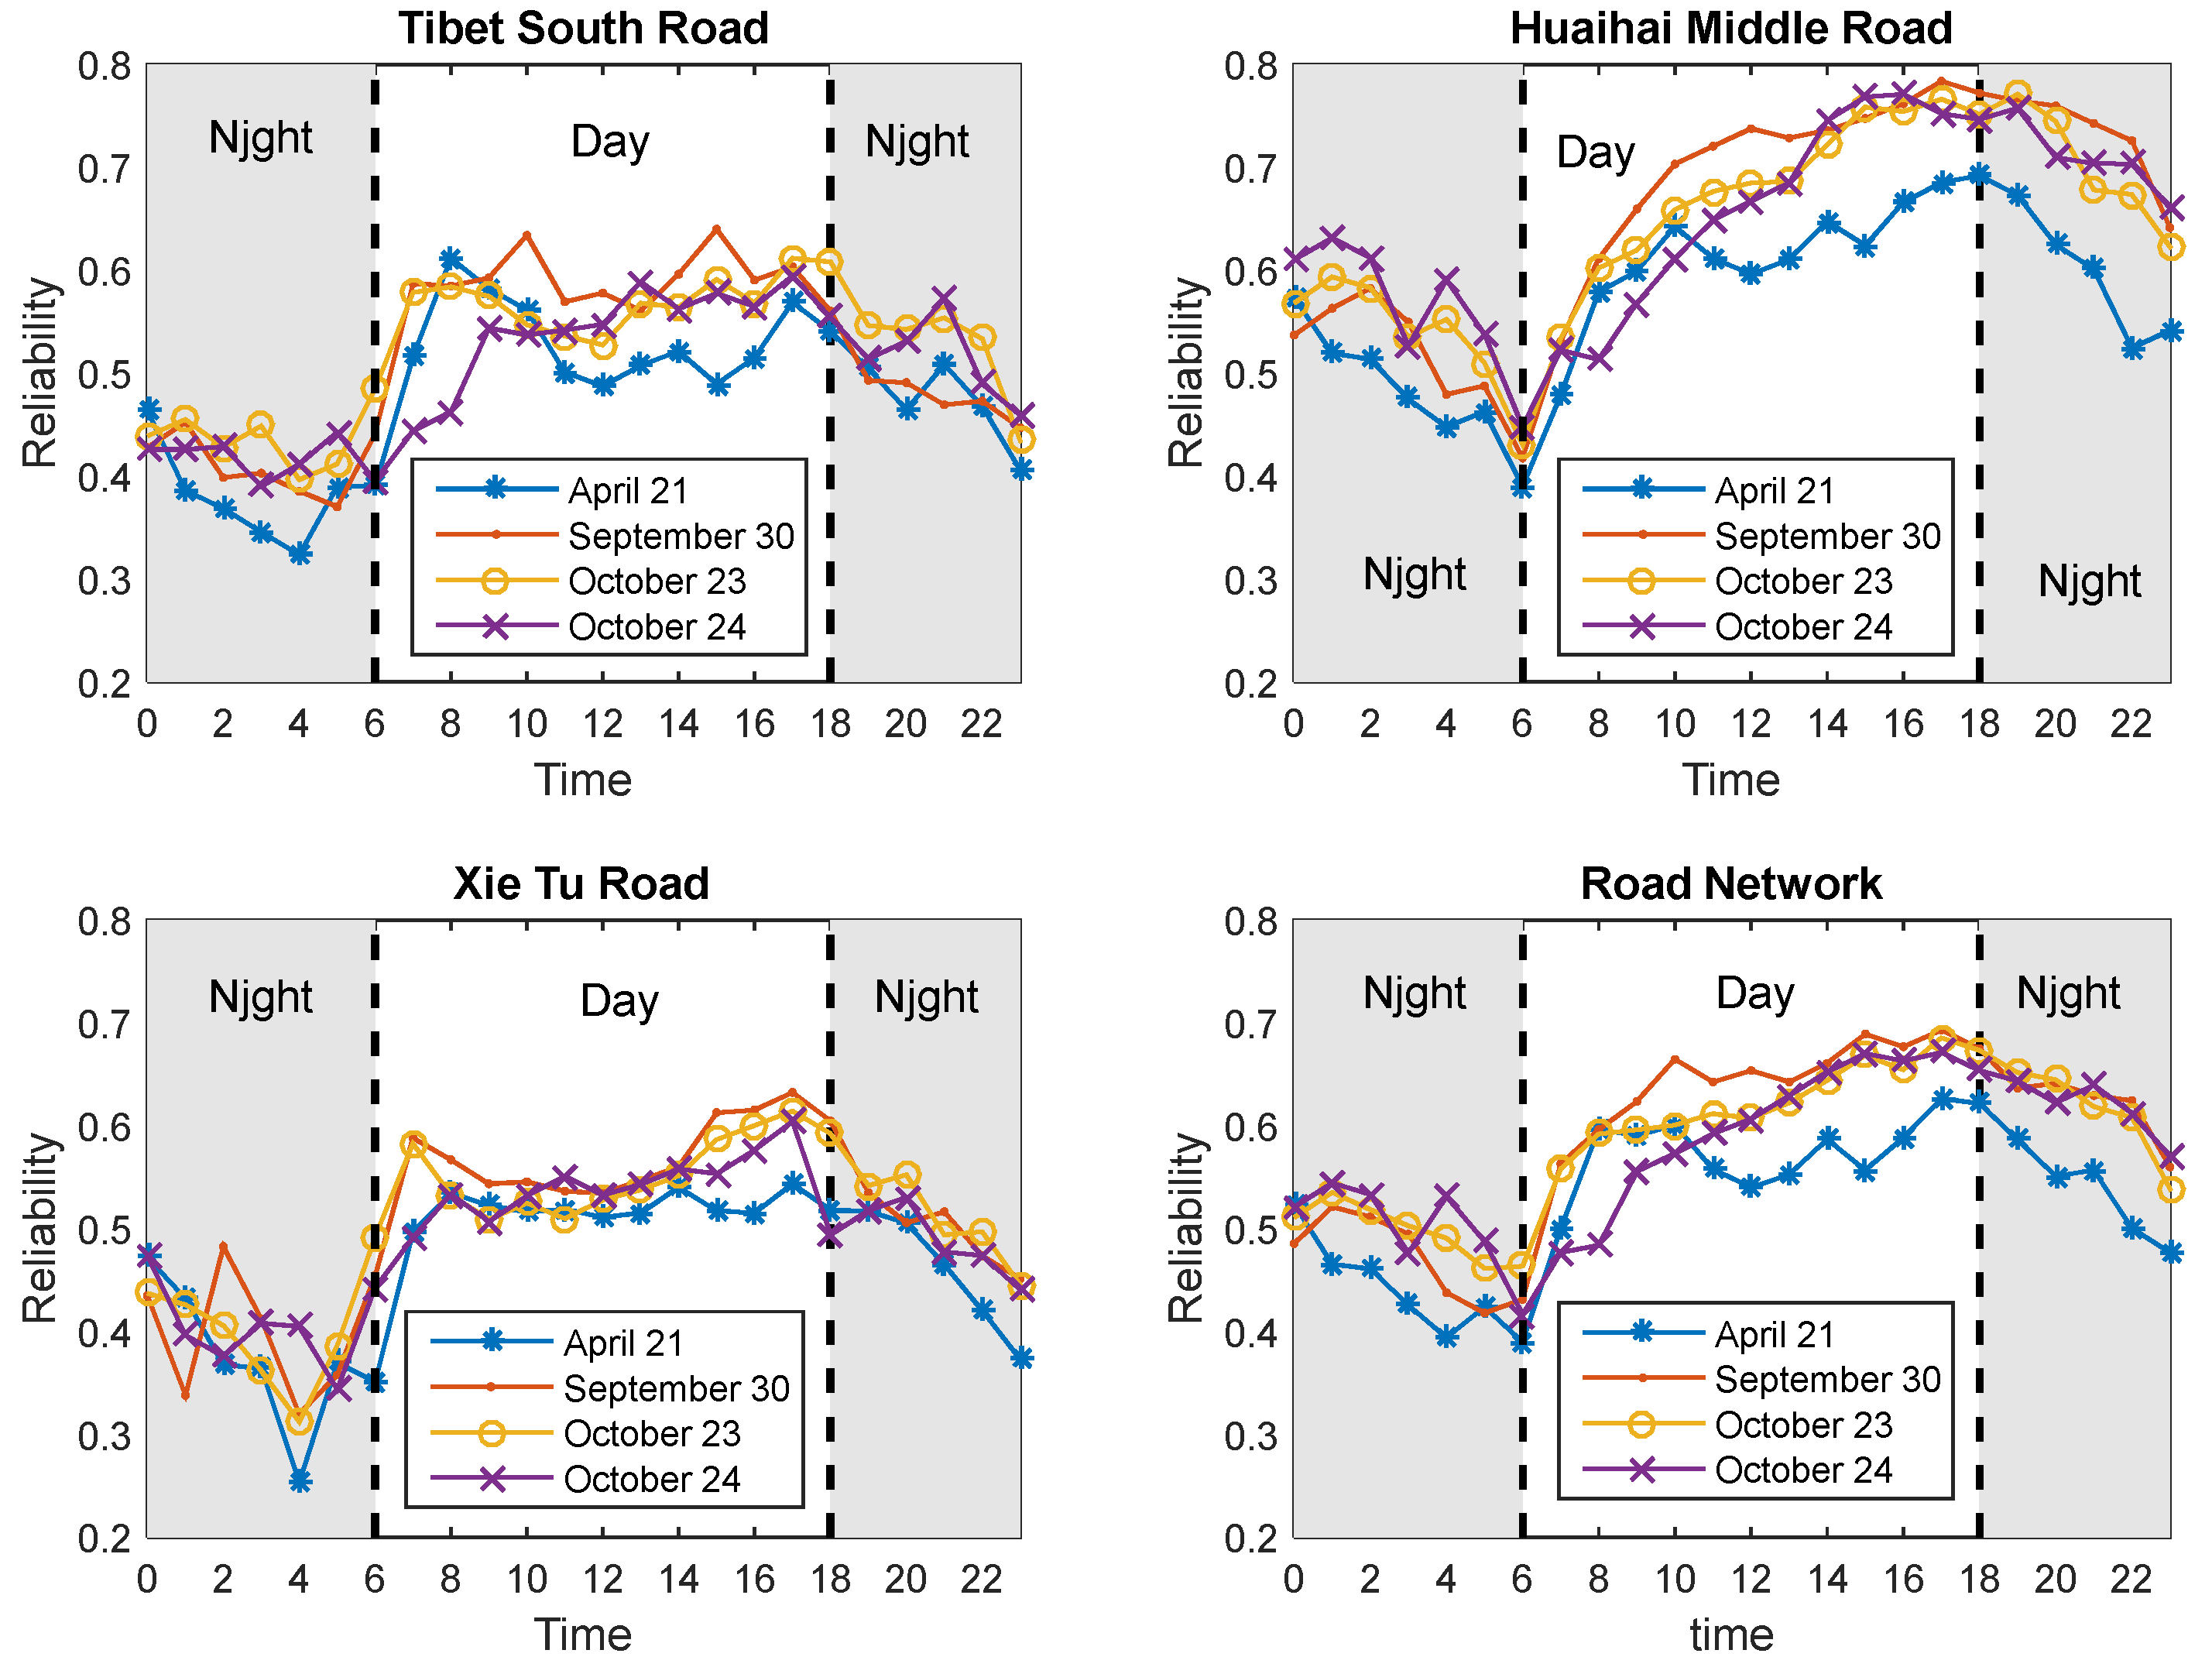
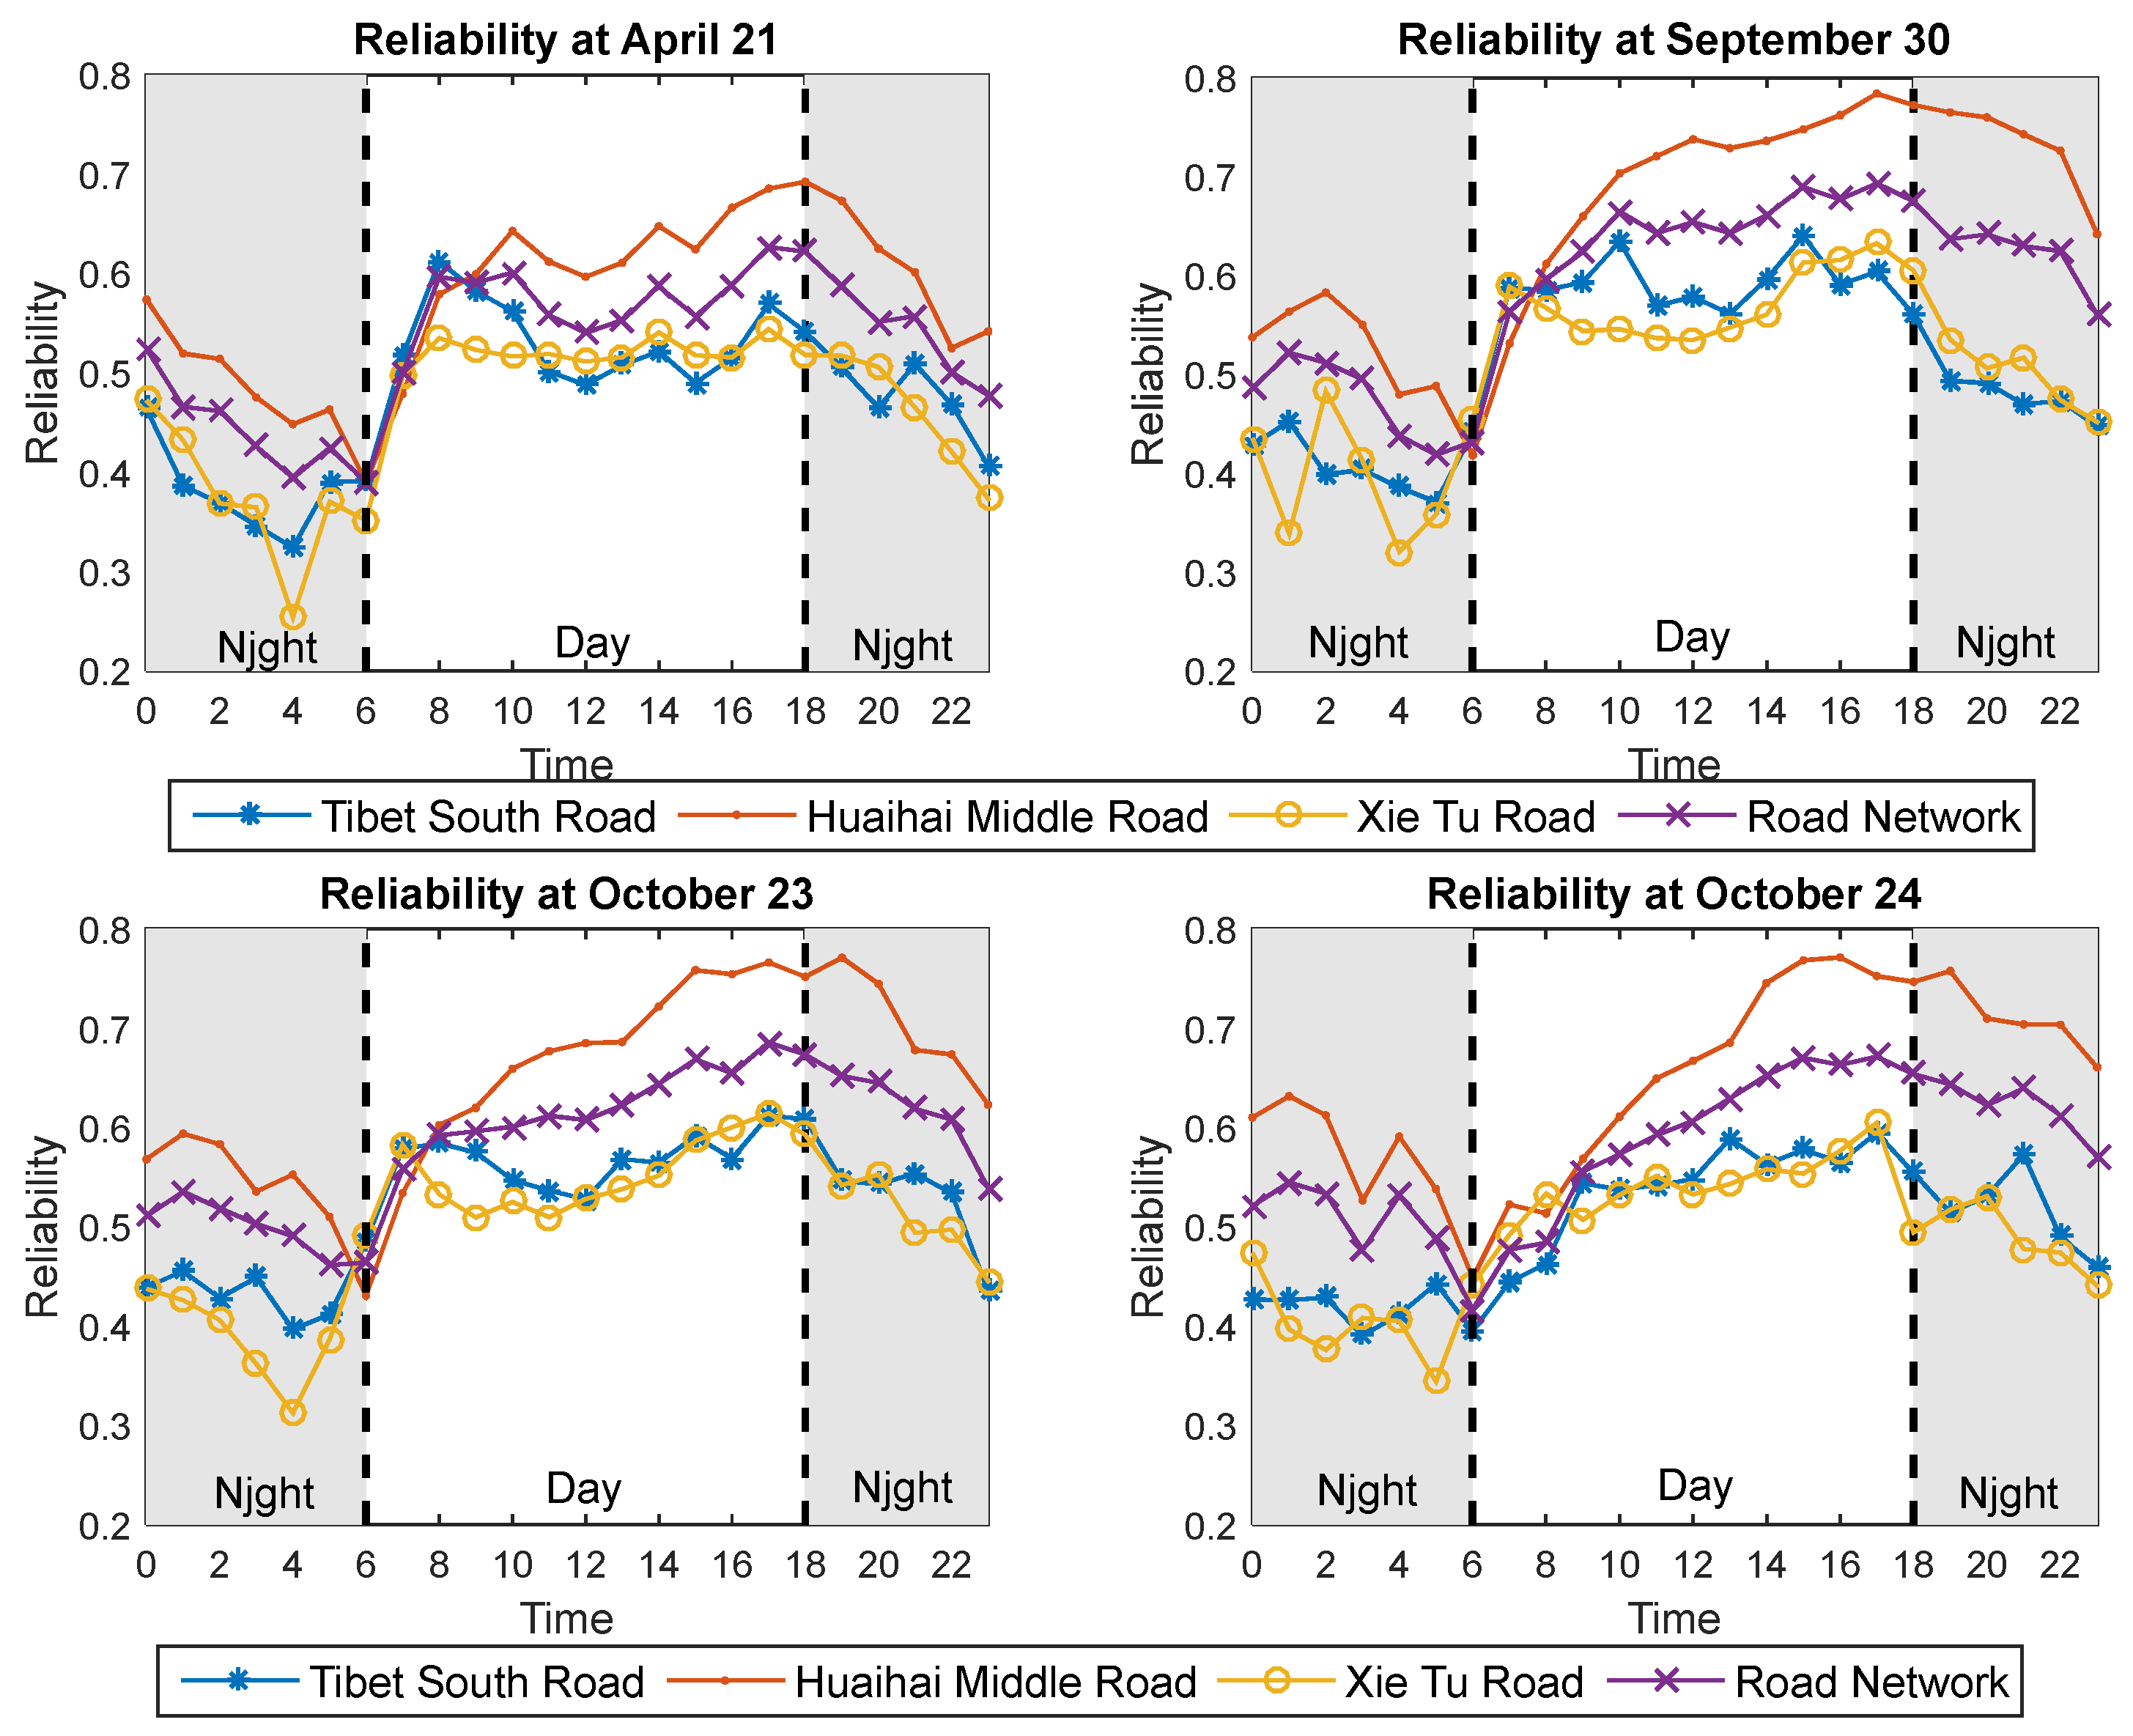
The RODT (Ratio of Delay to Travel Time) of vehicles follows a normal distribution, as verified using real-world data from a homogeneous road network in Huangpu District, Shanghai, collected over four normal days. The analysis shows that travel time reliability for the real-world road network is generally higher during the day than at night. Additionally, reliability during the severe stage of the COVID-19 pandemic was lower compared to the remission stage.
(2)
The estimated RODT values obtained through the proposed method were generally consistent with the observed trends of the true values. The absolute error under the three tested signal cycles was less than 0.23, demonstrating that the travel time reliability estimated by the proposed method is representative for evaluating road network performance.
(3)
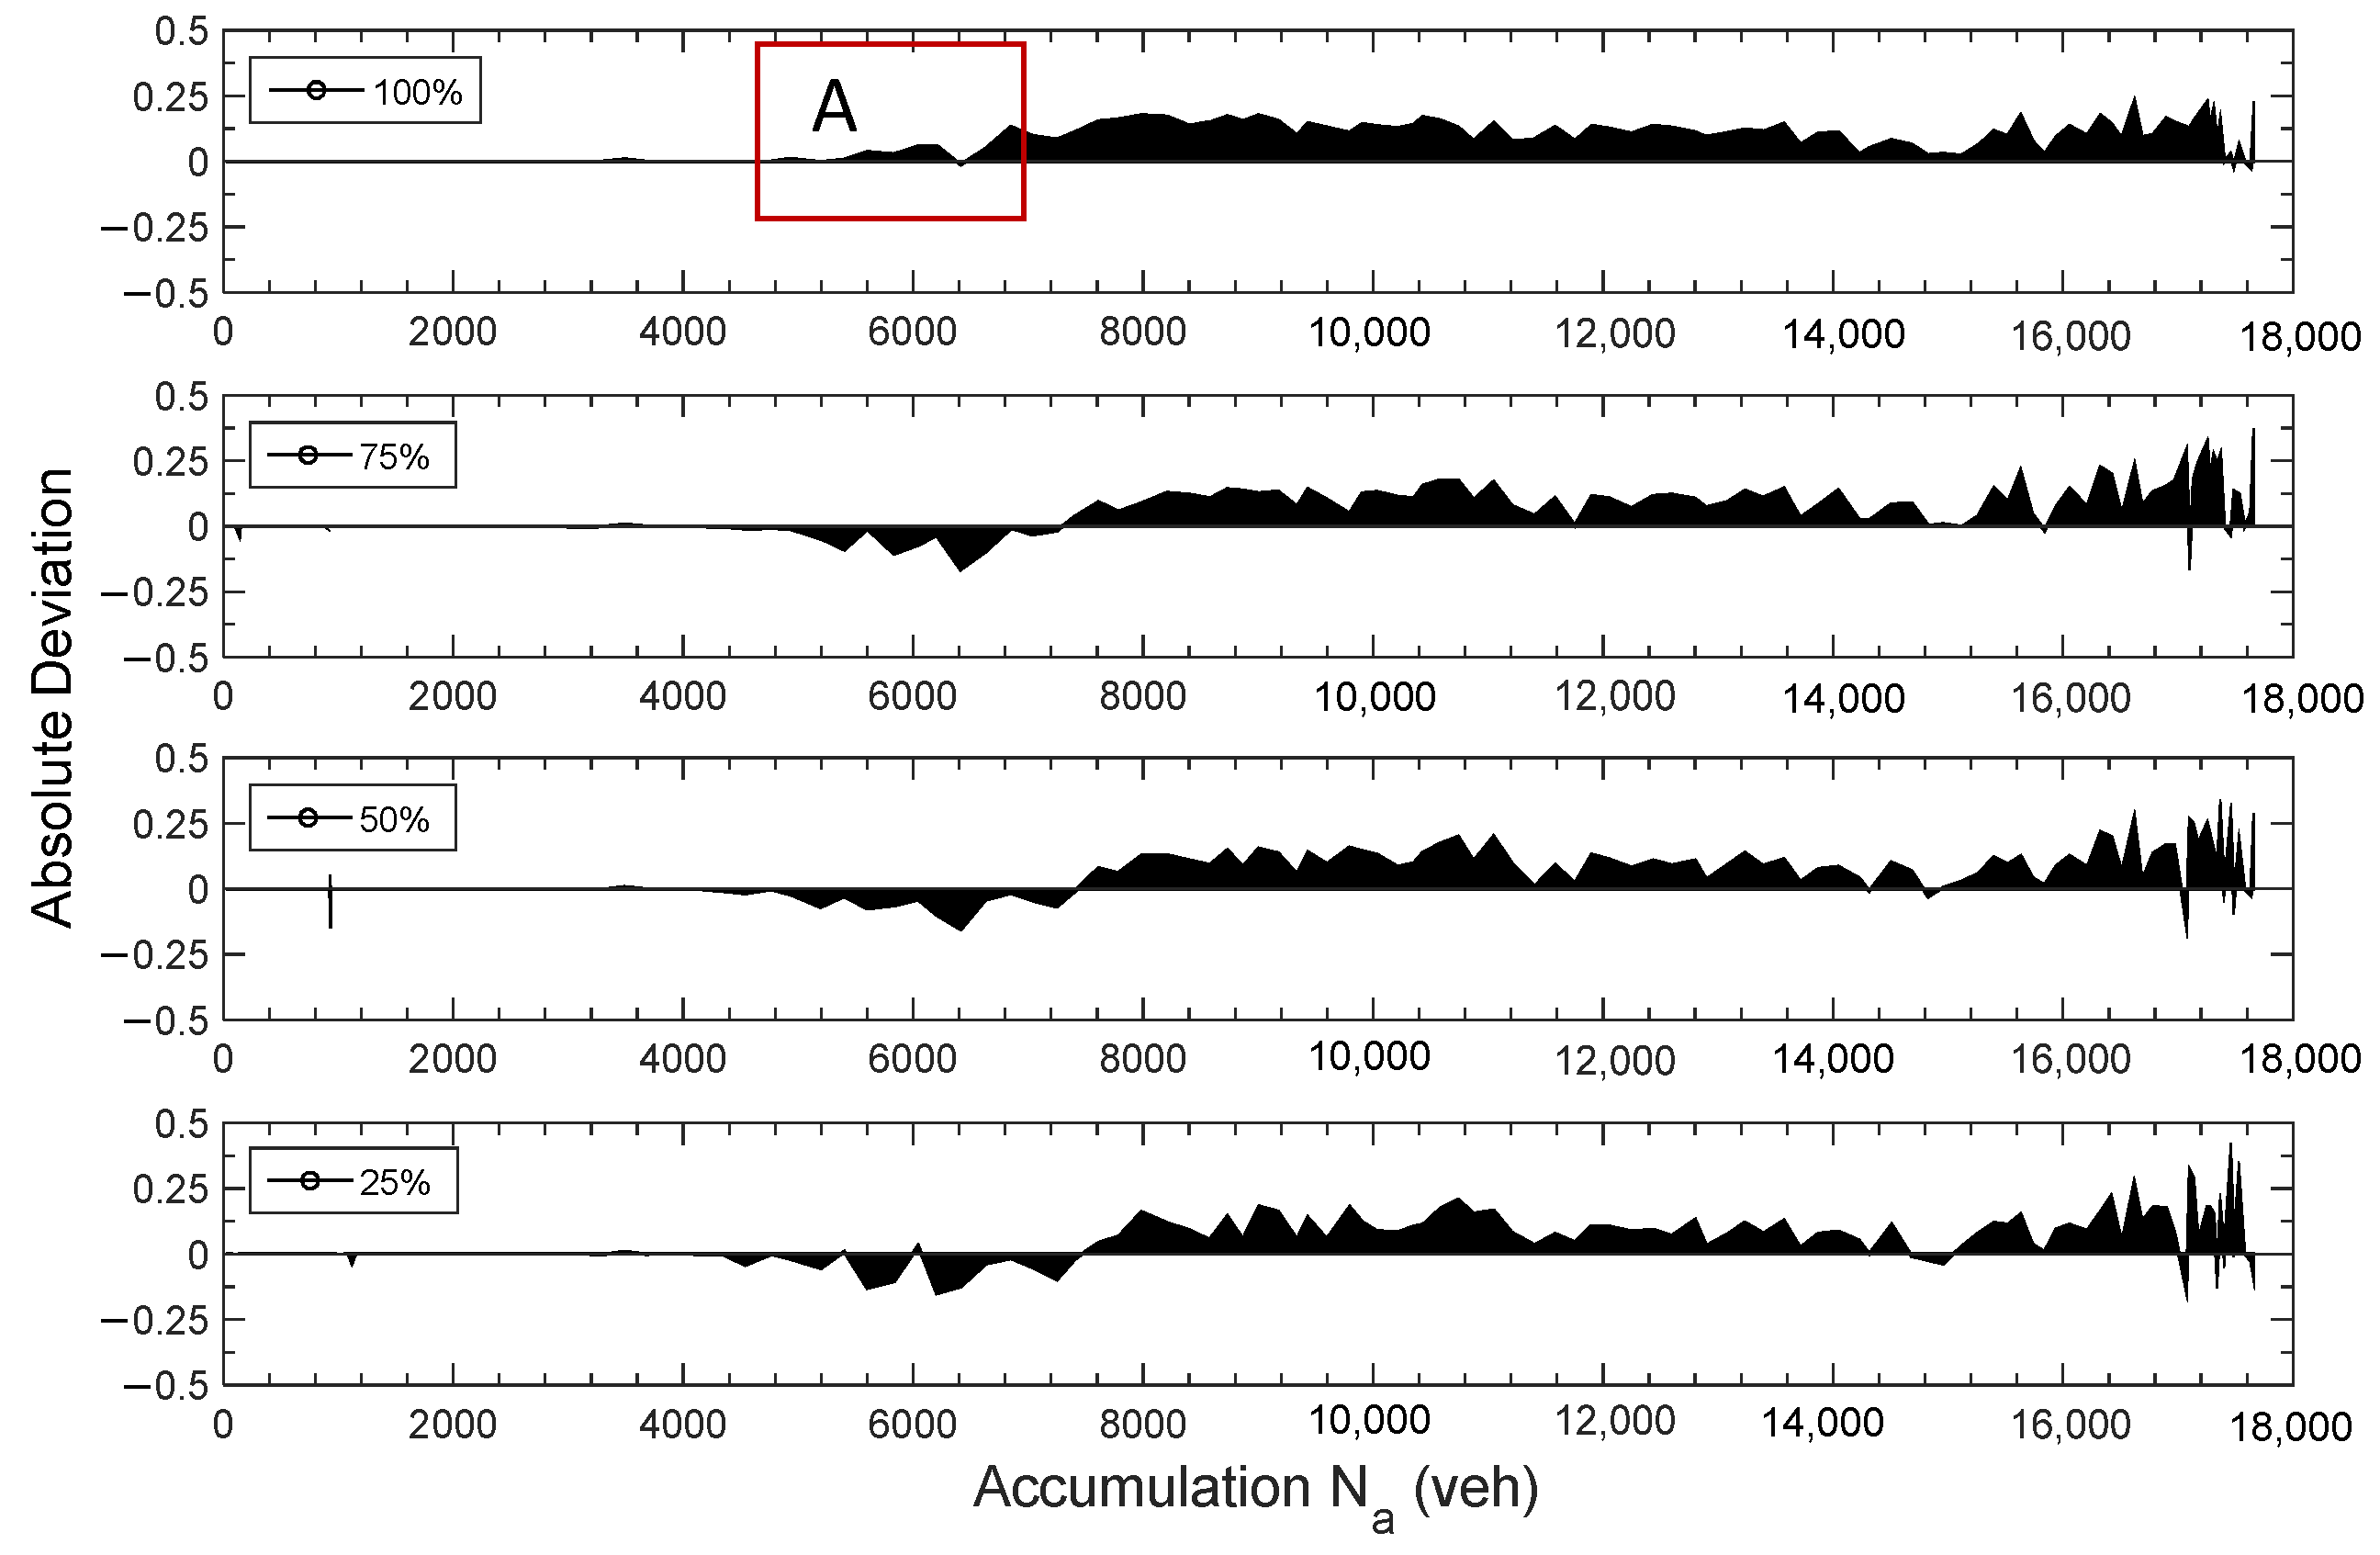
Error analysis indicates that the dynamic estimation method achieves higher accuracy when vehicle accumulation in the road network is low. Enhancing the accuracy of reliability estimation under conditions of high vehicle accumulation remains a key area for future research.
(4)
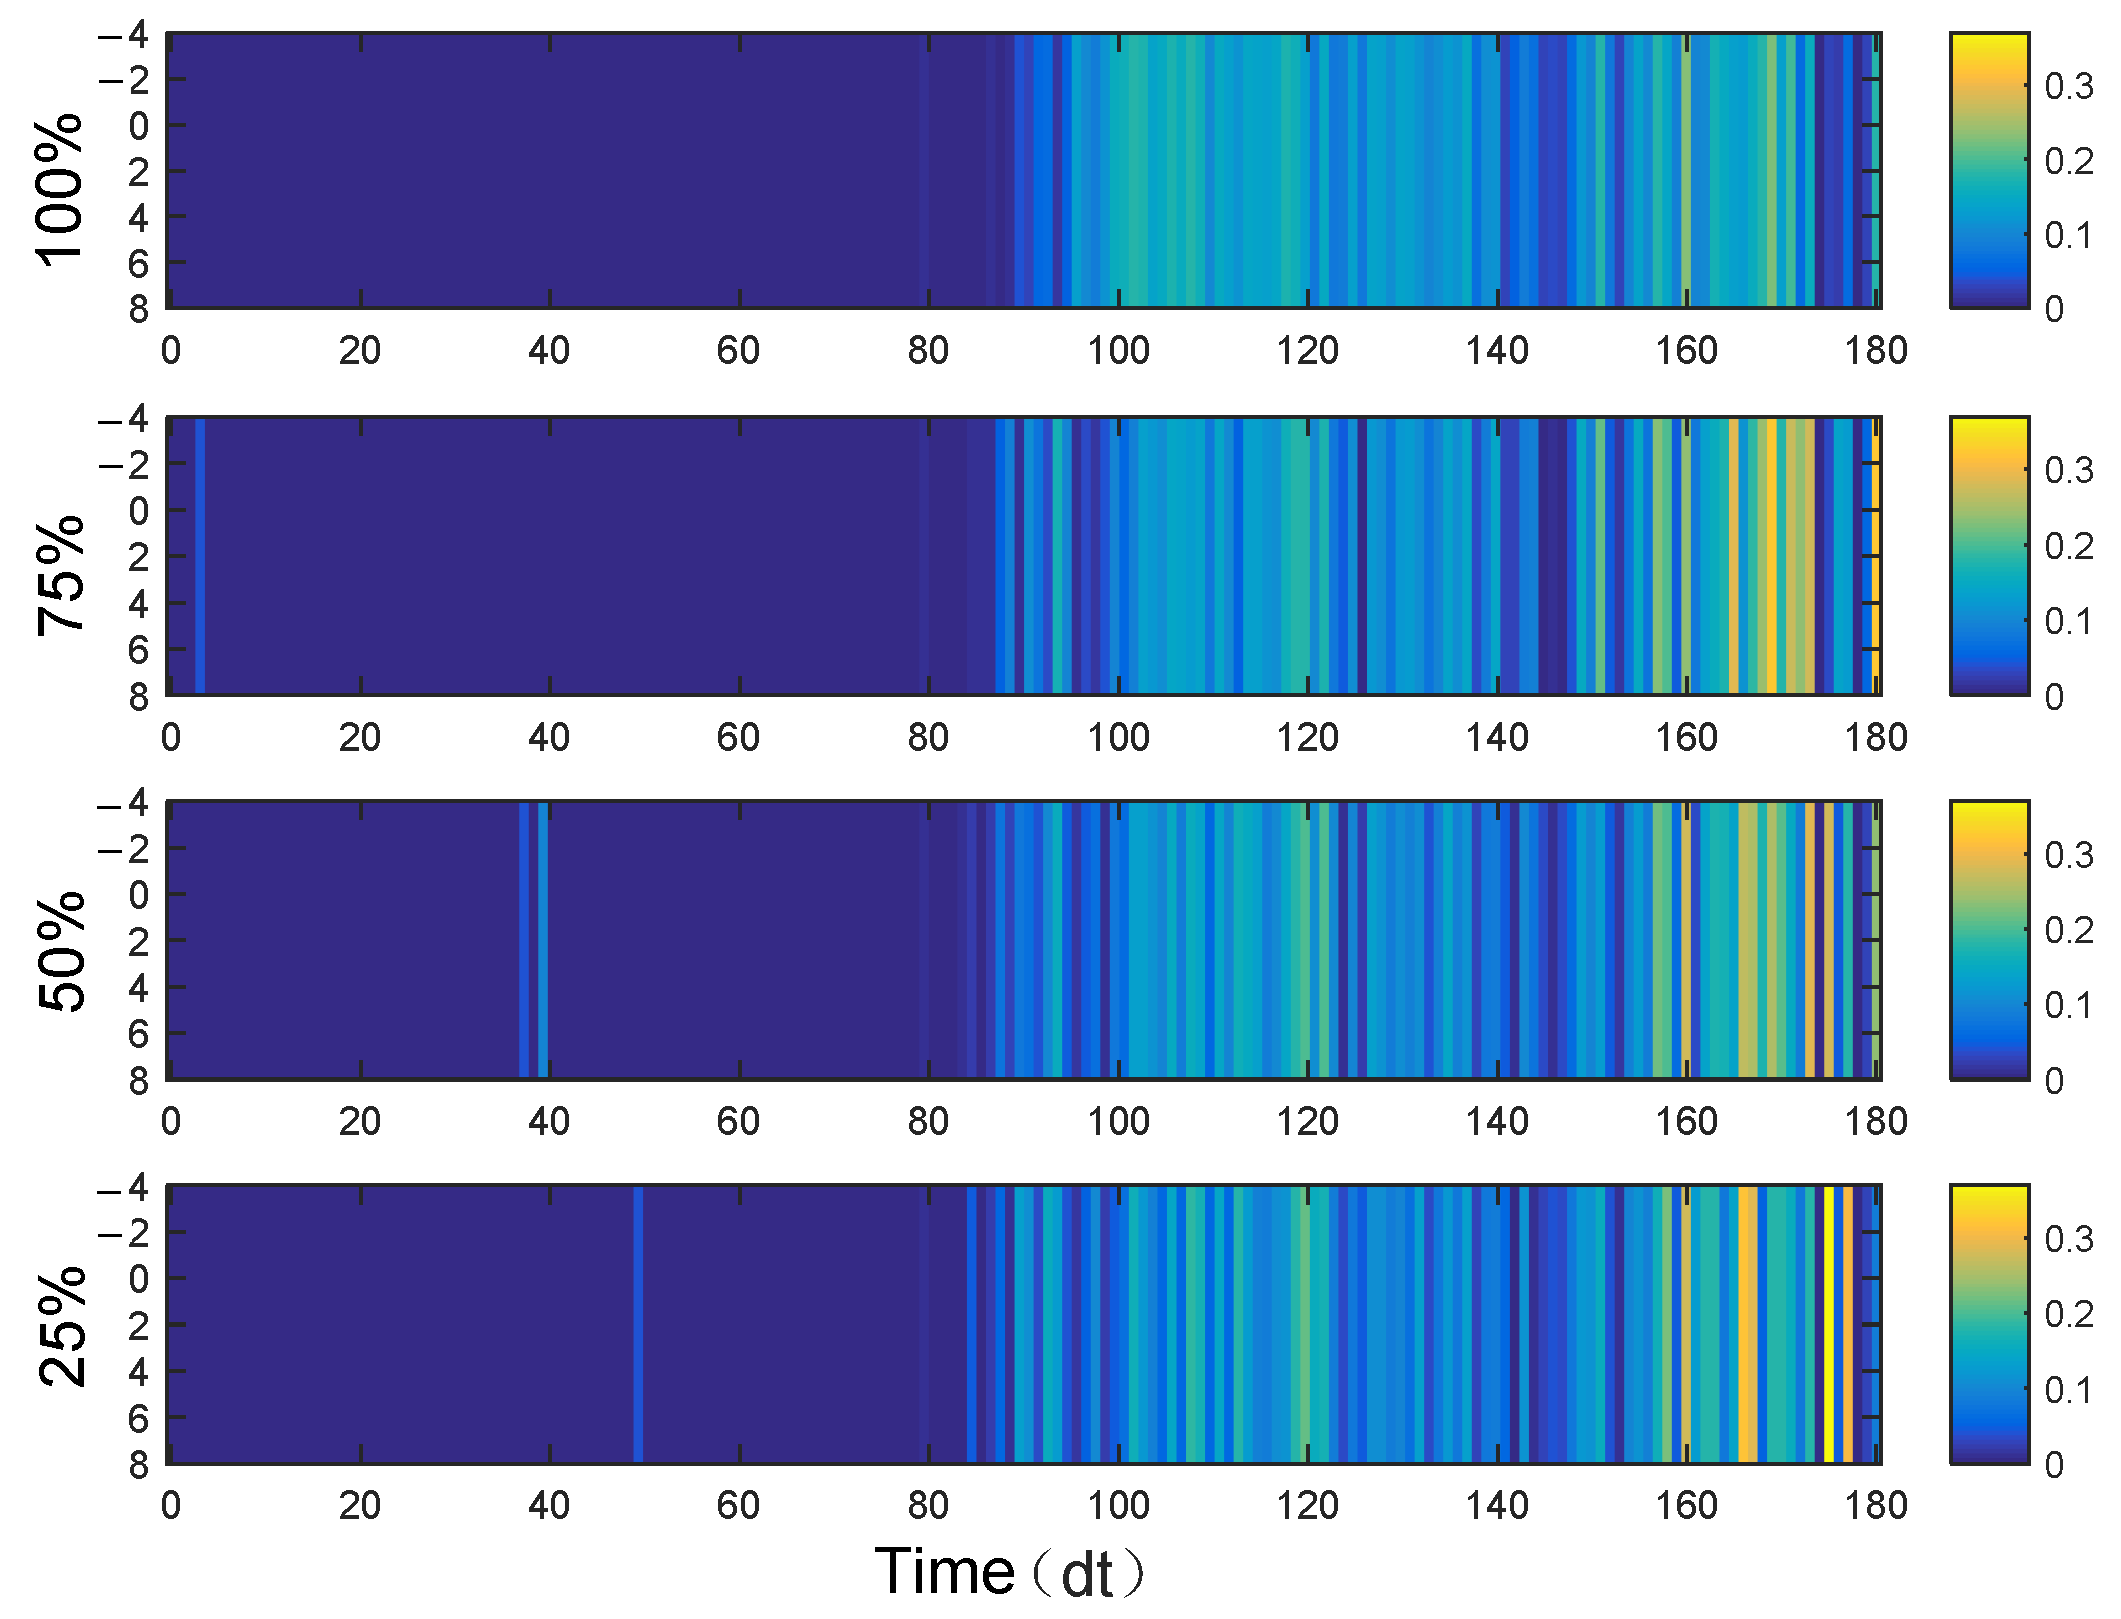
From the error analysis of travel time reliability estimates under varying data penetration rates, the absolute errors were found to be less than 0.3. This confirms that the dynamic estimation of travel time reliability for road networks based on trajectory data is both reasonable and reliable.
Trajectory data were used to dynamically estimate travel time reliability across the road network. Micro-simulation data supported the analysis of the evolution mechanism of travel time reliability in this study. Future work should focus on further analyzing the adaptability of the proposed method to real-world road networks and examining the reliability characteristics before and after the COVID-19 pandemic. Although the normal distribution was chosen for its simplicity and statistical fitting performance, other distributions (such as the log-normal distribution or gamma distribution) may better capture the non-negative nature of the RODT. Future research could further explore these alternative distributions.

Author Contributions

The authors confirm contributions to the paper as follows: study conception and design: J.H., T.T. and J.W.; data collection: J.H.; analysis and interpretation of results: J.H., T.T. and J.W.; draft manuscript preparation: J.H. All authors have read and agreed to the published version of the manuscript.

Funding

This work was supported by the National Natural Science Foundation of China (grant number 52472360), the China Postdoctoral Science Foundation (grant number 2023M730560), and the Natural Science Foundation of Changzhou University (grant no. ZMF22020087).

Institutional Review Board Statement

Not applicable.

Informed Consent Statement

Not applicable.

Data Availability Statement

All the data used to support the findings of this study are included within the article. The authors will supply the relevant data in response to reasonable requests.

Conflicts of Interest

The authors declare no conflicts of interest.

References

  1. Qu, K.; Fan, X.; Xu, X.; Hanasusanto, G.A.; Chen, A. Improving transportation network redundancy under uncertain disruptions via retrofitting critical components. Transp. Res. Part B Methodol. 2025, 194, 103174. [Google Scholar] [CrossRef]
  2. Wang, J.; You, L.; Hang, J. Pre-trip reservation enabled route guidance and signal control cooperative method for improving network throughput. Physica A 2023, 609, 128405. [Google Scholar] [CrossRef]
  3. Zang, Z.; Batley, R.; Xu, X.; Wang, D.Z. On the value of distribution tail in the valuation of travel time variability. Transp. Res. Part E Logist. Transp. Rev. 2024, 190, 103695. [Google Scholar] [CrossRef]
  4. Zang, Z.; Xu, X.; Qu, K.; Chen, R.; Chen, A. Travel time reliability in transportation networks: A review of methodological developments. Transp. Res. Part C Emerg. Technol. 2022, 143, 103866. [Google Scholar] [CrossRef]
  5. Yue, W.; Li, C.; Wang, S.; Xue, N.; Wu, J. Cooperative incident management in mixed traffic of CAVs and human-driven vehicles. IEEE Trans. ITS 2023, 24, 12462–12476. [Google Scholar] [CrossRef]
  6. Song, M.; Cheng, L. Incorporating travel time means and standard deviations into transportation network design problem: A hybrid method based on column generation and Lagrangian relaxation. Transp. Lett. 2023, 16, 131–143. [Google Scholar] [CrossRef]
  7. Moylan, E.K.; Bliemer, M.C.; Hossein Rashidi, T. Travellers’ perceptions of travel time reliability in the presence of rare events. Transportation 2022, 49, 1–25. [Google Scholar] [CrossRef]
  8. Teng, W.; Chen, B.Y. Reliable lifelong planning A*: Technique for re-optimizing reliable shortest paths when travel time distribution updating. Transp. Res. Part E Logist. Transp. Rev. 2024, 188, 103635. [Google Scholar] [CrossRef]
  9. Li, H.; Wang, Z.; Li, X.; Wang, H.; Man, Y.; Shi, J. Travel time probability prediction based on constrained LSTM quantile regression. J. Adv. Transp. 2023, 2023, 9910142. [Google Scholar] [CrossRef]
  10. Qian, Y.; Ding, H.; Meng, Y.; Zheng, N.; Di, Y.; Zheng, X. Combination of H∞ perimeter control and route guidance for heterogeneous urban road networks. Transp. Met. B Transp. Dyn. 2024, 12, 2359025. [Google Scholar] [CrossRef]
  11. Ma, Z.; Yang, X.; Shang, W.; Wu, J.; Sun, H. Resilience analysis of an urban rail transit for the passenger travel service. Transp. Res. Part D Transp. Environ. 2024, 128, 104085. [Google Scholar] [CrossRef]
  12. Saedi, R.; Saeedmanesh, M.; Zockaie, A.; Saberi, M.; Geroliminis, N.; Mahmassani, H.S. Estimating Network Travel Time Reliability with Network Partitioning. Transp. Res. Part C Emerg. Technol. 2020, 112, 46–61. [Google Scholar] [CrossRef]
  13. Tian, H.; Wang, T.; Xu, L.; Sha, M.; Chen, S.; Yang, Z.; Tian, X. Research and development of prevention and control measures on the transmission of pathogens in compartments of passenger transport. Transp. Saf. Environ. 2024, 6, tdad011. [Google Scholar] [CrossRef]
  14. Cheng, Q.; Liu, Z.; Lu, J.; List, G.; Liu, P.; Zhou, X.S. Using frequency domain analysis to elucidate travel time reliability along congested freeway corridors. Transp. Res. Part B Methodol. 2024, 184, 102961. [Google Scholar] [CrossRef]
  15. Liu, Y.; Francis, A.; Hollauer, C.; Lawson, M.C.; Shaikh, O.; Cotsman, A.; Asensio, O.I. Reliability of electric vehicle charging infrastructure: A cross-lingual deep learning approach. Commun. Transp. Res. 2023, 3, 100095. [Google Scholar] [CrossRef]
  16. Li, F.; Cheng, J.; Mao, Z.; Wang, Y.; Feng, P. Enhancing safety and efficiency in automated container terminals: Route planning for hazardous material AGV using LSTM neural network and Deep Q-Network. J. Intell. Connect. Veh. 2024, 7, 64–77. [Google Scholar] [CrossRef]
  17. Kato, T.; Uchida, K.; Lam, W.H.; Sumalee, A. Estimation of the value of travel time and of travel time reliability for heterogeneous drivers in a road network. Transportation 2021, 48, 1639–1670. [Google Scholar] [CrossRef]
  18. Cheok, C.C.; Khoo, W.C.; Khoo, H.L. Bus travel time variability modelling using Burr type XII regression: A case study of Klang Valley. KSCE J. Civ. Eng. 2024, 28, 3998–4009. [Google Scholar] [CrossRef]
  19. Zhai, C.; Wu, W.; Xiao, Y. Modeling continuous traffic flow with the average velocity effect of multiple vehicles ahead on gyroidal roads. Digit. Transp. Saf. 2023, 2, 124–138. [Google Scholar] [CrossRef]
  20. Li, Y.; Wang, X.; Yang, J.; Zhang, Z.; Wang, C.; Qian, B.; Tian, X.; Wang, T. Airborne transmission of virus-laden droplets in an aircraft cabin. Transp. Saf. Environ. 2023, 5, tdac079. [Google Scholar] [CrossRef]
  21. Wang, J.; He, X.; Peeta, S. Feedback perimeter control with online estimation of maximum throughput for an incident-affected road network. J. Intell. Transp. Syst. 2021, 26, 81–99. [Google Scholar] [CrossRef]
  22. Jian, Z.H.; Xu, X.D.; Zang, Z.Q. Estimating a route travel time distribution function with segment correlations Using segment-level travel time data only: A moment-based method. IEEE Trans. Intell. Transp. Syst. 2024, 25, 18815–18830. [Google Scholar] [CrossRef]
  23. Saw, K.; Katti, B.K.; Joshi, G.J.; Kedia, A. Travel time reliability evaluation using fuzzy-possibility approach: A case study of an Indian city. Transp. Plann. Technol. 2024, 47, 1092–1110. [Google Scholar] [CrossRef]
  24. Costa, T.G.D.; Isler, C.A.; Bessa Júnior, J.E. Method for Identifying Homogeneous Periods to Evaluate Urban Travel Time Reliability. Transp. Res. Rec. 2025, 03611981241306753. [Google Scholar] [CrossRef]
  25. Zhao, M.; Zhang, X.; Appiah, J.; Fontaine, M.D. Travel time reliability prediction using random forests. Transp. Res. Rec. 2024, 2678, 531–545. [Google Scholar] [CrossRef]
  26. Sun, Y.X.; Chen, Y. Travel time variability in urban mobility: Exploring transportation system reliability performance using ridesharing data. Sustainability 2024, 16, 8103. [Google Scholar] [CrossRef]
  27. Meng, Y.; Zhao, X.; Xu, X.; Ma, W. Vulnerability assessment of large-scale urban road network under emerging disinformation attacks. Transportmetrica A 2025, 1–25. [Google Scholar] [CrossRef]
  28. Chen, L.; Xie, C.; Ma, D.; Yang, Y.; Li, Y. A short-term traffic flow prediction model for road networks using inverse isochrones to determine dynamic spatiotemporal correlation ranges. Physica A 2025, 657, 130244. [Google Scholar] [CrossRef]
  29. Zhang, Y.; Xie, Y.; Shi, C.; Li, Q.; Yang, B.; Hao, W. Identifying vehicle types from trajectory data based on spatial-semantic information. Geo-Spat. Inf. Sci. 2024, 1–17. [Google Scholar] [CrossRef]
  30. Mizzi, C.; Baroncini, A.; Fabbri, A.; Micheli, D.; Vannelli, A.; Criminisi, C.; Bazzani, A. Individual mobility deep insight using mobile phones data. EPJ Data Sci. 2023, 12, 56. [Google Scholar] [CrossRef]
  31. Sekar, N.K.; Malaghan, V.; Pawar, D.S. Micro-simulation insights into the safety and operational benefits of autonomous vehicles. J. Intell. Connect. Veh. 2023, 6, 202–210. [Google Scholar] [CrossRef]
  32. Liu, Y.; Chen, X.; Hu, R.; Huang, W.; Li, L.; Xie, J.; Yao, D. Vehicle trajectory reconstruction with sparse automatic license plate recognition data for urban road networks. Transportmetrica A 2025, 1–24. [Google Scholar] [CrossRef]
  33. Deng, J.; Gao, L.; Chen, X.; Yuan, Q. Taking the same route every day? An empirical investigation of commuting route stability using personal electric vehicle trajectory data. Transportation 2024, 51, 1547–1573. [Google Scholar] [CrossRef]
  34. Mathivanan, S.K.; Rajadurai, H.; Cho, J.; Easwaramoorthy, S.V. A multi-modal geospatial–temporal LSTM based deep learning framework for predictive modeling of urban mobility patterns. Sci. Rep. 2024, 14, 31579. [Google Scholar]
  35. Jin, J.; Wang, Y.; Chen, A.; Dimitrijevic, B.; Lee, J. Dynamic nonrecurrent congestion event detection and tracking method with DBSCAN on speed watersheds. J. Adv. Transp. 2024, 2024, 8404251. [Google Scholar] [CrossRef]
  36. Saffari, E.; Yildirimoglu, M.; Hickman, M. Estimation of macroscopic fundamental diagram solely from probe vehicle trajectories with an unknown penetration rate. IEEE Trans. Intell. Transp. Syst. 2023, 24, 1214970–1214981. [Google Scholar] [CrossRef]
  37. Gao, H.; Zhou, L.; Dong, Y.; Wang, X.; Sun, Q.; Wang, S.; Yuan, L. Identifying critical road sections using the weighted periodicity mined from trajectory data for efficient urban transportation. GISci. Remote Sens. 2025, 62, 2448251. [Google Scholar] [CrossRef]
  38. Raju, N.; Arkatkar, S.; Joshi, G. Modeling following behavior of vehicles using trajectory data under mixed traffic conditions: An Indian viewpoint. Transp. Lett. 2021, 13, 649–663. [Google Scholar] [CrossRef]
  39. Sun, J.; Kim, J. Joint Prediction of Next Location and Travel Time from Urban Vehicle Trajectories using Long Short-term Memory Neural Networks. Transp. Res. Part C Emerg. Technol. 2021, 128, 103114. [Google Scholar] [CrossRef]
  40. Dokuz, A.S. Weighted spatio-temporal taxi trajectory big data mining for regional traffic estimation. Physica A 2022, 589, 126645. [Google Scholar] [CrossRef]
  41. Akopov, A.S.; Beklaryan, L.A. Evolutionary Synthesis of High-Capacity Reconfigurable Multilayer Road Networks Using a Multiagent Hybrid Clustering-Assisted Genetic Algorithm. IEEE Access 2025, 13, 53448–53474. [Google Scholar] [CrossRef]
  42. Zhang, Z.; Li, M. Finding paths with least expected time in stochastic time-varying networks considering uncertainty of prediction information. IEEE Trans. Intell. Transp. Syst. 2023, 24, 14362–14377. [Google Scholar] [CrossRef]
  43. Zhang, H.; Zhao, Z.; Guo, X.; Li, G.; Zhang, C.; Tang, L. Three-dimensional road network empowered traffic emission estimation via trajectory data. J. Clean. Prod. 2023, 475, 143669. [Google Scholar] [CrossRef]
  44. Shin, Y.; Yoon, Y. Incorporating Dynamicity of Transportation Network with Multi-weight Traffic Graph Convolutional Network for Traffic Forecasting. IEEE Trans. Intell. Transp. Syst. 2022, 23, 2082–2092. [Google Scholar] [CrossRef]
  45. Matin, A.; Dia, H. Public perception of connected and automated vehicles: Benefits, concerns, and barriers from an Australian perspective. J. Intell. Connect. Veh. 2024, 7, 108–128. [Google Scholar] [CrossRef]
  46. Hang, J.Y.; Zhou, X.Z.; Wang, J.W. Modeling Traffic Function Reliability of Signalized Intersections with Control Delay. Adv. Civ. Eng. 2020, 1–13. [Google Scholar] [CrossRef]
  47. Chen, P.; Sun, J.; Qi, H. Estimation of delay variability at signalized intersections for urban arterial performance evaluation. J. Intell. Transp. Syst. 2017, 21, 94–110. [Google Scholar] [CrossRef]
  48. Lin, Y.T.; Cheng, Y.; Chang, G.L. Integration of progression maximization and delay minimization controls for commuting arterials accommodating highly asymmetric directional traffic flows. J. Intell. Transp. Syst. 2024, 1–17. [Google Scholar] [CrossRef]
Figure 1. Quantification of travel time reliability.
Sustainability 17 04244 g001
Figure 2. Process of dynamically estimating travel time reliability using trajectory data.
Sustainability 17 04244 g002
Figure 3. Coverage of trajectory data and schematic diagrams of three experimental roads.
Sustainability 17 04244 g003
Figure 4. The cumulative probability distribution of the delay to travel time ratio in four normal days.
Sustainability 17 04244 g004
Figure 5. True value of travel time reliability under different road network capacities.
Sustainability 17 04244 g005
Figure 6. True value and estimated value of travel time reliability under different signal cycle lengths: (a) 60 s, (b) 90 s, and (c) 120 s.
Sustainability 17 04244 g006
Figure 7. Absolute error of estimated value of travel time reliability.
Sustainability 17 04244 g007
Figure 8. Relative error of estimated value of travel time reliability.
Sustainability 17 04244 g008
Figure 9. Absolute errors of travel time reliability under different data penetration rates.
Sustainability 17 04244 g009
Figure 10. Relative errors of travel time reliability under different data penetration rates.
Sustainability 17 04244 g010
Figure 11. The travel time reliability of three roads and the real-word road network.
Sustainability 17 04244 g011
Figure 12. Travel time reliability for 4 normal days.
Sustainability 17 04244 g012
Table 1. Parameter description.
SymbolDescription
Input
t : Time   window ,   continuous   time ,   t
i : Time   window   serial   number ,   i = 1,2 , 3
p c 0 : Threshold   of   the   ratio   of   delay   to   travel   time   ( RODT ) ;   if   p c m p c 0 ,   the   travel   of   vehicle   m   is   reliable ;   if   p c m > p c 0 ,   the   travel   of   vehicle   m is unreliable
X : RODT   for   vehicles   in   the   road   network ;   it   was   assumed   in   this   study   that   X ~ N μ , σ 2
x i j : Sample   j   of   RODT   during   the   i -th time window
w i :The number of samples
j : Sample   ID ,   j = 1,2 , 3 , w i ;   the   number   of   sample   j   is   w i
V c i :Cumulative number of vehicles
N i :The number of vehicles leaving the road
Output
p c m : RODT   for   vehicle   m
n i : Number   of   vehicles   whose   travel   is   reliable   out   of   the   total   number   of   vehicles   leaving   the   road   network   during   the   i -th time window, pcu
N i : Number   of   vehicles   leaving   the   road   network   during   the   i -th time window, pcu
μ x i j : Mean   of   samples   x i j
σ x i j : Standard   deviation   of   x i j
R ( i ) :Travel time reliability of road network during time window i
Table 2. Attributes related to vehicle trajectory data.
Data SourceAttributesData Usage
Data of an approximately homogeneous road network area in Shanghai1. Time: the update frequency is 120 s.
2. Road link ID, which matches the basic road network data.
3. Average speed of the road link, km/h.
4. Travel time, s.
5. Actual travel time divided by free-flow travel time.
6. Road name.
Verify hypothesis
Individual driving trajectory data1. Trajectory ID.
2. Time; update frequency at 5 s.
3. User ID, identification of user ID.
4. Longitude, latitude, real time location.
5. Link ID, matching with basic road data.
6. Link name; the Chinese name of the link.
Empirical research
Vehicle trajectory data from micro-simulation1. Vehicle records
Vehicle number; vehicle type; headway; travel distance (total); time in the road network (total); speed; simulation seconds; delay.
2. Vehicle travel time
Time interval; simulation number; vehicle; vehicle type; travel time.
3. Delay
Time interval; simulation number; stop time (average); vehicle delay (average); number of vehicles.
Applicability research
Table 3. Distribution goodness of fit of RODT.
April 21September 30October 23October 24
DistributionNormal
Log likelihood1.22 × 1061.06 × 1061.27 × 1061.36 × 106
Range–Inf < y < Inf–Inf < y < Inf–Inf < y < Inf–Inf < y < Inf
Mean0.1955530.2297450.2193770.212252
Variance0.02393490.02893650.02485360.0233159
Disclaimer/Publisher’s Note: The statements, opinions and data contained in all publications are solely those of the individual author(s) and contributor(s) and not of MDPI and/or the editor(s). MDPI and/or the editor(s) disclaim responsibility for any injury to people or property resulting from any ideas, methods, instructions or products referred to in the content.

