Article

Investment Risk Assessment and Countermeasure Strategies for Highway PPP Projects in Western China: A Dynamic Risk Accumulation Modeling Approach

1
School of Architectural Engineering, Xinjiang University, Urumqi 830017, China
2
Xinjiang Transportation Construction Group Co., Urumuqi 830011, China
3
School of Transportation Engineering, Xinjiang University, Urumqi 830017, China
4
Xinjiang Key Laboratory of Green Construction and Maintenance of Transportation Infrastructure and Intelligent Traffic Control, Urumqi 830017, China
*
Author to whom correspondence should be addressed.
Sustainability 2025, 17(9), 4200; https://doi.org/10.3390/su17094200
Submission received: 20 February 2025 / Revised: 30 April 2025 / Accepted: 30 April 2025 / Published: 6 May 2025
(This article belongs to the Section Economic and Business Aspects of Sustainability)

Abstract

This study develops a dynamic risk modeling approach incorporating stock-and-flow structures to comprehensively evaluate the investment risks of highway PPP projects in Western China, aiming to promote sustainable infrastructure development. Through establishing a risk accumulation model with scenario simulation and sensitivity analysis, this study systematically examines the risk factors and their propagation pathways in Western China’s highway PPP projects. The research demonstrates the dynamic complexity of project risks, particularly highlighting the prominence of operation, maintenance, and government risks. Sensitivity analysis identifies five critical risk factors: financial support adequacy, public health contingencies, legal/regulatory robustness, inflation volatility, and project uniqueness. The study proposes targeted risk management strategies emphasizing the establishment of early-warning systems and emergency response plans for critical risks. Methodologically, this research advances infrastructure risk assessment by adapting stock-and-flow modeling conventions for threshold-driven risk screening, particularly suited to underdeveloped regions like Western China. The developed rapid risk determination tool provides practical decision support for stakeholders in similar socio-economic contexts.

1. Introduction

Transport infrastructure construction is pivotal for fostering regional economic growth [1]. In China’s Western region—a critical corridor for the Silk Road Economic Belt—the Public-Private Partnership (PPP) model has emerged as a solution to address fiscal and managerial challenges posed by complex geography, climatic conditions, and uneven development. By integrating social capital and market mechanisms, PPP enhances financing efficiency, construction quality, and operational management [2,3]. Private sector participation is particularly effective in underserved regions, improving infrastructure capacity and socio-economic outcomes [4,5].
Recent policy shifts underscore the model’s strategic importance. In 2023, China’s National Development and Reform Commission and the Ministry of Finance jointly mandated broader private-sector involvement in PPP projects, reflecting both governmental support and market potential. However, sustainability risks—often overlooked in traditional assessments—have become critical to long-term viability, especially in ecologically sensitive Western regions where social risks (e.g., community displacement, stakeholder conflicts) and environmental risks (e.g., biodiversity loss, resource depletion) directly undermine sustainable development objectives.
Despite PPP’s advantages in alleviating fiscal burdens and accelerating projects, sustainability-related challenges (e.g., weak commercial viability, asset revitalization difficulties, and local governments’ unmet commitments) have slowed investment growth. Following stricter PPP library management since 2017, year-on-year growth in project numbers and cumulative investment plummeted from 69.86% and 65.44% (early 2017) to 3.3% and 1.6% (end-2022). These issues distort social capital structures and increase fiscal rigidities, deviating from PPP’s original intent. From a theoretical perspective, effective risk management frameworks inherently support sustainable development by systematically identifying and mitigating risks that span social equity, environmental protection, and economic viability. This alignment arises because sustainability-oriented risk governance ensures that project planning internalizes externalities affecting vulnerable populations and ecosystems [6]. Thus, sustainability-oriented risk identification and mitigation are urgent priorities for stakeholders.
Existing studies predominantly focus on conventional risk dimensions such as project complexity [7], government intervention [8], market demand fluctuations [9], and risk allocation mechanisms [10] while demonstrating notable neglect toward sustainability risks. This research gap manifests in multiple aspects: Fu et al.’s [11] analysis of PPP literature (2012–2021) reveals that prevailing risk assessment models systematically overlook stakeholder interests; Owolabi et al. [12] narrowly examine schedule delay as an isolated risk factor; while Shi et al. [13] restrict their investigation to social risks within urbanization contexts. Although methodologies like Bayesian networks demonstrate competence in handling risk uncertainties [14], their application becomes computationally prohibitive when incorporating environmental, social, and governance (ESG) dimensions of sustainability.
Dynamic modeling approaches offer methodological advantages for capturing sustainability risks in Western China’s highway PPP projects. This study adopts structural elements from system dynamics—specifically stock-and-flow architectures—to quantify unidirectional risk propagation pathways (e.g., Ecological fragility → design change → delay in construction period → Cost overruns). This design prioritizes the irreversibility of sustainability risks while maintaining the computational efficiency of rapid screening, which is a critical step for good upfront justification of PPP projects in China [15], where delayed decision-making can exacerbate environmental liabilities. Future research could extend the framework by incorporating bidirectional interactions (e.g., community protests triggering contract renegotiations) based on the baseline parameters established herein.
Guided by this rationale, this study empirically and theoretically examines PPP transport projects in Western China. It systematically identifies risks, develops a dynamic risk modeling framework for sustainability-aware assessment, and proposes targeted mitigation strategies. Contributions include (1) advancing sustainable infrastructure theory, (2) pragmatic solutions for regional equity, and (3) demonstrating the adaptive application of stock-and-flow modeling conventions in infrastructure risk screening.

2. Literature Review

2.1. Research on Risk Identification Based on Sustainability Factors

Traditional risk identification in highway Public-Private Partnership (PPP) projects has long been governed by a financially dominated paradigm. Flyvbjerg [16], through an empirical analysis of 364 global transportation infrastructure projects, demonstrated that 78% of early-stage risk assessment metrics focused on financial returns and cost overrun probabilities. This approach was institutionalized by the Value for Money (VFM) evaluation framework proposed by Grimsey and Lewis [17], which reduced complex risks to monetized indicators via net present value calculations. A stark manifestation of this paradigm’s limitations occurred in the 2010 Mexican toll road PPP project, where a projected 15% internal rate of return collapsed due to indigenous land rights conflicts overlooked in financial models [18]. The imperative for sustainability-oriented risk identification stems from three structural shifts: Firstly, Elkington’s [19] Triple Bottom Line framework dismantled the economic-centric worldview, revealing that exclusive focus on financial metrics leads to environmental liabilities in 38% of PPP projects over their lifecycles [20]. Secondly, the mandatory resilience requirements under SDG 9 [21] compelled multilateral institutions like the Asian Infrastructure Investment Bank (AIIB) to integrate carbon intensity thresholds into PPP eligibility criteria [22]. Most critically, the China PPP Industry Development Report released by China 2022 even suggests that the healthy development of all types of domestic PPP projects cannot be separated from the reasonable control of ESG factors, which is a necessary path to achieve sustainable development [23]. Notably, ESG-related renegotiations predominantly reflect unidirectional risk escalation rather than dynamic feedback. For instance, 82% of environmental clause disputes in ICC arbitration [14] stemmed from irreversible impacts (e.g., deforestation) that could not be mitigated through post hoc contractual adjustments, highlighting the need for models that prioritize threshold-based risk accumulation over feedback loops in high-stakes scenarios.
Contemporary research has systematically identified three sustainability risk clusters: Environmental Dimension: The IPCC [24] quantified lifecycle carbon emissions at 24,000 tonnes CO2-equivalent per highway kilometer, while Forman et al. [25] employed landscape ecology models to demonstrate 40% biodiversity loss within 500 m of four-lane highways.
Social Dimension: Intergenerational equity principles from the Brundtland Report [6] materialize as toll-pricing exclusion effects, exemplified by a 23% traffic volume decline in China’s Guidu Highway due to regressive pricing [26].
Legal-Contractual Dimension: Hodge and Greve [26] identified environmental liability clause deficiencies in 68% of developing-country PPP contracts, compounded by World Bank [27] findings that host-state policy shifts (e.g., accelerated carbon neutrality timelines) induce ±12% IRR volatility. ICC arbitration data further revealed a surge in environmental clause disputes from 9% to 34% post-2015 [28], exposing systemic governance gaps in sustainability accountability frameworks.
Based on these considerations, Grimsey and Lewis [29] proposed that risk factors should encompass both economic benefits and environmental impacts. Shen et al. [30] suggested that risks should cover multiple stakeholders. Mazher et al. [31] emphasized the need to focus particularly on legal and regulatory risks. Bai et al. [32] analyzed sustainability risk factors influencing the success of PPP projects, categorizing them into five primary indicators: culture and society, cost and economics, ecology and environment, project and organization, as well as politics and policy.

2.2. Research on Risk Management of PPP Projects in Transportation Infrastructure

Current scholarly approaches predominantly employ fuzzy theory to address risk uncertainties in public-private partnership (PPP) projects. For instance, Xu et al. [33] identified government intervention and market demand as critical risks in Chinese PPP projects through fuzzy comprehensive evaluation; however, this method relies heavily on expert subjectivity, and its static analytical framework inadequately captures the dynamic evolution of policy environments. Jokar et al. [34] developed a fuzzy multi-criteria decision model (FAHP/FTOPSIS) based on PMBOK principles, yet it fails to account for the long-term nonlinear cumulative effects of environmental and social risks in Iranian highway PPP projects. Although the FISM-MICMAC model proposed by Jiang et al. [35] effectively parses risk hierarchical relationships, its dependency on fuzzy operators and insufficient quantification of time-lag effects constrain comprehensive sustainability assessments.
Regarding complex risk interactions in large-scale transportation PPP projects [36], Akbari Ahmadabadi and Heravi [37] applied structural equation modeling (SEM) to analyze interdependencies among risk factors, but this approach struggles to model dynamic feedback mechanisms and balance socio-economic-environmental sustainability dimensions. Wu et al. [38] enhanced expert judgment granularity using two-dimensional linguistic models, though information loss during linguistic variable conversion may underestimate coupled social risk effects during long-term operations. Darko et al. [39] employed DEMATEL to identify governance-critical risks, yet their causal diagrams cannot simulate cascading failures’ impacts on integrated sustainability. Wang et al. [40] quantified decision risks through Bayesian networks, but static probability tables prove inadequate for adapting to policy-market dynamics, particularly when assessing climate-related risks.
Recent digital transformation initiatives have introduced novel pathways for dynamic and precise infrastructure risk management. Pasakorn Sengsr [41] conducted empirical analyses integrating 6D BIM technology with stakeholder interviews, revealing building information modeling’s critical role in whole-life cycle carbon management and multi-stakeholder collaborative efficiency within circular value chains, thereby establishing dual practice pathways for digital transformation through multidimensional data integration and stakeholder co-innovation. Jessada Sresakoolcha et al. [42] developed a whole-life risk detection framework for Zhongcheng Village Bridge in Zhejiang, China, by integrating digital twin and BIM technologies, enabling extreme weather risk assessments and maintenance planning, yet its application remains predominantly confined to data sharing and visualization functionalities. P Rungskunroch et al. [43] identified nonlinear relationships between seismic indicators and railway accidents through machine learning, coupled with financial loss evaluation models, ultimately proposing enhanced risk management strategies for high-seismic zones.
Existing research confirms that robust risk management frameworks should integrate comprehensive processes from identification to mitigation]. Scholarly consensus recommends allocating specific risks to the party best positioned to control them [44], with empirical evidence demonstrating that proper risk allocation significantly enhances project success rates [45]. These findings provide a theoretical foundation for developing risk management systems that balance economic viability with long-term sustainability objectives.

2.3. Dynamic Modeling Approaches for Risk Assessment

Contemporary PPP projects exhibit substantially greater complexity than conventional infrastructure projects [7,46], necessitating more sophisticated, interdisciplinary approaches for comprehensive risk management [47]. Current risk assessment methodologies present two fundamental limitations: (1) traditional techniques predominantly evaluate individual risk factors in isolation, failing to account for critical interdependencies and coupling effects among risks; (2) while methods such as interpretive structural modeling can identify risk correlations, they lack the capacity to integrate qualitative and quantitative analyses of all relevant risk factors systematically.
Dynamic modeling approaches, with their distinctive system integration capabilities, have emerged as powerful tools to address such complex systemic challenges [48]. This methodology aligns with phased implementation strategies that validate core mechanisms through initial simplifications (e.g., excluding feedback loops) before addressing higher-order complexities [49]. The main theory and tools used in this modeling process are taken from traditional system dynamics approaches. Originally developed by Professor Jay W. Forrester at MIT in the 1950s, SD employs three fundamental mechanisms—feedback loops, time delays, and nonlinear relationships—to accurately model dynamic behaviors in economic, ecological, social, and engineering systems. Its effectiveness in engineering management has been well-documented: Riaz et al. [50] applied SD to identify critical success factors for total quality management in construction, developing a performance simulation model; Liu et al. [51] created an SD-based model for dynamic risk assessment of buried natural gas pipelines. Particularly noteworthy is the work of Wu et al. [52], whose simulation of China’s manufacturing green innovation system under varying policy scenarios demonstrated SD’s unparalleled advantages in long-term policy impact assessment.
Although traditional system dynamics (SD) methodology provides a comprehensive framework for modeling complex systems, recent scholarly applications demonstrate methodological flexibility in adapting SD tools for domain-specific risk analysis. Contemporary researchers have selectively employed SD components—particularly stock-and-flow models and delay functions—to develop tailored dynamic simulation frameworks addressing diverse industrial challenges. For instance, Xu et al. [53] developed a multi-level dynamic simulation model to quantify life-cycle risk accumulation and evolution patterns in China’s offshore and onshore wind power projects. In another study, Zhao et al. [54] innovatively integrated structural equation modeling with SD stock-and-flow constructs to validate risk perception correlations among chemical industry workers. Similarly, Lu [55] constructed a streamlined rapid-assessment model incorporating both internal and external risk factors influencing low-carbon transitions in cement manufacturing enterprises. Furthermore, Chen et al. [56] employed causal loop diagrams coupled with stock-flow simulations to map social risk evolution pathways in public-private partnership (PPP) water environmental governance projects. Notably, Lyneis and Ford [57] demonstrated that infrastructure risk models often begin with unidirectional pathways to identify leverage points, reserving feedback analysis for optimization phases—a logic directly informing this study’s phased approach.
From a sustainability perspective, Dynamic Modeling Approaches offers four unique analytical strengths:
  • Integration of economic, environmental, and social risk interactions within a unified framework, particularly critical for irreversible thresholds that demand threshold-driven models over dynamic feedbacks [58];
  • Quantitative analysis of time-delayed effects from policy adjustments and market fluctuations;
  • Simulation of cumulative impacts from long-term risk factors such as climate change;
  • Rapid risk screening capabilities through modular designs, as validated in public health emergencies where time-sensitive decisions prioritize causal chains over feedback loops [59].
Existing research remains constrained by two predominant paradigms: isolated risk factor analysis or financially secure case studies. This creates a methodological void—highlighting the urgent need for novel modeling frameworks that balance computational efficiency with systemic complexity when assessing high-risk PPP projects like Western China’s highway developments.
Through systematic literature review and methodological evaluation, this study constructs a dynamic modeling framework incorporating stock-and-flow structures. The framework’s principal contributions include:
  • Identification of critical risk transmission pathways and cascade effects
  • Quantification of time-delayed impacts and nonlinear risk accumulation
  • Provision of dynamic simulation support for investment decision-making. This modular design echoes Rouwette et al. [60]’s emphasis on screening tools that sacrifice complexity for transparency and speed.

2.4. Model Scope Delimitation

Current SD applications in PPP risk management face a critical trade-off: comprehensive feedback modeling may obscure first-order risk drivers that demand immediate intervention. Our review of industry practices reveals two scenarios justifying simplified unidirectional models:
High-externality risks with irreversible impacts (e.g., species extinction from habitat fragmentation [61]), where feedback mechanisms (e.g., conservation funding increases) operate on decadal scales beyond typical PPP timelines.
Policy-driven contexts where regulatory frameworks (e.g., China’s PPP library screening rules [6]) require static risk scores for go/no-go decisions, prioritizing rapid threshold assessment over dynamic adaptation.
Consequently, this study adopts a modular SD framework that isolates sustainability risk propagation pathways, intentionally deferring feedback analysis to post-screening stages. This aligns with Bai et al.’s [32] call for ‘asymmetric risk prioritization’ in ecologically vulnerable regions.

3. Methodology and Data Presentation

3.1. Risk Identification

Risk factor identification is a key initial step in the risk management process, which must first define the project scope and expected objectives [62]. The completeness of risk identification directly affects the effectiveness of subsequent risk assessment and control. Chapman has proposed seven long-term methods for identifying risk variables and events, including brainstorming, semi-structured interviews, and the Delphi process. Nabawy et al. [63] believe that a risk decomposition structure (R.B.S) can be developed according to the relevant standards of ISO 31000 [64] to identify risks at different levels. Stewart and Fortune proposed that systems thinking should be applied to risk identification. Based on this, this study adopts a multi-dimensional and multi-level method to identify the risk factors in the implementation process of highway PPP projects in Western China.
The research team first established the theoretical basis and obtained the preliminary risk factor pool by combining the literature, including academic journals, policy documents, and relevant data on 34 PPP projects implemented by Xinjiang Exchange in recent years. This step ensured the theoretical basis and comprehensiveness of the research. To further validate and supplement the risk factors, the research team conducted field research and in-depth interviews with highway PPP project managers, engineers, financial personnel, etc. These first-hand data provided valuable practical insight and understand the difficulties and challenges in implementing the project. It is noteworthy that this study places particular emphasis on the unique characteristics of the Western region, including the potential influences of geographical environment, climatic conditions, ethnic culture, and other contextual factors on project implementation. This focused approach ensures that the derived risk inventory is better tailored to the actual conditions of highway PPP projects in China’s Western region.
After two rounds of iteration and optimization, the research established the risk list in Table 1, which divided risk factors into macro, meso, and micro levels. Macro risk is divided into internal and external risks according to endogenous and external risks. Medium risk is based on the project life cycle process, external partners, stakeholders, etc., from the construction and operation cycle to the government or social environmental impact from 8 perspectives to show its comprehensiveness. Micro-risk is a direct expression of all risk points, and this list has been screened to cover a total of 48 specific risk events. This risk list covers all stages of the PPP project life cycle and considers the multi-stakeholder perspective, laying a solid foundation for subsequent risk assessment and management work.

3.2. Risk Analysis

In this section, it is necessary to conduct a comprehensive analysis of the risks that may be incurred in the development process of the highway PPP project in Western China. Based on the comprehensive, systematic, and dynamic thinking process, and following the principles of scientific, objective, and forward-looking, it is necessary to clarify the importance of selecting risk points and clarify their internal influence relations, which is also the logical guarantee for the development of the model in the following section.

3.2.1. Project Internal Risk

Project internal risk manifests the life cycle risk of the PPP model in China. This study includes early decision risk, construction risk, and operation and maintenance risk. Early decision risk is the primary challenge for highway PPP projects in Western China. The region is vast and complex, including mountains, grassland, Gobi, desert, frozen soil, and other landforms, which first brings significant challenges to the project location and feasibility study. Premature and adequate feasibility studies lead to misestimates of the project’s technical difficulty, construction costs, and operational benefits. In addition, the multi-ethnic characteristics of the region also increase the difficulty of demand forecasting, and the travel habits and economic activity patterns of different ethnic groups may affect the utilization rate of expressways.
Regarding partner selection, the Western region’s geographical location and policy environment are uncertain for investors. Although the “Belt and Road” Initiative has brought development opportunities to the Western region, regional stability and security issues may affect the decision-making of some investors. Therefore, selecting a partner with extensive experience, financial strength, and in-depth knowledge of the Xinjiang region is important.
The construction risks of highway PPP projects in Western China are also mainly due to its unique geographical environment and climatic conditions. Climatic characteristics such as extreme temperature difference, intense ultraviolet radiation, frequent sandstorms, and winter snowstorms all put forward higher requirements for engineering technology and materials, which significantly increase the pressure of material supply and the difficulty of construction technology. It is also a considerable challenge in terms of time and cost. Secondly, the harsh natural environment increases the probability of engineering accidents, the construction safety risk is particularly prominent in the Western region, and the medical rescue conditions in remote areas are limited, further increasing the difficulty of safety management. At the same time, the resources of quality subcontractors are limited, which may affect the quality and progress of the project. Although the various micro-risk points under the control of construction risk also have causal effects, if they are put into the whole project risk system, most of them can only be used as intermediate variables, and their risk factors, such as duration, quality, and cost continue to be related to the decomposition of causes rather than external risk sources such as financial status, government intervention, and social influence.
The risks of operation and maintenance are mainly concentrated in the two aspects of insufficient revenue and cost overruns. Toll income and vehicle purchase tax subsidies allocated by the government constitute most of the income sources of highway projects in the Western region. In addition, as highway construction is a heavy asset with a significant investment scale and an extended return cycle, capital accounts for only about 30% during the construction of basic existing projects, and the rest are financing loans from banks and other financial institutions. If the long-term traffic flow fails to meet expectations or the government subsidy is slow to arrive, it will inevitably cause the project capital chain to be tight, the operation capacity to decline, or the high monthly interest costs cannot be repaid. On the one hand, it is necessary to consider the residents’ ability to pay and willingness to use, and on the other hand, it is also necessary to consider the return on investment. Unreasonable charging standards may inhibit the demand for use and further aggravate the problem of insufficient traffic volume. The risk of operating cost overruns in the Western region is also generally associated with extreme weather conditions, as such environmental factors can accelerate the aging of highway infrastructure and increase maintenance frequency and labor costs; natural disasters such as dust storms and snowstorms may cause road congestion and require additional cleanup costs, and the unstable supply of energy transportation in the Western region. These risk points will cause increased operating costs, which need to be calculated in the early stage.

3.2.2. Project External Risk

In this paper, the external risk of the project refers to the potential external threats that are not under the internal control of the project construction management team. However, it may significantly impact the project’s successful implementation, including financial risk, government risk, legal and contractual risk, social and environmental risk, and force majeure risk. The financial risks of the Department do not refer to risks such as internal fund liquidity, budget, or project compliance, but mainly refer to external risks such as the arrival of funds, financing difficulties, and changes in the financial environment. Due to the large-scale and protracted cycle of asset-heavy highway projects, they need much capital support. However, the Western region’s economic development level and financial market maturity are relatively low, resulting in limited financing channels. Coupled with the adjustment of financial policies and other aspects, for example, under the background of the general downturn in the infrastructure industry at this stage, many banks or financial institutions have stepped up the loan approval process for construction enterprises and upstream and downstream enterprises in the supply chain, and financing costs have generally increased. In addition to the characteristics of the industry, the national financial macro background, such as inflation risk and interest rate risk, cannot be ignored. The economic development of the Western region may bring certain inflationary pressure, and the adjustment of the national monetary policy may affect the interest rate level.
Regarding the legal environment and policy framework, the Western region, as an important node of the “Belt and Road” Initiative and an important bridgehead of the country’s “East alliance West”, the policy environment may change with the adjustment of national strategies. This change may affect the project’s tax and financial policies and increase the project’s uncertainty. The adjustment of environmental policies is also a potential risk factor. As the country’s emphasis on ecological and environmental protection continues to increase, relevant policies may become more stringent, increasing project environmental protection costs. Enterprises cannot resist changes in law, but they can take preventive measures in terms of contracts by strengthening the integrity and clarity of contract terms, making clear the sharing of risks at the negotiation stage, and making clear the distribution of profits as soon as possible. There are also some regional characteristics, such as cross-cultural management and ethnic policies, which need to be stipulated in the contract to avoid disputes in the future, and even if there are inevitable omissions, dispute resolution mechanisms should be established in advance.
Government risk mainly manifests in the risk of approval efficiency, policy continuity, and intervention degree from the local government as the partner. The administrative efficiency of the Western region may be affected by factors such as vast territory and poor information transmission, resulting in a longer approval process. In addition, at this stage, there has been no clear legal explanation for the centralized management of PPP projects in China, which is decided mainly by the local autonomous decision, and the adjustment of the competent government departments may affect the continuity of the policy and increase the uncertainty of the project. Excessive government intervention is another potential risk. Although government support is essential to the project, excessive intervention may affect the marketization of the project and reduce operational efficiency. However, the government’s financial support is a crucial risk point for project operation. Especially in the Western region, some projects have limited profitability, a severe shortage of toll revenue, heavy dependence on government financial subsidies, and delayed or even withheld government financial subsidies, seriously affecting the sustainable development of projects.
Cultural differences between ethnic groups regarding social influence may lead to communication barriers and management difficulties. In addition, the project may involve land acquisition, resident resettlement, and other sensitive issues that, if mismanaged, may lead to social conflicts. Environmental risks are particularly prominent in the Western region, where the ecological environment is fragile, and large-scale infrastructure construction may impact the local ecosystem. Typical examples are severe desertification, cut-off water, and affected animal habitats. The accumulation of environmental risks will also increase the possibility and severity of natural disaster risks to some extent. Labor supply is also a potential risk factor, as the Western region, with its low population density, may have a shortage of skilled workers, especially during the busy agricultural season, and may face seasonal labor shortages. In addition to the above medium-range risks, force majeure risks should also be prevented, and the allocation of losses should be prepared before the contract. In addition to natural disasters, force majeure in the Western region is related to public events such as epidemics, anti-terrorism, stability maintenance, and other regional policies. However, natural disasters may be frequent at this stage, and the other two are very unlikely but should also be prevented.

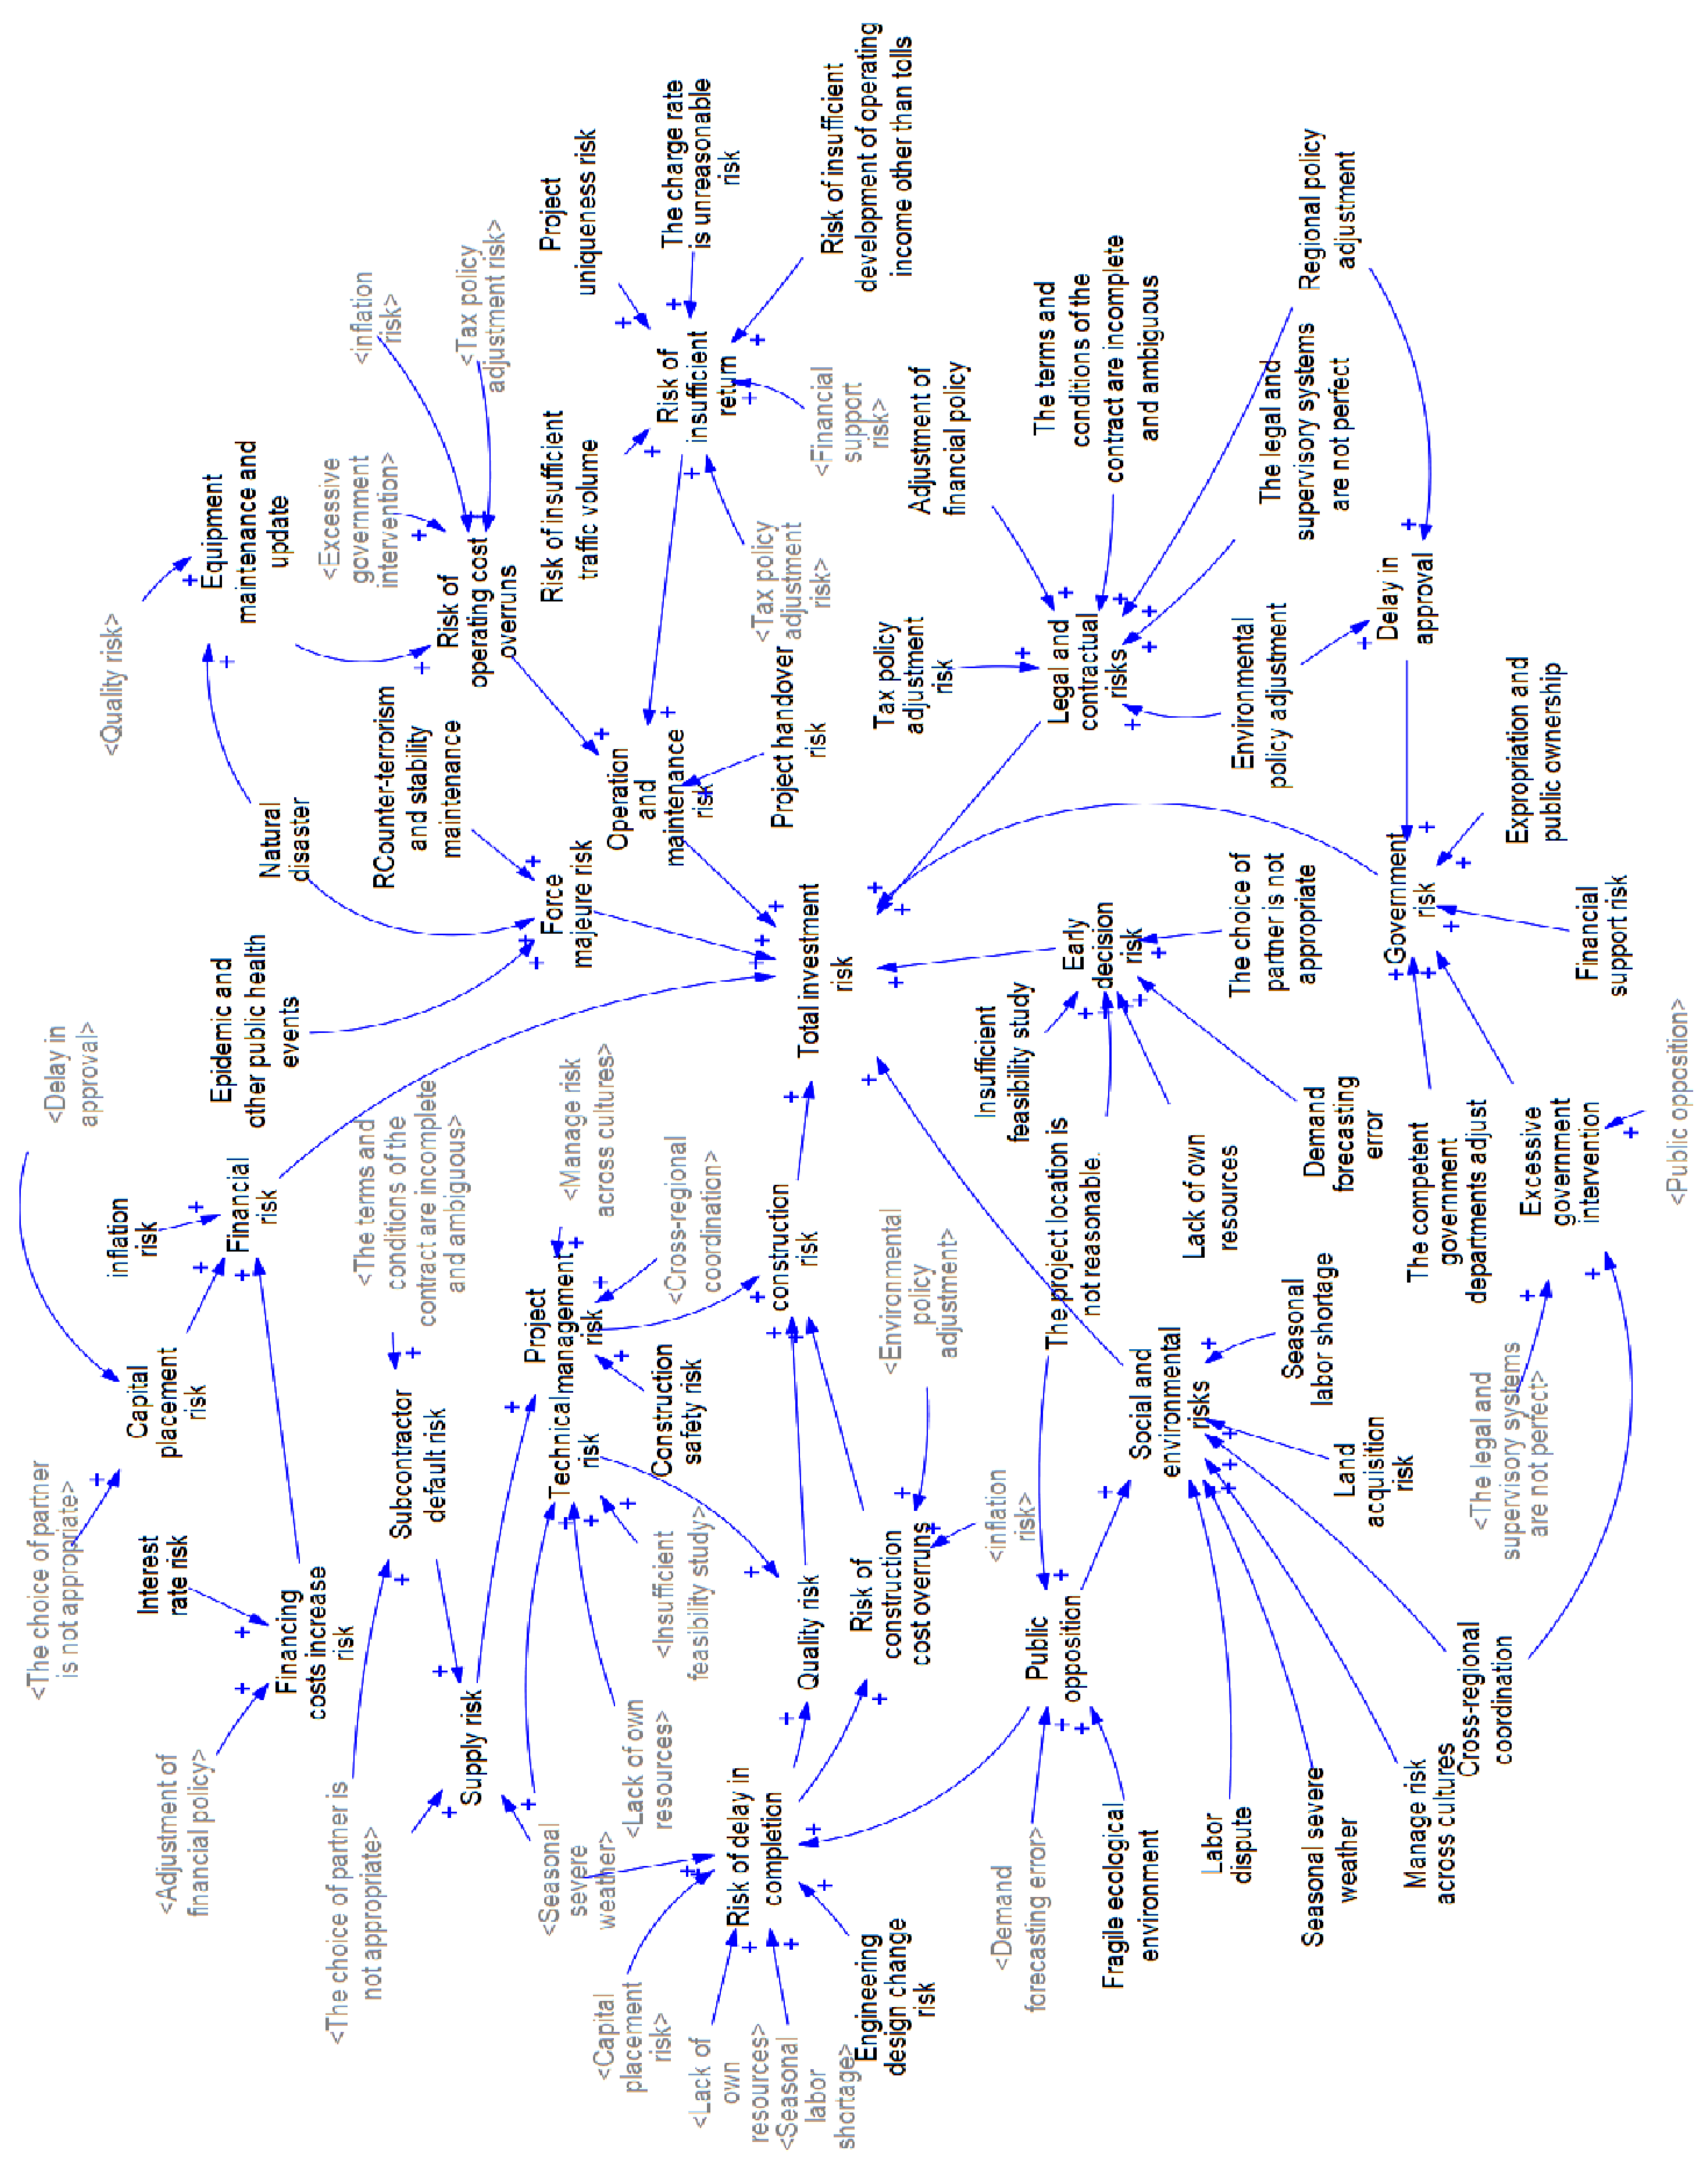
3.3. Development of a Dynamic Risk Accumulation Model Based on Systems Thinking

This study employs a system dynamics methodology, integrating core techniques such as causal loop diagrams, stock-flow structures, and time-delay effects to construct a dynamic risk accumulation model for public-private partnership (PPP) highway projects in Western China. The risk elements embedded in the model are derived from the risk identification process outlined in Section 3.1, while the causal relationships among risks are established based on the risk interdependency analysis presented in Section 3.2. The systematic modeling procedure comprises the following stages:
System Boundary Definition and Problem Framing
  • Clarify project characteristics and research objectives;
  • Identify critical risk factors (sub-objective layer risks) and delineate system boundaries;
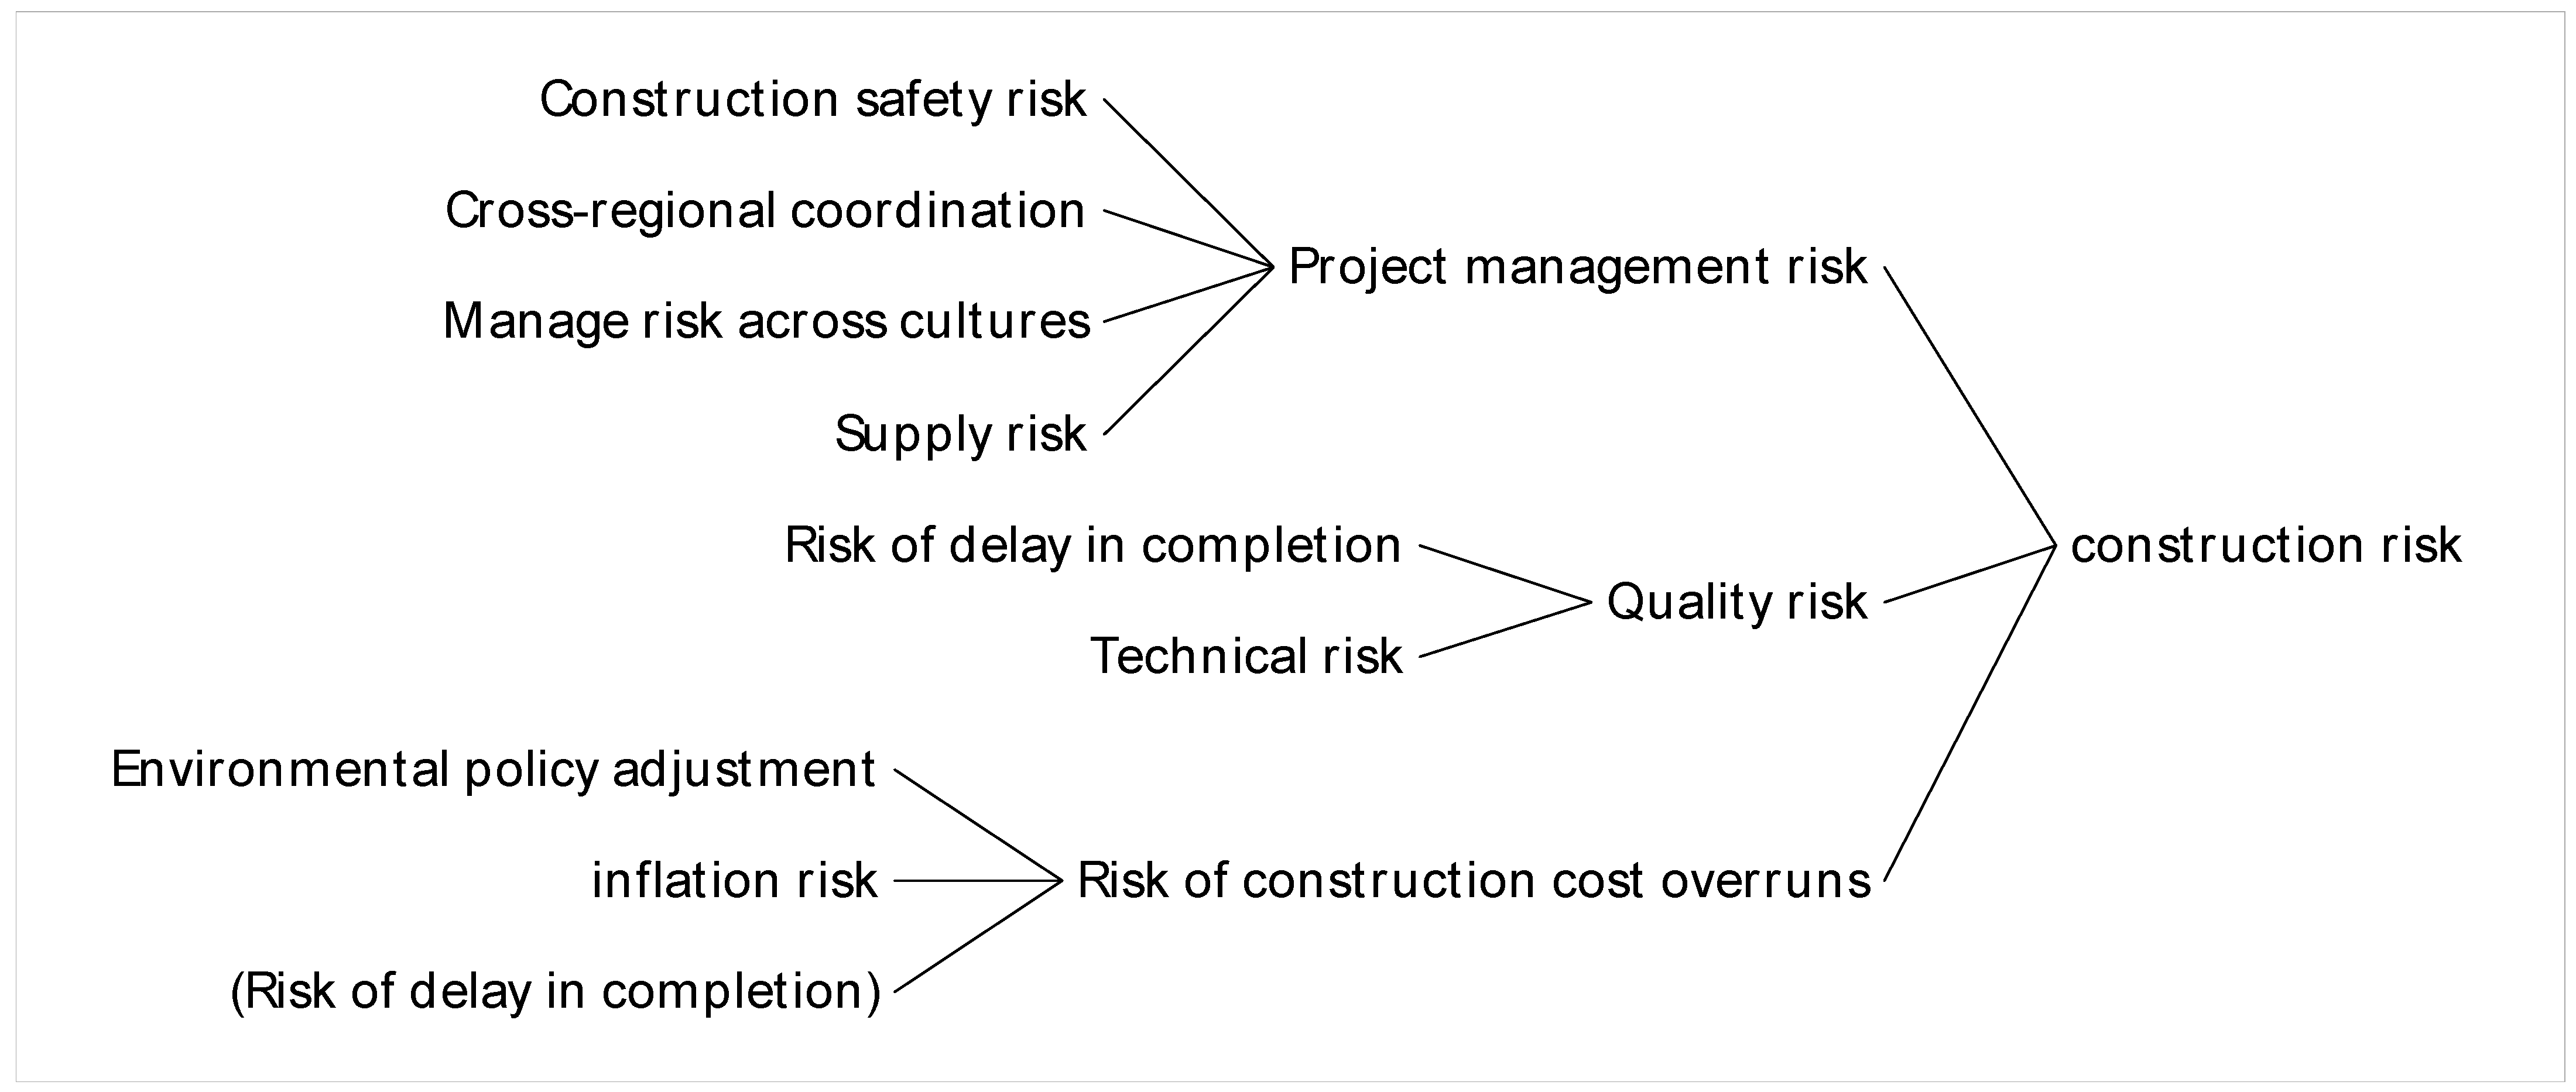
  • Establish risk propagation pathways (e.g., ecological sensitivity → design modifications → schedule delays → budget overruns).
Key Variable Identification and Causal Network Construction
  • Develop causal loop diagrams to visualize variable interactions;
  • Deliberately defer the incorporation of feedback loops (a hallmark of system dynamics) to prioritize risk threshold identification, thereby addressing urgent decision-making needs for PPP project portfolios.
System Flow Conversion and Variable Classification
  • Define stock variables (project duration status, financial health, policy stability);
  • Specify flow variables (evolution rates of various risks);
  • Establish auxiliary variables and constant parameters.
Model Equation Formulation and Validation
  • Quantify risk interrelationships, with risk accumulation mechanisms serving as the foundational modeling principle to characterize risk progression toward critical thresholds (e.g., construction cost overruns → payment default risks → operational revenue shortfalls → financial risk escalation);
  • Initialize parameters (detailed in subsequent sections);
  • Conduct model verification and parameter calibration.
Empirical Validation
  • Validate the model using historical data and expert assessments;
  • Perform sensitivity analysis and parameter optimization;
  • Ensure congruence between model behavior and real-world system dynamics.
Scenario Simulation and Decision Support
  • Design multi-dimensional risk scenarios for simulation;
  • Evaluate risk severity levels based on simulation outcomes;
  • Generate decision-support materials incorporating both quantitative and qualitative risk analyses.
Dynamic Monitoring and Model Iteration
  • Continuously collect real-time project progression data;
  • Periodically update model parameters and structures (e.g., upon validating risk accumulation mechanisms, develop bidirectional dynamic relationships: payment default risks ⇄ cost overrun risks);
  • Implement dynamic risk assessment and management protocols.
Figure 1 illustrates the causal network of risks in Western China highway PPP investments, emphasizing threshold-driven risk accumulation pathways (feedback arrows are intentionally omitted). This phased modeling strategy simultaneously addresses immediate decision-making requirements and preserves flexibility for systematic model refinement.
All risk factors in this study refer to extreme situations where risk events fall in a direction that is not conducive to the overall healthy development of the project, and there is no effective measure to prevent this state. For instance, as illustrated in Figure 2’s causality tree, risks such as construction safety risk contribute to project management risk, while project management risk, quality risk, and risk of construction cost overruns collectively lead to construction risk. The determination of these causal relationships is detailed in Section 3.2 (Risk Analysis), with primary data sourced from existing literature as well as questionnaires and interviews conducted with frontline employees and managers across 34 PPP projects in Western China.
This causal diagram reflects the causal logical relationship between various risk factors of social capital, which is static and has no meaning of time dimension. Therefore, further building a flow diagram to improve the influence mechanism among risks is necessary.

SD Model Function Relationship Was Established

The stock-flow chart model contains eight risk dimensions identified in the risk list. The model simulates the impact of changes in the quantity and size of various risks on the risks of social capital. To quantify the abstract risks and calculate the quantitative relationship, it is necessary to normalize various risk points and determine the appropriate functional relationship under the common principle of conciseness and logic consistency. This paper assumes that there is a linear relationship between the accumulation process of risks, and considering the characteristics of the project life cycle and the delay of policy impact introduces condition function and delay function to build a risk calculation method for highway PPP projects in Western China. The specific calculation formula is as follows:
R i n v e s t = I N T E G ( V i n v e s t , I i n v e s t )
R i n v e s t , V i n v e s t , and I i n v e s t stand for investment risk, investment risk change, and investment risk initial value, respectively. The INTEG function represents the integral of the return rate.
V i n v e s t = ω d e c i s i o n R d e c i s i o n + ω c o n s t r u c t I F   T H E N   E L S E (   T i m e 3   ,   R c o n s t r u c t ,   0   ) + ω o p e r a t i o n D E L A Y   F I X E D ( R o p e r a t i o n , 3,0 ) + ω f i n a n c e R f i n a n c e + ω g o v e r n m e n t S m o o t h ( R g o v e r n m e n t , 0.5 ) + ω l a w S m o o t h ( R l a w , 1 ) + ω s o c i e t y R s o c i e t y + ω f o r c e   m a j e u r e R f o r c e   m a j e u r e
R d e c i s i o n , R c o n s t r u c t , R o p e r a t i o n t , R f i n a n c e , R g o v e r n m e n t , R l a w , R s o c i e t y and R f o r c e   m a j e u r e , respectively, represent early decision risk, construction risk, operation and maintenance risk, financial risk, government risk, legal and contractual risk, social and environmental risk, and force majeure risk.
ω d e c i s i o n , ω c o n s t r u c t , ω o p e r a t i o n t , ω f i n a n c e , ω g o v e r n m e n t , ω l a w , ω s o c i e t y and ω f o r c e   m a j e u r e represent the respective weights of the above eight medium risks, respectively. Because most PPP projects in the Western region adopt the construction and management mode of a 3-year construction period + 27-year operation period, the condition function is introduced to express this characteristic in the numerical calculation of the risk during the construction period. The operation period starts from the third year, and the time delay function is introduced to correct the onset time of VAR. The smoothing function is introduced because of the delay effect of law adjustment and government risk on the total investment risk. The smooth function is treated as a discrete delay function with constant output for each time step.
For each intermediate risk, the calculation process of its risk value can be expressed as:
R M e d i u m   r i s k = I N T E G ( V M e d i u m   r i s k , I M e d i u m   r i s k )
R M e d i u m   r i s k , V M e d i u m   r i s k , and I M e d i u m   r i s k represent the value of intermediate risk, the change in risk, and the initial risk value, respectively. The INTEG function represents the integral of the return rate.

3.4. Data Source

3.4.1. Micro-Risk Initial Value Calculation

The micro-risk factors in the investment risk system of highway PPP projects in Western China mainly involve two categories. The first category includes directly quantifiable variables, which can be obtained by consulting relevant information sources. The second category includes qualitative variables that cannot be directly quantified and must be evaluated using expert research methods.
In this model, 14 risks that can be directly quantified include construction cost overrun risk, completion delay risk, operating cost overrun risk, and traffic volume insufficiency risk. The data of these risks can be directly input into the model as risk values after normalization.
The rest of the numerical risk assessment methods that cannot be directly quantified are shown below:
R E x p e r t   e v a l u a t i o n = P E x p e r t   e v a l u a t i o n × S E x p e r t   e v a l u a t i o n
R E x p e r t   e v a l u a t i o n , P E x p e r t   e v a l u a t i o n , and S E x p e r t   e v a l u a t i o n represent the risk value, the probability of risk occurrence, and the severity of the consequences that need to be evaluated by experts.
Among them, the corresponding values of risk occurrence probability and risk consequence severity are shown in Table 2 and Table 3:

3.4.2. Joint Weighting Method to Determine the Risk Weights

Nowadays, many methods exist to determine weights, but they can be generally divided into three categories. The first category is the weighting method based on the principle of “difference-driven”, which is an objective weighting method to determine weights according to the amount of information provided by indicators. The method determines weights based on the degree of variation of indicators in the overall indicators and the degree of influence on other indicators. The second type is the weighting method based on the “function-driven” principle, which is a weighting method to determine the weight of indicators by comparing the relative importance of each evaluation indicator. The third category is the comprehensive integrated weighting method, which uses the above two methods to calculate the weight. In this paper, the third weighting method is adopted, which combines the entropy weight method and G1 method, which can make up for the shortcomings of subjective and objective weighting, respectively, and consider objective reasons and expert opinions to enhance the reliability of decision-making.
(1) Entropy weight method
Step 1: Assume that there are n scoring experts and m risk factors, and matrix X is obtained according to the expert scoring data. Then, the eigenvalue gravity P i j of the i expert under the JTH risk factor is calculated to obtain the eigenvalue gravity matrix.
I n i t i a l   d a t a   m a t r i x   X = x 11 x 1 n x m 1 x m n
P i j = x i j / i = 1 n x i j ( j = 1 ,   2 ,   3 ,   ,   m )
E i g e n v a l u e   m a t r i x   P i j = P 11 P 1 n P m 1 P m n
Step 2: Calculate the entropy e j of item j risk factor;
e j = k i = 1 n p i j ln p i j
k = 1 ln n , e j > 0
The third step is redundancy g j determination;
g j = | 1 e j |
Step 4: Determine the risk weight of item j;
ω i j = g j / j = 1 m g j
Finally, objective weights of risk factors can be obtained.
(2) G1 algorithm
There are m risk factors A i 1 , A i 2 , A i 3 ,... A i m , survey experts i (n in total) ranked the importance of risk factors at all levels (use > to indicate superior):
A i 1 > A i 2 > A i 3 > > A i m , i = 1,2 , 3 , n
Furthermore, give the comparison of the importance degree between the indicators before and after:
w k 1 ÷ w k = R k , k = 2,3 , , m
In the formula, w k is the weight of the indicator A k , and the meaning of R k assignment indicates the importance of indicators before and after the Table 4 below:
The weights of indicators are calculated in reverse order according to their importance, as follows:
w i m = 1 1 + k = 2 m j = k m R j
w k 1 = R k w k , k = m , m 1 , m 2 , , 2
The risk evaluation results of N experts on highway PPP projects in Western China were comprehensively averaged, and the average weights obtained:
A w m = 1 n i = 1 n w i m
(3) The combination of weights to determine the comprehensive weight
Suppose p i is the subjective weight of risk factor index i and q i is the objective weight coefficient; then
w i = k 1 p i + k 2 q i k 1 + k 2 , i = 1,2 , , m
The k 1 and k 2 values are calculated as follows
k 1 = i = 1 m j = 1 n p i x i j ( i = 1 m j = 1 n p i x i j ) 2 + ( i = 1 m j = 1 n q i x i j ) 2
k 2 = i = 1 m j = 1 n q i x i j ( i = 1 m j = 1 n p i x i j ) 2 + ( i = 1 m j = 1 n q i x i j ) 2

4. Calculation Results and Analysis

4.1. Calculation Result

This model was developed using Vensim PLE x64.lnk software. After importing the stock-flow diagram shown in Figure 3 into the software, the initial values and weights of each risk factor were calculated based on the specified data computation method and then entered into the model.
Once the system equations were fully input, the model settings were configured according to the typical project lifecycle in Western China:
INITIAL TIME = 0
FINAL TIME = 30
TIME STEP = 0.125
Unit: Years
After completing all simulation parameter settings, the simulation was initiated by clicking the “Simulate” button on the VENSIM main toolbar. The dynamic variations of the target risk values are illustrated in Figure 4.
The baseline data in Figure 4 is derived from two sources: one part consists of obtainable actual data (such as traffic volume) that was input after normalization processing, while the other part comprises non-quantifiable data calculated from the expert survey results presented in Section 3. Through computational processing by the software, Figure 4 visually presents the evolving trends of abstracted risk values across various risk modules. The chart above shows the change trend in the risk value of the social capital side risk. The investment risk value of social capital is a gradually increasing trend and has an apparent cumulative effect, which can reflect the change in the number of risk factors over time. In the project construction stage, the main risks are reflected in cost, construction period, quality, and financing, and the risk value is not apparent. After entering the operation period, risks such as income begin to play a role, and the risk value starts to increase significantly with the change of time.
The construction risk value in the construction period is shown in the figure above. After entering the operation period, the construction risk value does not change, but the risk still impacts the investment risk of social capital. The construction risk value increases with time, reflecting the accumulation of risks. Operation risk does not play a role in the construction period, so in the first three years of the operation risk map, the value is 0. After entering the operation period, the operation risk factors play a role, and the value increases. The accumulation degree of construction risk is smaller than that of operation risk because the construction period is much smaller than the operation time, so the accumulation effect of operation risk is more pronounced, but it does not mean that construction risk is less important than operation risk. A specific judgment can be drawn based on comparing the maximum risk faced in the same period.
Financial, government, legal, and contract risks increase linearly because their internal structure is simple, and there are few cross-impact risks. The closer the risk factors are to the later role of the project, the more pronounced the effect of mutual influence, transmission, and superposition of risk factors. The risk accumulation trend can be obtained from the relevant images but is not sensitive to the risk level change. Because the risk model constructed by the Dynamic Risk Accumulation Modeling Approach is the risk change trend when no one interferes, and risks accumulate over time, the risk value simulated by the model cannot be directly compared with the traditional risk evaluation results. The values calculated by this model will be graded and then analyzed and evaluated in the next section.

4.2. Risk Grade Determination

Since the risk value obtained in the previous section alone cannot directly determine the risk level of the assessed risk, this study also needs to clarify the classification of risk, that is, to provide criteria for judging the risk level. Regarding the research results of Niu Xiaoye et al., based on the maximum risk value Xmax, this paper divides the risks [0, Xmax] into five levels, which are low risk, medium-low risk, medium risk, high risk, and high risk, respectively. The specific classification criteria are shown in Table 5.
Since Figure 4 only displays the cumulative risk values with different reference systems, making direct horizontal comparisons between secondary risks difficult, clicking the “Table Time Down” button in Vensim reveals the annual variations in risk values. This facilitates more accurate computational analysis. The calculation results are presented in Table 6:
As can be seen from the table, the most considerable risk value in this case is the operation and maintenance risk, and the simulation result after 30 years is 164.762. Combined with the risk classification table, it can be calculated that the medium-high risk, in this case, is only the government risk. The medium risk includes the early decision risk, financial risk, social and environmental risk, and force majeure risk; the medium-low risk is the legal and contract risk, and the low risk is the construction risk.

4.3. Sensitivity Analysis

Based on the risk assessment model established above, this study can obtain the risk level of each targeted risk of PPP projects of transportation construction enterprises in Western China. However, to obtain more targeted risk control measures, it is necessary to identify further the impact of fundamental risk factors on target risks. The ranking of these risk factors can provide a basis for developing risk-coping strategies in this study.
Sensitivity analysis can be used to judge the degree of influence of the change of a particular factor on the target, which is achieved by systematically changing the values of relevant variables. Therefore, this study can use this method to analyze the influence of each boundary risk factor on the target risk. The greater the sensitivity, the greater the influence of the risk factor on the target risk. It is easier to control the target risk by formulating strategies against it. Ranking the sensitivity can be used to rank the importance of each risk factor.
The single-factor analysis method is adopted in this study. When other factors remained unchanged, each boundary risk factor was individually increased by 20%, and the model was run to examine the impact of changes in a single risk factor on the overall risk [65]. After the calculation of the model, the top five risk factors that have the most significant impact on the total investment risk are shown in Table 7:

5. Discussion

5.1. Discussion on Conclusion of Risk Assessment

The operation and maintenance risk is assessed as high risk, driven by the Western region’s complex geographical environment and extreme climatic conditions. For example, roads in the Taklimakan Desert are subject to dust erosion throughout the year, while roads in the Tianshan Mountains are vulnerable to snow, ice, and landslides, significantly increasing the difficulty and cost of infrastructure maintenance. In addition, the traffic flow is not up to expectations, which is also an important reason for the high operation and maintenance risk. Although the government has set up the minimum vehicle flow guarantee mechanism, due to the tremendous financial pressure of local governments and the lack of contract enforcement, the double pressure of insufficient social capital income and high operation and maintenance costs has resulted.
The government risk is rated as medium and high risk, which is closely related to the political ecology and geo-environment of the Western region. Cross-border transport projects involve national security and foreign policy, making decision-making difficult. At the same time, local governments need to balance the interests of various ethnic groups when promoting PPP projects, and it is difficult to formulate and implement policies. In addition, financial pressures on local governments have also affected their ability to meet commitments, further exacerbating government risks.
Early decision, financial, social, environmental, and force majeure risks are rated as medium risks. The risk of early decision is mainly due to the complexity of traffic demand forecast. The financial risk is related to the limited financing channels and high financing costs in Western China. Social and environmental risks are reflected in ecological fragility and multi-ethnic cultural background. Force majeure risk mainly refers to natural disasters such as earthquakes and sandstorms.
Legal and contractual risk is rated as low to medium risk, reflecting the gradual improvement of China’s PPP legal framework in recent years. Since 2014, The State Council and the Ministry of Finance have issued documents regulating the operational process of PPP projects. The “Guiding Opinions on Standardizing the Implementation of the New Mechanism for Cooperation between Government and Social Capital” issued in 2023 further promoted the standardized development of the PPP model and provided more evident legal protection for projects.
The construction risk is rated as low, mainly based on China’s rich experience and technical level in infrastructure construction. However, the complexity of the geographical environment in the Western region may still bring supply chain risk, plateau hypoxia, and other problems that need to be addressed in project management.
In the sensitivity analysis, the financial support risk becomes the primary risk, mainly due to the low level of economic development in the Western region and the limited local financial capacity. In 2022, the balance of bank loans in the Western region only accounts for 18.7% of the country’s total, and financing channels are limited, directly affecting the financing capacity of PPP projects. In addition, transportation infrastructure construction projects usually have large investment scales and long return cycles, and the stability and timeliness of government subsidies are difficult to guarantee fully. The risk of public health events such as the epidemic significantly impacts PPP projects in the Western region. As the core area of the Belt and Road Initiative, Xinjiang has frequent cross-border movement of people and goods, and the pressure of epidemic prevention and control has increased the uncertainty of project implementation. The risk of an imperfect legal or regulatory system is a common problem in domestic PPP projects. The Western region faces more challenges in policy implementation and supervision due to multi-ethnic communities, and the problems of contract disputes and uneven distribution of benefits are more prominent. The risk of inflation is closely related to the characteristics of regional economic development. The Western region has a single industrial structure and weak anti-inflation ability. Inflation may lead to a sharp rise in the cost of construction materials and labor, affecting the economic benefits of projects. Although the project’s unique risk is a low priority in the overall risk assessment, the impact of its change on the total risk cannot be ignored. The project traffic return risk will increase with each alternative route.

5.2. Key Risk Control Measures

In managing risks for PPP transportation infrastructure projects, it is imperative to establish a comprehensive, multi-level control system. Specifically, we recommend that provincial transportation authorities develop a life-cycle risk management platform integrating three core functionalities: intelligent risk early warning, government-enterprise collaborative governance, and regional development synergy.
The risk early warning module should implement real-time monitoring of critical indicators, including traffic volume, financial revenue-expenditure ratios, and price indices, utilizing digital twin technology for dynamic forecasting. The government-enterprise cooperation module requires establishing a cross-departmental joint conference system to conduct regular evaluations of risk mitigation effectiveness. For the regional development module, project companies should commit to maintaining local procurement ratios exceeding 10% during feasibility studies while supporting workforce training center construction to enhance local economic benefits.
To address government fiscal sustainability risks, the implementation of a “dual-assessment + dual-buffer” mechanism is essential. During project identification, provincial finance departments must conduct quantitative assessments evaluating (1) local government budget expenditure growth rates, (2) fund income volatility, and (3) implicit debt resolution progress, with regions scoring below 60 points requiring provincial guarantees. Throughout operations, financial capacity should be reassessed triennially, incorporating extreme stress tests simulating scenarios such as 30% reductions in land transfer income. Concurrently, project companies must allocate risk reserves equivalent to 5% of toll revenues while promoting the development of PPP-specific credit insurance products to disperse default risks through reinsurance mechanisms. Empirical evidence from Yunnan Province’s highway project demonstrates this combined approach reduces financial risk incidents by 42%.
For public health emergencies, a three-tier “prevention-response-recovery” system should be implemented. Engineering designs must incorporate convertible emergency spaces (e.g., service areas adaptable as temporary medical facilities) and allocate epidemic prevention reserves at 5000 RMB per kilometer. Intelligent dispatch systems should automatically activate at Level II health alerts, implementing measures including passenger-cargo separation, contactless toll collection, and emergency logistics corridors. Franchise agreements must explicitly define compensation mechanisms, permitting (1) operational period extensions of up to 24 months for pandemics exceeding 3 months duration and (2) variable viability gap subsidies indexed to traffic volume reductions.
Considering Western regions’ unique legal environment, standard contracts should incorporate (1) ethnic autonomy clauses, (2) localized dispute resolution mechanisms (achieving >80% mediation rates), and (3) legal change compensation provisions (triggering renegotiation when policy changes cause ≥5% cost increases). Additionally, it established oversight committees comprising legal experts and ethnic minority representatives to conduct regular contract performance reviews. Project companies should fund annual allocations (≥500,000 RMB) for (1) grassroots law enforcement training and (2) bilingual legal education programs to strengthen legal risk prevention capabilities.
Inflation risk management requires a “dual-index linkage” strategy, tethering material prices to provincial construction cost indices. When quarterly increases exceed 5%, cost overruns should be shared among project companies, user fees, and government subsidies at 3:4:3 ratios (referencing Gansu Province’s model). For project-specific risks, governments should guarantee minimum traffic volumes (70% of projections) for the first five years, with surplus revenues distributed via graduated schemes (30% for 80–100% of projections; 50% above 100%). Competitive road construction within 15-km radii should be restricted while granting project companies ancillary development rights (e.g., roadside advertising, photovoltaic installations), with 20% of derived revenues allocated to risk-sharing funds.
These measures should be formalized through franchise agreements and other legal instruments, with pilot implementation in 3–4 Western provinces/states followed by broader adoption after 2–3 full lifecycle validations. Implementation should be overseen by risk management committees chaired by independent directors to ensure systematic execution.

6. Conclusions and Future Works

This study provides a comprehensive assessment of the accumulation status of risks in the implementation of public-private partnership (PPP) highway projects in Western China based on systems thinking, which provides new perspectives and methodological support for promoting the sustainable development of infrastructure in these regions. By constructing a multi-level system dynamics model with phased implementation logic, this research clarifies the threshold-driven accumulation patterns of risk factors in highway PPP projects while thoroughly investigating the sequential escalation pathways among risk subsystems and their impacts on project sustainability.
Results indicate that the risk system of highway PPP projects in Western China exhibits significant complexity and dynamism, with operational risks and government-related risks being particularly prominent. These risks primarily originate from the region’s unique geographical environment, climatic conditions, and policy implementation uncertainties, posing threats to the full lifecycle sustainability of projects. Sensitivity analysis identifies five critical risk factors ranked by impact severity: fiscal support risk, public health emergency risk, imperfect legal/regulatory framework risk, inflation risk, and project uniqueness risk. To address these risks, the study proposes a sustainability-oriented risk governance framework, including enhanced application of digital technologies for lifecycle monitoring and risk assessment, contingency mechanisms for emergencies, and mitigation measures for legal/policy changes, thereby improving economic, environmental, and social sustainability.
The theoretical contributions of this study are threefold: First, it pioneers the phased application of system dynamics to risk assessment in highway PPP projects in Western China, prioritizing threshold identification over dynamic feedback modeling. Second, it develops a system dynamics model incorporating sustainability factors (e.g., social-environmental risks, legal-contractual risks), providing a replicable analytical framework. Third, it proposes empirically grounded risk management strategies to guide governmental decision-making and investor practices.
However, this study has several limitations. First, the availability of PPP project data in Western China may lead to potential estimation biases in some model parameters. Second, necessary simplifications—including the exclusion of feedback mechanisms—enhance screening efficiency but require future validation of bidirectional interactions. Third, the generalizability of the research findings requires further validation, particularly regarding their applicability across different regional characteristics.
Future research directions include (1) conducting cross-regional comparative studies to explore regional variations in risk characteristics; (2) integrating big data and artificial intelligence technologies to enhance the timeliness and accuracy of risk assessment; (3) incorporating feedback mechanisms (e.g., risk mitigation measures altering original propagation pathways); (4) investigating the impact mechanisms of national strategies (e.g., the Belt and Road Initiative) on PPP project risks; and (5) exploring common risk management patterns across different types of infrastructure PPP projects. These research directions will contribute to the further refinement of the PPP project risk management theoretical framework, providing more substantial theoretical support and practical guidance for sustainable infrastructure development.

Author Contributions

Conceptualization, X.D. and X.W.; methodology, M.L. and X.D.; software, M.L.; validation, M.L., X.Y. and X.D.; formal analysis, M.L. and X.Y.; investigation, M.L. and X.W.; resources, X.W. and X.Y.; data curation, M.L.; writing—original draft preparation, M.L.; writing—review and editing, X.D. and X.Y.; visualization, M.L.; supervision, X.D.; project administration, X.D.; funding acqui-sition, X.W. and X.Y. All authors have read and agreed to the published version of the manuscript.

Funding

This research is supported by Science and Technology Projects of Xinjiang Transportation Industry Science and Technology Projects (2022-ZD-011), Xinjiang Key R&D Program Projects (2022B03033-1), and the project of Tianchi in Xinjiang Uygur Autonomous Region.

Institutional Review Board Statement

Not applicable.

Informed Consent Statement

Not applicable.

Data Availability Statement

The data used in this study are available upon reasonable request from the corresponding author.

Conflicts of Interest

The authors declare no conflict of interest.

References

  1. Hong, J.; Chu, Z.; Wang, Q. Transport Infrastructure and Regional Economic Growth: Evidence from China. Transportation 2011, 38, 737–752. [Google Scholar] [CrossRef]
  2. Li, Z.; Wang, H. Institutional Quality, Economic Development, and the Sustainable Outcomes of PPP projects: An Empirical Analysis of Failed PPP Projects in China from 2014 to 2020. Heliyon 2024, 10, e30977. [Google Scholar] [CrossRef] [PubMed]
  3. Chowdhury, A.N.; Chen, P.H.; Tiong, R.L.K. Credit Enhancement Factors for Financing Independent Power Producer (IPP) Projects in Asia. Int. J. Proj. Manag. 2015, 33, 1576–1587. [Google Scholar] [CrossRef]
  4. Carnis, L.; Yuliawati, E. Nusantara: Could the PPP be the Solution for Indonesian Airport Infrastructures Between sky and Earth? Case Stud. Transp. Policy 2013, 1, 18–26. [Google Scholar] [CrossRef]
  5. Jiang, W.; Yang, Q.; Jiang, J. Operational Risk Management of Public–Private Partnership Infrastructure Projects: A Bibliometric Literature Review. Buildings 2022, 12, 1905. [Google Scholar]
  6. National Development and Reform Commission (NDRC). Guiding Opinions on Regulating the Implementation of the New Mechanism for Public-Private Partnerships (Document No. 1092); Retrieved from National Development and Reform Commission. 2023. Available online: https://www.ndrc.gov.cn (accessed on 20 September 2024).
  7. Zhang, Y. Research on the Identification Model of Interest Conflict Influencing Factors in PPP Projects Construction of Smart City. Alex. Eng. J. 2022, 61, 12689–12698. [Google Scholar] [CrossRef]
  8. Zhang, L.; Sun, X.; Xue, H. Identifying critical risks in Sponge City PPP projects using DEMATEL method: A case study of China. J. Clean. Prod. 2019, 226, 949–958. [Google Scholar] [CrossRef]
  9. AlGeelani, A.; Abu Dabous, S.; Venkatachalam, S. Investigation of Project Delivery Risks in Public-Private-Partnership (PPP) Infrastructure Projects in UAE-A Stakeholder’s Perspective. In 2020 Advances in Science and Engineering Technology International Conferences (ASET); IEEE: New York, NY, USA, 2020; pp. 1–5. [Google Scholar]
  10. Sastoque, L.M.; Arboleda, C.A.; Ponz, J.L. A Proposal for Risk Allocation in Social Infrastructure Projects Applying PPP in Colombia. Procedia Eng. 2016, 145, 1354–1361. [Google Scholar] [CrossRef]
  11. Fu, L.; Sun, H.; Fang, Y.; Xu, K. A Systematic Review of the Public-Private-Partnership Literature Published Between 2012 and 2021. J. Civ. Eng. Manag. 2023, 29, 238–252. [Google Scholar] [CrossRef]
  12. Owolabi, H.A.; Bilal, M.; Oyedele, L.O.; Alaka, H.A.; Ajayi, S.O.; Akinade, O.O. Predicting Completion Risk in PPP Projects Using Big Data Analytics. IEEE Trans. Eng. Manag. 2018, 67, 430–453. [Google Scholar] [CrossRef]
  13. Shi, Q.; Liu, Y.; Zuo, J.; Pan, N.; Ma, G. On the management of social risks of hydraulic infrastructure projects in China: A case study. Int. J. Proj. Manag. 2015, 33, 483–496. [Google Scholar] [CrossRef]
  14. Tarazona, A.; Coelho, M.; Fernandes, S.; Matos, J. Transport Infrastructure Risk Management in the Context of Climate Change: Policies, Challenges, and Opportunities. Transp. Res. Procedia 2023, 72, 1404–1411. [Google Scholar] [CrossRef]
  15. Ministry of Finance of China. Notice on Further Promoting the Standardized Development and Transparent Operation of Public-Private Partnerships (PPP); No. 119 2022; Government of the People’s Republic of China: Beijing, China, 2022. Available online: https://www.gov.cn/zhengce/zhengceku/2022-11/18/content_5727758.htm (accessed on 1 October 2024).
  16. Flyvbjerg, B. What you Should Know About Megaprojects and Why: An Overview. Proj. Manag. J. 2014, 45, 6–19. [Google Scholar] [CrossRef]
  17. Grimsey, D.; Lewis, M.K. Public Private Partnerships: The Worldwide Revolution in Infrastructure Provision and Project Finance; Edward Elgar Publishing: Cheltenham, UK, 2004; pp. 89–112. [Google Scholar]
  18. World Bank. Mexico Toll Road Restructuring: Lessons Learned; Report No. 78556-MX; World Bank: Washington, DC, USA, 2013; Available online: https://documents.worldbank.org/en/publication/documents-reports/documentdetail/785561468260476690/mexico-toll-road-restructuring-lessons-learned (accessed on 5 October 2024).
  19. Elkington, J. Cannibals with Forks: The Triple Bottom Line of 21st Century Business; Capstone Publishing: Oxford, UK, 1998; pp. 73–95. [Google Scholar]
  20. Ameyaw, E.E.; Chan, A.P. Evaluating Key Risk Factors for PPP Water Projects in Ghana. J. Facil. Manag. 2015, 13, 133–155. [Google Scholar] [CrossRef]
  21. United Nations. Transforming Our World: The 2030 Agenda for Sustainable Development; Resolution A/RES/70/1; United Nations: New York, NY, USA, 2015; Available online: https://sdgs.un.org/2030agenda (accessed on 5 October 2024).
  22. Asian Infrastructure Investment Bank (AIIB). Moonshots for the eMerging World; AIIB: Beijing, China, 2022; Available online: https://www.aiib.org/en/news-events/asian-infrastructure-finance/_common/pdf/AIIB-Asian-Infrastructure-Finance-2022.pdf (accessed on 16 October 2024).
  23. Li, S.Z. Research on the Sustainable Development Path of PPP Projects under the ESG Concept. In China PPP Industry Development Report (2022); Ma, H.T., Yang, J.M., Eds.; Social Sciences Academic Press: Beijing, China, 2023; pp. 308–320. [Google Scholar]
  24. IPCC. Climate Change 2021: The Physical Science Basis. Contribution of Working Group I to the Sixth Assessment Report; Cambridge University Press: Cambridge, UK, 2021; Available online: https://www.ipcc.ch/report/ar6/wg1/ (accessed on 16 October 2024).
  25. Forman, R.T.T.; Sperling, D.; Bissonette, J.A.; Clevenger, A.P. Road Ecology: Science and Solutions; Island Press: Washington, DC, USA, 2003; pp. 201–230. [Google Scholar]
  26. Hodge, G.A.; Greve, C. Public–Private Partnerships: An International Performance Review. Public Adm. Rev. 2007, 67, 545–558. [Google Scholar] [CrossRef]
  27. World Bank. Policy Consistency in Infrastructure PPPs; Infrastructure Finance Series; World Bank: Washington, DC, USA, 2020; Available online: https://openknowledge.worldbank.org/handle/10986/33845 (accessed on 16 October 2024).
  28. International Chamber of Commerce (ICC). Dispute Resolution Statistics 2021; ICC: Paris, France, 2022; Available online: https://iccwbo.org/dispute-resolution-services/arbitration/arbitration-statistics (accessed on 16 October 2024).
  29. Grimsey, D.; Lewis, M.K. Evaluating the Risks of Public Private Partnerships for Infrastructure Projects. Int. J. Proj. Manag. 2002, 20, 107–118. [Google Scholar] [CrossRef]
  30. Shen, L.Y.; Platten, A.; Deng, X.P. Role of Public Private Partnerships to Manage Risks in Public Sector Projects in Hong Kong. Int. J. Proj. Manag. 2006, 24, 587–594. [Google Scholar] [CrossRef]
  31. Mazher, K.M.; Chan, A.P.C.; Choudhry, R.M.; Zahoor, H.; Edwards, D.J.; Ghaithan, A.M.; Mohammed, A.; Aziz, M. Identifying Measures of Effective Risk Management for Public–Private Partnership Infrastructure Projects in Developing Countries. Sustainability 2022, 14, 14149. [Google Scholar] [CrossRef]
  32. Bai, L.; Li, Y.; Du, Q. A Fuzzy Comprehensive Evaluation Model for Sustainability Risk Evaluation of PPP Projects. Sustainability 2017, 9, 1890. [Google Scholar] [CrossRef]
  33. Xu, Y.; Yeung, J.F.Y.; Chan, A.P.C. Developing a Risk Assessment Model for PPP Projects in China—A Fuzzy Synthetic Evaluation Approach. Autom. Constr. 2010, 19, 929–943. [Google Scholar] [CrossRef]
  34. Jokar, E.; Aminnejad, B.; Lork, A. Assessing and Prioritizing Risks in Public-Private Partnership (PPP) Projects Using the Integration of Fuzzy Multi-Criteria Decision-Making Methods. Oper. Res. Perspect. 2021, 8, 100190. [Google Scholar] [CrossRef]
  35. Jiang, X.; Lu, K.; Xia, B.; Liu, Y.; Cui, C. Identifying Significant Risks and Analyzing Risk Relationships for Construction PPP Projects in China Using Integrated FISM-MICMAC Approach. Sustainability 2019, 11, 5206. [Google Scholar] [CrossRef]
  36. Fang, C.; Marle, F.; Xie, M.; Zio, E. An Integrated Framework for Risk Response Planning Under Resource Constraints in Large Engineering Projects. IEEE Trans. Eng. Manag. 2013, 60, 627–639. [Google Scholar] [CrossRef]
  37. Akbari, A.A.; Heravi, G. Risk Assessment Framework of PPP-megaprojects Focusing on Risk Interaction and Project Success. Transp. Res. Part A Policy Pract. 2019, 124, 169–188. [Google Scholar] [CrossRef]
  38. Wu, Y.; Xu, C.; Li, L.; Wang, Y.; Chen, K.; Xu, R. A risk Assessment Framework of PPP Waste-to-energy Incineration Projects in China Under a 2-dimension Linguistic Environment. J. Clean. Prod. 2018, 183, 602–617. [Google Scholar] [CrossRef]
  39. Darko, D.; Zhu, D.; Quayson, M.; Hossin, A.; Omoruyi, O.; Bediako, A.K. A multicriteria decision framework for governance of PPP projects towards sustainable development. Socio-Econ. Plan. Sci. 2023, 87, 101580. [Google Scholar] [CrossRef]
  40. Wang, J.; Luo, L.; Sa, R. A Quantitative Analysis of Decision-Making Risk Factors for Mega Infrastructure Projects in China. Sustainability 2023, 15, 15301. [Google Scholar] [CrossRef]
  41. Kaewunruen, S.; Baniotopoulos, C.; Guo, Y.; Sengsri, P.; Teuffel, P.; Bajare, D. 6D-BIM Applications to Enrich Circular Value Chains and Stakeholder Engagement Within Built Environments. In Lecture Notes in Civil Engineering, Proceedings of the 4th International Conference “Coordinating Engineering for Sustainability and Resilience” & Midterm Conference of CircularB “Implementation of Circular Economy in the Built Environment”, Timișoara, Romania, 29–31 May 2024; Ungureanu, V., Bragança, L., Baniotopoulos, C., Abdalla, K.M., Eds.; Springer Nature: Cham, Switzerland, 2024; Volume 489, pp. 346–356. [Google Scholar]
  42. Kaewunruen, S.; Sresakoolchai, J.; Ma, W.; Phil-Ebosie, O. Digital Twin Aided Vulnerability Assessment and Risk-Based Maintenance Planning of Bridge Infrastructures Exposed to Extreme Conditions. Sustainability 2021, 13, 2051. [Google Scholar] [CrossRef]
  43. Maneerat, P.; Rungskunroch, P.; Persaud, P. Seismic hazard analysis and financial impact assessment of railway infrastructure in the US West Coast: A machine learning approach. PLoS ONE 2024, 19, e0308255. [Google Scholar] [CrossRef]
  44. Cao, Y.; Li, H.; Su, L. Deciphering the Difference Puzzle of Risk-sharing: A Comparative Analysis of Infrastructure PPP Development Within China and US. Proj. Leadersh. Soc. 2024, 5, 100135. [Google Scholar] [CrossRef]
  45. Fleta-Asín, J.; Muñoz, F. How does Risk Transference to Private Partners Impact Public-Private-Partnerships’ Success? Empirical Evidence from Developing Economies. Socio-Econ. Plan. Sci. 2020, 72, 100869. [Google Scholar] [CrossRef]
  46. Pagoni, E.G.; Georgiadis, P. System Dynamics Approaches to Public-Private-Partnerships: A Literature Review. Syst. Res. Behav. Sci. 2020, 37, 277–291. [Google Scholar] [CrossRef]
  47. Dziadosz, A.; Rejment, M. Risk Analysis in Construction Project - Chosen Methods. Procedia Eng. 2015, 122, 258–265. [Google Scholar] [CrossRef]
  48. Liu, X.; Zeng, M. Renewable Energy Investment Risk Evaluation Model Based on System Dynamics. Renew. Sustain. Energy Rev. 2017, 73, 782–788. [Google Scholar] [CrossRef]
  49. Sterman, J.D. All models are wrong: Reflections on becoming a systems scientist. Syst. Dyn. Rev. 2002, 18, 501–531. [Google Scholar] [CrossRef]
  50. Riaz, H.; Khan, K.I.A.; Ullah, F.; Tahir, M.B.; Alqurashi, M.; Alsulami, B.T. Key Factors for Implementing Total Quality Management in Construction Sector: A System Dynamics Approach. Ain Shams Eng. J. 2023, 14, 101903. [Google Scholar] [CrossRef]
  51. Liu, A.; Chen, K.; Huang, X.; Li, D.; Zhang, X. Dynamic Risk Assessment Model of Buried Gas Pipelines Based on System Synamics. Reliab. Eng. Syst. Saf. 2021, 208, 107326. [Google Scholar] [CrossRef]
  52. Wu, W.; Sheng, L.; Tang, F.; Zhang, A.; Liu, J. A System Dynamics Model of Green Innovation and Policy Simulation with an Application in Chinese ManuFacturing Industry. Sustain. Prod. Consum. 2021, 28, 987–1005. [Google Scholar] [CrossRef]
  53. Xu, Y.; Du, R.; Pei, J. The Investment Risk Evaluation for Onshore and Offshore Wind Power Based on System Dynamics Method. Sustain. Energy Technol. Assessments 2023, 58, 103328. [Google Scholar] [CrossRef]
  54. Zhao, Y.; Zhang, M.; Liu, T.; Mebarki, A. Impact of safety attitude, safety knowledge and safety leadership on chemical industry workers’ risk perception based on Structural Equation Modelling and System Dynamics. J. Loss Prev. Process Ind. 2021, 72, 104542. [Google Scholar] [CrossRef]
  55. Lu, Q.; Liu, M. Research on risks and prevention of low-carbon transition in cement enterprises based on system dynamics. Manag. Adm. 2024, 1–16, in press. (In Chinese) [Google Scholar] [CrossRef]
  56. Chen, X.; Zhao, Y.; Xue, S. A Study on the Dynamic Evolution Paths of Social Risks in PPP Projects of Water Environmental Governance—From the Vulnerability Perspective. Sustainability 2024, 16, 3951. [Google Scholar] [CrossRef]
  57. Lyneis, J.M.; Ford, D.N. System dynamics applied to project management: A survey, assessment, and directions for future research. Syst. Dyn. Rev. 2007, 23, 157–189. [Google Scholar] [CrossRef]
  58. Ford, A. Modeling the environment: An introduction to system dynamics models of environmental systems. Syst. Dyn. Rev. 1999, 15, 269–294. [Google Scholar] [CrossRef]
  59. Homer, J.B.; Hirsch, G.B. System dynamics modeling for public health: Background and opportunities. Syst. Dyn. Rev. 2006, 222, 123–136. [Google Scholar] [CrossRef]
  60. Rouwette, E.A.; Vennix, J.A.; van Mullekom, T. Group model building effectiveness: A review of assessment studies. Syst. Dyn. Rev. 2002, 18, 5–45. [Google Scholar] [CrossRef]
  61. Dasgupta, P. The Economics of Biodiversity: The Dasgupta Review; HM Treasury: London, UK, 2021. [Google Scholar]
  62. Stewart, R.W.; Fortune, J. Application of systems thinking to the identification, avoidance and prevention of risk. Int. J. Proj. Manag. 1995, 13, 279–286. [Google Scholar] [CrossRef]
  63. Nabawy, M.; Ofori, G.; Morcos, M.; Egbu, C. Risk Identification Framework in Construction of Egyptian Mega Housing Projects. Ain Shams Eng. J. 2021, 12, 2047–2056. [Google Scholar] [CrossRef]
  64. ISO 31000:2018; Risk Management—Guidelines. International Organization for Standardization: Geneva, Switzerland, 2018.
  65. Wei, Y.P. Risk Assessment of Private Sector in Rail Transit PPP Projects Based on System Dynamics; Zhongnan University of Economics and Law: Wuhan, China, 2022. [Google Scholar]
Figure 1. Causality diagram of investment risk of expressway PPP projects in Xinjiang, China.
Sustainability 17 04200 g001
Figure 2. Construct risk causality tree.
Sustainability 17 04200 g002
Figure 3. Investment risk flow chart of highway PPP projects in Western China.
Sustainability 17 04200 g003
Figure 4. Risk simulation chart.
Sustainability 17 04200 g004
Table 1. Investment risk list of highway PPP projects in Western China.
Macro RiskMedium RiskMicro RiskMicro-Risk Description
Project internal riskEarly decision riskInsufficient feasibility studyThe lack of research and analysis in the early stage of the project leads to insufficient decision-making basis.
The project location is not reasonable.The selected project location is unsuitable for project implementation and may affect project efficiency.
Lack of own resourcesParticipants lack the technical, human, or financial resources to support the project.
The choice of partner is not appropriate.The selected partner’s lack of competence or credibility will affect the project’s cooperation.
Demand forecasting errorInaccurate estimates of future usage requirements of the project affect revenue expectations.
Construction riskProject management riskLack of project management ability may lead to inefficient project implementation.
Supply riskThe supply of raw materials or equipment is unstable, affecting the project schedule and cost.
Subcontractor default riskThe subcontractor’s failure to perform contractual obligations affects the quality and schedule of the project.
Technical riskThe technology used is not mature or applicable, affecting the project’s implementation effect.
Quality riskProject quality is not up to standard, which may result in rework or security risks.
Risk of construction cost overrunsThe actual construction cost exceeded the budget, affecting the financial balance of the project.
Construction safety riskSafety accidents occur during construction, resulting in casualties or economic losses.
Risk of delay in completionThe project cannot be completed on time, affecting the start time of operation.
Engineering design change riskFrequent design changes lead to increased costs and schedule delays.
Operation and maintenance riskRisk of operating cost overrunsActual operating costs were higher than expected, affecting project profitability.
Risk of insufficient traffic volumeActual traffic flow was lower than expected, affecting revenue.
Risk of insufficient returnThe revenue generated by the project is lower than expected, affecting the return on investment.
The charge rate is an unreasonable risk.The set charging standard is unreasonable, affecting the utilization rate or revenue.
Project uniqueness riskThe project lacks differentiated competitive advantages or faces homogeneous competition, resulting in insufficient market appeal.
Risk of insufficient development of operating income other than tollsFailure to fully develop other sources of income limits earnings potential.
Project handover riskDisputes arise, or assets are in poor condition when the project is handed over.
Equipment maintenance and updateImproper maintenance or delayed updates of equipment may affect operational efficiency.
Project external riskFinancial riskFinancing costs increase riskFinancing costs rise, increasing the financial pressure on projects.
Capital placement riskFinancing, loans, subsidies and other funds did not arrive on time, affecting the progress of the project.
Inflation riskInflation is higher than expected, affecting project costs and benefits.
Interest rate riskInterest rate changes affect project financing costs and investment returns.
Legal and contractual risksThe terms and conditions of the contract are incomplete and ambiguousThere are loopholes or ambiguities in the contract, which may cause disputes.
Adjustment of financial policyChanges in financial policies affect project financing and operations.
Tax policy adjustmentChanges in tax policies affect the project’s financial status.
Environmental policy adjustmentEnvironmental policy changes increase project costs or restrict operations.
Regional policy adjustmentRelated policy changes affect project support or preferential terms.
The legal and supervisory systems are not perfectThe imperfect laws and regulations increase the legal risk of the project.
Government riskDelay in approvalThe administrative approval process is slow, delaying the project’s progress.
The competent government departments adjust.Changes in government institutions or personnel affect project progress.
Excessive government interventionToo much government interference in the operation of projects affects efficiency.
Financial support riskGovernment financial support is insufficient or not timely, affecting the project capital chain.
Expropriation and public ownershipGovernment expropriation or public ownership of projects affects investors’ rights and interests.
Social and environmental risksPublic oppositionProjects encounter public opposition, affecting implementation or operation.
Labor disputeImproper handling of labor relations leads to disputes affecting the project.
Manage risk across cultures.Cultural differences lead to management conflicts and affect project collaboration.
Fragile ecological environmentThe project site is sensitive to the ecological environment, increasing environmental protection pressure.
Cross-regional coordinationCross-regional project coordination is complicated and affects efficiency.
Seasonal severe weatherExtreme weather affects construction schedules and operational safety.
Seasonal labor shortageThe shortage of labor supply in certain seasons affects the project schedule.
Land acquisition riskLand acquisition is difficult or costly, which affects project implementation.
Force majeure riskNatural disasterNatural disasters such as heavy snow and ice caused project losses.
Epidemic and other public health eventsPublic health emergencies affect project schedules and operations.
Counter-terrorism and stability maintenanceThe regional security situation affects the safety and regular operation of the project.
Table 2. Classification criteria for risk probability of PPP projects in transportation construction enterprises.
Lv.ScoreOccurrence Probability (%)Instructions
Level 11[0,20]Minimal probability of occurrence
Level 22(20,40]Small probability of occurrence
Level 33(40,60]Moderate probability
Level 44(60,80]Greater probability of occurrence
Level 55(80,100]Maximum probability of occurrence
Table 3. Criteria for classifying the severity of risk consequences of PPP projects for transportation construction enterprises.
Lv.ScoreRank of InfluenceInstructions
A1tinyThe consequences are negligible, but records should be kept.
B2lesserUsing fewer control measures can achieve the goal.
C3moderationThis can be achieved with large-scale controls.
D4largerUsing large-scale control measures can partially achieve the goal.
E5maximumThe project failed or was canceled.
Table 4. R k assignment table.
R k AssignmentAssignment Meaning
1.0Equally important
1.2Slightly important
1.4Obvious importance
1.6Strongly important
1.8vital
Table 5. Risk classification table.
Risk LevelValue-at-Risk
Low risk[0, 1/5Xmax]
Medium-low risk[1/5Xmax, 2/5Xmax]
Medium risk[2/5Xmax, 3/5Xmax]
Medium-high risk[3/5Xmax, 4/5Xmax]
High risk[4/5Xmax, Xmax]
Table 6. Details of the value of target risk change over time.
Time (Year)Early Decision RiskConstruction RiskOperation and Maintenance RiskFinancial RiskSocial and Environmental RisksGovernment RiskLegal and Contractual RisksForce Majeure Risk
12.4845.46303.33672.6042.9682.0342.339
512.42217.23611.61615.30613.29016.87210.17411.698
1024.84417.23641.98228.31726.64638.45120.34923.396
1537.26617.23672.67741.32940.00360.03630.52435.094
2049.68817.236103.37254.34053.36081.62240.69946.793
2562.11017.236134.06767.35166.716103.20850.87458.491
3074.53317.236164.76280.36280.073124.79461.04970.189
Table 7. Sensitivity analysis results.
Boundary Risk FactorChange in Investment Risk
Financial support risk3.7%
Risk of public health events such as epidemics3.5%
Risk of inadequate legal or regulatory systems2.9%
Inflation risk1.8%
Project uniqueness risk1.8%
Disclaimer/Publisher’s Note: The statements, opinions and data contained in all publications are solely those of the individual author(s) and contributor(s) and not of MDPI and/or the editor(s). MDPI and/or the editor(s) disclaim responsibility for any injury to people or property resulting from any ideas, methods, instructions or products referred to in the content.

