Article

The Impact of Supply Chain Quality Management on Firm Performance in Manufacturing Business: The Moderating Role of Digital Intelligence

1
School of Economics and Management, Dalian Jiaotong University, Dalian 116028, China
2
Research Institute of the Belt and Road, Dalian Jiaotong University, Dalian 116028, China
*
Author to whom correspondence should be addressed.
Sustainability 2025, 17(9), 4165; https://doi.org/10.3390/su17094165
Submission received: 2 April 2025 / Revised: 29 April 2025 / Accepted: 2 May 2025 / Published: 5 May 2025

Abstract

Facing growing uncertainty and rapid technological change, traditional supply chain management can no longer meet the complexity and performance needs of manufacturing firms. Consequently, supply chain quality management (SCQM) has gained increasing attention as a key approach. At the same time, supply chain quality integration (SCQI), supply chain strategy (SCS), supply chain capability (SCC), and digital intelligence (DI) are recognized for their potential to enhance coordination, adaptability, and value creation across the supply chain. In this study, we investigate the impact of SCQM on firm performance (FP), focusing on the mediating roles of SCQI, SCS, and SCC and the moderating role of DI. Based on survey data from Chinese manufacturing enterprises, structural equation modeling (SEM) is employed to analyze these relationships. The results reveal that SCQM positively affects FP and significantly enhances SCQI, SCS, and SCC. Furthermore, SCQM influences FP indirectly through SCQI and SCS, underscoring the key mediating roles of the latter. DI is also found to significantly moderate the SCQM–FP relationship, strengthening the dynamic interaction among these variables and offering practical insights for improving FP via DI in SCQM frameworks. In this research study, we build a new theoretical model grounded in the Structure–Conduct–Performance (SCP) paradigm, filling a gap in the existing literature. For the first time, we jointly explore the mediating effects of SCQI and SCS and the moderating role of DI in the SCQM–FP link, providing an innovative contribution that enriches both academic understanding and managerial practice.

1. Introduction

In today’s dynamic business environment, manufacturing companies face unprecedented competition and challenges. To maintain a competitive edge, firms continually refine their supply chain management strategies to enhance performance and fortify their market standing. Meanwhile, as supply chains grow increasingly complex, quality-related issues have drawn heightened scrutiny. Effective supply chain quality management (SCQM) serves as a catalyst for strengthening the competitiveness of a firm and significantly amplifying overall performance. Beyond ensuring product quality, manufacturing firms must reinforce SCQM to uphold supply chain resilience and foster sustainable development, thereby securing a lasting competitive advantage in an increasingly intense market landscape. According to the 141 vehicle recall announcements issued by the State Administration for Market Regulation of China in 2024, approximately 11.237 million vehicles were recalled, reflecting a 67% surge from the previous year. Among these cases, body structure defects constituted the largest share. These quality deficiencies pose substantial risks to consumer safety and corporate reputations, highlighting the pivotal role of SCQM, which has emerged as an urgent priority for manufacturing firms in light of these challenges.
In the field of supply chain management, SCQM is widely recognized as a critical factor in enhancing firm performance (FP). The integration of supply chain management and quality management represents a logical progression in managerial approaches aimed at improving organizational performance [1]. The existing literature consistently highlights that FP is related to SCQM [2]. When firms execute supply chain operations, collaboration and integration among upstream and downstream stakeholders are essential to optimizing performance. Quality management departments play a pivotal role in aligning resources and capabilities across various functions, fostering quality-driven practices that facilitate information sharing, inventory management, and on-time delivery. Despite the acknowledged significance of SCQM, scholars emphasize the need for a more comprehensive investigation into its direct and indirect effects on FP [3]. Some studies suggest that the direct impact of SCQM is limited, failing to fully capture its influence on performance. For example, some scholars have examined the mediating roles of factors such as supply chain integration, operational performance, and organizational learning capability in the relationship between SCQM and firm performance [4,5]. However, current research on the indirect effects of SCQM on performance remains incomplete and requires further exploration. Consequently, it is necessary to explore the underlying mechanisms and indirect pathways through which SCQM affects FP [6].
The core competencies of the supply chain play a crucial role in the effective implementation of SCQM. Insights into SCQM from world-class enterprises suggest that acquiring new capabilities and resources is essential to success [7]. However, systematic empirical research examining how SCQM indirectly impacts FP through core supply chain competencies remains limited. In the current market landscape, three key capabilities may serve as critical factors for enhancing and sustaining FP: supply chain quality integration (SCQI), supply chain strategy (SCS), and supply chain capability (SCC) [8,9,10,11]. These elements not only reflect a firm’s ability to embed quality principles into its supply chain operations but also determine the agility and alignment of strategic objectives across the supply chain. Prior studies have highlighted that well-integrated quality processes, coherent supply chain strategies, and dynamic capability significantly contribute to improved operational efficiency, innovation potential, and competitive positioning. Accordingly, these capabilities are increasingly viewed as essential mechanisms through which SCQM can generate sustained performance benefits. Nonetheless, the current literature still lacks comprehensive evidence on the specific pathways through which SCQM influences SCQI, SCS, and SCC, calling for further empirical investigation.
Additionally, in 2023, the Ministry of Industry and Information Technology of China and seven other departments jointly issued the “Guiding Opinions on Accelerating the Transformation and Upgrading of Traditional Manufacturing Industries”. This policy encourages leading enterprises to share solutions, fostering the digital transformation of upstream and downstream industries while enhancing supply chain digitalization and industrial resource sharing. Manufacturing firms, along with their suppliers and retailers, are increasingly leveraging data to improve their performance. Data-driven supply chains optimize supply chain processes and adopt various digital technologies to boost performance and maintain competitiveness in the market [12]. In the manufacturing industry, digital intelligence (DI) technologies show the potential to modernize SCQM and enhance FP. DI technologies, represented by artificial intelligence and digital twins, streamline data flows in supply chain management and play a central role in advancing enterprise productivity [13]. Therefore, the shift from traditional intelligence to DI is essential, as DI enables real-time, data-driven, and adaptive decision making in complex supply chain environments. This not only demonstrates the significant potential of DI but also highlights its strategic advantages in enhancing supply chain performance and supporting the sustainable development of manufacturing enterprises. However, research on how DI applications in SCQM influence FP remains limited.
In summary, in this research study, we developed a conceptual framework based on the Structure–Conduct–Performance (SCP) framework to examine the mediating and moderating effects of SCQI, SCS, SCC, and DI on the relationship between SCQM and FP. We used structural equation modeling to analyze survey data from Chinese manufacturing firms and formulated practical recommendations for improving SCQM, thereby enhancing overall FP. Considering these factors, we addressed the following inquiries:
Question 1:
How does SCQM in manufacturing enterprises impact FP through SCQI, SCS, and SCC?
Question 2:
How does DI in manufacturing enterprises influence SCQM?

2. Literature Review

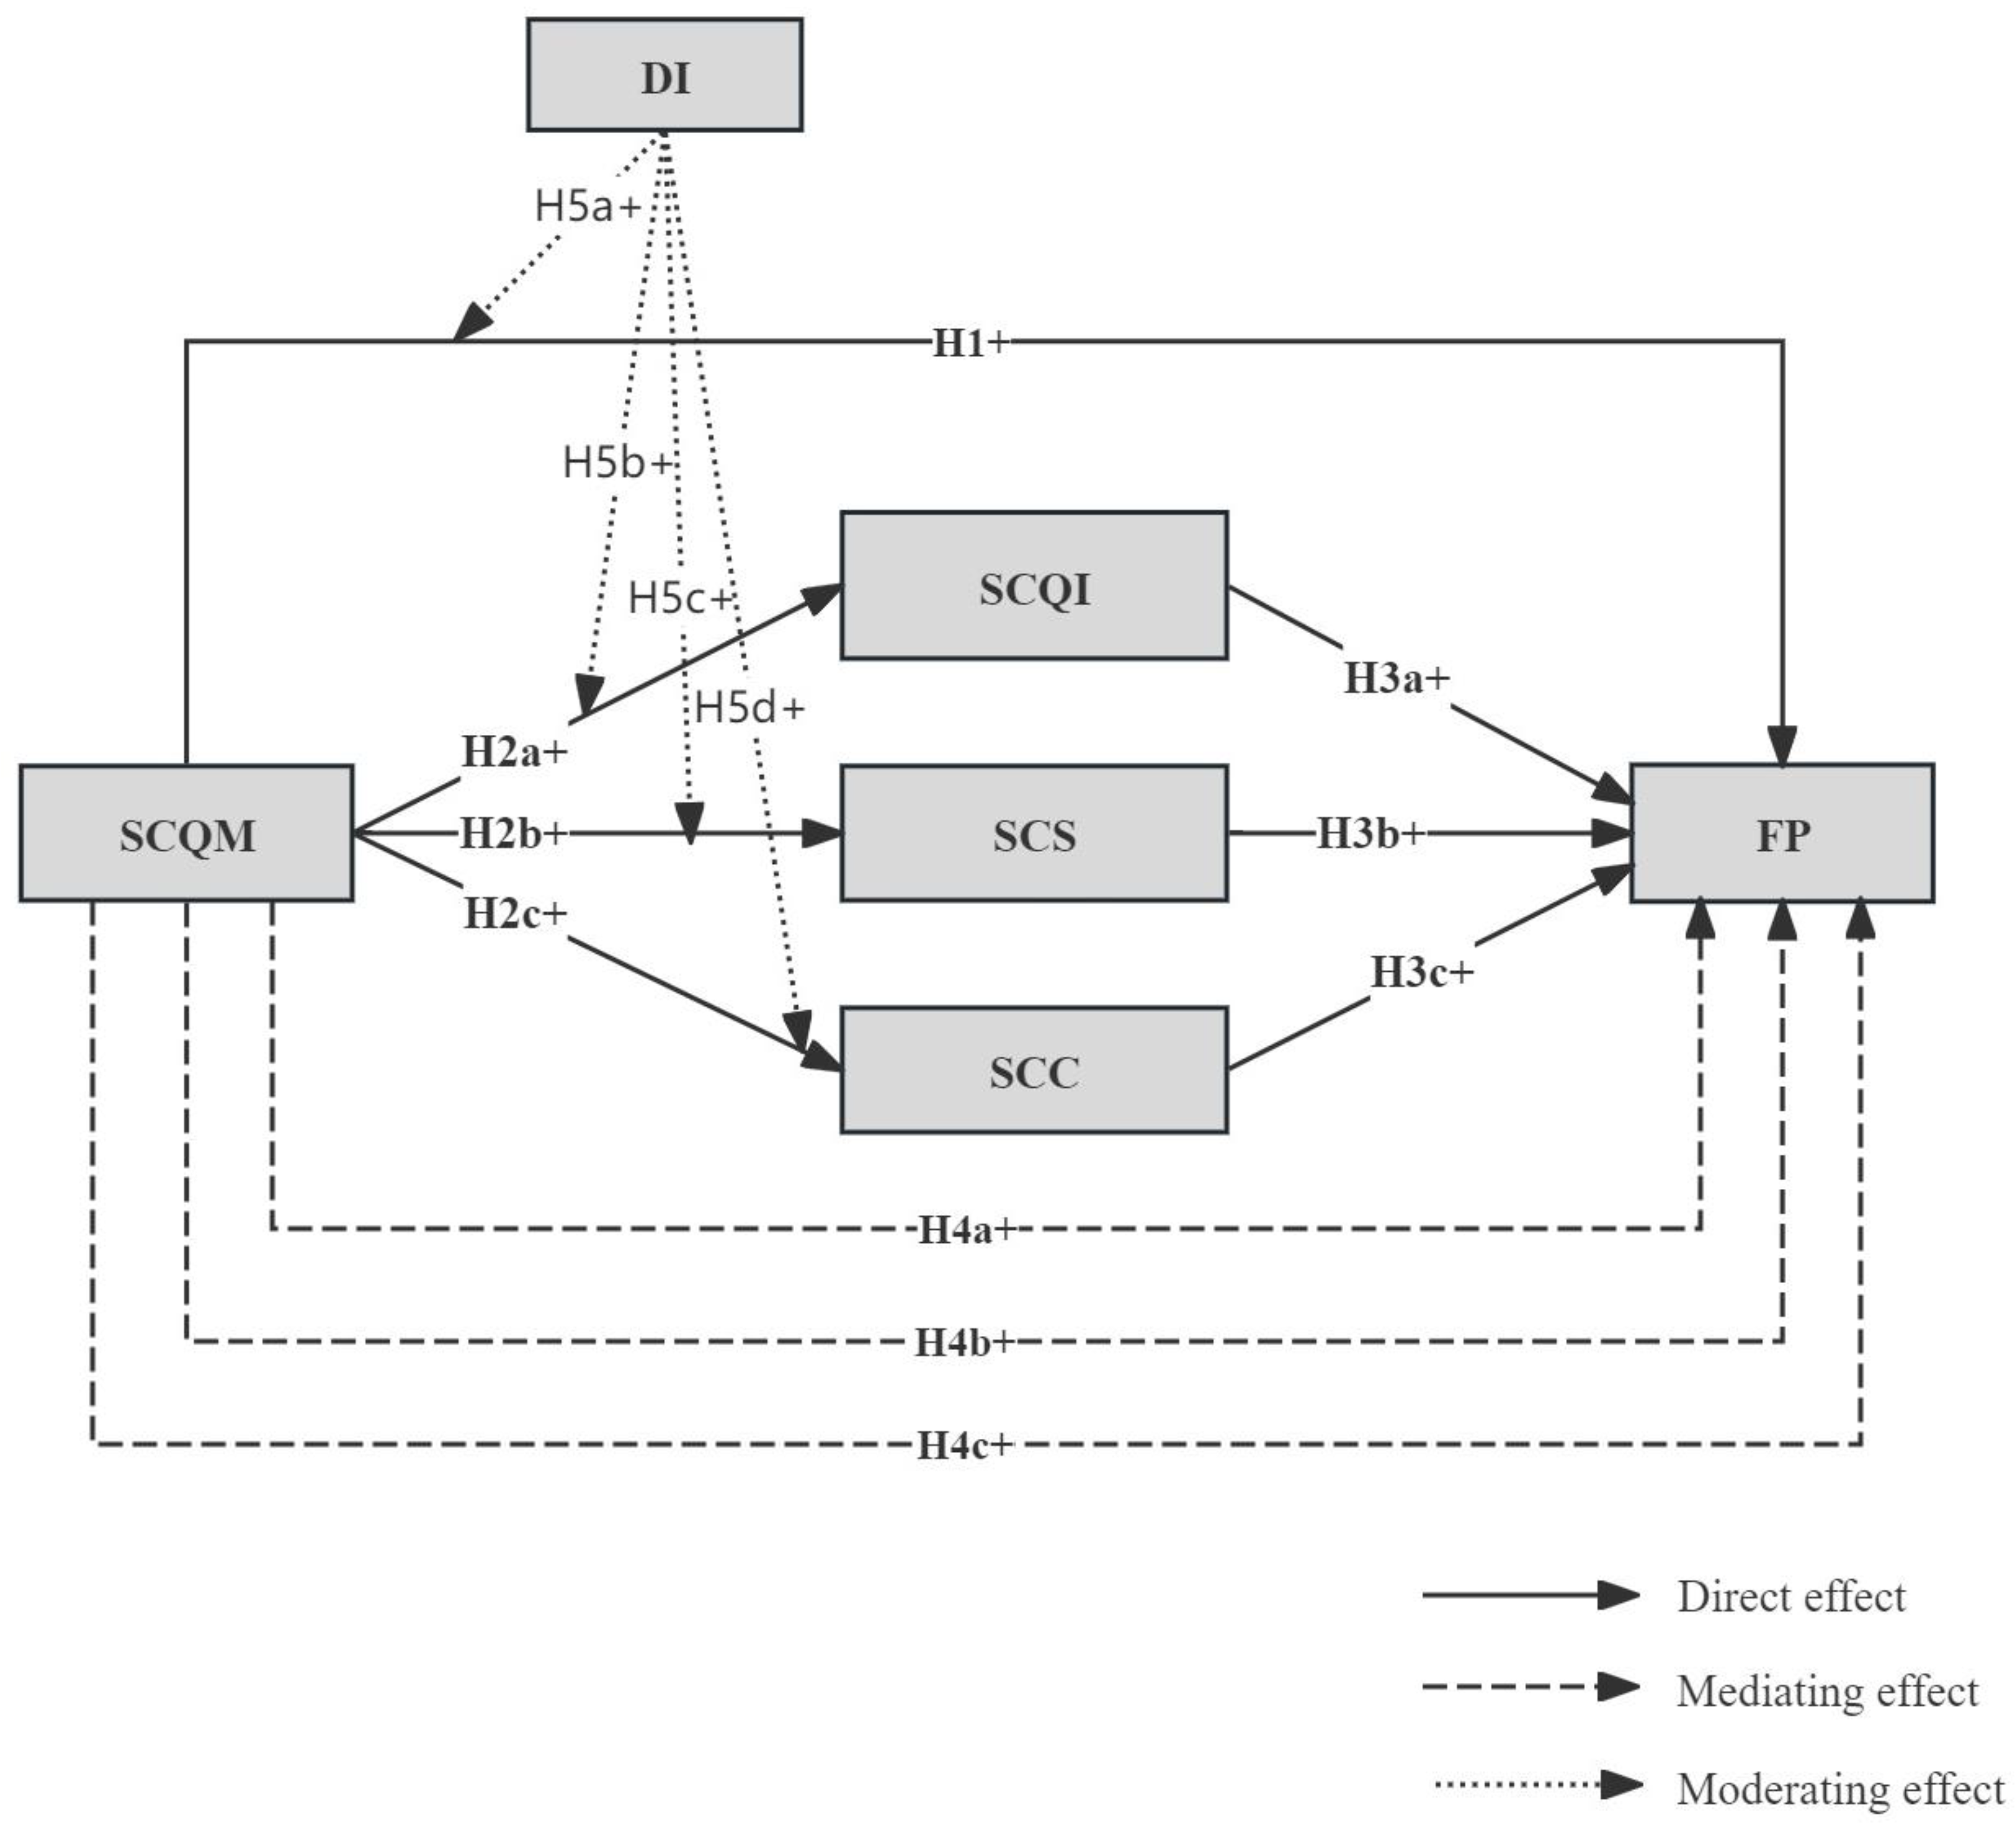
2.1. Theoretical Foundation and Hypotheses

In this research study, we developed a conceptual model based on the Structure–Conduct–Performance (SCP) analysis framework and dynamic capability theory to investigate how SCQM influences FP, both directly and indirectly. The SCP framework evaluates corporate competitive behavior and market efficiency from the Structure–Conduct–Performance perspective. Companies adjust their strategies based on market conditions, modifying their operations and supply chain behaviors to positively impact profit levels [14]. In the context of a dynamic and competitive market, the SCP framework provides a useful lens to understand how external conditions shape internal strategic responses and outcomes. In this study, market structure refers to the external environment in which firms operate, including industry characteristics, competitive intensity, and customer demands. Market conduct denotes the supply chain management practices that firms adopt in response to this structure, including SCQM, SCQI, SCS, and SCC. As firms adjust their conduct through these practices, they aim to improve their overall performance, such as operational efficiency, customer satisfaction, and financial outcomes. Therefore, it is essential to examine how different dimensions of supply chain conduct, shaped by the market structure, contribute to firm performance within this framework. Dynamic capability theory suggests that firms can achieve sustainable competitive advantages in volatile environments and dynamic markets by developing, consolidating, or reorganizing internal and external resources and capabilities. The advantages of any entity within the supply chain depend not only on its structure but also on the context in which its capabilities are deployed [6]. In this study, building on dynamic capability theory, we propose a series of hypotheses to examine how SCS, SCC, and DI influence the relationship between SCQM and FP in the current market environment. These elements are considered critical dynamic capabilities that can enhance a firm’s competitiveness and, ultimately, improve its performance. We aim to investigate how SCQI, SCS, SCC, and DI influence the relationship between SCQM and FP based on the SCP framework and dynamic capability theory, aiming to help manufacturing firms enhance their overall performance. The conceptual model of this study is illustrated in Figure 1.

2.2. Supply Chain Quality Management (SCQM) and Firm Performance (FP)

In today’s fiercely competitive business environment, SCQM has gained immense importance. Due to globalization and constantly evolving market demands, firms must ensure quality management across the entire supply chain to maintain sustainable competitive advantages and improve FP [15]. The concept of SCQM emerged in the 1990s, aiming to merge the strengths of supply chain management and quality management [16]. While SCM emphasizes inter-organizational collaboration and the integration of supply chain members, QM primarily focuses on intra-organizational continuous improvement [17].
Prior research on SCQM has shown some variation in how the concept is defined and operationalized. Some scholars have concentrated primarily on internal quality practices. For instance, Kaynak and Hartley (2008) [18] defined SCQM through internal-oriented practices such as leadership, training, customer focus, employee relations, quality data and reporting, process management, product/service design, and supplier quality management. In contrast, other researchers have adopted a broader, more supply chain-wide perspective. Sahoo (2025) [19] suggested that SCQM comprises three key elements: multi-tier quality governance, supply chain process alignment and coordination, and quality-centric collaboration. Abdallah et al. (2023) [4] conceptualized SCQM through five key practices: supplier quality management, customer quality involvement, supply chain information sharing, supply chain new-product cooperation, and supply chain continuous improvement. Lim et al. (2022) [20] conceptualized SCQM as a strategic framework that encompasses six critical practices: supplier focus, leadership, operational improvement, strategic collaboration, information sharing, and customer focus. Similarly, Hong et al. (2018) [3] emphasized collaboration with suppliers and customers, process control, employee autonomy, and internal training programs. Although these studies extend the scope of SCQM beyond the firm level to include upstream and downstream partners, they often lack a unified framework that fully captures both internal and external quality integration.
In this study, we draw on dynamic capability theory, which emphasizes gaining competitive advantage through the configuration of internal and external resources, to address this gap. Based on this perspective, SCQM is defined as a higher-order construct that comprises three key dimensions: supplier quality management (SQM), internal quality management (IQM), and customer orientation (CO). Specifically, supplier quality management (SQM) is viewed as a set of strategic actions that transcend organizational boundaries to meet the needs of both current and potential customers [21]. Internal quality management (IQM) practices primarily involve activities within the organization, such as process control, process improvement, and experimental design [3]. As a core component of SCQM, IQM serves as a critical link connecting upstream suppliers and downstream customers in manufacturing enterprises. Its effectiveness directly influences the overall quality coordination capability of the supply chain. Therefore, it is essential to establish a systematic quality culture and management mechanisms within the organization. In this process, strong leadership, effective interdepartmental collaboration, and adequate information sharing can significantly enhance the efficiency of IQM practices. Customers, as the ultimate users of products and services, directly influence an organization’s profits, costs, and reputation through their feedback, such as complaints or satisfaction. Therefore, customer orientation (CO) is crucial to the long-term sustainability and growth of firms in the supply chain [22]. Focusing on these factors includes key players from upstream to downstream in the supply chain, aiming to enhance FP through overall optimization and synergies.
Prior research presents divergent views on the relationship between SCQM practices and performance, with some scholars contending that it is inconclusive in the existing literature [23]. In contrast, others have reported that SCQM practices exert a positive influence on various aspects of performance. For example, some scholars have studied the positive impact of SCQM on operational performance, competitive performance, and quality performance [4,20,24]. Even though numerous studies have highlighted the beneficial impact of SCQM on performance, most have concentrated on specific aspects, such as economic and market performance [24,25]. However, research that integrates these distinct performance dimensions into a broader FP framework remains scarce. We contend that financial performance (FinP), operational performance (OP), and market performance (MP) collectively offer a more comprehensive assessment of manufacturing enterprises’ overall outcomes. In this research study, by investigating these three dimensions, we examine how SCQM influences the FP of manufacturing firms. Drawing on prior research and the SCP framework, SCQM is conceptualized as a form of market conduct—reflecting firms’ responses to market structure—while FP represents the performance outcome. The following hypothesis is proposed based on the preceding analysis:
H1: 
SCQM in manufacturing enterprises exerts a positive influence on FP.

2.3. SCQM and Supply Chain Quality Integration (SCQI), Supply Chain Strategy (SCS), and Supply Chain Capability (SCC)

2.3.1. SCQM and Supply Chain Quality Integration (SCQI)

SCQI refers to the organized coordination and alignment of business processes across all partners within the supply network to enhance products, services, and processes; generate market value; and ensure customer satisfaction [26]. This requires collaborative efforts between all supply chain partners to jointly oversee quality [27]. Following the supply chain integration framework, Huo et al. (2014) [28] identified three essential aspects of SCQI necessary for achieving high-quality standards: supplier quality integration (SQI), internal quality integration (IQI), and customer quality integration (CQI). SQI and CQI focus on working together with suppliers and customers, respectively, to meet quality standards by integrating strategies, practices, and processes into collaborative workflows [17,29]. IQI involves consistent collaboration between various functional departments within an organization to achieve superior quality outcomes [27].
Effective SCQM calls for a broad range of quality integration among supply chain partners [17]. Quality management has shifted from a company-centric approach to a supply chain-focused one, making it essential to set up an integrated quality system among supply chain members [26]. Implementing SCQM practice is anticipated to boost collaboration and trust among supply chain members, thereby enhancing SCQI.

2.3.2. SCQM and Supply Chain Strategy (SCS)

SCS plays a vital role in SCQM. It focuses on managing product procurement, planning, raw material transformation, demand management, communication with supply chain stakeholders, and the delivery of products and services [30]. Under challenging market conditions, SCS is regarded as a vital characteristic that supply chains ought to exhibit [31,32]. When senior managers integrate information sharing into the company’s overall business strategy, they provide clear direction and support for supply chain management, ensuring successful strategy implementation [33]. The link between SCQM and SCS is crucial to this process. SCQM supports strategy implementation by ensuring consistent quality across all stages. By means of ongoing quality control, SCQM contributes to boosting the efficiency and collaborative capacities of the supply chain, thus enhancing the accuracy and timeliness of product delivery. This procedure is vital to attaining the objectives set forth in the SCS. Therefore, SCQM not only facilitates the effective implementation of SCS but also contributes to enhanced FP, cost reduction, and improved competitiveness.

2.3.3. SCQM and Supply Chain Capability (SCC)

Previous studies indicate that SCC is a crucial element for enterprises to attain a competitive edge [10]. In the face of rapid market changes, companies must continuously improve their SCC. They must develop new capabilities and adapt existing ones to meet customer demands better, thereby achieving sustainable growth. Strong SCC, from a quality management perspective, enables firms to ensure process consistency, improve defect prevention, and enhance responsiveness to quality-related challenges across the supply chain. By building robust supply chain capabilities, companies can better integrate quality standards, drive operational excellence, and strengthen their competitive advantage. Dynamic capability theory emphasizes the development of capabilities that allow firms to respond to environmental changes [5]. These capabilities include administrative capabilities, corporate capabilities, advanced expertise, key capabilities, and core capabilities such as automation, coordination, and information exchange [34]. In the contemporary global marketplace, for an organization to achieve a competitive edge, its capabilities need to consider four crucial competitive aspects: cost, quality, speed, and flexibility [35]. Therefore, in this study, we divide SCC into responsiveness, innovation, and sustainability capabilities, which represent critical outcomes of implementing SCQM. Supply chain responsiveness capability (RC) is the speed at which supply chain members respond to environmental changes [36]. According to dynamic capability theory, companies must continuously integrate and adjust internal and external resources in dynamic business environments to construct sustainable competitive advantages in response to persistent risks, challenges, and competitive pressures. Hence, RC is key to a company’s core competitive capability. Supply chain innovation capability (IC) is “the complex processes of handling uncertainty in the environment to provide solutions to customer needs and finding new ways to improve organizational processes using new technologies” [37]. The sustainable capability (SC) of a supply chain is a system that aims to minimize its adverse environmental and social effects [38]. It involves approaches for minimizing waste and emissions, adopting renewable energy, implementing sustainable procurement, and advocating equitable labor standards [39].
SCQM plays an important role in SCC, yet recent studies have given it limited attention [10]. Its influence on RC may lie in the improved reliability and reduced variability it brings to supply chain operations. Regarding IC, SCQM is often associated with mechanisms that facilitate ongoing refinement and knowledge sharing. As for SC, it has been linked to practices that align operational goals with environmental and long-term sustainability objectives.
In this study, we view SCQI, SCS, and SCC as key dynamic capabilities based on dynamic capability theory, which emphasizes that firms must develop and renew such capabilities to respond effectively to environmental changes. Accordingly, we explore how these capabilities are shaped by SCQM practices in manufacturing firms. Based on this rationale, the following hypotheses are proposed:
H2a: 
SCQM in manufacturing enterprises exerts a positive influence on SCQI.
H2b: 
SCQM in manufacturing enterprises exerts a positive influence on SCS.
H2c: 
SCQM in manufacturing enterprises exerts a positive influence on SCC.

2.4. The Mediating Function of SCQI, SCS, and SCC in the Link Between SCQM and FP

2.4.1. The Mediating Function of SCQI in the Link Between SCQM and FP

Extensive research has explored the significance of supply chain integration in shaping performance, covering financial outcomes, operational efficiency, and key dimensions such as product quality, dependability, and adaptability [26,40,41]. Given the firmly established link between supply chain integration and performance, SCQI is expected to exert a favorable influence on quality results. Huo et al. (2014) [28] investigated how the three dimensions of SCQI, i.e., SQI, IQI, and CQI, enhance quality performance through the optimization of processes, the alignment of internal functions with supply chain partners, and the synchronization of material and information flows. Strengthening SCQI helps firms improve quality control, elevate customer satisfaction, and sharpen market competitiveness.
In this study, we further posit that SCQI acts as a vital mediator between SCQM and FP by enhancing operational efficiency and quality. SCQI promotes the sharing of information, resource allocation, and the alignment of goals among supply chain members. This, in turn, reduces internal conflicts and inefficiencies, boosting operational effectiveness and adaptability within the supply chain. Moreover, effective integration stimulates supply chain innovation and improves customer satisfaction—both critical to achieving a competitive advantage. Additionally, SCQM promotes SCQI across several dimensions, including supplier coordination, internal process optimization, and customer alignment. By leveraging these mechanisms, firms can build a more resilient and high-performing supply chain, ultimately enhancing FP.

2.4.2. The Mediating Function of SCS in the Link Between SCQM and FP

Research indicates that SCS could impact performance [42,43]. A well-formulated supply chain strategy improves overall performance by streamlining resource allocation, boosting operational efficiency, and enhancing coordination across the supply chain [33,44]. Specifically, the implementation of an effective supply chain strategy lowers costs while boosting customer satisfaction and market responsiveness, thereby contributing to enhanced FP. By optimizing the management of supply chain processes, firms are better positioned to address market demands, strengthen their competitive edge, and promote sustainable growth.
In this study, we posit that SCS could serve as a critical mediator linking SCQM to FP by streamlining supply chain operations. SCS improves overall supply chain efficiency through better resource allocation, process modifications, and strengthened collaboration, resulting in a positive impact on FP. More specifically, SCS promotes tight coordination across various supply chain activities, such as supplier management, production efficiency, and responsiveness to customer demands. These strategic efforts reinforce SCQI, enhancing key performance indicators, such as product quality and customer satisfaction.

2.4.3. The Mediating Function of SCC in the Link Between SCQM and FP

Hong et al. (2019) [10] indicate that SCC boosts organizational performance. The cooperation between competitive SCQM practices and SCC fortifies FP [45]. Singh et al. (2025) explored how supply chain capabilities, when combined with total quality management (TQM) practices, contribute to enhancing sustainable supply chain performance [46]. Thus, SCC may be tightly connected to both SCQM and FP. Effective SCQM enhances firms’ capabilities in risk management, innovation, and sustainability, leading to a more resilient and competitive supply chain.
Building on the SCP framework and dynamic capability theory, we position SCQI, SCS, and SCC as forms of market conduct that reflect the supply chain practices of firms in response to the market structure. These practices are not only crucial elements of market behavior under the SCP perspective but also represent key dynamic capabilities that enable firms to adapt, innovate, and respond to environmental changes. Understanding their influence on FP is essential to clarifying how SCQM contributes to enhanced FP. As a result, the following hypotheses are proposed:
H3a: 
SCQI in manufacturing enterprises exerts a positive influence on FP.
H3b: 
SCS in manufacturing enterprises exerts a positive influence on FP.
H3c: 
SCC in manufacturing enterprises exerts a positive influence on FP.
H4a: 
SCQI acts as a mediating variable in the connection between SCQM and FP.
H4b: 
SCS acts as a mediating variable in the connection between SCQM and FP.
H4c: 
SCC acts as a mediating variable in the connection between SCQM and FP.

2.5. The Moderating Role of Digital Intelligence (DI) in the Relationships Among SCQM, SCQI, SCS, and SCC

According to dynamic capability theory, enterprises in the digital economy can enhance their adaptability to complex environments by integrating and optimizing internal and external resources, refining management models, and innovating technological approaches [47]. DI is needed over traditional intelligence because it allows for faster, more accurate, and proactive decision making in rapidly changing supply chain environments. In the wake of the rapid progress of digital technologies, DI has found widespread application across various industries. Notably, in supply chain management, it has become a crucial instrument for boosting efficiency and enhancing competitiveness. In manufacturing, DI practices improve chain management and enhance FP. For instance, JD Cloud has achieved 85% procurement automation with supply chain digitalization, significantly reducing inventory turnover cycles. This model has been extended to other enterprises, boosting their productivity and competitiveness [13]. Theoretically, supply chain DI can eliminate “information silos,” ensuring the seamless flow of logistics, capital, production, and information [48]. Consequently, DI enhances FP and productivity by increasing supply chain transparency and coordination efficiency.
Recent studies highlight the potential relevance of DI to SCQM and FP. Recent studies highlight the potential relevance of DI to SCQM and FP. Alnuaimi et al. (2022) [49] recognized digital strategy as a moderating factor in SCQM practices. Han et al. (2024) [50] explored big data analytics as exerting a moderating influence on the relationship between lean management and sustainable supply chain performance. Additionally, Zhaozhi Wang et al. (2023) [51] examined the link between digital capabilities and corporate performance, finding that fundamental digital capabilities, digital operational capabilities, and digital integration capabilities positively impact FP. These studies highlight the growing academic focus on supply chain DI and its moderating role in SCQM. DI enables firms to manage large data flows involving suppliers, buyers, and manufacturers, enhancing quality management systems [52]. Therefore, DI optimizes supply chain configurations, improving both economic and environmental performance, which in turn improves FP.
DI, including big data and AI, may influence how SCQM affects key supply chain capabilities. By improving data sharing and visibility, DI could enhance coordination and support quality integration (SCQI). It may also help firms adjust strategies and respond to quality issues more effectively. Additionally, DI might foster responsiveness, innovation, and sustainability, contributing to capability development. These possibilities suggest that DI may have a moderating effect on the relationship between SCQM and FP, SCQI, SCS, and SCC.
In this study, grounded in both the prior literature and dynamic capability theory, we view digital intelligence (DI) as a key dynamic capability that enhances the effectiveness of SCQM. From this theoretical perspective, DI enables firms to sense changes, integrate digital technologies, and reconfigure internal and external resources in response to environmental uncertainty. Understanding the moderating role of DI is, therefore, essential to exploring how SCQM contributes to improved firm performance and capability development. These considerations lead to the following hypotheses:
H5a: 
DI in manufacturing enterprises positively moderates the impact of SCQM on FP.
H5b: 
DI in manufacturing enterprises positively moderates the impact of SCQM on SCQI.
H5c: 
DI in manufacturing enterprises positively moderates the impact of SCQM on SCS.
H5d: 
DI in manufacturing enterprises positively moderates the impact of SCQM on SCC.

3. Data Analysis

3.1. Measurement

In this research study, we examine six key constructs: SCQM, SCQI, SCS, SCC, FP, and DI. Building on previous studies, SCQM is assessed in three dimensions, i.e., supplier quality management, internal quality management, and customer orientation, with a total of 21 items used to measure these aspects. Similarly, SCC is divided into three dimensions, i.e., responsiveness, innovation capability, and sustainability capability, and is evaluated using 12 items. FP is categorized into operational, financial, and market performance, with 11 items used for measurement.

3.2. Data Collection and Sample Description

The primary focus of this study included manufacturing firms in China and their associated supply chains, and the classification of the Chinese manufacturing industry was based on the China Statistical Yearbook. We selected core firms and their supply chain members from sectors such as machinery and equipment, chemicals and pharmaceuticals, high-tech electronics, and building materials and metal processing for questionnaire distribution to account for firm characteristics and geographical distribution. The questionnaires were distributed online to selected managers at various organizational levels within the targeted firms. The questionnaire of this study was divided into two sections: the first collected background information about the firms, while the second outlined the variables, their measurement indicators, and relevant questions. All items were measured using a 5-point Likert scale, ranging from “strongly disagree” (1) to “strongly agree” (5), with the other response options being “disagree”, “neutral”, and “agree”. The measurement scales were adapted from the established literature with minor adjustments for contextual relevance.
The survey was carried out in two stages. In the first stage, a pilot study was conducted, resulting in 96 valid responses. The reliability analysis conducted during the pilot study is presented in Table A1. Based on the results of the preliminary data examination, six items were removed due to their low corrected item–total correlations or their adverse effects on the overall reliability. After eliminating these items, the Cronbach’s α coefficients for all constructs exceeded the threshold of 0.7, indicating satisfactory internal consistency. In addition, the Kaiser–Meyer–Olkin (KMO) measure reached 0.697, which is close to the commonly accepted threshold of 0.7, suggesting the suitability of the dataset for factor analysis. These findings confirm that the questionnaire exhibits acceptable reliability and validity, supporting the methodological rigor of scale development and laying a solid foundation for the subsequent formal survey. The revised questionnaire is provided in Table A2. In the second stage, a formal survey was conducted, which generated 336 valid responses. To ensure diversity and representativeness, the sample of 336 manufacturing firms was selected based on industry classification standards from the China Statistical Yearbook and covered seven key sectors, including machinery, electronics, chemicals, and building materials. The sample structure broadly reflects the national industrial distribution, with traditional industries dominating, consistent with official data from the Fifth National Economic Census. While high-tech electronics firms are not as numerous as those in traditional sectors, their presence is consistent with the overall industrial composition of China’s manufacturing sector. Table 1 outlines the details of the formal survey results. The firms participating in the survey primarily represented industries such as machinery and equipment, building materials and metal processing, food, and high-tech electronics. Over half of the respondents had more than 10 years of experience in the manufacturing sector, and the majority held at least a bachelor’s degree.

3.3. Data Analysis and Results

3.3.1. Reliability and Validity Testing

We assessed internal consistency reliability using Cronbach’s α coefficient, with the SPSS27. analysis results being provided in Table 2. The α values for all scales exceeded 0.8, surpassing the threshold of 0.7, which demonstrates the scales’ strong reliability. The validity evaluation encompasses content validity, convergent validity, and discriminant validity. The scales are either sourced from or adapted from relevant studies by both domestic and international scholars, ensuring good content validity. A confirmatory factor analysis performed using AMOS with a first-order structural model revealed that the fit indices were acceptable (χ2/df = 1.193; CFI = 0.971; IFI = 0.972; NFI = 0.848; RMSEA = 0.024).
For hypothesis testing, second-order structural models were applied to SCQM, SCC, and FP. Consequently, reliability and validity analyses were conducted for the second-order models of these variables. The fit indices for SCQM were favorable (χ2/df = 1.372; CFI = 0.982; IFI = 0.982; NFI = 0.938; RMSEA = 0.033). Similarly, the fit indices for SCC (χ2/df = 2.378; CFI = 0.963; IFI = 0.963; NFI = 0.938; RMSEA = 0.064) and FP (χ2/df = 2.372; CFI = 0.97; IFI = 0.97; NFI = 0.949; RMSEA = 0.064) were also satisfactory. The factor loadings from AMOS calculations were all greater than 0.6, with composite reliability (CR) exceeding 0.8 and average variance extracted (AVE) above 0.5. Furthermore, the factor loadings for all second-order constructs were above 0.50 and significant at the p < 0.01 level, validating convergent validity.
As shown in Table 3, the square root of the AVE for each construct exceeded the highest correlation with any other construct in the model, confirming the validity of discriminant validity.

3.3.2. Common Method Bias Test

We applied Harman’s single-factor test on the 58 measurement items to assess common method bias. The exploratory factor analysis showed a KMO value of 0.877, with 12 factors having eigenvalues greater than 1, explaining 67.93% of the variance. The first factor accounted for only 20.97%, suggesting minimal common method bias.

3.3.3. Correlation Analysis

Pearson correlation analysis revealed that SCQM was significantly positively correlated with FP (r = 0.329, p < 0.01), SCQI (r = 0.226, p < 0.01), SCS (r = 0.281, p < 0.01), and SCC (r = 0.386, p < 0.01). SCQI (r = 0.340, p < 0.01) and SCS (r = 0.366, p < 0.01) also showed significant positive correlations with FP. However, the correlation between SCC and FP was weaker (r = 0.164, p < 0.01). These results provide initial support for the proposed hypotheses.

3.4. ANOVA Based on Demographic Characteristics

We evaluated the potential influence of respondent demographics on the results by performing ANOVAs with SPSS on six key demographic variables identified in the descriptive statistics: gender, manufacturing industry, number of employees, job position, years of experience, and education level. Detailed ANOVA results are presented in Table A3, Table A4, and Table A5.
The ANOVA revealed that among the six biographical variables, three—the number of employees, employee position, and work experience—significantly influenced at least one FP dimension (FinP, OP, and MP). Specifically, firms with more than 1000 employees showed higher FinP (M = 3.163) than those with fewer than 50 employees (M = 2.740; F = 2.944, p = 0.033) and also outperformed smaller firms in OP (F = 5.065, p = 0.002). Regarding job position, Senior Management reported stronger FinP (M = 3.228) and MP (M = 3.163) than Junior Management, while the latter exhibited the highest OP (M = 3.126; p < 0.05). Moreover, respondents with over 20 years of work experience had significantly better outcomes across all performance dimensions than those with less than 5 years—for example, the FinP of respondents with over 20 years of experience (M = 3.810) was significantly higher than that of those with less than 5 years (M = 2.746; F = 6.953, p < 0.001).
Based on the above ANOVA of demographic variables, it can be concluded that gender, enterprise type, and education level showed no significant impact on FinP. In contrast, the number of employees, job position, and years of experience significantly influenced at least one of the three performance dimensions. Larger companies, senior positions, and more experienced employees tended to associate their firms with higher OP and FinP levels.

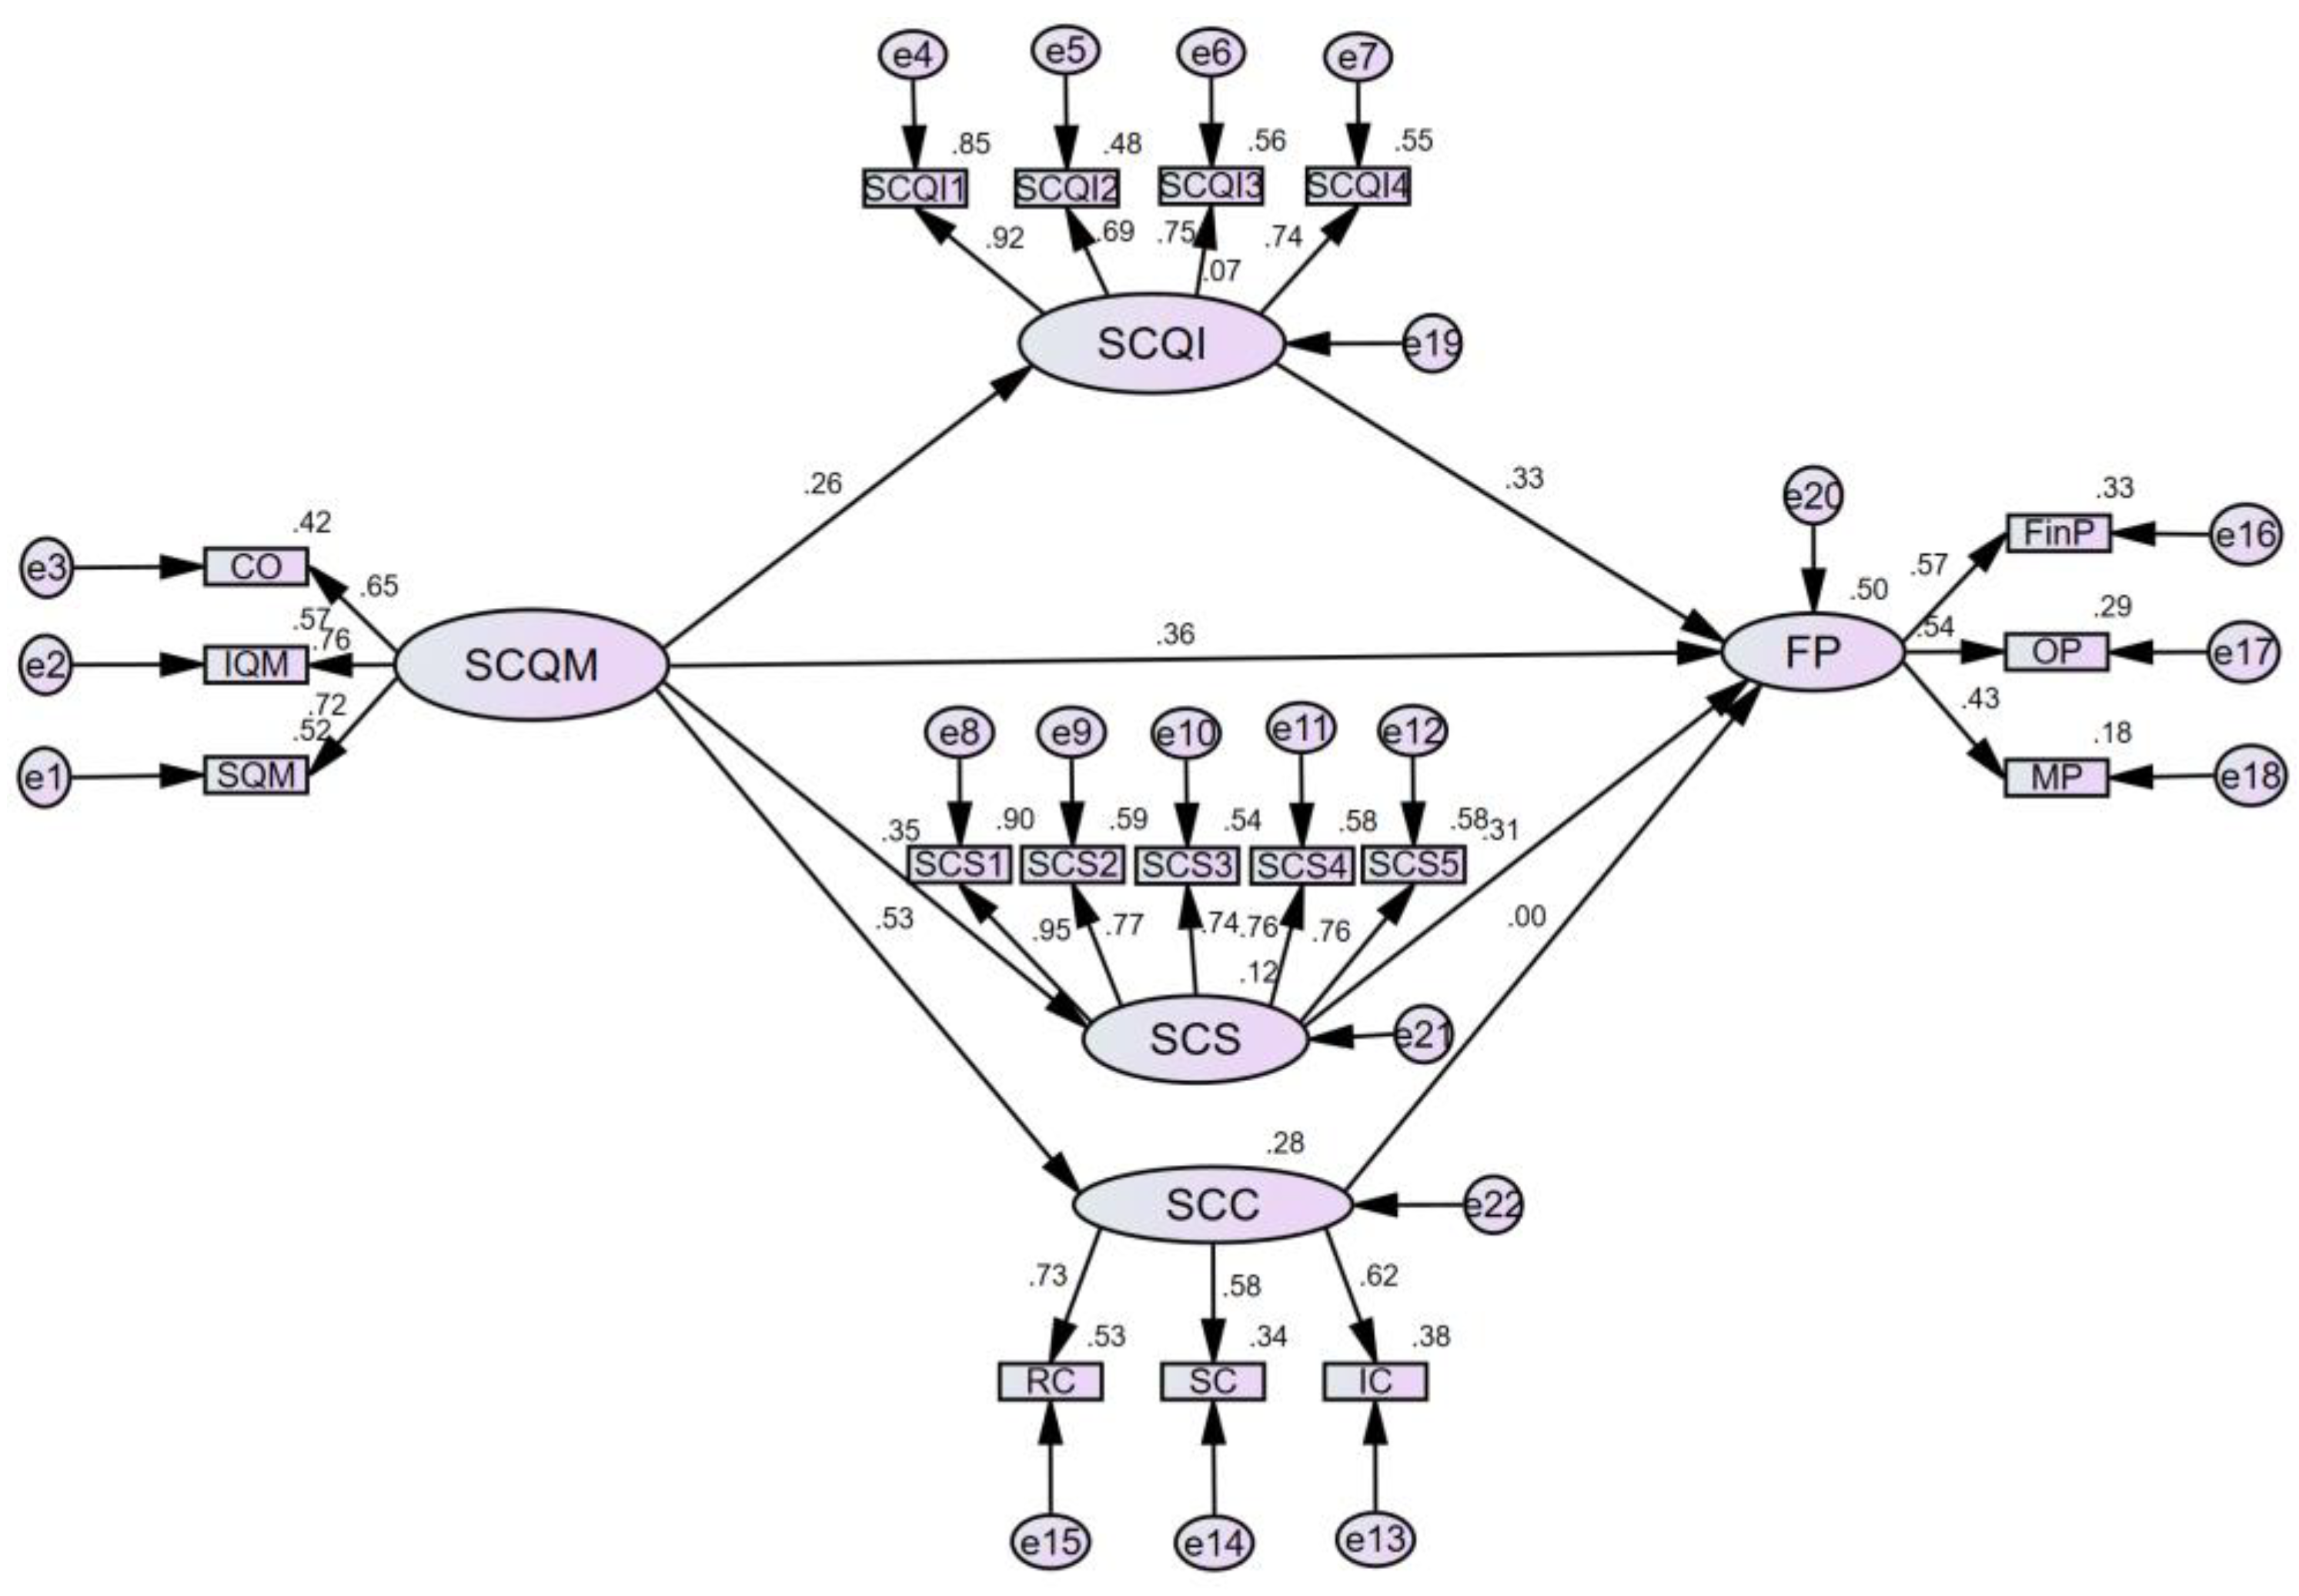
4. Hypothesis Testing and Results

Structural equation modeling (SEM) was performed using Amos 27 to test the hypotheses. The model achieved acceptable fit indices (χ2/df = 1.387; CFI = 0.978; IFI = 0.979; NFI = 0.928; RMSEA = 0.034), and its outcomes are shown in Figure 2.

4.1. Main Effect Testing

As seen in Table 4, SCQM significantly influenced FP (β = 0.357, p < 0.001), supporting H1. SCQM also positively impacted SCQI (β = 0.264, p < 0.001), SCS (β = 0.348, p < 0.001), and SCC (β = 0.530, p < 0.001), validating H2a, H2b, and H2c. Furthermore, SCQI (β = 0.328, p < 0.001) and SCS (β = 0.315, p < 0.001) had significant positive effects on FP, confirming H3a and H3b. However, the effect of SCC on FP was not significant (β = 0.004, p = 0.969), indicating no support for H3c.

4.2. Mediation Effect Testing

The bias-corrected bootstrap method was employed to test the mediation effects, using 5000 resamples and a 95% bias-corrected confidence interval (CI). A mediation effect is considered significant if the CI excludes zero. The results showed that the indirect effect of SCQM on FP through SCQI was 0.087, with a CI excluding zero, confirming a significant mediation and supporting H4a. Similarly, the indirect effect through SCS was 0.110, with a 95% CI ranging from 0.058 to 0.182, excluding zero, thus supporting H4b. However, the indirect effect through SCC was 0.002, with a non-significant p-value, and its CI ranged from −0.117 to 0.158, including zero. This indicated that SCC did not significantly mediate the relationship, leading to the rejection of H4c.
Without mediators, SCQM had a significant positive effect on FP. However, after including mediators, the direct effect of SCQM on FP decreased but remained significant. This suggests that SCQI and SCS partially mediated the relationship between SCQM and FP, with a total indirect effect of 0.197 (0.087 + 0.110). Furthermore, the mediation effect of SCS was stronger than that of SCQI. The overall effect of SCQM on FP was 0.554 (0.357 + 0.197).

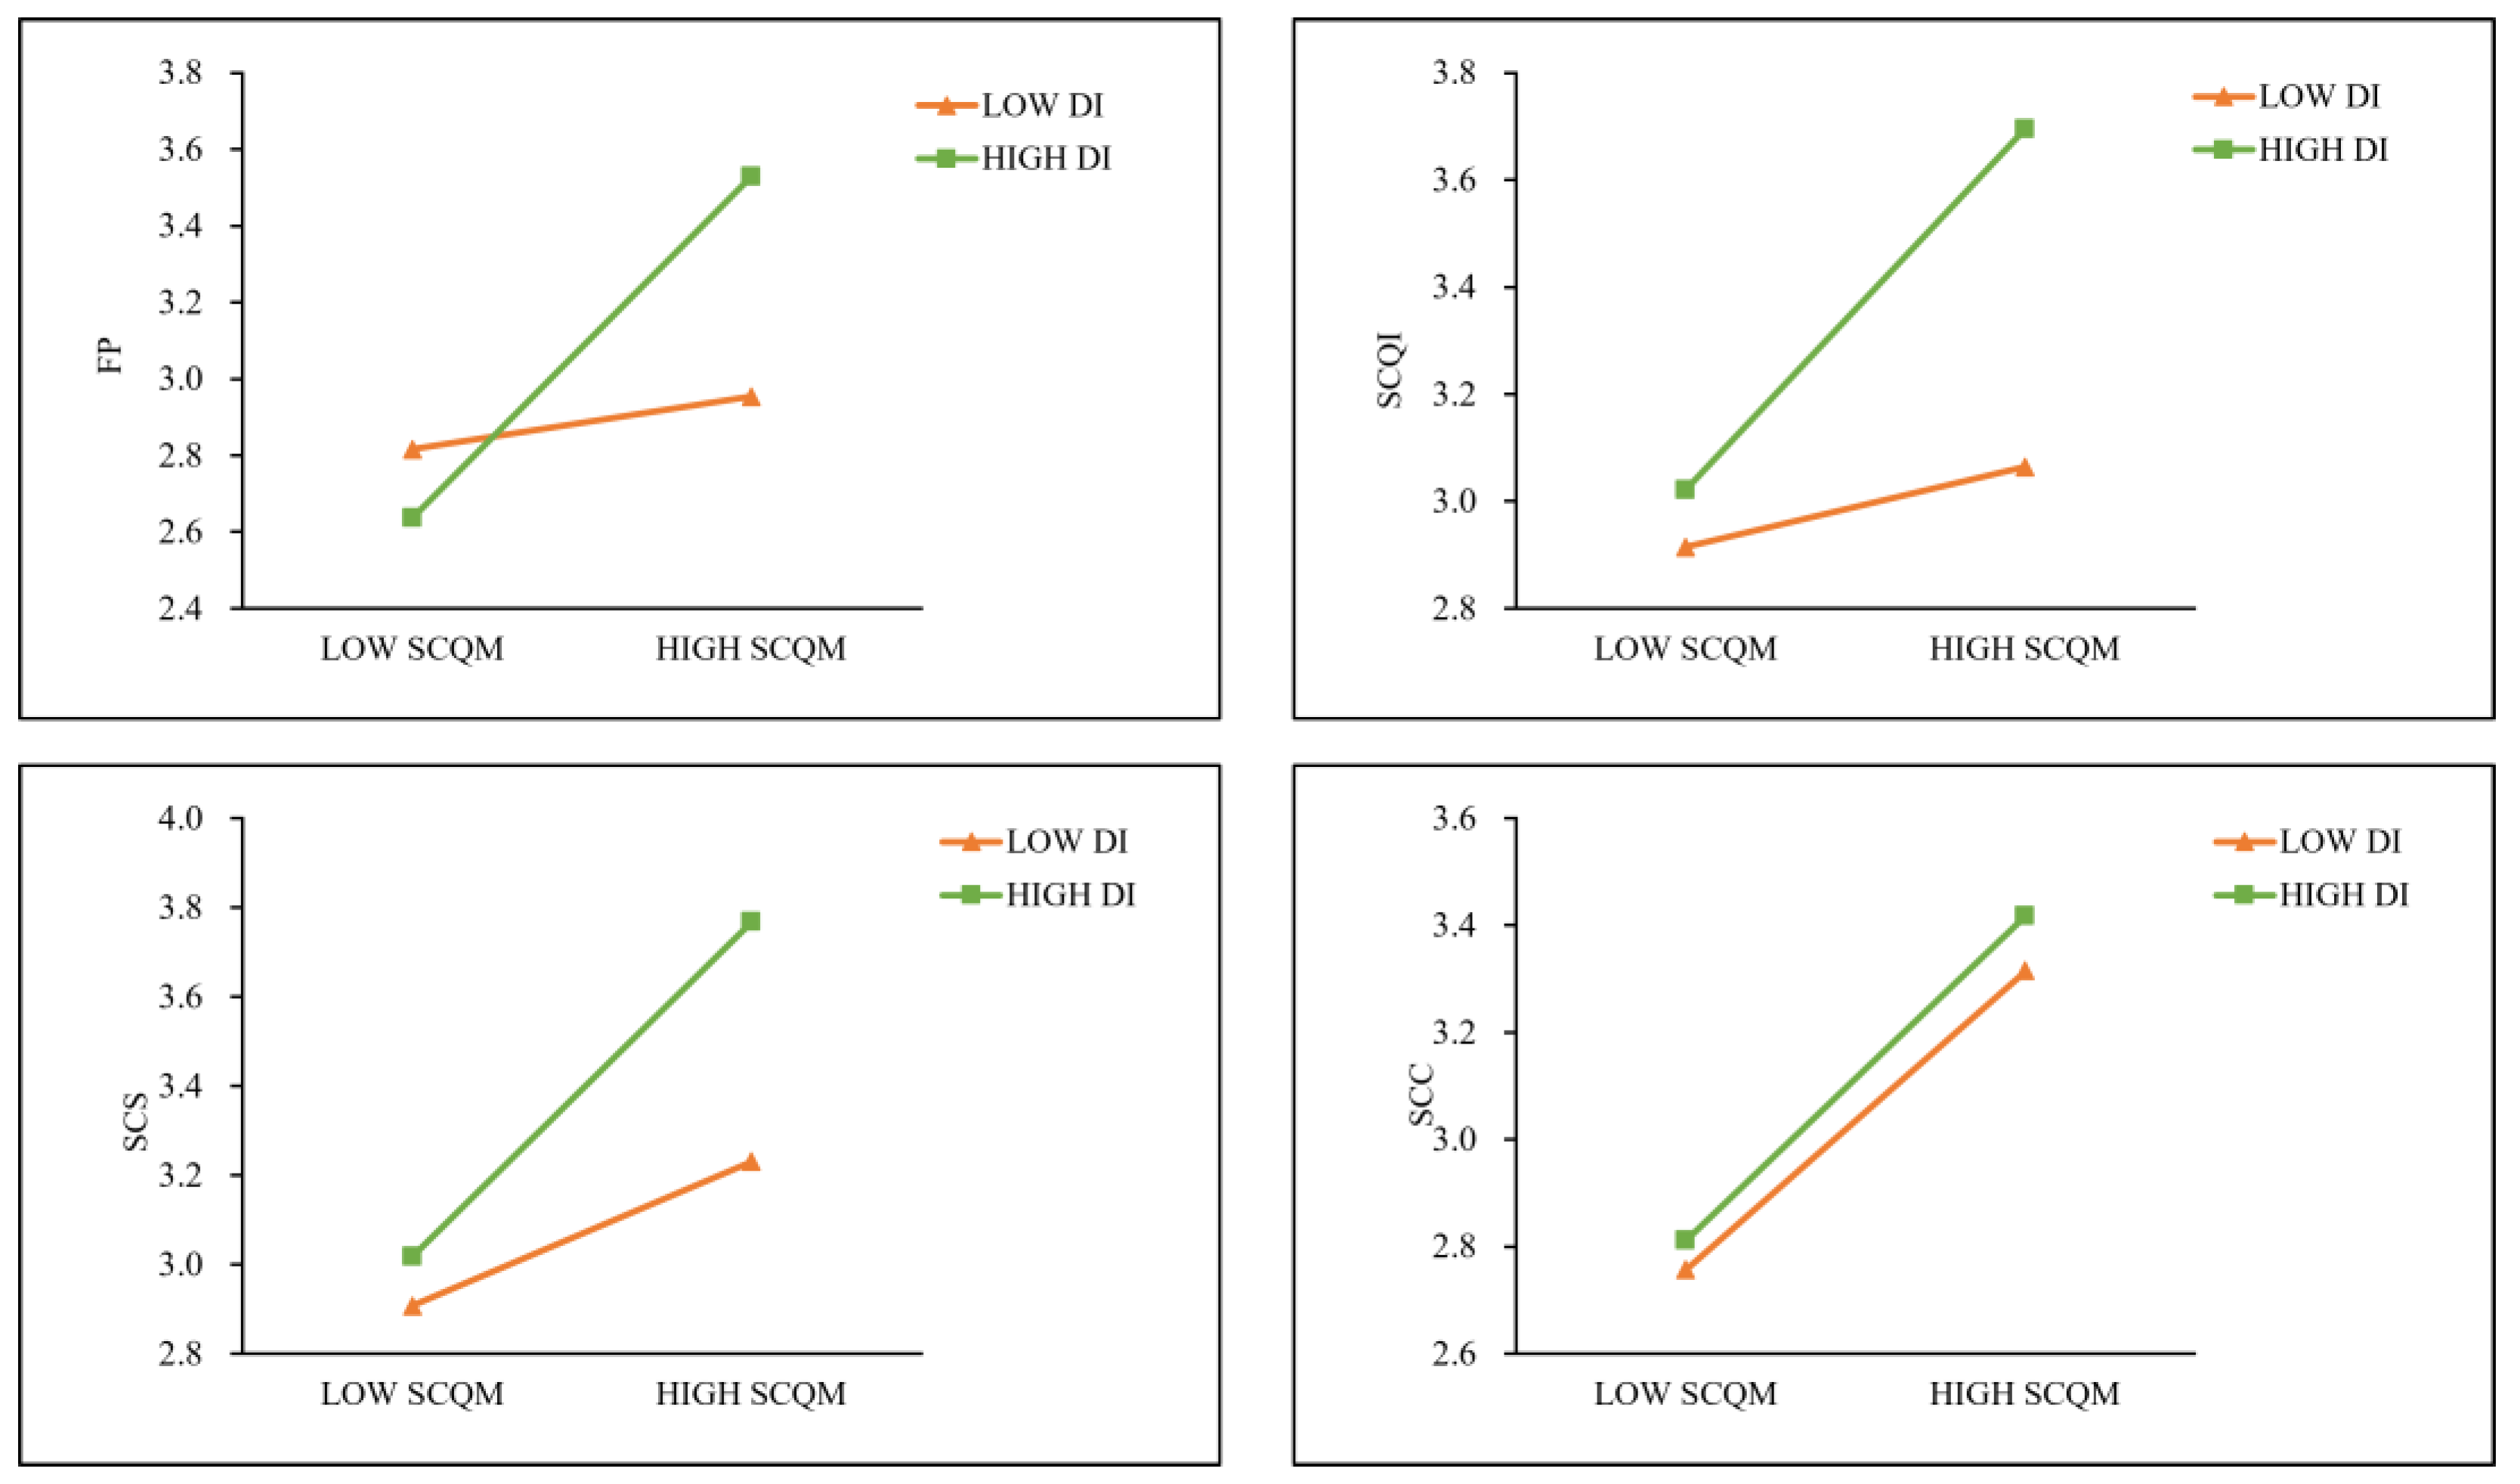
4.3. Moderation Effect Testing

In this study, we investigated the moderating effect using the PROCESS macro in SPSS. The results indicate that DI significantly moderated the relationships between SCQM and FP, SCQM and SCQI, and SCQM and SCS in manufacturing firms. As shown in Table 4, the moderating effect analysis revealed a significant positive regression coefficient (β = 0.370) for the interaction term of DI in the relationship between SCQM and FP, with a 95% confidence interval of [0.259, 0.480]. Since the entire confidence interval was above zero, this supports H5a, suggesting that DI amplifies the positive impact of SCQM on FP. Similarly, DI significantly moderated the relationship between SCQM and SCQI (β = 0.227, 95% CI = [0.070, 0.383]), with the confidence interval above zero, supporting H5b. DI also notably moderated the effect of SCQM on SCS (β = 0.185, 95% CI = [0.022, 0.346]), confirming H5c. However, the moderating effect of DI on the relationship between SCQM and SCC was not significant (β = 0.021, 95% CI = [−0.013, 0.003]), as the confidence interval included zero, leading to the rejection of H5d. These results imply that DI strengthens the effect of SCQM on FP, SCQI, and SCS.
Adhering to the approach put forward by Aiken and West (1991) [53], Figure 3 illustrates the outcomes of the simple slope analysis. We assessed the moderating effect by setting the moderator variable to one standard deviation above and below its mean, representing high and low levels of DI, respectively. As DI increased, the positive impact of SCQM on FP became more pronounced, with SCQI and SCS further enhancing this effect. In conclusion, the regression analysis supports the simple slope analysis results, confirming DI’s moderating role.

5. Discussion

We investigate the indirect effects of SCQI, SCS, and SCC on the SCQM–FP relationship, as well as the moderating role of DI, based on 336 valid survey responses from Chinese manufacturing firms. Notably, for the sample size and diversity, we selected firms across major manufacturing sectors to ensure broad representation. We mainly drew the sample from traditional industries, such as machinery, building materials, and metals, reflecting the dominant structure of China’s manufacturing sector. Although high-tech electronics firms are not as numerous, their proportion slightly exceeds the national average by employment, supporting the sample’s overall representativeness. We address the two main research questions introduced earlier. First, in response to Q1, “How does SCQM in manufacturing enterprises impact FP through SCQI, SCS, and SCC?”, this study offers insights from three key perspectives.
The first answer regards the relationship between SCQM and FP, with the findings confirming that SCQM positively affects FP (β = 0.357, p < 0.001). This result is consistent with previous studies that have explored the relationship between SCQM and specific performance outcomes [4,20,24]. Notably, this study advances the existing literature by integrating these specific performance indicators into a more comprehensive measure of firm performance, encompassing financial, operational, and market performance. Additionally, this study reconciles the divergent findings in previous research concerning the SCQM–FP relationship, thereby providing a deeper understanding of the mechanisms through which SCQM affects FP. Furthermore, this research study provides empirical evidence of the significant positive impact of SCQM on SCQI (β = 0.264, p < 0.001), SCS (β = 0.348, p < 0.001), and SCC (β = 0.530, p < 0.001). These findings align with earlier studies that link supply chain management with SCQI, SCS, and SCC [10,27,33]. However, the novelty of the present work lies in examining these relationships, specifically from the perspective of SCQM, rather than general supply chain management, thereby expanding the scope of existing studies. This indicates that SCQM significantly enhances SCQI, which is critical for achieving seamless quality integration across the supply chain and improving overall coordination efficiency. Secondly, SCQM promotes the development of a more systematic and flexible SCS, which helps firms embed quality considerations into strategic decisions and better adapt to environmental changes. Meanwhile, SCQM strengthens SCC, which is essential for continuous quality improvement and for enhancing firms’ ability to respond to external uncertainties and market fluctuations.
Additionally, both SCQI (β = 0.328, p < 0.001) and SCS (β = 0.315, p < 0. 001) have significant positive impacts on FP, consistent with previous research findings [28,42]. Building on previous research that focused on specific performance outcomes, this study further demonstrates the positive impact of SCQI and SCS on overall firm performance, highlighting their critical roles in enhancing comprehensive performance. Specifically, SCQI enhances FP by strengthening resource coordination and operational efficiency across supply chain stages; optimizing the flow of information, logistics, and finance; and ensuring the seamless operation of the supply chain. Meanwhile, the formulation of SCS helps firms define the strategic direction of their supply chains, align management practices with broader corporate goals, and ultimately drive long-term growth.
Thirdly, SCQI (β = 0.087, p < 0.001) and SCS (β = 0.11, p < 0.001) serve as key mediators in the relationship between SCQM and FP. This study provides empirical evidence underscoring the central mediating roles of SCQI and SCS in the relationship between SCQM and FP. This is a key finding of the present study, which, for the first time, highlights the critical roles of SCQI and SCS in the context of SCQM. Rather than functioning as peripheral variables, SCQI and SCS serve as critical conduits through which the effects of SCQM are translated into performance outcomes. Theoretically, both SCQI and SCS are not only natural extensions of effective SCQM practices but also essential prerequisites for achieving enhanced firm performance. Thus, they play dual roles within the SCQM framework—as both outcomes and enabling drivers. We address a notable gap in prior research regarding the mechanisms through which SCQM influences performance by uncovering this mediating pathway, highlighting the pivotal importance of SCQI and SCS as strategic enablers in bridging quality management initiatives and performance gains. These findings are consistent with the Structure–Conduct–Performance (SCP) model, illustrating how firms within a specific market structure can optimize SCQM, implement effective supply chain integration and strategies, and ultimately enhance FP. Manufacturing firms improve resource allocation through SCQI, ensuring efficient coordination and enabling the smooth flow of information, logistics, and finances. For instance, fostering close collaborations with suppliers and customers, jointly developing quality standards, and executing improvement initiatives all contribute to boosting overall FP. SCS assists firms in developing long-term plans, ensuring optimal resource distribution, and continuously improving supply chain quality. This enables firms to maintain strategic alignment under dynamic market conditions, which, in turn, fosters growth in FP.
However, the mediating effect of SCC is not significantly supported, which contradicts previous findings. Several possible reasons may explain this result. (1) The surveyed firms are mainly from the machinery and equipment, building materials and metals, and high-tech and electronics industries, each with unique industry characteristics. (2) Traditional industries face limitations in technology, funding, and implementation, making it difficult to convert innovation and sustainability capabilities into performance gains in the short term. (3) Some industries operate highly complex supply chains, where improving a single capability may not lead to substantial performance enhancements. Therefore, in the future, researchers should conduct both industry-specific and comparative analyses across different sectors in order to derive more comprehensive and nuanced conclusions.
In addition, in response to Q2, “How does DI in manufacturing enterprises influence SCQM?”, this study reveals that DI plays a significant moderating role in the relationships between SCQM and FP (β = 0.370, p < 0.001), SCQM and SCQI (β = 0.227, p < 0.01), and SCQM and SCS (β = 0.185, p < 0.05). This represents another key contribution of this research work, revealing, for the first time, the critical moderating effect of DI in the field of quality management within supply chains. The present study also clarifies how DI influences the strength and direction of SCQM’s impact on SCQI, SCS, and ultimately FP. Traditional quality management approaches often suffer from inefficient information flow, limited end-to-end visibility, slow responsiveness to changes, and the absence of real-time feedback mechanisms across the supply chain. Unlike traditional methods based on manual work and static data, DI enables real-time, adaptive coordination. The importance of DI in the context of SCQM lies in its ability to enhance information visibility, decision-making efficiency, and process responsiveness across the supply chain. DI strengthens the effectiveness of quality management practices and improves coordination among supply chain partners by enabling real-time data integration and intelligent analysis. As a result, it plays a pivotal role in transforming SCQM efforts into measurable performance outcomes, thereby driving sustainable improvements in FP. Specifically, DI improves SCQI efficiency by leveraging big data analytics, the Internet of Things (IoT), and artificial intelligence to facilitate data sharing and intelligent coordination across supply chain stages. This reduces information asymmetry and enhances resource integration. At the same time, DI enhances the precision and flexibility of SCS through innovative decision-making systems, blockchain, and cloud computing, allowing firms to develop and adjust strategies more effectively. This, in turn, boosts supply chain resilience and adaptability. Moreover, DI enhances operational efficiency by reducing supply chain costs through automated production, smart logistics, and data-driven decision making, which ultimately strengthens the positive impact of SCQM on FP.
However, DI does not significantly influence the relationship between SCQM and SCC. This could be attributed to the long-term nature of SCC development. While DI optimizes information flow, enhancing responsiveness, innovation, and sustainability in the short term remains challenging. Additionally, industries such as machinery and equipment and building materials and metals prioritize efficiency and cost control, where DI applications focus more on automation than on strengthening SCC. In contrast, DI’s impact is more noticeable in the electronics industry, while other sectors are still in the exploration phase, resulting in limited performance improvements. Therefore, future research could focus on analyzing the varying impacts of DI on SCQM across different industries.

6. Conclusions

6.1. Research Conclusions

Prior research has explored the influence of SCQM on performance; however, empirical evidence regarding its impact on FP in developing nations remains limited. Additionally, the role of SCQM in SCQI, SCS, and SCC—specifically its mediating effect in the SCQM–FP relationship—has not been thoroughly investigated. We developed and empirically tested a comprehensive structural model to address this gap, revealing both direct and indirect connections between SCQM and FP, thereby contributing to the existing literature. We present three key findings. First, SCQM positively affects FP, SCQI, SCS, and SCC in China’s manufacturing industry. Second, SCQI and SCS positively influence FP and act as partial mediators in the SCQM–FP relationship; this finding suggests that SCQI and SCS are not only outcomes of SCQM but also critical drivers of FP. Third, DI plays a significant moderating role in the relationship between SCQM and FP. Furthermore, enhancing DI strengthens the effect of SCQM on SCQI and SCS.

6.2. Theoretical Contributions and Managerial Implications

This research study makes four important theoretical contributions. First, we propose a theoretical framework based on the Structure–Conduct–Performance (SCP) model to explore the relationship between SCQM and firm performance. At the same time, we emphasize the characteristic of SCQM in integrating internal and external resources by organically integrating dynamic capability theory with SCQM. Building on these perspectives, this study offers a novel theoretical lens for understanding SCQM in manufacturing firms and extends the existing literature on the SCP model and dynamic capability theory. Second, we synthesize previous research on the impact of SCQM across various performance dimensions, extending it to the overall level of FP. By categorizing FP into operational, financial, and market performance, we construct a more comprehensive theoretical framework, deepening the understanding of the SCQM–FP relationship. Third, empirical analysis reveals that SCQI and SCS serve as mediators in the relationship between SCQM and FP. This finding strengthens the theoretical framework of SCQM by identifying additional influencing variables and highlighting the multi-level mechanisms through which SCQM enhances FP. Fourth, this research study shows that DI significantly moderates the effects of SCQM practices. This provides new theoretical perspectives for future studies on the role of DI technologies in supply chain and quality management.
This study offers several managerial implications. First, SCQM improves SCQI, SCS, and FP, motivating partners to strengthen these capabilities. These findings provide guidance for managers to prioritize implementation efforts and extend quality management practices across the supply chain to improve FP. Manufacturing firms should implement concrete measures to ensure quality compliance throughout the supply chain. This includes developing a standardized SCQM system that spans procurement, production, logistics, and sales. To achieve this, firms can adopt quality management frameworks, such as ISO 9001 [54] and integrate them with digital tools (e.g., ERP and MES systems) to enable end-to-end process control. Procurement protocols should include supplier quality audits and certification requirements; production processes should implement real-time quality monitoring and root cause analysis; logistics must ensure traceability and damage control; and sales systems should collect and feed customer feedback into quality improvement cycles. Cross-functional teams should be established to maintain alignment and continuous improvement, supported by training programs that promote quality awareness across departments. These measures ensure consistency, traceability, and rapid response to quality issues, thereby strengthening the overall SCQM framework.
Moreover, as SCQI and SCS are key mediators in the SCQM–FP relationship, manufacturing firms should reinforce their practical applications. Firms should foster supply chain collaboration and quality integration by creating digital collaboration platforms to eliminate information silos between upstream and downstream partners, facilitating real-time quality data sharing. For example, deploying a supply chain visibility system can improve transparency and control over product quality at all stages. Building on the need to enhance coordination and quality consistency, firms are advised to develop strategic supply chain partnerships by engaging key suppliers in collaborative quality improvement initiatives. This may involve the joint formulation of quality standards, shared implementation plans, and participation in periodic performance evaluations. In contexts where supply chains span geographically dispersed regions, it is beneficial to set up quality inspection centers near primary production sites and key distribution markets. These centers, operated either by internal quality personnel or accredited third-party inspectors, can help identify non-conformities prior to shipment, thus shortening response time and reducing the likelihood of product returns. By addressing potential quality issues earlier in the logistics process, firms can reduce delivery uncertainties and avoid costly disruptions, such as emergency rerouting or expedited freight, ultimately lowering logistics expenditures and improving service reliability.
In addition to the above two points, DI plays a crucial role in quality management by optimizing quality control, enabling SCQI, and improving decision-making support, thereby significantly strengthening overall SC capabilities. DI transforms SCQM from passive control to proactive optimization, enabling firms to dynamically adjust quality standards and inspection processes while mitigating quality risks. Manufacturing firms should leverage DI for real-time data sharing while using intelligent analytics to optimize supplier selection to build a networked supply chain. At present, many Chinese manufacturing firms are still in the early stages of digital transformation, where the foundation for DI remains weak and applications are fragmented. To address this, firms should adopt a phased DI strategy. In the first stage, the focus should be on basic automation and digital data collection by embedding DI tools such as RFID, IoT sensors, and PLCs to capture quality data in real time. In the second stage, DI-enabled collaboration platforms (e.g., MES, QMS) should be built to integrate quality data across procurement, production, and logistics, enabling upstream and downstream partners to jointly monitor and manage quality issues. In the third stage, DI analytics—such as predictive algorithms and real-time anomaly detection—should be applied to support proactive quality control. In the final stage, firms should develop intelligent decision-making systems based on adaptive DI models, forming closed-loop quality management with automatic feedback and optimization. This progressive DI approach aligns with the current digital readiness of Chinese manufacturers and enhances both precision and responsiveness in quality management.

6.3. Research Limitations and Prospects

Although this study offers both theoretical and practical contributions, it also has several limitations. First, the scope of the industries surveyed is limited, as we primarily focus on the machinery and equipment, building materials and metals, and high-tech and electronics sectors. Different industries have distinct demands for supply chain capabilities, which may restrict the generalizability of the findings. Second, the target respondents are managers who have direct interactions with both upstream and downstream members of the supply chain. However, obtaining data from the suppliers and customers of each company surveyed presents significant challenges.
In the future, researchers could conduct cross-industry comparisons within major manufacturing industries, such as between traditional and emerging industries. In addition, expanding the sample scope to include a broader range of industries, especially services, consumer goods, and other sectors, would help validate the contribution of SCQM to FP across different contexts. Meanwhile, future research should focus on collecting data from all supply chain participants rather than relying solely on the perspectives of core companies within the supply chain.

Author Contributions

Conceptualization, Y.L. and Y.J.; methodology, Y.L. and Y.J.; software, Y.L. and Y.J.; validation, Y.J.; formal analysis, Y.L. and Y.J.; investigation, Y.L. and Y.J.; resources, Y.L. and Y.J.; data curation, Y.L. and Y.J.; writing—original draft preparation, Y.L.; writing—review and editing, Y.L. and Y.J.; visualization, Y.L. and Y.J.; supervision, Y.J.; project administration, Y.J. All authors have read and agreed to the published version of the manuscript.

Funding

This research was funded by the Ministry of Education of the People’s Republic of China under the Humanities and Social Sciences Research Planning Fund Project “Research on the Coordinated Development of China-Russia Cross-border E-commerce and Cross-border Logistics under the Belt and Road Initiative” (Project No. 21YJAGJW002), and the Key Commissioned Project of Economic and Social Development Research in Liaoning Province “Research on the Coordination between Liaoning Comprehensive Transport Corridors and Industrial Chains and Its Development Strategies” (Project No. 2024lslzdwtkt-26).

Institutional Review Board Statement

Not applicable.

Informed Consent Statement

Not applicable.

Data Availability Statement

Data are contained within the article.

Conflicts of Interest

The authors declare no conflicts of interest.

Appendix A

Table A1. Reliability and validity test results of the measurement model (pilot study).
ConstructItem
Number
Corrected Item–Total CorrelationCronbach’s α If DeletedCronbach’s α
SCQMSQMSQM10.7660.7310.805
SQM2 *0.1580.864
SQM30.5630.776
SQM40.6380.761
SQM50.5930.774
SQM60.6190.766
SQM70.6290.765
IQMIQM10.8830.8580.884
IQM20.7210.868
IQM30.7310.869
IQM40.7020.87
IQM5 *−0.1420.916
IQM60.7530.867
IQM70.7250.869
IQM80.6840.871
IQM90.7110.87
IQM10 *−0.0890.911
IQM110.7090.87
IQM120.6440.873
IQM130.6590.872
COCO10.7960.540.732
CO2 *0.0380.868
CO30.7160.608
CO40.5860.655
CO50.5580.67
SCQISCQI10.8450.7440.852
SCQI20.6370.834
SCQI30.6420.832
SCQI40.6870.816
SCSSCS10.8790.789 0.868
SCS20.7020.839
SCS30.7090.837
SCS40.6130.861
SCS5 *0.0470.869
SCS60.5960.864
SCCRCRC10.8580.798 0.878
RC20.7340.846
RC30.7540.837
RC40.6450.879
SCSC10.8270.606 0.819
SC20.6380.804
SC3 *−0.0080.826
SC40.6260.814
ICIC10.8120.811 0.869
IC20.7290.832
IC30.6340.856
IC40.6670.847
IC50.6520.852
FPFinPFinP10.7900.7180.843
FinP20.6980.795
FinP30.6860.811
OPOP10.8540.8160.878
OP20.6110.874
OP30.6560.865
OP40.7040.853
OP50.7540.842
MPMP10.8230.6670.836
MP20.6320.842
MP30.7180.761
DIDI10.860.79 0.870
DI20.6080.862
DI30.6590.852
DI40.6870.844
DI50.6830.848
Note: * Items were removed from the final scale due to low item–total correlation and improved Cronbach’s α when deleted.
Table A2. Questionnaire.
ConstructItemsMeasures
Supply chain quality
management
[6,8,20]
Supplier quality managementSQM1Your organization regularly conducts quality audits on suppliers.
SQM3Your organization consistently provides feedback on the performance of suppliers’ products.
SQM4Your organization actively participates in suppliers’ quality-related activities.
SQM5Your organization has a formal procedure for evaluating and certifying suppliers.
SQM6Your organization engages in frequent face-to-face communication with key suppliers.
SQM7Your organization considers product quality the most important factor in supplier selection.
Internal quality managementIQM1The supply chain leaders of your organization facilitate collaboration to enhance the overall quality of the supply chain.
IQM2The supply chain leaders of your organization promote the “quality first” value throughout the entire supply chain.
IQM3The supply chain leaders of your organization encourage supply chain members to adhere to high ethical standards.
IQM4The supply chain leaders of your organization emphasize compliance with health and safety regulations among supply chain members.
IQM6Your organization collaborates with supply chain partners to develop strategic plans.
IQM7Your organization shares projects with supply chain partners and jointly plans for future demands.
IQM8Your organization provides advance notice to supply chain partners regarding changes in demand.
IQM9Your supply chain partners keep your organization well informed about issues that may impact your business.
IQM11Your supply chain partners share business knowledge regarding core business processes with your organization.
IQM12Your organization exchanges up-to-date information with supply chain partners to support business planning.
IQM13Your organization and supply chain partners notify each other about events or changes that may affect other partners.
Customer orientationCO1Your organization actively and regularly solicits customer feedback to identify their needs and expectations.
CO3Your organization has established an effective customer complaint resolution process.
CO4Your organization systematically and regularly measures customer satisfaction.
CO5The needs and expectations of your organization’s customers are effectively communicated and understood across the entire workforce.
Supply chain quality integration [25]SCQI1The internal quality system of your organization has achieved advanced cross-functional integration in statistical quality tools, information technology applications, quality cost control, and evaluation/certification systems.
SCQI2Suppliers have advanced internal quality systems that meet your organization’s requirements and are integrated with your organization’s quality system.
SCQI3Customers have advanced internal quality systems that are integrated with your organization’s quality system.
SCQI4Your organization has a well-established product recall system that effectively establishes mechanisms for tracking, preventive actions, compensation, and top management commitment.
Supply chain strategy [9]SCS1Your organization’s supply chain delivers predictable products.
SCS2Your organization’s supply chain reduces costs through mass production.
SCS3Your organization’s supply chain provides standardized products to customers.
SCS4Your organization’s supply chain responds swiftly to changing market environments.
SCS6Your organization’s supply chain structure frequently adapts to market fluctuations.
Supply chain
capability
[6,10,55]
Responsiveness capabilityRC1Your organization has a stronger capability for product improvement to meet customer requirements.
RC2Your organization can respond more quickly and effectively to competitors’ quality strategies.
RC3Your organization can provide feedback to suppliers more rapidly and efficiently.
RC4Suppliers tend to provide feedback on raw material quality to your organization more quickly.
Sustainable capabilitySC1Your organization’s sustainable supply chain reduces negative environmental impacts.
SC2Your organization’s sustainable approach enhances operational efficiency and reduces costs.
SC4Your organization incorporates feedback from suppliers and consumers in product design to minimize the use of hazardous materials and reduce inventory levels.
Innovation capabilityIC1Your organization demonstrates creativity in supply chain operations.
IC2Your organization frequently introduces new supply chain service approaches.
IC3Your organization encourages supply chain members to propose new ideas.
IC4Your organization pursues continuous innovation in core processes.
IC5Your organization strives for new technological innovations.
Firm
performance
[4,55,56]
Financial performanceFinP1Your organization’s pre-tax net income has increased over the past three years.
FinP2Your organization’s sales revenue has grown over the past three years.
FinP3Your organization’s return on investment has increased over the past three years.
Operational performanceOP1Your organization demonstrates delivery reliability.
OP2Your organization is capable of reducing lead times.
OP3Your organization’s supply chain complies with regulations.
OP4Your organization’s supply chain exhibits production flexibility.
OP5Your organization’s product structure is flexible.
Market performance MP1Your organization’s market share has increased over the past three years.
MP2Your organization’s profitability has improved over the past three years.
MP3Your organization’s export volume has grown over the past three years.
Digital intelligence [47]DI1Your organization leverages digital technologies to upgrade and transform existing products, services, and processes.
DI2Your organization comprehensively promotes digital design, manufacturing, and management.
DI3Your organization develops digital products and services.
DI4Your organization is committed to actively promoting and advocating digital skills and management knowledge.
DI5There is a shared consensus within your organization that adopting digital technologies and digital management benefits business development.
Table A3. ANOVA results on the number of employees and performance.
ItemNumber of EmployeesSample SizeMeanStandard DeviationF-Valuep
Financial Performance≤50732.7400.9032.9440.033
51~300962.9230.961
301~1000813.0991.094
>1000863.1630.965
Operational Performance≤50732.6140.8865.0650.002
51~300962.9750.938
301~1000813.1510.951
>1000863.0700.883
Market Performance≤50732.8630.9922.2180.086
51~300962.7811.044
301~1000813.1521.044
>1000863.0311.060
Table A4. ANOVA results on position and performance.
ItemPositionSample SizeMeanStandard DeviationF-Valuep
Financial PerformanceJunior Management1522.8600.9553.7220.025
Middle Management1022.9831.019
Senior Management823.2280.994
Operational PerformanceJunior Management1523.1260.9855.2560.006
Middle Management1022.9100.888
Senior Management822.7270.834
Market PerformanceJunior Management1522.7521.0755.4000.005
Middle Management1023.0821.040
Senior Management823.1630.923
Table A5. ANOVA results on experience and performance.
ItemExperience (Years)Sample SizeMeanStandard DeviationF-Valuep
Financial Performance<51052.7460.8486.9530.000
6~10712.9960.984
11~15722.9441.109
16~20603.0660.990
>20283.8100.783
Operational Performance<51052.8110.9623.7320.005
6~10712.9410.892
11~15723.0080.882
16~20602.9230.968
>20283.5570.780
Market Performance<51052.8631.0173.4240.009
6~10712.7981.008
11~15723.2081.031
16~20602.7781.072
>20283.3921.019

References

  1. Bastas, A.; Liyanage, K. Sustainable supply chain quality management: A systematic review. J. Clean. Prod. 2018, 181, 726–744. [Google Scholar] [CrossRef]
  2. Sidhu, M.K.; Singh, K.; Singh, D. Strategic impact of SCM and SCQM practices on competitive dimensions of Indian manufacturing industries. TQM J. 2019, 31, 696–721. [Google Scholar] [CrossRef]
  3. Hong, J.; Yibin, Z.; Shi, M. The impact of supply chain quality management practices and knowledge transfer on organisational performance: An empirical investigation from China. Int. J. Logist. Res. Appl. 2018, 21, 259–278. [Google Scholar] [CrossRef]
  4. Abdallah, A.B.; Alhyari, S.; Alfar, N.A. Exploring the impact of supply chain quality management on market performance: The mediating roles of supply chain integration and operational performance. Bus. Process Manag. J. 2023, 29, 1159–1183. [Google Scholar] [CrossRef]
  5. Lee, V.-H.; Foo, P.-Y.; Tan, G.W.-H.; Ooi, K.-B.; Sohal, A. Supply chain quality management for product innovation performance: Insights from small and medium-sized manufacturing enterprises. Ind. Manag. Data Syst. 2021, 121, 2118–2142. [Google Scholar] [CrossRef]
  6. Abdallah, A.B.; Alfar, N.A.; Alhyari, S. The effect of supply chain quality management on supply chain performance: The indirect roles of supply chain agility and innovation. Int. J. Phys. Distrib. Logist. Manag. 2021, 51, 785–812. [Google Scholar] [CrossRef]
  7. Kuei, C.-H.; Madu, C.N.; Lin, C. Implementing supply chain quality management. Total Qual. Manag. Bus. Excell. 2008, 19, 1127–1141. [Google Scholar] [CrossRef]
  8. Luo, L.; Liu, X.; Zhao, X.; Flynn, B.B. The impact of supply chain quality leadership on supply chain quality integration and quality performance. Supply Chain Manag. Int. J. 2023, 28, 508–521. [Google Scholar] [CrossRef]
  9. Zimmermann, R.; Ferreira, L.M.D.F.; Moreira, A.C. How supply chain strategies moderate the relationship between innovation capabilities and business performance. J. Purch. Supply Manag. 2020, 26, 100658. [Google Scholar] [CrossRef]
  10. Hong, J.; Liao, Y.; Zhang, Y.; Yu, Z. The effect of supply chain quality management practices and capabilities on operational and innovation performance: Evidence from Chinese manufacturers. Int. J. Prod. Econ. 2019, 212, 227–235. [Google Scholar] [CrossRef]
  11. Yu, Y.; Zhang, M.; Huo, B. The impact of supply chain quality integration on green supply chain management and environmental performance. Total Qual. Manag. Bus. Excell. 2017, 30, 1110–1125. [Google Scholar] [CrossRef]
  12. Agrawal, R.; Wankhede, V.A.; Kumar, A.; Luthra, S. A systematic and network-based analysis of data-driven quality management in supply chains and proposed future research directions. TQM J. 2023, 35, 73–101. [Google Scholar] [CrossRef]
  13. Xie, J.; Zheng, Y.; Dong, Q. Empowering new productive forces in manufacturing enterprises through supply chain digital intelligence: A quasi-natural experiment based on the construction of pilot cities for supply chain innovation and application. J. Shanghai Univ. Financ. Econ. 2024, 26, 15–29. [Google Scholar]
  14. Bettis, R.A. Performance differences in related and unrelated diversified firms. Strateg. Manag. J. 1981, 2, 379–393. [Google Scholar] [CrossRef]
  15. Anh, P.; Nguyen, H.; Dinh Phuong, T.; Nguyen, H.; Matsui, Y. Impact of supply chain quality management practices on operational performance: Empirical evidence from manufacturing companies in Vietnam. Supply Chain Manag. 2019, 24, 855–871. [Google Scholar]
  16. Kuei, C.H.; Madu, C.N.; Lin, C. The relationship between supply chain quality management practices and organizational performance. Int. J. Qual. Reliab. Manag. 2001, 18, 864–872. [Google Scholar] [CrossRef]
  17. Huo, B.; Ye, Y.; Zhao, X.; Zhu, K. Supply chain quality integration: A taxonomy perspective. Int. J. Prod. Econ. 2019, 207, 236–246. [Google Scholar] [CrossRef]
  18. Kaynak, H.; Hartley, J.L. A replication and extension of quality management into the supply chain. J. Oper. Manag. 2008, 26, 468–489. [Google Scholar] [CrossRef]
  19. Sahoo, S. Blockchain-enabled traceability systems for supply chain quality management: Empirical insights from pharmaceutical manufacturers. Int. J. Qual. Reliab. Manag. 2025, 42, 1381–1410. [Google Scholar] [CrossRef]
  20. Lim, A.-F.; Ooi, K.-B.; Tan, G.W.-H.; Cham, T.-H.; Alryalat, M.A.A.; Dwivedi, Y.K. Adapt or die: A competitive digital supply chain quality management strategy. J. Enterp. Inf. Manag. 2022, 37, 698–720. [Google Scholar] [CrossRef]
  21. Soares, A.; Soltani, E.; Liao, Y.-Y. The influence of supply chain quality management practices on quality performance: An empirical investigation. Supply Chain Manag. 2017, 22, 122–144. [Google Scholar] [CrossRef]
  22. Asieh, S.; Davood Andalib, A.; Paul, A.D.; Biman Darshana, H. Employing total quality practices in sustainable supply chain management. Sustain. Prod. Consum. 2021, 28, 953–968. [Google Scholar]
  23. Kumar, A.; Singh, R.K.; Modgil, S. Influence of data-driven supply chain quality management on organizational performance: Evidences from retail industry. TQM J. 2023, 35, 24–50. [Google Scholar] [CrossRef]
  24. Zhou, X.; Zhu, Q.; Xu, Z. The mediating role of supply chain quality management for traceability and performance improvement: Evidence among Chinese food firms. Int. J. Prod. Econ. 2022, 254, 108630. [Google Scholar] [CrossRef]
  25. Zhang, Y.; Jiangtao, H.; Xue, L.; Shi, V. The Impacts of Quality System Integration and Relationship Quality on Quality Performance in Supply Chains: An Empirical Investigation in China. Emerg. Mark. Financ. Trade 2022, 58, 116–133. [Google Scholar] [CrossRef]
  26. Robinson, C.J.; Malhotra, M.K. Defining the concept of supply chain quality management and its relevance to academic and industrial practice. Int. J. Prod. Econ. 2005, 96, 315–337. [Google Scholar] [CrossRef]
  27. Escorcia-Caballero, J.P.; Moreno-Luzon, M.D.; Romano, P. Does supply chain quality integration guarantee ambidexterity? Contingency and configuration perspectives on their relationships. Total Qual. Manag. Bus. Excell. 2022, 33, 388–409. [Google Scholar] [CrossRef]
  28. Huo, B.; Zhao, X.; Lai, F. Supply Chain Quality Integration: Antecedents and Consequences. IEEE Trans. Eng. Manag. 2014, 61, 38–51. [Google Scholar] [CrossRef]
  29. Flynn, B.B.; Huo, B.; Zhao, X. The impact of supply chain integration on performance: A contingency and configuration approach. J. Oper. Manag. 2010, 28, 58–71. [Google Scholar] [CrossRef]
  30. Arora, A.; Arora, A.S.; Sivakumar, K. Relationships among supply chain strategies, organizational performance, and technological and market turbulences. Int. J. Logist. Manag. 2016, 27, 206–232. [Google Scholar] [CrossRef]
  31. Piprani, A.; Khan, S.; Yu, Z. Supply chain analytics and post-pandemic performance: Mediating role of triple-A supply chain strategies. Int. J. Emerg. Mark. 2022, 18, 1330–1354. [Google Scholar]
  32. Feizabadi, J.; Maloni, M.; Gligor, D. Benchmarking the triple-A supply chain: Orchestrating agility, adaptability, and alignment. Benchmarking Int. J. 2019, 26, 271–295. [Google Scholar] [CrossRef]
  33. Daneshvar, M.; Razavi Hajiagha, S.H.; Tupenaite, L.; Khoshkheslat, F. Effective factors of implementing efficient supply chain strategy on supply chain performance. Technol. Econ. Dev. Econ. 2020, 26, 947–969. [Google Scholar] [CrossRef]
  34. Spekman, R.E.; Spear, J.; Kamauff, J. Supply chain competency: Learning as a key component. Supply Chain Manag. Int. J. 2002, 7, 41–55. [Google Scholar] [CrossRef]
  35. Javanmardi, M.; Khabushani, A.; Abdi, A. Analysis information technology infrastructures toward supply chain agility in home appliance industry. Interdiscip. J. Contemp. Res. Bus. 2012, 4, 416–429. [Google Scholar]
  36. Williams, B.D.; Roh, J.; Tokar, T.; Swink, M. Leveraging supply chain visibility for responsiveness: The moderating role of internal integration. J. Oper. Manag. 2013, 31, 543–554. [Google Scholar] [CrossRef]
  37. Lee, S.M.; Lee, D.; Schniederjans, M.J. Supply chain innovation and organizational performance in the healthcare industry. Int. J. Oper. Prod. Manag. 2011, 31, 1193–1214. [Google Scholar] [CrossRef]
  38. Yun, G.; Yalcin, M.G.; Hales, D.N.; Kwon, H.Y. Interactions in sustainable supply chain management: A framework review. Int. J. Logist. Manag. 2019, 30, 140–173. [Google Scholar] [CrossRef]
  39. Sarkis, J. Supply chain sustainability: Learning from the COVID-19 pandemic. Int. J. Oper. Prod. Manag. 2021, 41, 63–73. [Google Scholar] [CrossRef]
  40. van der Vaart, T.; van Donk, D.P. A critical review of survey-based research in supply chain integration. Int. J. Prod. Econ. 2008, 111, 42–55. [Google Scholar] [CrossRef]
  41. Kumar, V.; Jabarzadeh, Y.; Jeihouni, P.; Garza-Reyes, J.A. Learning orientation and innovation performance: The mediating role of operations strategy and supply chain integration. Supply Chain Manag. Int. J. 2020, 25, 457–474. [Google Scholar] [CrossRef]
  42. Pono, M.; Alam, S.; Armayah; Munizu, M. The effect of supply chain strategy toward competitive advantage, and company performance: Case of small-medium industries in West Sulawesi Province of Indonesia. Rev. Espac. 2020, 41, 16. [Google Scholar]
  43. Salam, M.A.; Ali, M.; Seny Kan, K.A. Analyzing Supply Chain Uncertainty to Deliver Sustainable Operational Performance: Symmetrical and Asymmetrical Modeling Approaches. Sustainability 2017, 9, 2217. [Google Scholar] [CrossRef]
  44. Qrunfleh, S.; Tarafdar, M. Supply chain information systems strategy: Impacts on supply chain performance and firm performance. Int. J. Prod. Econ. 2014, 147, 340–350. [Google Scholar] [CrossRef]
  45. Kim, S.W. An investigation on the direct and indirect effect of supply chain integration on firm performance. Int. J. Prod. Econ. 2009, 119, 328–346. [Google Scholar] [CrossRef]
  46. Singh, R.K. Impact of leadership, TQM and supply chain capabilities on sustainable supply chain performance: Moderating role of institutional pressure. TQM J. 2025, 37, 953–976. [Google Scholar] [CrossRef]
  47. Xinyi, S.; Songqiang, W. Digital Intelligence Development, Dual Network Embedding, and the Resilience of New Ventures: An Empirical Study of Small and Medium-Sized Integrated Circuit Enterprises in the Yangtze River Delta. Stud. Sci. Sci. 2024, 42, 797–804. [Google Scholar]
  48. Bhattacharya, S.; Chatterjee, A. Digital project driven supply chains: A new paradigm. Supply Chain Manag. Int. J. 2022, 27, 283–294. [Google Scholar] [CrossRef]
  49. AlNuaimi, B.K.; Kumar Singh, S.; Ren, S.; Budhwar, P.; Vorobyev, D. Mastering digital transformation: The nexus between leadership, agility, and digital strategy. J. Bus. Res. 2022, 145, 636–648. [Google Scholar] [CrossRef]
  50. Han, B.; Wang, M.; Xu, S.; Kuang, H. The Impact of Lean Management on Sustainable Supply Chain Performance: Analysis of Big Data and the Role of Supply Chain Integration. Manag. Rev. 2024, 36, 237–246. [Google Scholar]
  51. Wang, Z.; Lin, S.; Chen, Y.; Lyulyov, O.; Pimonenko, T. Digitalization Effect on Business Performance: Role of Business Model Innovation. Sustainability 2023, 15, 9020. [Google Scholar] [CrossRef]
  52. Büyüközkan, G.; Göçer, F. Digital Supply Chain: Literature review and a proposed framework for future research. Comput. Ind. 2018, 97, 157–177. [Google Scholar] [CrossRef]
  53. Aiken, L.S.; West, S.G.; Reno, R.R. Multiple Regression: Testing and Interpreting Interactions; Sage: Thousand Oaks, CA, USA, 1991. [Google Scholar]
  54. Natarajan, D. ISO 9001 Quality Management Systems; Springer: Berlin/Heidelberg, Germany, 2017. [Google Scholar]
  55. Singh, R.K.; Mathiyazhagan, K. Integrating flexibility and sustainability in supply chains: A practice-based view on leadership, knowledge and digital quality management practices. Int. J. Logist. Manag. 2024, 35, 1961–1980. [Google Scholar] [CrossRef]
  56. Tse, Y.K.; Zhang, M.; Tan, K.H.; Pawar, K.; Fernandes, K. Managing quality risk in supply chain to drive firm’s performance: The roles of control mechanisms. J. Bus. Res. 2019, 97, 291–303. [Google Scholar] [CrossRef]
Figure 1. Conceptual model.
Sustainability 17 04165 g001
Figure 2. Structural equation modeling results.
Sustainability 17 04165 g002
Figure 3. Moderating effect of DI on the relationship between SCQM and FP, SCQI, SCS, and SCC.
Sustainability 17 04165 g003
Table 1. Descriptive statistical analysis.
CategoryOptionFrequencyPercentage
GenderMale20761.61%
Female12938.39%
Manufacturing industry typeMachinery and equipment15947.32%
Chemical and pharmaceutical82.38%
High-tech and electronics4011.90%
Food and beverage5014.88%
Textile and apparel51.49%
Building materials and metal processing6820.24%
Paper and printing51.49%
Others10.30%
Number of employeesLess than 507321.73%
Between 50 and 3009628.57%
Between 300 and 10008124.11%
1000 and above8625.60%
PositionJunior Management15245.24%
Middle Management10230.36%
Senior Management8224.40%
ExperienceLess than 5 years10531.25%
5–less than 10 years7121.13%
10–less than 15 years7221.43%
15–less than 20 years6017.86%
20 and above years288.33%
Level of educationBelow high school5416.07%
High school9127.08%
Bachelor12938.39%
Postgraduate and above6218.45%
Total336100.00%
Table 2. Reliability and validity analysis results.
ConstructItem
Number
Factor
Loading
AVECRCronbach’s Alpha
Supply chain quality
Management
(SCQM)
Supplier quality management (SQM)SQM10.8350.5610.8840.883
SQM30.695
SQM40.727
SQM50.695
SQM60.757
SQM70.777
Internal quality management (IQM)IQM10.8870.5470.9300.926
IQM20.704
IQM30.721
IQM40.722
IQM60.759
IQM70.727
IQM80.729
IQM90.72
IQM110.72
IQM120.724
IQM130.705
Customer
orientation (CO)
CO10.8710.596 0.854 0.850
CO30.736
CO40.749
CO50.722
Supply chain quality integration (SCQI)SCQI10.9180.610 0.861 0.853
SCQI20.696
SCQI30.748
SCQI40.744
Supply chain strategy (SCS)SCS10.9470.639 0.898 0.894
SCS20.772
SCS30.738
SCS40.76
SCS60.762
Supply chain
Capability
(SCC)
Responsiveness capability
(RC)
RC10.8940.554 0.830 0.821
RC20.719
RC30.673
RC40.669
Sustainable
capability
(SC)
SC10.8820.625 0.832 0.822
SC20.754
SC40.727
Innovation
capability
(IC)
IC10.9620.576 0.869 0.863
IC20.689
IC30.69
IC40.722
IC50.694
Firm performance
(FP)
Financial
performance (FinP)
FinP10.8860.630 0.835 0.822
FinP20.716
FinP30.77
Operational performance (OP)OP10.9640.599 0.880 0.873
OP20.727
OP30.697
OP40.699
OP50.749
Market
performance (MP)
MP10.9490.669 0.857 0.840
MP20.76
MP30.728
Digital intelligence (DI)DI10.930.581 0.873 0.870
DI20.735
DI30.697
DI40.702
DI50.723
Table 3. Discriminant validity.
DIMPOPFinPICSCRCSCSSCQICOIQMSQM
DI0.762
MP0.1250.818
OP0.1310.2940.774
FinP0.1610.2620.2070.794
IC0.0550.0360.0610.1550.759
SC0.0250.0860.1540.2020.2770.791
RC0.066−0.0790.0450.1620.4470.4620.744
SCS0.180.1720.3190.3090.1060.130.1110.799
SCQI0.2120.1450.2430.3650.0870.130.0290.2530.781
CO−0.0270.1280.1420.1560.2790.2320.2380.2110.1180.772
IQM0.0160.2030.2310.2450.2540.3040.3240.2940.1880.5450.740
SQM0.030.2480.1880.3020.2650.2330.2850.2260.2410.5440.5570.749
Table 4. Results of hypothesis testing.
HypothesisPathDirect
Effect
Indirect
Effect
Total
Effect
Bias-Corrected
Bootstrap 95%
Confidence
Interval
pResult
LowerUpper
H1SCQM → FP0.3570.1970.554 ***Supported
H2aSCQM → SCQI0.264———— ***Supported
H2bSCQM → SCS0.348———— ***Supported
H2cSCQM → SCC0.530———— ***Supported
H3aSCQI → FP0.328———— ***Supported
H3bSCS → FP0.315———— ***Supported
H3cSCC → FP0.004———— 0.969Unsupported
H4aSCQM → SCQI → FP0.3570.0870.4440.0400.150***Supported
H4bSCQM → SCS → FP0.3570.110.4670.0580.182***Supported
H4cSCQM → SCC → FP0.3570.0020.359−0.1170.1580.973Unsupported
H5aSCQM*DI → FP————0.3700.2590.480***Supported
H5bSCQM*DI → SCQI————0.2270.0700.3830.005Supported
H5cSCQM*DI → SCS————0.1850.0220.3460.025Supported
H5dSCQM*DI → SCC————0.021−0.0130.0030.926Unsupported
Note: 1.*** p < 0.001; 2. “*” denotes an interaction term for testing moderation effects.
Disclaimer/Publisher’s Note: The statements, opinions and data contained in all publications are solely those of the individual author(s) and contributor(s) and not of MDPI and/or the editor(s). MDPI and/or the editor(s) disclaim responsibility for any injury to people or property resulting from any ideas, methods, instructions or products referred to in the content.

