

An Econometric Analysis of CO2 Emission Intensity in Poland’s Blast Furnace–Basic Oxygen Furnace Steelmaking Process


Abstract
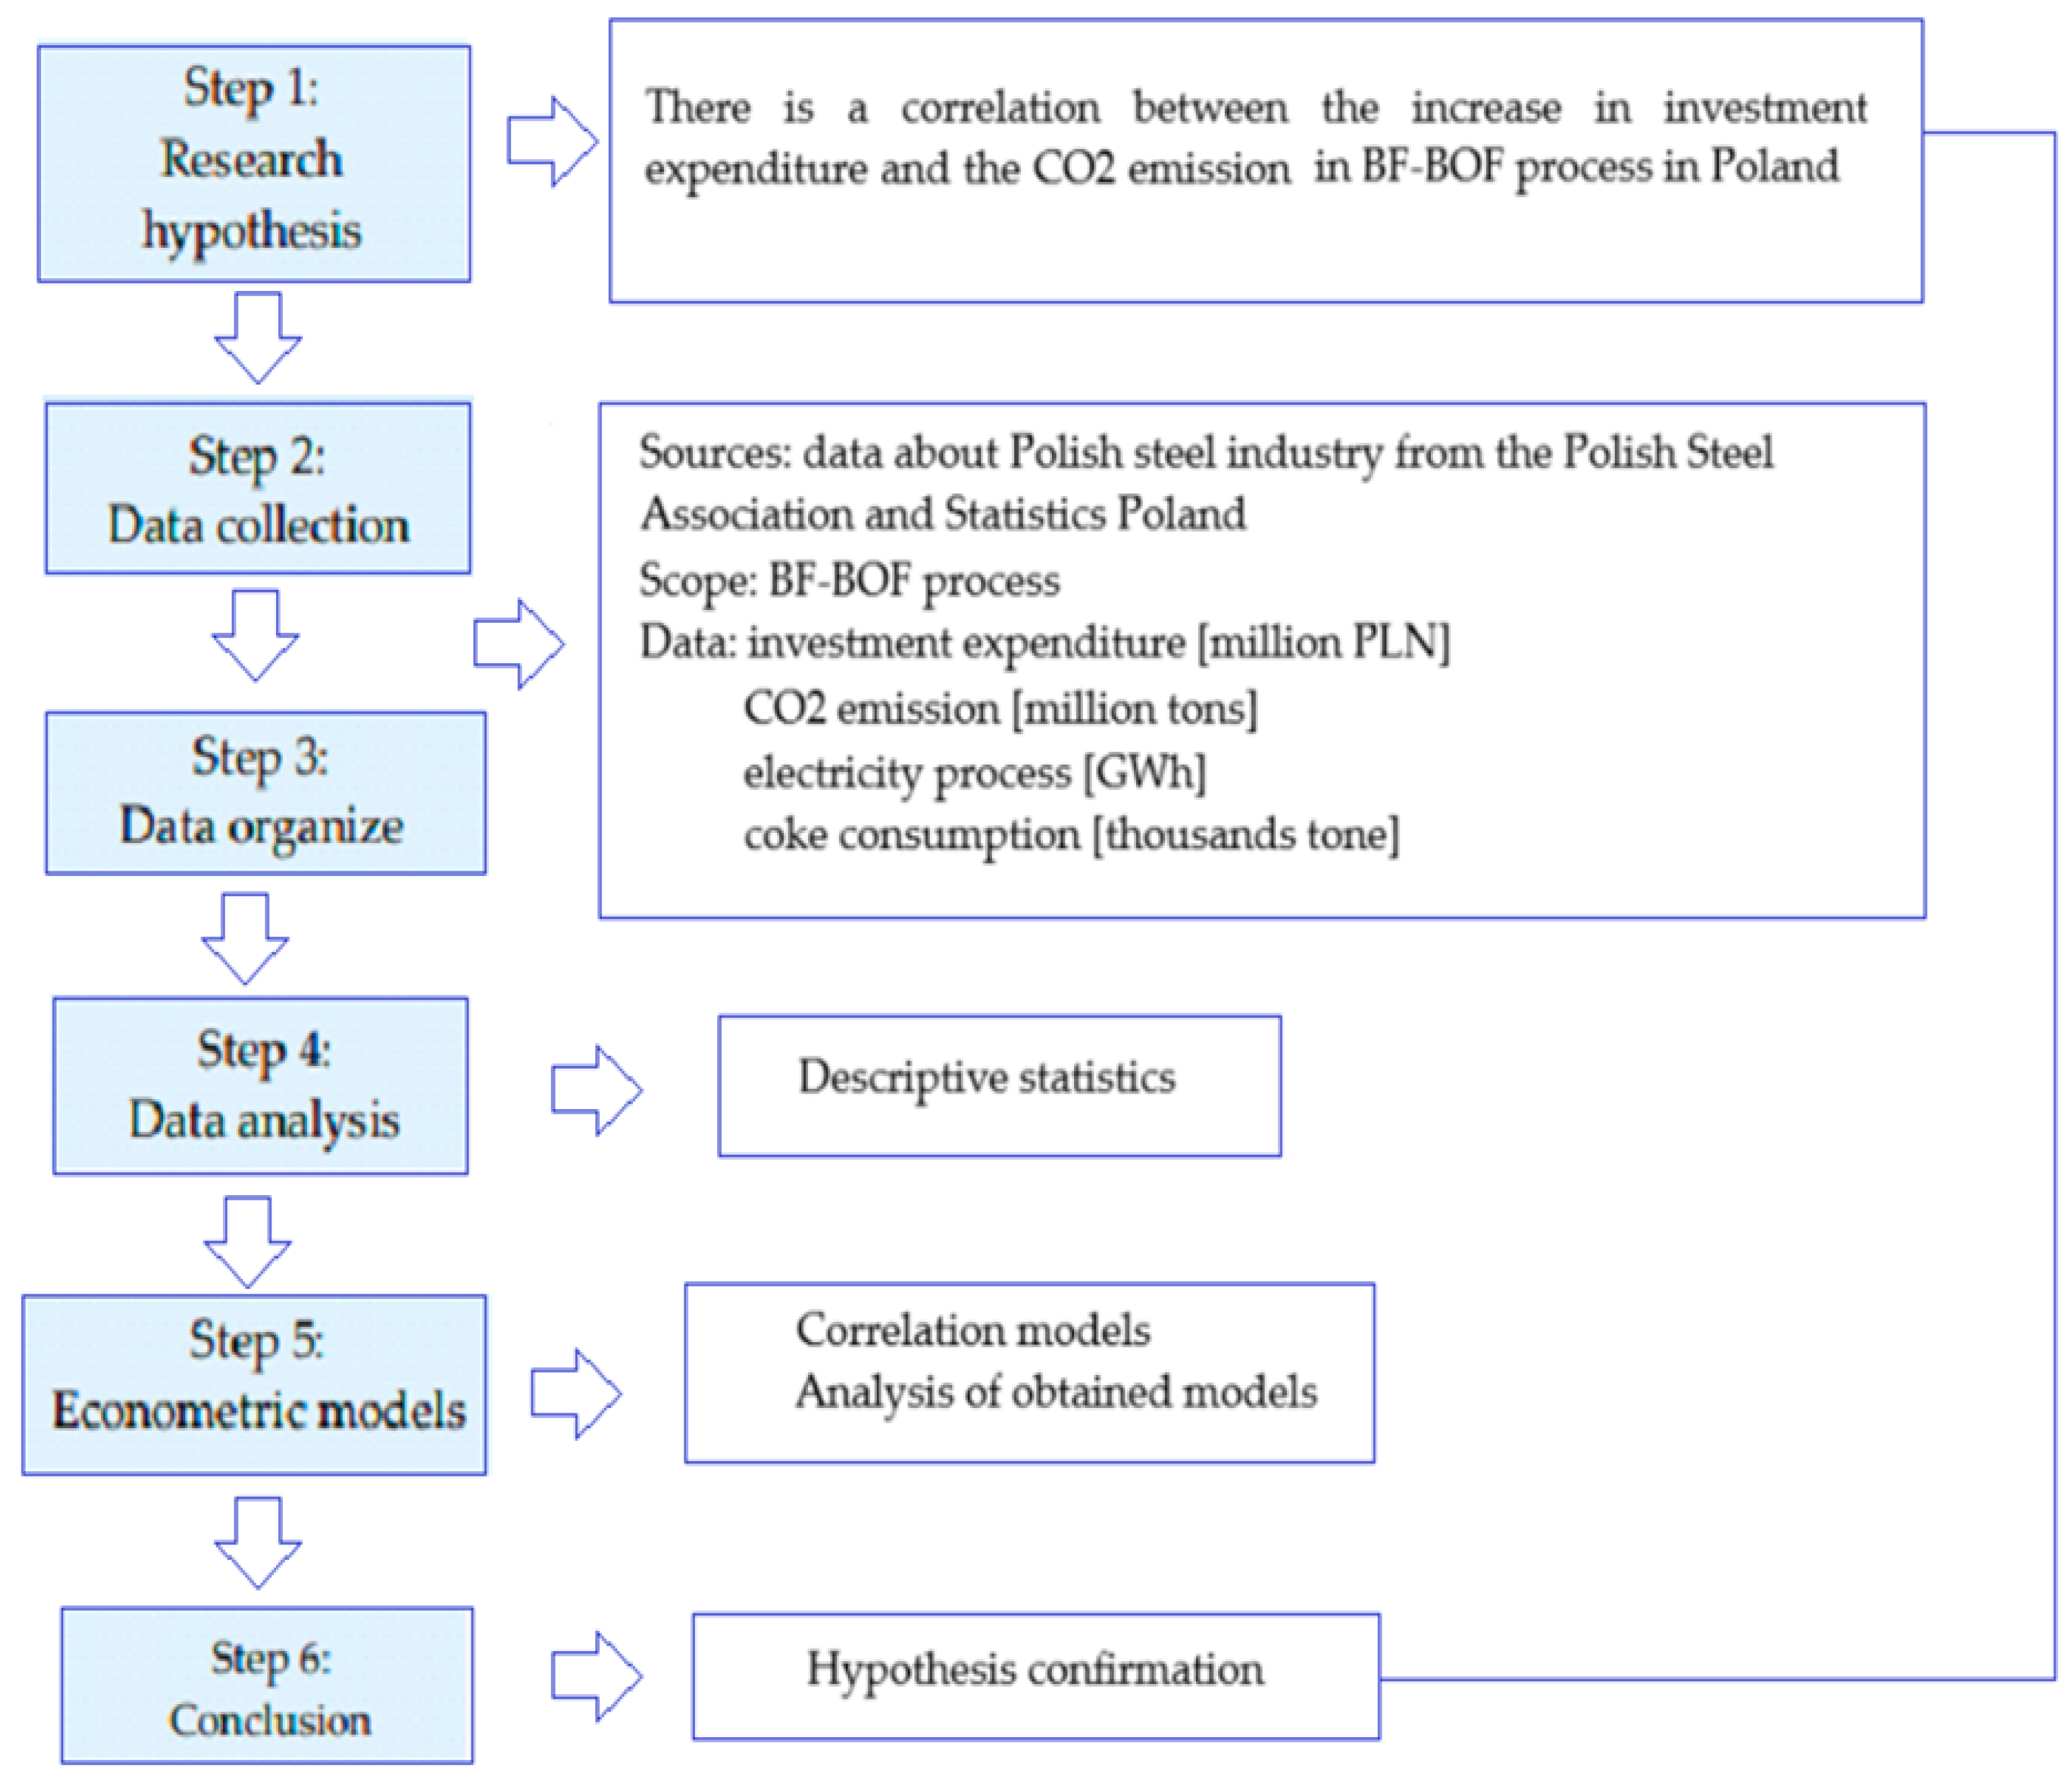
1. Introduction
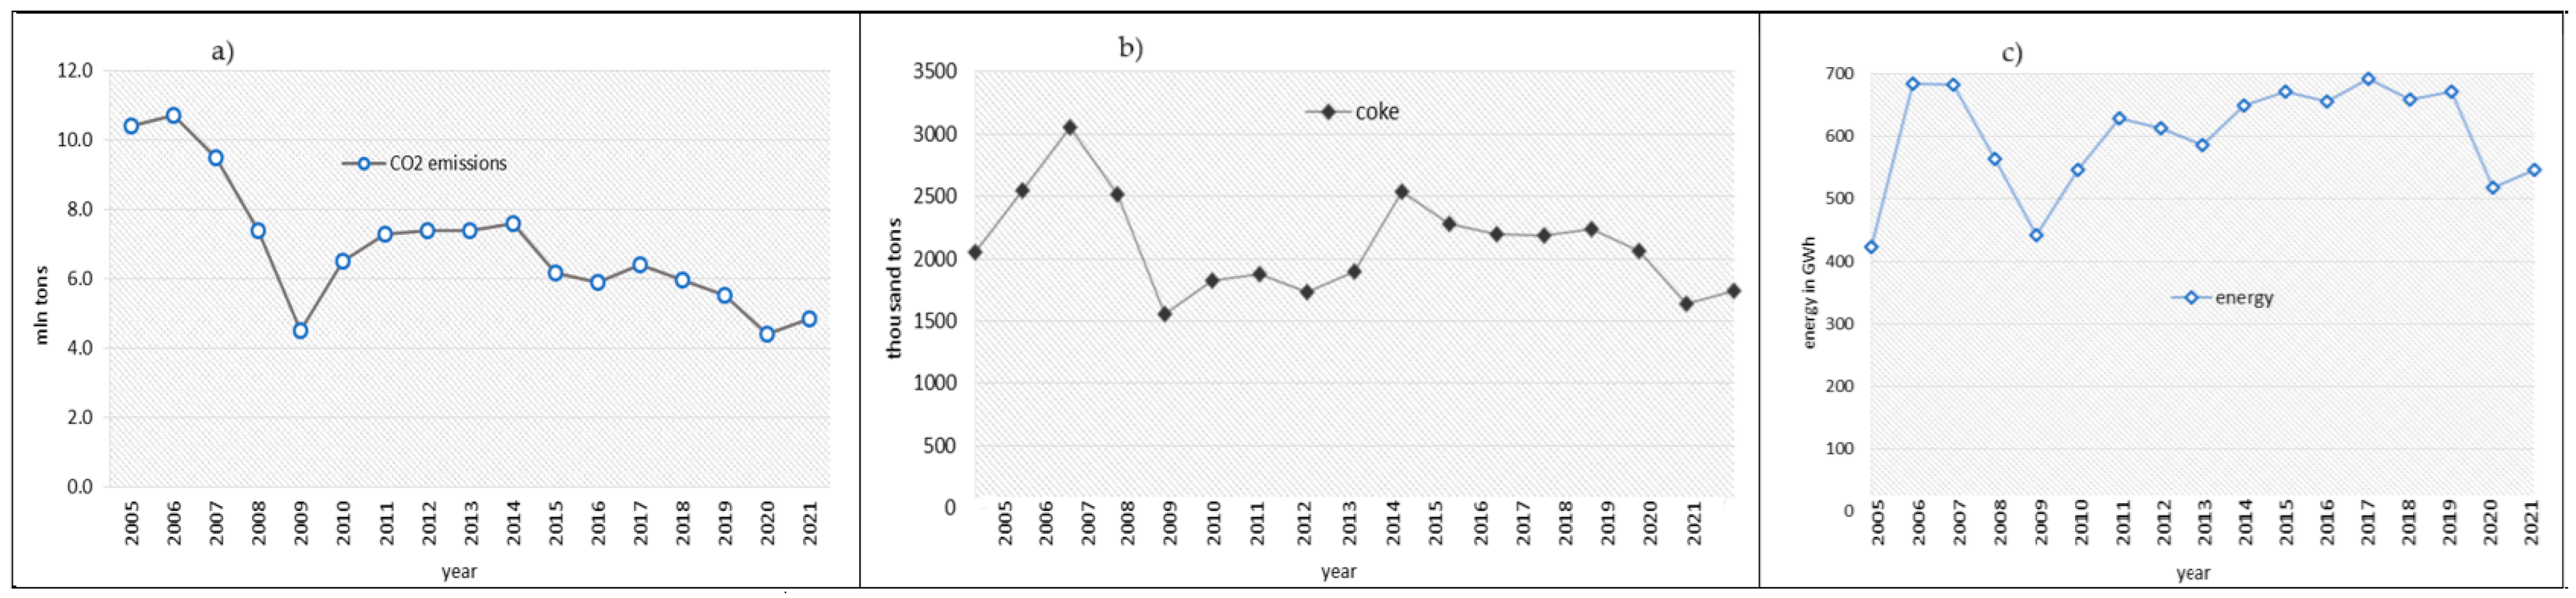
- RF1: time series analysis of CO2 emissions and electricity and coke consumption in the BF-BOF steel process from 2005 to 2021.
- RF2: econometric models of the impact of investments realized in the Polish steel industry on the CO2 emissions in BF-BOF technology.
- RF3: econometric models of the impact of investments and energy and coke consumption on CO2 emissions in BF-BOF technology.
2. Theoretical Background of Analysis
- BF-BOF: 2.33 t CO2/ton of crude steel;
- DRI–EAF: 1.37 ton CO2/t of crude steel;
- EAF: 0.68 t CO2/ton of crude steel.
3. Materials and Methods
3.1. Data Used for Analysis
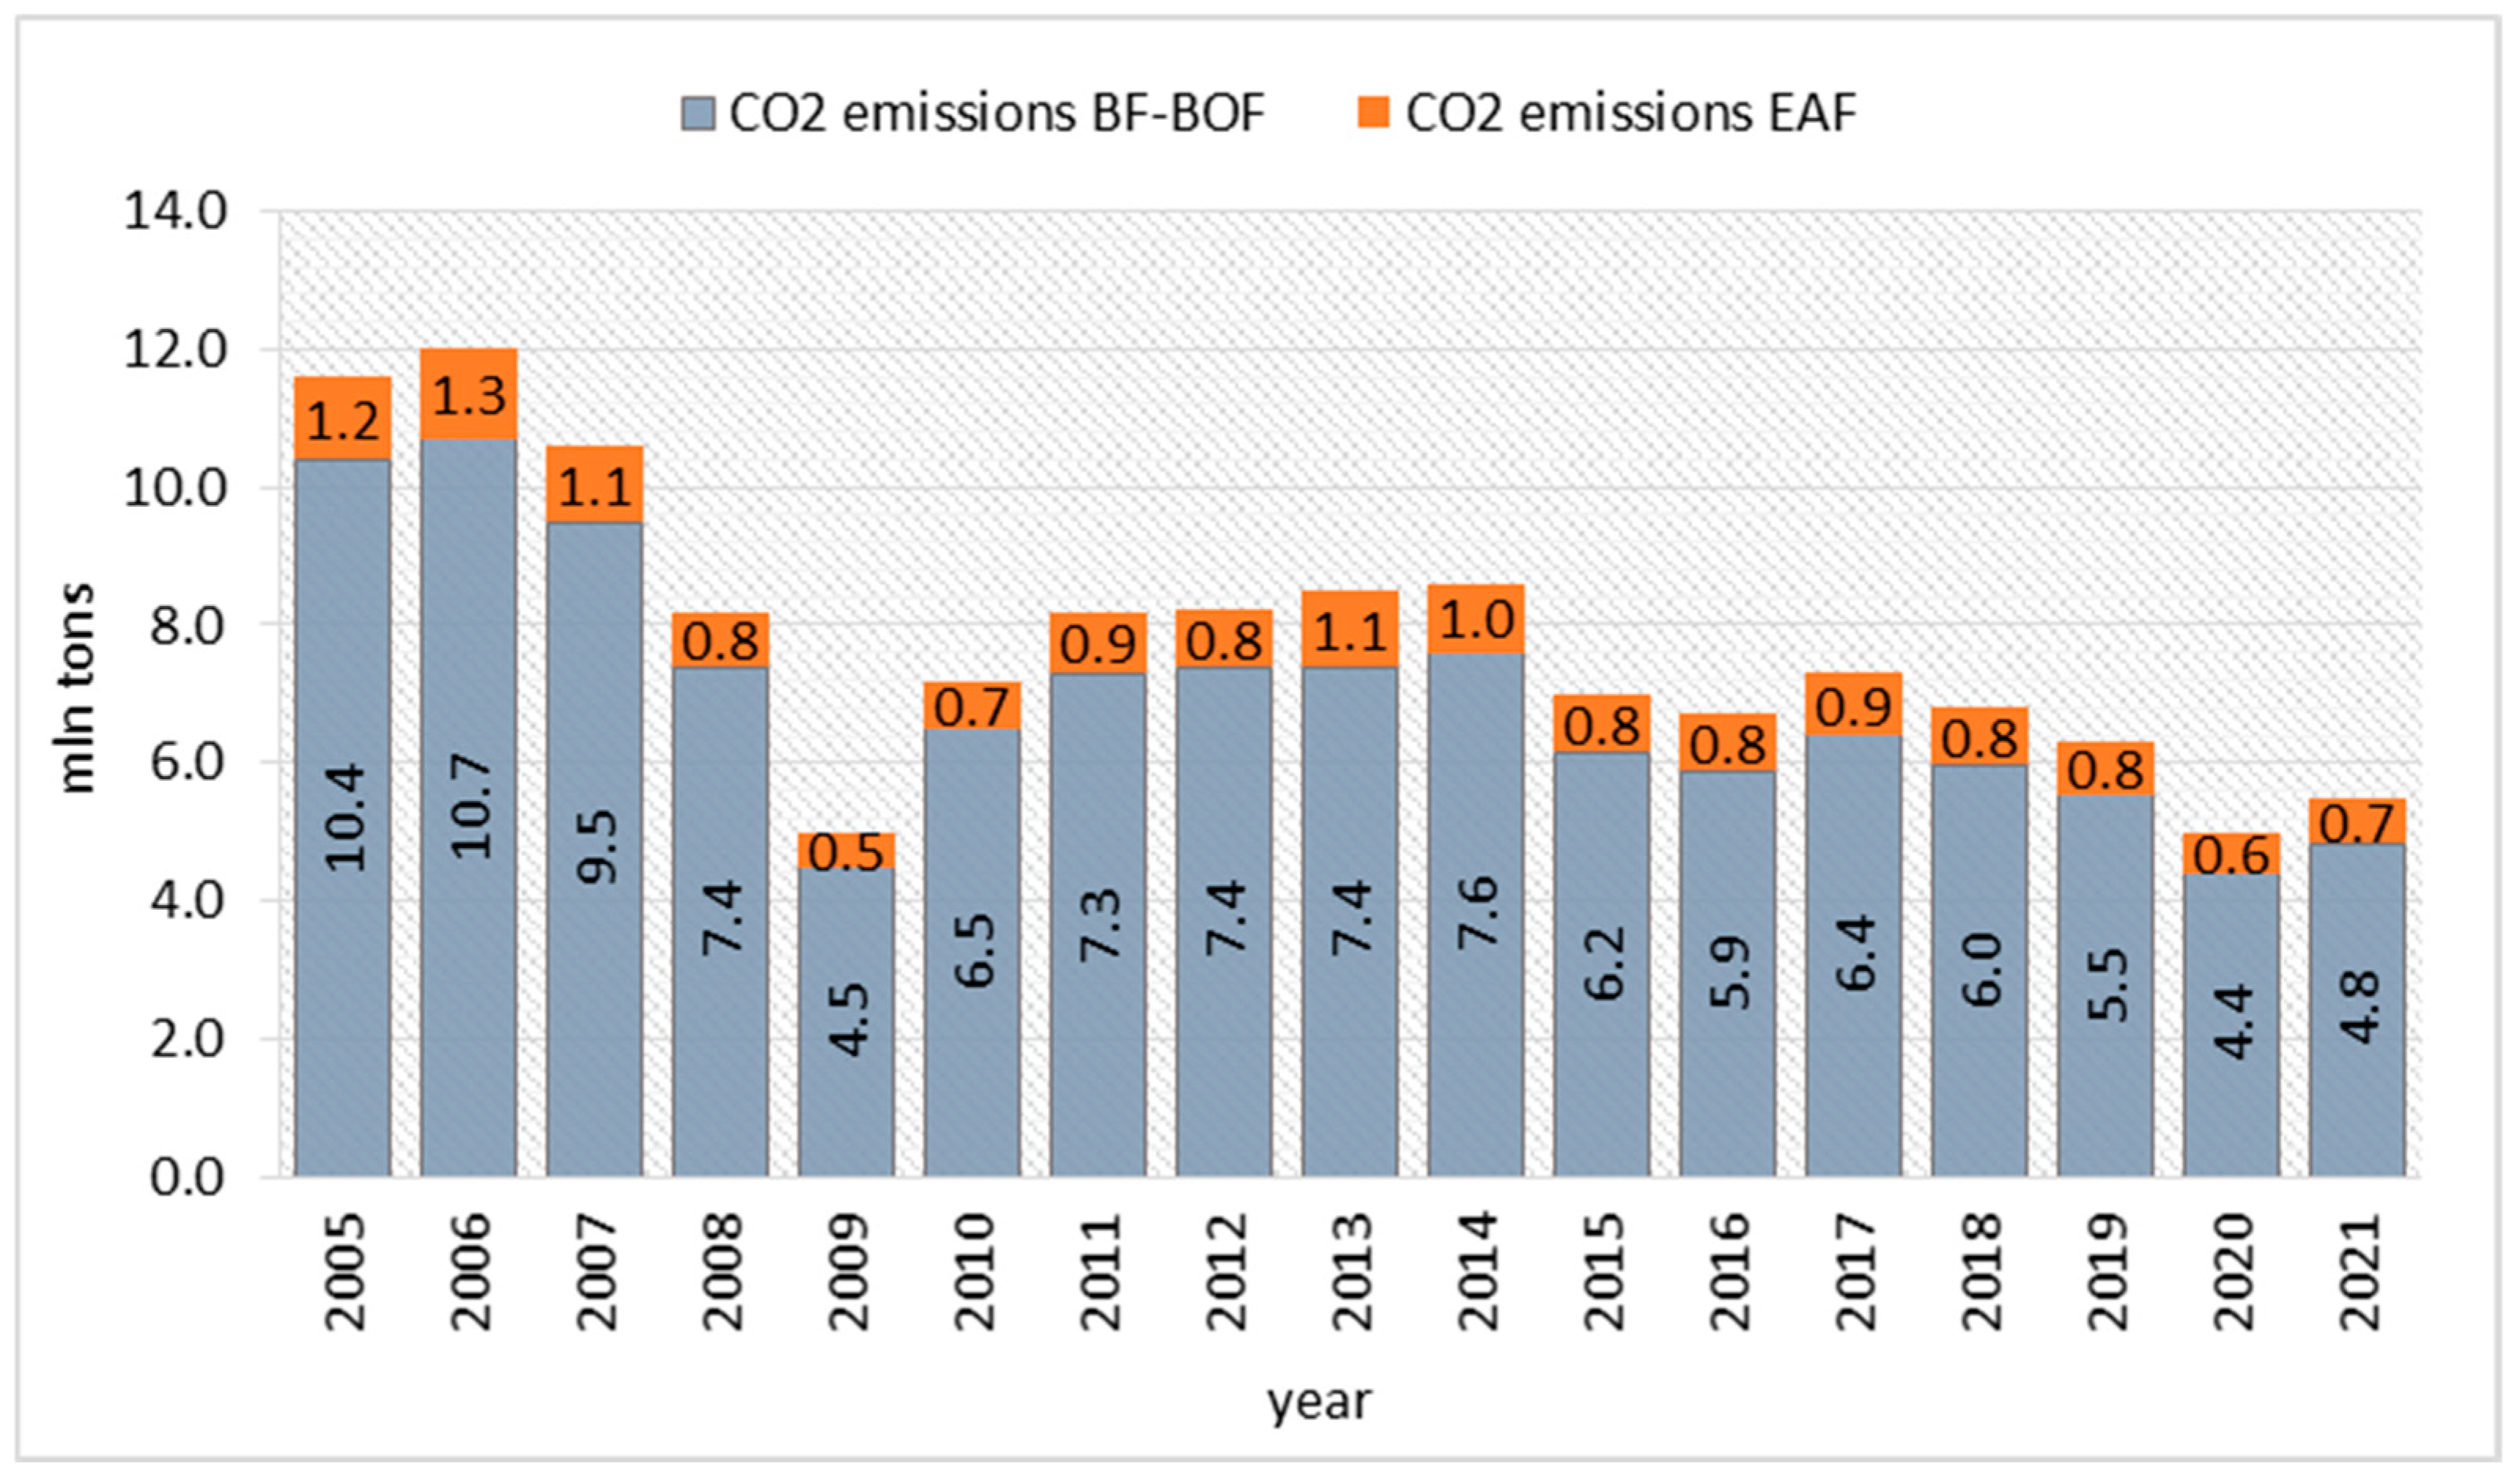
3.2. Overview of Steel Production and Emission Intensity in Poland
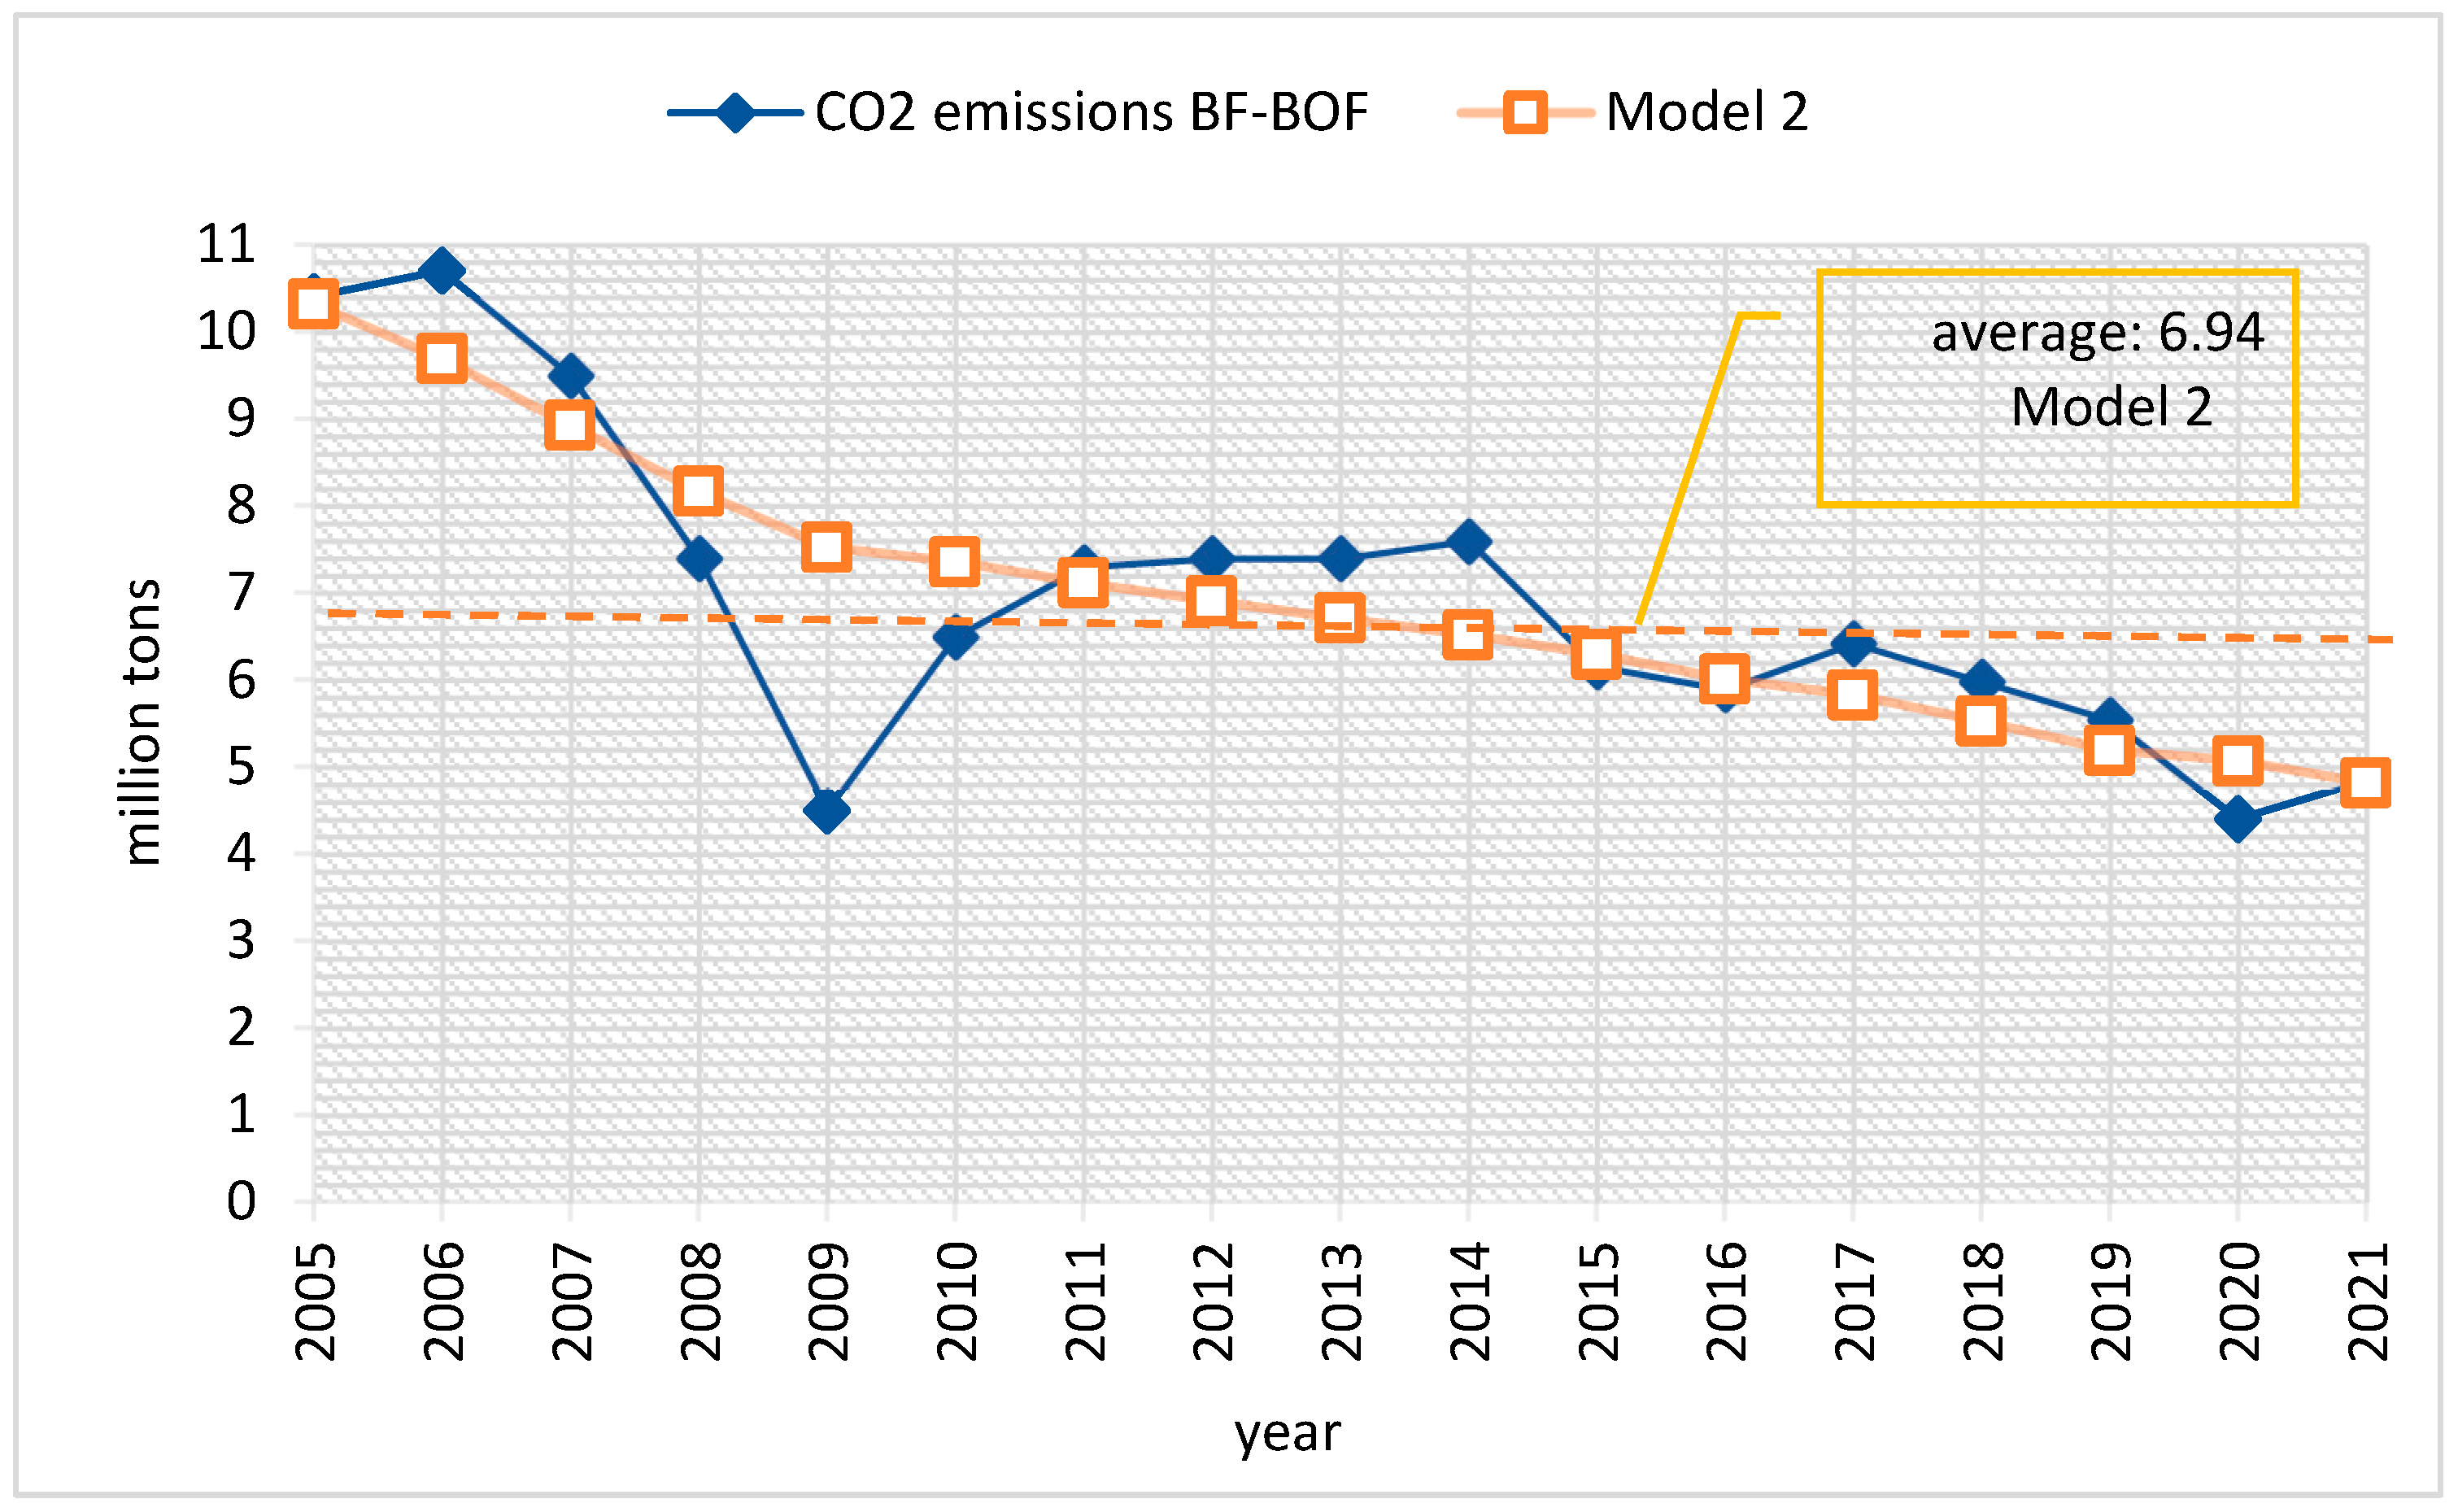
3.3. Approach to Econometric Models
4. Results
- The discovery that BF-BOF technology is in its decline phase and there will be no additional investments which will lead to drastic reductions in emissions is not the outcome of an independent statistical test. Instead, it is inferred from the following:
- The relatively low regression coefficients, especially in later models, suggest marginal environmental returns with high economic investment.
- Comparison of predicted and actual emissions, and this yields little divergence and thus little scope for further emission improvement through the implementation of identical technology.
- CO2_emissionst represents the total carbon dioxide emissions from the steel industry in year t (in million tons);
- BOF_investmentst refers to the capital expenditures related to the modernization of Basic Oxygen Furnace (BOF) technology in year ttt (in million PLN);
- crude_steel_productiont denotes the volume of crude steel production in year t (in thousand tons);
- α is the intercept (constant term);
- β1 and β2 are the parameters to be estimated, capturing the marginal effects of the explanatory variables;
- ϵt is the random error term accounting for unobserved factors.
5. Discussion
6. Conclusions
Author Contributions
Funding
Institutional Review Board Statement
Informed Consent Statement
Data Availability Statement
Conflicts of Interest
References
- Document 52011DC0885. Communication from the Commission to the European Parliament, the Council, the European Economic and Social Committee and the Committee of the Regions Energy Roadmap 2050/COM/2011/0885 Final. Available online: https://eur-lex.europa.eu/legal-content/EN/ALL/?uri=CELEX%3A52011DC0885 (accessed on 5 November 2024).
- European Council Fit for 55. 2021. Available online: https://www.consilium.europa.eu/en/policies/green-deal/fit-for-55/ (accessed on 10 October 2024).
- European Commission. Communication from the Commission to the European Parliament, the European Council, the Council, the European Economic and Social Committee and the Committee of the Regions: The European Green Deal (COM/2019/640 Final). 2019. Available online: https://eur-lex.europa.eu/legal-content/EN/TXT/?uri=COM%3A2019%3A640%3AFIN (accessed on 10 October 2024).
- CBAM Regulation (EU) 2023/956 of the European Parliament and of the Council of 10 May 2023 Establishing a Carbon Border Adjustment Mechanism, L 130/52 [EN], Official Journal of the European Union 16.5.2023. Available online: https://eur-lex.europa.eu/legal-content/EN/TXT/PDF/?uri=CELEX:32023R0956 (accessed on 10 October 2024).
- Commission Communication of 10 January 2007: “Renewable Energy Road Map. Renewable Energies in the 21st Century: Building a More Sustainable Future” [COM(2006) 848 Final—Not Published in the Official Journal]. Available online: https://eur-lex.europa.eu/legal-content/EN/ALL/?uri=celex:52006DC0848 (accessed on 10 October 2024).
- Energy From Renewable Sources in 2022; Statistics Poland: Warsaw, Poland, 2023. Available online: https://stat.gov.pl/en/topics/environment-energy/energy/energy-from-renewable-sources-in-2022,3,15.html (accessed on 9 February 2025).
- Energy Policy in Poland Until 2040, Warsaw, Poland, Government document, Polityka Energetyczna Polski do 2040 r. PEP2040. Available online: https://www.gov.pl/web/klimat/polityka-energetyczna-polski (accessed on 10 November 2024).
- Teraz Środowisko. Available online: https://www.teraz-srodowisko.pl/aktualnosci/8-procent-przemyslowych-emisji-CO2-w-UE-przypada-na-PolskePanstwo-ma-wytyczyc-kierunek-dekarbonizacji-15687.html (accessed on 10 November 2024).
- Statistical Yearbook of Industry—Poland 2022. Raport GUS Rocznik Statystyczny Przemysłu; Statistics Poland: Warsaw, Poland, 2023. Available online: https://stat.gov.pl/obszary-tematyczne/roczniki-statystyczne/roczniki-statystyczne/rocznik-statystyczny-przemyslu-2022,5,16.html (accessed on 9 February 2025).
- Report, Zmiana Kursu Polska Energetyka. 2023. Available online: https://ember-energy.org/pl/raporty/zmiana-kursu-polska-energetyka-w-2023-r/ (accessed on 10 November 2024).
- Ostrowski, A. Energochłonność Polskiego Przemysłu, MM Magazyn Przemysłowy 8–9/2022. Available online: https://magazynprzemyslowy.pl/artykuly/energochlonnosc-polskiego-przemyslu (accessed on 10 November 2024).
- IEA Scenario: Iron and Steel Final Energy Demand and Energy Intensity in the Net Zero Scenario, 2018–2030. Last Updated 4 November 2021. Available online: https://www.iea.org/data-and-statistics/charts/iron-and-steel-final-energy-demand-and-energy-intensity-in-the-net-zero-scenario-2018-2030 (accessed on 9 February 2025).
- Polish Steel Industry, Publishing House: Polish Steel Association Katowice, Poland, Annual Reports for Members. Available online: https://www.hiph.org/ANALIZY_RAPORTY/raporty.php (accessed on 9 February 2025).
- World Steel Association, Report: Sustainability Performance of the Steel Industry 2004–2022, November 2023. Brussels Belgium. Available online: https://worldsteel.org/steel-topics/sustainability/sustainability-indicators-2023-report/ (accessed on 9 February 2025).
- Dovom, H.A.; Kargari, A.; Moghaddam, A.M.; Kazemi, M.; Fini, E.H. Self-healing cold mix asphalt containing steel slag: A sustainable approach to cleaner production. J. Clean. Prod. 2024, 482, 144170. [Google Scholar] [CrossRef]
- UNFCCC. Adoption of the Paris Agreement. Report No. FCCC/CP/2015/L.9/Rev.1. 2015. Available online: http://unfccc.int/resource/docs/2015/cop21/eng/l09r01.pdf (accessed on 15 May 2023).
- Brundtland, G.H. Our Common Future, Report of the World Commission on Environment and Development, Our Common Future (Brundtland Report); Oxford University Press: New York, NY, USA, 1987. [Google Scholar]
- Dubský, Z.; Votoupalová, M.; Vítková, A. Framing the European Green Deal: Political and Media Energy Discourses in Czechia and Sweden. Humanit. Soc. Sci. Commun. 2025, 12, 233. [Google Scholar] [CrossRef]
- Karadag, M.; Gul, M.; Yucesan, M.; Ishizaka, A.; Khan, J. Evaluation of Green Deal Compliance Performance with a Hybrid Comparative Multi-Attribute Decision Model. Socio-Econ. Plan. Sci. 2025, 98, 102163. [Google Scholar] [CrossRef]
- Olczyk, M.; Kuc-Czarnecka, M. European Green Deal Index: A New Composite Tool for Monitoring European Union’s Green Deal Strategy. J. Clean. Prod. 2025, 495, 145077. [Google Scholar] [CrossRef]
- Bakkar, Y.; Bark, E.; Prause, G.; Ul-Durar, S. Green Deal and Financing Sustainable Transport in Europe: A Target Costing Analysis. Transp. Policy 2025, 163, 185–198. [Google Scholar] [CrossRef]
- Adhikari, N.; Khanam, S. Toward Sustainable Production: Emerging Trends in Iron and Steel Making. ChemBioEng Rev. 2024, 11, e202300055. [Google Scholar] [CrossRef]
- Jiao, Y.; Chen, Q.; Wu, Y.; Ji, C.; Zhang, N.; Luo, H.; Zhang, K. Designing new environmental policy instruments to promote the sustainable development of iron and steel production in China: A comparative analysis of cleaner production assessment indicator systems and the assessment principles of the green factory. Resour. Policy 2024, 96, 105244. [Google Scholar] [CrossRef]
- Zhang, P.; Wang, C.; Guo, J.; Wu, J.; Zhang, C. Production of sustainable steel fiber-reinforced rubberized concrete with enhanced mechanical properties: A state-of-the-art review. J. Build. Eng. 2024, 91, 109735. [Google Scholar] [CrossRef]
- Circular Economy Action Plan. European Commission. 2023. Available online: https://environment.ec.europa.eu/strategy/circular-economy-action-plan_en (accessed on 10 November 2024).
- European Commission. Climate Action: 2050 Long-Term Strategy. Available online: https://climate.ec.europa.eu/eu-action/climate-strategies-targets/2050-long-term-strategy_en (accessed on 22 June 2020).
- The Net-Zero Industry Act: Accelerating the Transition to Climate Neutrality, 16 March 2023. Available online: https://single-market-economy.ec.europa.eu/industry/sustainability/net-zero-industry-act_en (accessed on 10 November 2024).
- Bogodukhova, E.S.; Britvina, V.V.; Gavrilyuk, A.V.; Sorokin, A.Y.; Bobrov, K.R. Trends in the development of decarbonization in energy systems using information technology. IOP Conf. Ser. Earth Environ. Sci. 2022, 990, 012007. [Google Scholar] [CrossRef]
- Lin, B.; Xie, Y. How does digital finance drive energy transition? A green investment-based perspective. Financ. Innov. 2025, 11, 94. [Google Scholar] [CrossRef]
- Gupta, A.; Khanna, A. A holistic approach to sustainable manufacturing: Rework, green technology, and carbon policies. Expert Syst. Appl. 2023, 244, 122943. [Google Scholar] [CrossRef]
- Branca, T.A.; Fornai, B.; Murri, M.M.; Streppa, E.; Schröder, A.J. The Challenge of Digitalization in the Steel Sector. Metals 2020, 10, 288. [Google Scholar] [CrossRef]
- Gajdzik, B.; Wolniak, R.; Grebski, W. Process of transformation to net zero steelmaking: Decarbonisation scenarios based on the analysis of the polish steel industry. Energies 2023, 16, 3384. [Google Scholar] [CrossRef]
- Benavides, K.; Gurgel, A.; Morris, J.; Mignone, B.; Chapman, B.; Kheshgi, H.; Herzog, H.; Paltsev, S. Mitigating emissions in the global steel industry: Representing CCS and hydrogen technologies in integrated assessment modeling. Int. J. Greenh. Gas Control. 2024, 131, 103963. [Google Scholar] [CrossRef]
- Memoli, F.; Kemper, K. The innovative DRI-EAF route for the production of high-purity pig iron. In Proceedings of the Association for Iron and Steel Technology Conference 2018 (AISTech 2018), Philadelphia, PA, USA, 7–10 May 2018; pp. 625–632. [Google Scholar]
- Gajdzik, B.; Sujová, E.; Biały, W. Decarbonisation of the steel industry: Theoretical and practical approaches with analysis of the situation in the steel sector in Poland. Acta Montan. Slovaca 2023, 28, 621–636. [Google Scholar]
- Ling, J.; Yang, H.; Tian, G.; Cheng, J.; Wang, X.; Yu, X. Direct reduction of iron to facilitate net zero emissions in the steel industry: A review of research progress at different scales. J. Clean. Prod. 2024, 441, 140933. [Google Scholar] [CrossRef]
- Shen, J.; Zang, Q.; Tian, S.; Li, X.; Liu, J.; Rian, J. The role of hydrogen in iron and steel production: Development trends, decarbonization potentials, and economic impacts. Int. J. Hydrogen Energy 2024, 92, 1409–1422. [Google Scholar] [CrossRef]
- Bhaskar, A.; Assadi, M.; Somehsaraei, H.N. Decarbonization of the Iron and Steel Industry with Direct Reduction of Iron Ore with Green Hydrogen. Energies 2020, 13, 758. [Google Scholar] [CrossRef]
- Blog: Steel Energy Savings. Available online: https://www.metron.energy/blog/steel-industry-energy-savings/ (accessed on 10 November 2024).
- Diez, J.R.; Tomé-Torquemada, S.; Vicente, A.; Reyes, J.; Orcajo, G.A. Decarbonization pathways, strategies, and use cases to achieve Net-Zero CO2 emissions in the steelmaking industry. Energies 2023, 16, 7360. [Google Scholar] [CrossRef]
- Low Carbon Roadmap. Pathways to a CO2-Neutral European Steel Industry; The European Steel Association (EUROFER): Brussels, Belgium, 2019; Available online: https://www.eurofer.eu/assets/Uploads/EUROFER-Low-Carbon-Roadmap-Pathways-to-a-CO2-neutral-European-Steel-Industry.pdf (accessed on 15 March 2025).
- Iron and Steel Technology Roadmap. Towards more Sustainable Steelmaking. International Energy Agency, Paris, France. Available online: https://iea.blob.core.windows.net/assets/eb0c8ec1-3665-4959-97d0-187ceca189a8/Iron_and_Steel_Technology_Roadmap.pdf (accessed on 15 March 2025).
- Koolen, D.; Vidovik, D. Greenhouse Gas Intensities of the EU Steel Industry and Its Trading Partners; Publications Office of the European Union: Luxembourg, 2022; JRC129297; ISBN 978-92-76-53417-4. [Google Scholar]
- Mandova, H.; Patrizio, P.; Leduc, S.; Kjärstad, J.; Wang, C.; Wetterlund, E.; Kraxner, F.; Gale, W. Achieving carbon-neutral iron and steelmaking in Europe through the deployment of bioenergy with carbon capture and storage. J. Clean. Prod. 2019, 218, 118–129. [Google Scholar] [CrossRef]
- Net Zero Steel—A Vision for the Future of UK Steel Production. UK Steel. July 2022. Available online: https://www.makeuk.org/about/uk-steel/net-zero-steel---a-vision-for-the-future-of-uk-steel-production (accessed on 20 March 2025).
- World Steel in Figures 2024. World Steel Association. Available online: https://worldsteel.org/data/world-steel-in-figures-2024/ (accessed on 10 March 2025).
- Gajdzik, B.; Wolniak, R.; Sączewska-Piotrowska, A.; Grebski, W.W. Polish Steel Production Under Conditions of Decarbonization—Steel Volume Forecasts Using Time Series and Multiple Linear Regression. Energies 2025, 18, 1627. [Google Scholar] [CrossRef]
- Mokrzycki, E.; Gawlik, L. Decarbonisation determinants of the steel industry. Miner. Resour. Manag. 2024, 40, 71–90. [Google Scholar] [CrossRef]
- Gajdzik, B. Digital Transformation Towards Smart Steel Manufacturing A Framework for Steel Enterprises in Poland; Springer Nature: Cham, Switzerland, 2025. [Google Scholar] [CrossRef]
- Latif, W.M.S.M.; Sabdullah, N.M.; Aenun, S.N.; Bosamah, N.A. A review of global carbon capture and storage (CCS) and carbon capture, utilization, and storage (CCUS). E3S Web Conf. 2024, 516, 01009. [Google Scholar] [CrossRef]
- Langhelle, O.; Sareen, S.; Silvester, B.R. From CCS to CCU and CCUS—The pitfalls of utilisation and storage. In Making CO2 a Resource: The Interplay Between Research, Innovation and Industry; Routledge: London, UK, 2024; pp. 127–142. [Google Scholar]
- Gajdzik, B.; Siwiec, D.; Wolniak, R.; Pacana, A. Approaching open innovation in customization frameworks for product prototypes with emphasis on quality and life cycle assessment (QLCA). J. Open Innov. Technol. Mark. Complex. 2024, 10, 100268. [Google Scholar] [CrossRef]
- Suer, J.; Traverso, M.; Jäger, N. Review of Life Cycle Assessments for Steel and Environmental Analysis of Future Steel Production Scenarios. Sustainability 2022, 14, 14131. [Google Scholar] [CrossRef]
- European Commission. Industry 5.0 Towards a Sustainable, Human Centric and Resilient European Industry; Manuscript completed in January 2021; European Commission: Brussels, Belgium, 2021. [Google Scholar]
- Scaccabarozzi, R.; Artini, C.; Campanari, S.; Spinelli, M. Techno-Economic and CO2 Emissions Analysis of the Molten Carbonate Fuel Cell Integration in a DRI Production Plant for the Decarbonization of the Steel Industry. Appl. Energy 2024, 376, 124264. [Google Scholar] [CrossRef]
- Jeong, J.; Herrera, M.; Parvathaneni, S.; Chen, E.; Andrade, M.; Harris, C.; Baldea, M. An industrially-validated tube model for steam methane reformers used in direct reduced iron production. Int. J. Hydrogen Energy 2024, 91, 1232–1244. [Google Scholar] [CrossRef]
- Triana, T.; Brooks, G.A.; Rhamdhani, M.A.; Pownceby, M.I. Iron Oxide Direct Reduction and Iron Nitride Formation Using Ammonia: Review and Thermodynamic Analysis. J. Sustain. Metall. 2024, 10, 1428–1445. [Google Scholar] [CrossRef]
- Chomyn, K.; Ge, S.; Koehler, T.; Walker, C.; Rudge, D. Electric Smelting Technology Implementation Road Map. In Proceedings of the Iron & Steel Technology Conference, Columbus, OH, USA, 6–9 May 2024; Volume I, pp. 1907–1917. [Google Scholar]
- Hornby, S.A. Hydrogen-based DRI EAF steelmaking—Fact or fiction? In Proceedings of the Iron & Steel Technology Conference, Nashville, TN, USA, 29 June–1 July 2021; pp. 249–265. [Google Scholar]
- He, Z.; Li, K.; Chen, T.; Zhang, L.; Liu, L. High-purity hydrogen production from dehydrogenation of methylcyclohexane catalyzed by zeolite-encapsulated subnanometer platinum-iron clusters. Nat. Commun. 2025, 16, 92. [Google Scholar] [CrossRef] [PubMed]
- Zecca, N.; Cobden, P.D.; Lücking, L.; Manzolini, G. SEWGS integration in a direct reduction steelmaking process for CO2 mitigation. Int. J. Greenh. Gas Control 2023, 130, 103991. [Google Scholar] [CrossRef]
- Wan, F.; Li, J. Exploring hydrogen metallurgy to CO2 emissions reduction in China’s iron and steel production: An analysis based on the life cycle CO2 emissions—LEAP model. Energy Rep. 2024, 11, 4552–4563. [Google Scholar] [CrossRef]
- Shahbakhsh, H.; Osanloo, M. Greenhouse gas emissions reduction through integration of renewable and nonrenewable energy sources: A model for Sangan Iron Ore Mine Complex of Iran. Int. J. Eng. Trans. B Appl. 2025, 38, 2547–2563. [Google Scholar]
- Yang, J.; Wu, M.; Gao, J.; Qiu, K.; Yang, Y. Economic and carbon emission analysis of two typical denitrification systems for sintering process in the iron and steel industry. J. Environ. Sci. 2025, 156, 79–90. [Google Scholar] [CrossRef]
- Alamsyah, M.N.; Sukmono, S.; Winardhi, S.; Wicaksono Fitrianto, T.; Sulistyanto, A.G. Harnessing 3D seismic data for mapping natural CO2 distribution: Paving the way for future CCS/CCUS implementation in the Lower Talang Akar Formation, Jabung Block, South Sumatra Basin. Lead. Edge 2024, 43, 538–543. [Google Scholar] [CrossRef]
- Postweiler, P.; Rezo, D.; Engelpracht, M.; Nilges, B.; von der Assen, N. Low-cost negative emissions by demand-side management for adsorption-based direct air carbon capture and storage. Carbon Neutrality 2025, 4, 9. [Google Scholar] [CrossRef]
- Barati, K.; Khojasteh-Salkuyeh, Y. Eco-techno-economic assessment of methanol production: A comparative study of GHG mitigation strategies through CCS and electrified CCU pathways. J. Environ. Chem. Eng. 2024, 12, 113829. [Google Scholar] [CrossRef]
- Rowe, A.C.; Craig, B.D. Selection of Corrosion Resistant Alloys for CCS and CCUS Injection Wells, SPE. In Proceedings of the International Association of Drilling Contractors Drilling Conference, Windhoek, Namibia, 20–21 February 2024. [Google Scholar]
- Price, C.R.; Nimbalkar, S.U.; Thirumaran, K.; Cresko, J. Smart Manufacturing Pathways for Industrial Decarbonization and Thermal Process Intensification. Smart Sustain. Manuf. Syst. 2023, 7, 41–53. [Google Scholar] [CrossRef]
- Elqudah, S.M.; Gergely, V.L.; Weli, S.S. Probabilistic Seismic Resilience Evaluation of Smart Steel Frame. Lect. Notes Civ. Eng. 2024, 519, 710–720. [Google Scholar]
- Carlestam, A. Smart Steel: A Spin from New Method to Measure Hardness. In Proceedings of the 3rd International Symposium on the Recent Developments in Plate Steels, Vail, CO, USA, 2–4 June 2024; pp. 155–163. [Google Scholar]
- Yang, H.; Zhou, Z.; Ou, J. A novel smart steel strand based on optical-electrical co-sensing for full-process and full-scale monitoring of prestressing concrete structures. Int. J. Smart Nano Mater. 2023, 14, 337. [Google Scholar] [CrossRef]
- Fang, M.; Xie, Y.; Shao, Y.; Wang, T.; Liu, Z. Development of carbon capture absorbents for top gas recycling-oxygen blast furnace in the steel industry. Sep. Purif. Technol. 2025, 355, 129616. [Google Scholar] [CrossRef]
- Goswami, V.; Deepika, S.; Sharma, P.; Kothamasi, D. Recycling steel slag as fertiliser proxy in agriculture is good circular economy but disrupts plant microbial symbioses in the soil. Sci. Total Environ. 2024, 954, 176750. [Google Scholar] [CrossRef]
- Rossetto, D. The role of border carbon adjustments and subsidies in incentivising investment: Comparing equivalence in the context of steel recycling and decarbonization. Discov. Sustain. 2024, 5, 132. [Google Scholar] [CrossRef]
- Khalili-Fard, A.; Sabouhi, F.; Bozorgi-Amiri, A. Data-driven robust optimization for a sustainable steel supply chain network design: Toward the circular economy. Comput. Ind. Eng. 2024, 195, 110408. [Google Scholar] [CrossRef]
- Borji, M.K.; Sayadi, A.R.; Nikbakhsh, E. A Novel Sustainable Multi-objective Optimization Model for Steel Supply Chain Design Considering Technical and Managerial Issues: A Case Study. J. Min. Environ. 2023, 14, 295–319. [Google Scholar]
- Ghosh, S.; Raut, R.D.; Mandal, M.C.; Ray, A. Revisiting the Nexus Between Sustainable Supply Chain Management and the Performance of Steel Manufacturing Organizations: A Case Study from an Emerging Economy. IEEE Eng. Manag. Rev. 2023, 51, 189–213. [Google Scholar] [CrossRef]
- Hasanbeigi, A.; Arens, M.; Price, L. Alternative emerging ironmaking technologies for energy-efficiency and carbon dioxide emissions reduction: A technical review. Renew. Sustain. Energy Rev. 2014, 33, 645–658. [Google Scholar] [CrossRef]
- Wang, R.; Purohit, S.; Paymooni, K.; Honeyands, T. Sticking in Shaft Furnace and Fluidized Bed Ironmaking Processes: A Comprehensive Review Focusing on the Effect of Coating Materials. Metall. Mater. Trans. B 2024, 55, 2977–3006. [Google Scholar] [CrossRef]
- Gajdzik, B.; Sroka, W.; Vveinhardt, J. Energy Intensity of Steel Manufactured Utilising EAF Technology as a Function of Investments Made: The Case of the Steel Industry in Poland. Energies 2021, 14, 5152. [Google Scholar] [CrossRef]
- Wolniak, R.; Saniuk, S.; Grabowska, S.; Gajdzik, B. Identification of Energy Efficiency Trends in the Context of the Development of Industry 4.0 Using the Polish Steel Sector as an Example. Energies 2020, 13, 2867. [Google Scholar] [CrossRef]
- Gajdzik, B.; Wolniak, R.; Grebski, W. An econometric model of the operation of the steel industry in Poland in the context of process heat and energy consumption. Energies 2022, 15, 7909. [Google Scholar] [CrossRef]
- Gajdzik, B.; Wolniak, R.; Grebski, W. Electricity and heat demand in steel industry technological processes in Industry 4.0 conditions. Energies 2023, 16, 787. [Google Scholar] [CrossRef]
- Gajdzik, B.; Wolniak, R.; Nagaj, R.; Žuromskaitė-Nagaj, B.; Grebski, W.W. The influence of the global energy crisis on energy efficiency: A comprehensive analysis. Energies 2024, 17, 947. [Google Scholar] [CrossRef]
- Gajdzik, B.; Sroka, W. Resource Intensity vs. Investment in Production Installations—The Case of the Steel Industry in Poland. Energies 2021, 14, 443. [Google Scholar] [CrossRef]
- Resource Efficiency for the European steel industry Bertrand de Lamberterie European Steel Technology Platform(ESTEP) Secretary General EESC-CCMI- Sustainable EII, 6 July 2011. Available online: https://www.eesc.europa.eu/sites/default/files/resources/docs/lamberterie.pdf (accessed on 10 November 2024).
- Jeong, W.; Chun, Y.-B.; Kang, S.H.; Akmal, M.; Ryu, H.J. Enhancement of strength and ductile-brittle transition temperature of SA508 Gr.3 low-alloy steel by controlling heat accumulation in laser powder-directed energy deposition. J. Mater. Sci. Technol. 2024, 202, 240–252. [Google Scholar] [CrossRef]
- Devlin, A.; Mykhnenko, V.; Zagoruichyk, A.; Salmon, N.; Soldak, M. Techno-economic optimisation of steel supply chains in the clean energy transition: A case study of post-war Ukraine. J. Clean. Prod. 2024, 466, 142675. [Google Scholar] [CrossRef]
- Gingell, A.; Pillot, S. Steel Developments for the Global Energy Transition. In Steel Properties & Applications in Conjunction with Materials Science and Technology; Association for Iron and Steel Technology (AIST): Warrendale, PA, USA, 2022; pp. 43–50. [Google Scholar]
- Boldrini, A.; Koolen, D.; Crijns-Graus, W.; Van den Broken, M. The impact of decarbonizing the iron and steel industry on European power and hydrogen system. Appl. Energy 2024, 361, 122902. [Google Scholar] [CrossRef]
- De Castro, J.A.; Nogami, H.; Yagi, J.-I. Numerical Investigation of Simultaneous Injection of Pulverized Coal and Natural Gas with Oxygen Enrichment to the Blast Furnace. ISIJ Int. 2002, 42, 1203–1211. [Google Scholar] [CrossRef]
- Gajdzik, B.; Wolniak, R. Transitioning of steel producers to the steelworks 4.0—Literature review with case studies. Energies 2021, 14, 4109. [Google Scholar] [CrossRef]
- Ness, D.; Swift, J.; Ranasinghe, D.-C.; Xing, K.; Soebarto, V. Smart steel: New paradigms for the reuse of steel enabled by digital tracking and modelling. J. Clean. Prod. 2015, 98, 292–303. [Google Scholar] [CrossRef]
- Gajdzik, B. How Steel Mills Transform into Smart Mills: Digital Changes and Development Determinants in the Polish Steel Industry. Eur. Res. Stud. J. 2022, XXV, 27–42. [Google Scholar] [CrossRef]
- Zhou, D.; Xu, K.; Lv, Z.; Yang, J.; Li, M.; He, F.; Xu, G. Intelligent Manufacturing Technology in the Steel Industry of China: A Review. Sensors 2022, 22, 8194. [Google Scholar] [CrossRef] [PubMed]
- Gajdzik, B.; Wolniak, R. Influence of Industry 4.0 Projects on Business Operations: Literature and Empirical Pilot Studies Based on Case Studies in Poland. J. Open Innov. Technol. Mark. Complex. 2022, 8, 44. [Google Scholar] [CrossRef]
- Gajdzik, B.; Wolniak, R. Smart Production Workers in Terms of Creativity and Innovation: The Implication for Open Innovation. J. Open Innov. Technol. Mark. Complex. 2020, 8, 68. [Google Scholar] [CrossRef]
- Statistics Poland, GUS, Warsaw, Table 1 (68). Energy Intensity of Selected Products and Activities. The Energy Intensity Was Calculated Based on Energy Intensity per 1 ton of BOF Steel, Data from Table 1 (68) from STATISTICS Poland in: Energy Statistics in 2018 and 2019, Warsaw, 2020. Available online: https://stat.gov.pl/files/gfx/portalinformacyjny/en/defaultaktualnosci/3304/4/15/1/energy_statistics_in_2018_and_2019.pdf (accessed on 5 November 2024).
- Carmona-Martínez, A.A.; Bartolomé, C.; Jarauta-Córdoba, C.A. The Role of Biogas and Biomethane as Renewable Gases in the Decarbonization Pathway to Zero Emissions. Energies 2023, 16, 6164. [Google Scholar] [CrossRef]
- Paraschiv, L.S.; Paraschiv, S. Contribution of renewable energy (hydro, wind, solar and biomass) to decarbonization and transformation of the electricity generation sector for sustainable development. Energy Rep. 2023, 9, 535–544. [Google Scholar] [CrossRef]
- Meraj, S.T.; Yu, S.S.; Rahman, M.S.; Hossain Lipu, M.S.; Trinh, H. Energy management schemes, challenges and impacts of emerging inverter technology for renewable energy integration towards grid decarbonization. J. Clean. Prod. 2023, 405, 137002. [Google Scholar] [CrossRef]
- Yan, C.; Murshed, M.; Ozturk, I.; Ghardallou, W.; Khudoykulov, K. Decarbonization blueprints for developing countries: The role of energy productivity, renewable energy, and financial development in environmental improvement. Resour. Policy 2023, 83, 103674. [Google Scholar] [CrossRef]
- Zhao, C.; Wang, J.; Dong, K.; Wang, K. How does renewable energy encourage carbon unlocking? A global case for decarbonization. Resour. Policy 2023, 83, 103622. [Google Scholar] [CrossRef]
- Romasheva, N.; Cherepovitsyna, A. Renewable Energy Sources in Decarbonization: The Case of Foreign and Russian Oil and Gas Companies. Sustainability 2023, 15, 7416. [Google Scholar] [CrossRef]
- Gajdzik, B.; Wolniak, R.; Nagaj, R.; Grebski, W.W.; Romanyshyn, T. Barriers to Renewable Energy Source (RES) Installations as Determinants of Energy Consumption in EU Countries. Energies 2023, 16, 7364. [Google Scholar] [CrossRef]
- Yajima, G.T.; Nalin, L. Technological lock-in developing countries: The role of external financing. Struct. Chang. Econ. Dyn. 2024, 70, 494–502. [Google Scholar] [CrossRef]
- Marin, A.; Stubrin, L.; van Zwanenberg, P. Technological lock-in in action: Appraisal and policy commitment in Argentina’s seed sector. Res. Policy 2023, 52, 104678. [Google Scholar] [CrossRef]
- Maturana, C.O.; Vargas, I.P.; Pérez, G.U.; Robert, C.C.; Soto, S.C. Technological and business lock-in in the chilean small and medium scale mining. Ingeniare 2023, 31, 28. [Google Scholar]
- Befort, N. Technological Lock-In, Dictionary of Ecological Economics: Terms for the New Millennium; Edward Elgar Publishing: Cheltenham, UK, 2023; pp. 539–540. [Google Scholar]
- Roth, M.B.; Adams, P.J.; Jaramillo, P.; Muller, N.Z. Policy spillovers, technological lock-in, and efficiency gains from regional pollution taxes in the U.S. Energy Clim. Change 2022, 3, 100077. [Google Scholar] [CrossRef]
- Podsiadło, J. Stan i Perspektywy Hutnictwa Żelaza i Stali w Polsce, Sieć Badawcza Łukasiewicz; Górnośląski Instytut Technologiczny: Gliwice, Poland, 2023. [Google Scholar]
- Gajdzik, B. Changes in the Steel Industry in Poland in the Period 1990 to 2020: Innovation and Digitisation on the Way to Steel Mills 4.0. In Transitioning to Sustainable Industry, Innovation and Infrastructure; Cynarski, W., Gajdzik, B., Eds.; MDPI: Basel, Switzerland, 2022; pp. 1–19. ISBN 978-3-03897-868-8. [Google Scholar]
- Podsiadło, J.; Dzienniak, S.; Zagórska, M. Hutnictwo żelaza i stali w okresie przełomu. Nowe wyzwania. In Stan i Perspektywy Hutnictwa Żelaza i Stali w Polsce, Sieć Badawcza Łukasiewicz; Podsiadło, J., Ed.; Górnośląski Instytut Technologiczny: Gliwice, Poland, 2023; pp. 53–55. Available online: https://serwer1772130.home.pl/autoinstalator/wordpress/wp-content/uploads/2023/10/DRUK-Hutnictwo-Stan-i-perspektywy-komplet.pdf (accessed on 10 November 2024).
- Anyanwu, C.N.; Ojike, O.; Emodi, N.V.; Elochukwu, A.E.; Nnamani, U.A. Deep decarbonization options for the agriculture, forestry, and other land use (AFOLU) sector in Africa: A systematic literature review. Environ. Monit. Assess. 2023, 195, 565. [Google Scholar] [CrossRef]
- Kermeli, K.; Crijns-Graus, W.; Johannsen, R.M.; Mathiesen, B.V. Energy efficiency potentials in the EU industry: Impacts of deep decarbonization technologies. Energy Effic. 2022, 15, 68. [Google Scholar] [CrossRef]
- Khatiwada, D.; Vasudevan, R.A.; Santos, B.H. Decarbonization of natural gas systems in the EU—Costs, barriers, and constraints of hydrogen production with a case study in Portugal. Renew. Sustain. Energy Rev. 2022, 168, 11277. [Google Scholar] [CrossRef]
- Yu, B.; Fang, D.; Xiao, K.; Pan, Y. Drivers of renewable energy penetration and its role in power sector’s deep decarbonization towards carbon peak. Renew. Sustain. Energy Rev. 2023, 178, 113247. [Google Scholar] [CrossRef]
- Hossain, M.R.; Singh, S.; Sharma, G.D.; Apostu, S.-A.; Bansal, P. Overcoming the shock of energy depletion for energy policy? Tracing the missing link between energy depletion, renewable energy development and decarbonization in the USA. Energy Policy 2023, 174, 113469. [Google Scholar] [CrossRef]
- Monyeia, C.G.; Sovacoold, B.K.; Browne, M.A.; Jenkinsf, K.E.H.; Viririb, S.; Li, Y. Justice, poverty, and electricity decarbonization. Electr. J. 2019, 32, 47–51. [Google Scholar] [CrossRef]
- Issa, M.; Ilinca, A.; Rousse, D.R.; Boulon, L.; Groleau, P. Renewable Energy and Decarbonization in the Canadian Mining Industry: Opportunities and Challenges. Energies 2023, 16, 6967. [Google Scholar] [CrossRef]
- Hoseinzadeh, S.; Astiaso Garcia, D.; Huang, L. Grid-connected renewable energy systems flexibility in Norway islands’ Decarbonization. Renew. Sustain. Energy Rev. 2023, 185, 113658. [Google Scholar] [CrossRef]
- Gajdzik, B.; Jaciow, M.; Wolniak, R.; Wolny, R.; Grebski, W.W. Energy Behaviors of Prosumers in Example of Polish Households. Energies 2023, 16, 3186. [Google Scholar] [CrossRef]
- Struckman, L. Technological and institutional lock-in and excessive synthetic nitrogen fertilizer use on North American grain and oilseed farms. Nord. Geogr. Publ. 2021, 49, 93–101. [Google Scholar] [CrossRef]
- Masrani, S.K.; McKiernan, P.; McKinlay, A. Strategic responses to low-cost competition: Technological lock-in in the Dundee jute industry. Bus. Hist. 2020, 62, 960–981. [Google Scholar] [CrossRef]
- Wasson, R.; Saikia, A.; Bansal, P.; Chuah, C.J. Flood Mitigation, Climate Change Adaptation, and Technological Lock-in in Assam. Ecol. Econ. Soc. 2020, 3, 83–104. [Google Scholar] [CrossRef]
- Chen, Z.; Huang, L.; Yan, L.; Luo, X.; Li, Y. Autoclaved steel slag coarse aggregate: A potential solution for sustainable concrete production. Constr. Build. Mater. 2023, 400, 132627. [Google Scholar] [CrossRef]
- Amado-Fierro, Á.; Centeno, T.A.; Diez, M.A. Exploring Hydrochars from Lignocellulosic Wastes as Secondary Carbon Fuels for Sustainable Steel Production. Materials 2023, 16, 6563. [Google Scholar] [CrossRef]
- Zajemska, M.; Sajdak, M.; Iwaszko, J.; Skibiński, A.; Maroszek, A. The role of calorific waste in transformation of iron and steel industry towards sustainable production. Resour. Conserv. Recycl. 2023, 191, 106899. [Google Scholar] [CrossRef]
- Casazza, M.; Barone, F. Relevance of Environmental Factors in the Steel Life Cycle for a Transition toward Circular Sustainable Production and Consumption Systems: A Joint Bibliometric and Bibliographic Analysis. Metals 2023, 13, 592. [Google Scholar] [CrossRef]
- Andreucci, D.; López, G.G.; Zografos, C.; Conde, M. Political Ecologies of the Green New Deal: Critiques, Contentions and Radical Appropriations. Polit. Geogr. 2025, 117, 103256. [Google Scholar] [CrossRef]
- Agrell, P.J.; Dehaybe, H.; Rodriguez, M.H. Balancing Supply Security and Decarbonization: Optimizing Germany’s LNG Port Infrastructure Under the European Green Deal. Energy Policy 2025, 198, 114484. [Google Scholar] [CrossRef]
- Kiessling, S.; Gohari Darabkhani, H.; Soliman, A.-H. Greater Energy Independence with Sustainable Steel Production. Sustainability 2024, 16, 1174. [Google Scholar] [CrossRef]
- Rosso Neto, L.; Borgert, C.H.; Grillo, F.F.; Zimmermann, M.V.G.; Junca, E. Sustainable steel production: Evaluating the reduction kinetics of iron ore self-reducing briquettes with eucalyptus charcoal. J. Clean. Prod. 2024, 457, 142426. [Google Scholar] [CrossRef]
- Lai, K.-K.; Lin, S.-W.; Lo, H.-W.; Hsiao, C.-Y.; Lai, P.-J. Risk Assessment in Sustainable Production: Utilizing a Hybrid Evaluation Model to Identify the Waste Factors in Steel Plate Manufacturing. Sustainability 2023, 15, 16583. [Google Scholar] [CrossRef]
- Szpak, A.; Ostrowski, S. Fighting Energy Poverty: Barcelona and Warsaw in C40’s Green New Deal Pilot Program. Energy Policy 2025, 198, 114464. [Google Scholar] [CrossRef]
- Gajdzik, B.; Burchart-Korol, D. Eco-Innovation in manufacturing plants illustrated with an example of steel products development. Metalurgija 2011, 50, 63–66. [Google Scholar]
- Grzybowska, K.; Gajdzik, B. Optymisation of equipment setup processes in enterprises. Metalurgija 2012, 51, 555–558. [Google Scholar]
- O’Donovan, C.; Giannetti, C.; Pleydell-Pearce, C. Enabling Sustainable Steel Production with Computer Vision. Adv. Transdiscipl. Eng. 2023, 44, 37–42. [Google Scholar] [CrossRef]
- Gobin, A.; Uljee, I. European Green Deal Strategies for Agriculture in Dynamic Urbanised Landscapes. Land 2025, 14, 424. [Google Scholar] [CrossRef]
- Chisalita, D.-A.; Petrescu, L.; Cobden, P.; van Dijk, H.; Cormos, A.-M.; Cormos, C.-C. Assessing the environmental impact of an integrated steel mill with post-combustion CO2 capture and storage using the LCA methodology. J. Clean. Prod. 2019, 211, 1015–1025. [Google Scholar] [CrossRef]


| Direction | Realization of Decarbonization |
|---|---|
| DRI [32,33,34,35,36,37,38,54,55,56,57,58] | This would be the shift from the traditional processes in a Blast Furnace to DRI processes that use either natural gas or hydrogen as their reducing agents. This is quite a process that involves huge investments in new technologies and equipment, infrastructural development at various levels to build technologies for the production and distribution of hydrogen, dealing with regulatory issues, and finding partnerships for low-carbon hydrogen. This would imply that skill development and training of the workforce in new technologies and practices are intrinsic to successful implementation. A few of the major challenges identified with this pathway are the high initial capital costs, availability and price of renewable hydrogen, and requirements for full-scale risk assessments associated with new technologies. |
| DRI-EAF [32,35,59,60,61] | Promotion of EVs, hydrogen-powered vehicles, and other low-emission transport modes. Investment in Charging Infrastructure and Renewable Fuels. Emission standards for vehicles and incentives on cleaner transportation technologies. Improvement in the energy efficiency of the EAFs through renovation by renewable sources of energy, better energy use, and advanced recycling of steel materials. Application of artificial intelligence and machine learning for operational efficiency and energy consumption during EAF processes. Major bottlenecks are intermittent renewable energy supply, huge investments needed in grid infrastructure, and possible disruptions in supplies of raw materials. Development and scaling of hydrogen-based DRI technologies to replace fossil fuels in iron reduction processes. It involves securing low-cost, sustainable hydrogen supply chains, further improvement in electrolyzes for hydrogen production, and stakeholder relations across industries for a seamless transition. |
| H2-DRI [32,33,34,35,36,37,38,62,63,64] | Research and investment need to be performed to overcome technical hurdles and improve efficiencies in the H2-DRI system. Further, supportive policy frameworks will be matched with government incentives in the nascent phases of hydrogen adoption. The currently very low production capacity of green hydrogen, technological advances in cost, and potential hostility from sectors vested in traditional fossil fuel technologies are some key challenges. |
| CCS/CCUS [65,66,67,68] | Climate Policy to Reduce Industrial Process Emission by CCS (carbon capture and storage) and CCUS (Carbon Capture, Utilization, and Storage). Major infrastructure investments are required for the capture of CO2, development of options for storage, and regulatory compliance. Companies will have to develop economic incentives and public acceptance if CCS/CCUS is to be viable and attract investors. There will certainly be a need to develop an effective monitoring and verification system to track the effectiveness of CCS/CCUS deployments in order to engender trust and confidence. Some of the other challenges include long lead times on project development, the intractability of geological storage solutions, and public skepticism over the safety and efficacy of carbon storage. |
| Smart steel manufacturing [68,69,70,71,72] | On occasions when cleaner methods of production are introduced, energy efficiency and emission intensity measures are applied. Advanced manufacturing technologies would be deployed with investments in digital twins and IoT sensors to optimize production and reduce waste. It is also very critical that measures to reduce the carbon footprint of these digital technologies themselves are put in place. This will involve incorporating renewable energy into the manufacturing operations and setting emission reduction targets for the wider adoption of sustainable supply chain practices. This will encourage a culture of continuous improvement and innovation that, in turn, will make further adoption of new practices and technologies for reduction in emissions within the organizations. Key challenges here come from initial investment costs for smart enabling technologies, skilled labor to manage and maintain these systems, and integration of digital solutions into existing manufacturing processes without disturbance to productivity. |
| Recycling and circular economy [73,74,75] | Improve recycling practices in the steel industry to maximize scrap reutilization, thereby reducing raw material extraction and processing. This will involve developing an efficient collection and sorting system for scraps, investing in advanced technologies for recycling, and deploying full closed-loop systems with minimal generation of waste. The application of the circular economy will support companies in their effort to reduce their carbon footprint and create new business opportunities at the same time. Other major challenges facing the development of recycling activities are the continual quality of recycles, changing market prices for scrap material, and consumer awareness to actively participate in the recycling processes. |
| Sustainable supply chain management [76,77,78] | All along the value chain of the steel supply chain, embed sustainable best practices to reduce the carbon footprint emissions resulting from the extraction processes of raw materials down to transportation and processing. This shall be performed through engaging the suppliers to entice them toward low-carbon practices, optimizing all the logistical involvements with a view to reducing carbon emission levels arising from transportation, and deliberately choosing only those materials with the least negative impacts on the environment. This, in turn, will drive sustainability emphasis in procurement decisions down the value chain for decarbonization. The complexities range from the intricate nature of supply chain networks to lack of transparency or traceability in sourcing materials to increasing costs for more sustainable alternatives. |
| Alternative ironmaking technologies [79,80] | Research into alternative production methods for iron that are not based on carbon-intensive processes. This could include technologies such as molten oxide electrolysis, which replaces carbon with electricity during iron ore reduction. Each of these newer processes requires significant investment in research and development to achieve reduced emissions. Additionally, partnerships with universities and startups create enabling technologies. The major hurdles to be surmounted are the scalability of replacement technologies, the heavy investments required for R&D, and the resistance to changing established operations and habits. |
| Energy and heat efficiency [81,82,83,84,85] | Decarbonizing the steel industry must be closely aligned with energy conservation and efficiency efforts. As an energy-intensive sector, the steel industry is compelled to invest in energy-saving technologies. The increasing demand for energy and its rising cost is a major challenge for the steel industry. To overcome them, the large amounts of coke oven gas, Blast Furnace gas, and converter gas generated in steel production can be captured and used for efficient energy production. |
| Resources efficiency and ULCOS [86,87] | Steel production, as a functional element, requires innovative and sustainable solutions. Implementation of an operating permit that not only results in the impact of this machine on the environment but also its competitiveness when using ecological modifications, such as maximizing steel recycling, reducing water consumption in production processes and improving its quality after use, minimizing the amount of waste and effective management of by-products, increasing the share of renewable energy sources in energy sources as an alternative to fossil fuels and implementation of breakthrough technologies—technologies such as ULCOS (Ultra-Low-Carbon Steelmaking) are key to dramatically reducing emissions. |
| Energy transition [88,89,90,91,92] | Transitioning the use of renewable feedstock in steel manufacturing processes instead of consuming fossil fuel is possible. This would involve using wind, solar, and biomass sources to generate energy in production. Companies have to understand their pattern of energy consumption and identify areas where the renewable share of energy can be increased. Long-term PPA with renewable energy suppliers would be a strategic tool for assuring their stable supply. Some major challenges involve the initial capital investment in renewable energy infrastructure, dependence on meteorological phenomena for its generation of energy, and grid stability in the transition process. |
| Digital transformation [93,94,95,96,97,98] | Big data analytics, artificial intelligence, and machine learning might be other facets of digitalization that further optimize areas such as production processes, thereby reducing energy consumption and increasing efficiency. Regarding emissions, a decrease is foreseen from the application of digital tools in decision-making and resource management, among others. Some other important challenges are the assurance of skilled personnel to implement and manage the technology, data security and privacy, and disruption of traditional methods once new technologies are integrated. |
| Year | Investment Total PLN Million | Investment BOF PLN Million | CO2 Emissions Total Million Tons | CO2 Emissions BOF Million Tons | Coke Consumption BOF Thousand Tons | Energy Intensity BF-BOF GWh |
|---|---|---|---|---|---|---|
| 2005 | 1619 * | 809.5 | 12 | 10.4 | 2055.8 | 423.4424 |
| 2006 | 3130 | 1716.1 | 12 | 10.7 | 2549.5 | 685.2082 |
| 2007 | 5152 | 2828.2 | 11 | 9.5 | 3056.8 | 682.9585 |
| 2008 | 7146 | 3924.9 | 8 | 7.4 | 2520.9 | 563.7123 |
| 2009 | 8840 | 4856.6 | 5 | 4.5 | 1561.2 | 441.5064 |
| 2010 | 9324 | 5098.6 | 7 | 6.5 | 1824.7 | 546.683 |
| 2011 | 10,023 | 5448.1 | 8 | 7.3 | 1878 | 628.7919 |
| 2012 | 10,625 | 5749.1 | 8 | 7.4 | 1732.7 | 613.3564 |
| 2013 | 11,200 | 6036.6 | 8 | 7.4 | 1897.8 | 585.9563 |
| 2014 | 11,750 | 6311.6 | 9 | 7.6 | 2539.9 | 649.4591 |
| 2015 | 12,400 | 6636.6 | 7 | 6.2 | 2279.9 | 672.1254 |
| 2016 | 13,230 | 7051.6 | 7 | 5.9 | 2192.6 | 655.5415 |
| 2017 | 13,760 | 7316.6 | 7 | 6.4 | 2190.7 | 692.7339 |
| 2018 | 14,630 | 7751.6 | 7 | 6.0 | 2236.3 | 659.8022 |
| 2019 | 15,426 | 8237.6 | 6 | 5.5 | 2066.4 | 671.1065 |
| 2020 | 15,846 | 8412.6 | 5 | 4.4 | 1637.5 | 518.0972 |
| 2021 | 16,402 | 8780.6 | 6 | 4.8 | 1738.6 | 546.1651 |
| No. | Econometric Model | Components | R2 |
|---|---|---|---|
| 1. | Y—CO2 emissions (data for Polish steel industry) [million tons] X1—investment expenditure cumulatively (data for Polish steel industry) [PLN million] | R2 = 69.8 | |
| 2. | Y—CO2 emissions from BF-BOF process (data for Polish steel industry) [million tons] X1—investment expenditure on BF-BOF cumulatively (data for Polish steel industry) [PLN million] | R2 = 73.2 | |
| 3. | Y—CO2 emissions from BF-BOF (data for Polish steel industry) [million tons] X1—investment expenditure on BF-BOF cumulatively (data for Polish steel industry) [PLN million] X2—consumption of coke in BF-BOF (data for Polish steel industry) [thousand tons] | R2 = 81.1 | |
| 4. | Y—CO2 emissions from BF-BOF (data for Polish steel industry) [million tons] X1—investment expenditure on BF-BOF cumulatively (data for Polish steel industry) [PLN million] X2—electricity consumption in BF-BOF [GWh] | R2 = 86.0 |
| Year | CO2 Emissions (Mt) | BOF Investments (M PLN) | Crude Steel Production (kt) |
|---|---|---|---|
| 2005 | 11.62 | 264.0 | 8444.0 |
| 2006 | 12.00 | 906.6 | 9992.0 |
| 2007 | 10.60 | 1112.1 | 10,632.0 |
| 2008 | 8.20 | 1096.7 | 9728.0 |
| 2009 | 5.00 | 931.7 | 7129.0 |
| 2010 | 7.20 | 242.0 | 7993.0 |
| 2011 | 8.18 | 349.5 | 8779.0 |
| 2012 | 8.23 | 301.0 | 8358.0 |
| 2013 | 8.48 | 287.5 | 7950.0 |
| 2014 | 8.60 | 275.0 | 8540.0 |
| 2015 | 7.00 | 325.0 | 9198.0 |
| 2016 | 6.70 | 415.0 | 9001.0 |
| 2017 | 7.30 | 265.0 | 10,330.0 |
| 2018 | 6.80 | 435.0 | 10,157.0 |
| 2019 | 6.30 | 486.0 | 8996.0 |
| 2020 | 5.00 | 175.0 | 7856.0 |
| 2021 | 5.50 | 368.0 | 8552.0 |
Disclaimer/Publisher’s Note: The statements, opinions and data contained in all publications are solely those of the individual author(s) and contributor(s) and not of MDPI and/or the editor(s). MDPI and/or the editor(s) disclaim responsibility for any injury to people or property resulting from any ideas, methods, instructions or products referred to in the content. |
© 2025 by the authors. Licensee MDPI, Basel, Switzerland. This article is an open access article distributed under the terms and conditions of the Creative Commons Attribution (CC BY) license (https://creativecommons.org/licenses/by/4.0/).
Share and Cite
Gajdzik, B.; Wolniak, R.; Grebski, W. An Econometric Analysis of CO2 Emission Intensity in Poland’s Blast Furnace–Basic Oxygen Furnace Steelmaking Process. Sustainability 2025, 17, 4045. https://doi.org/10.3390/su17094045
Gajdzik B, Wolniak R, Grebski W. An Econometric Analysis of CO2 Emission Intensity in Poland’s Blast Furnace–Basic Oxygen Furnace Steelmaking Process. Sustainability. 2025; 17(9):4045. https://doi.org/10.3390/su17094045
Chicago/Turabian StyleGajdzik, Bożena, Radosław Wolniak, and Wiesław Grebski. 2025. "An Econometric Analysis of CO2 Emission Intensity in Poland’s Blast Furnace–Basic Oxygen Furnace Steelmaking Process" Sustainability 17, no. 9: 4045. https://doi.org/10.3390/su17094045
APA StyleGajdzik, B., Wolniak, R., & Grebski, W. (2025). An Econometric Analysis of CO2 Emission Intensity in Poland’s Blast Furnace–Basic Oxygen Furnace Steelmaking Process. Sustainability, 17(9), 4045. https://doi.org/10.3390/su17094045