Article

A Triple Helix Approach to a Greener Future: Environmental Law, Fintech, Institutional Quality, and Natural Resources as Pillars of Environmental Sustainability in G20

1
School of Law, Tianjin Normal University, Tianjin 300387, China
2
National Institute of Environment and Social Studies, Karachi 71500, Pakistan
*
Author to whom correspondence should be addressed.
Sustainability 2025, 17(9), 4043; https://doi.org/10.3390/su17094043
Submission received: 25 February 2025 / Revised: 12 April 2025 / Accepted: 25 April 2025 / Published: 30 April 2025

Abstract

:
Achieving environmental sustainability in the G20 requires aligning economic growth with effective policy interventions. This study examines the role of financial technology (FNT), environmental legislation (ENL), and institutional quality (INQ) in reducing the ecological footprint (EF), while also assessing the adverse impacts of natural resource extractions (NRS) and economic expansion. Using CS-ARDL on panel data from 2000 to 2022, the study confirms cross-sectional interdependence and long-term cointegration through CIPS, CADF, and Westerlund tests. The findings reveal that FNT, ENL, and INQ significantly mitigate EF, whereas NRS and economic growth exacerbate it. Robustness is validated through the AMG and CCEMG methods, with ANN models reinforcing the results. The Dumitrescu–Hurlin test establishes a bidirectional link between NRS, economic growth, and EF, while FNT, ENL, and INQ exert a unidirectional influence on sustainability. These insights underscore the need for stronger regulatory frameworks, green fintech integration, and governance reforms to drive sustainable economic transitions in G20 economies.

1. Introduction

The most urgent challenges confronting the world now are environmental degradation (ED) and ecological shifts. Hence, it is imperative for both developing and developed countries to advocate for sustainable development (SD) policies [1,2]. Human activities, including deforestation, air pollution, overfishing, and extraction of natural resources (NRS), have had a detrimental impact on the global ecosystem [3]. The outcome was a persistent trend of increasingly rapid ED and a substantial scarcity of NRS. These changes are intricately interconnected and will provide significant challenges in the upcoming decades [4]. To avert the direst circumstances, there was a plea for international measures. An example of a worldwide initiative is the introduction of the Sustainable Development Goals (SDGs), specifically, SDG-7, SDG-12, and SDG-13 [5]. SDG 7 focuses on expanding access to clean and affordable energy while promoting renewable sources and energy efficiency. SDG 12 emphasizes sustainable consumption and production by reducing waste, improving resource efficiency, and encouraging responsible business practices. SDG 13 calls for urgent action to combat climate change through policy integration, resilience-building, and international cooperation [6]. These goals are central to our study, as they align with the role of fintech, environmental regulations, and institutional quality in fostering sustainability within the G20. These goals, which must be achieved by the end of 2030, serve as a global call for action and aim to allocate resources towards the attainment of sustainable SD. Moreover, despite increased awareness of climate change mitigation, the global ecosystem’s degradation remains inadequately addressed [7]. Current estimates indicate that almost 98% of the global population is subjected to environmental pollution due to depletion of biodiversity [8]. The depletion of biodiversity is a direct result of overfishing, over harvesting of forests, and the excessive release of carbon dioxide into the atmosphere, beyond the capacity of nature to absorb and regenerate these resources.
The G20 member countries include Argentina, Australia, Brazil, Canada, China, France, Germany, India, Indonesia, Italy, Japan, Mexico, Russia, Saudi Arabia, South Africa, South Korea, Turkey, the United Kingdom, the United States, and the European Union. These countries play a crucial role in driving global development and growth, as they control over 85% of the worldwide economic development (ECD) and rule 65% of the global population [9,10]. Without a doubt, these benefits are significant. However, it is important to note that the bloc also accounts for over 75% of the world’s ecological footprint (EF). Although the G20 countries have different paths of growth, their collective influence and power make them largely responsible for most of the world’s current environmental issues. EF Per capita consumption measures the average amount of resources consumed by everyone in a country. Generally, industrialized nations exhibit higher per capita consumption rates because of elevated living standards and improved access to resources. Australia, Canada, and Germany are examples of countries that have relatively high per capita consumption. In contrast, developing nations such as China, India, and Mexico have lower per capita consumption, which can be attributed to limited resource availability, and distinct spending patterns.
The ecological footprint (EF) reflects the balance between renewable resource availability and human consumption patterns. Over the past decades, resource accessibility has rapidly declined, with developed nations generally experiencing ecological deficits, meaning they consume more resources and generate more waste than their ecosystems can sustain. Countries like Italy, Japan, and Australia are projected to see significant increases in their EF deficits by 2050 compared to 2018 levels [11,12]. Conversely, developing nations such as Indonesia, India, and Turkey are expected to maintain positive EF balances, indicating more sustainable resource utilization. However, the rapid economic growth in China, India, and Indonesia—driven by industrial expansion and rising consumer purchasing power—is expected to accelerate consumption rates by 97%, 76%, and 61%, respectively [13]. This trend underscores the resource-intensive nature of economic development. In contrast, Germany and France are anticipated to experience declines in overall consumption but continue to face ecological deficits due to their high resource demands [14]. Meanwhile, countries like Brazil, China, and Indonesia display mixed projections regarding biocapacity, reflecting the diverse effects of development policies on ecological sustainability [
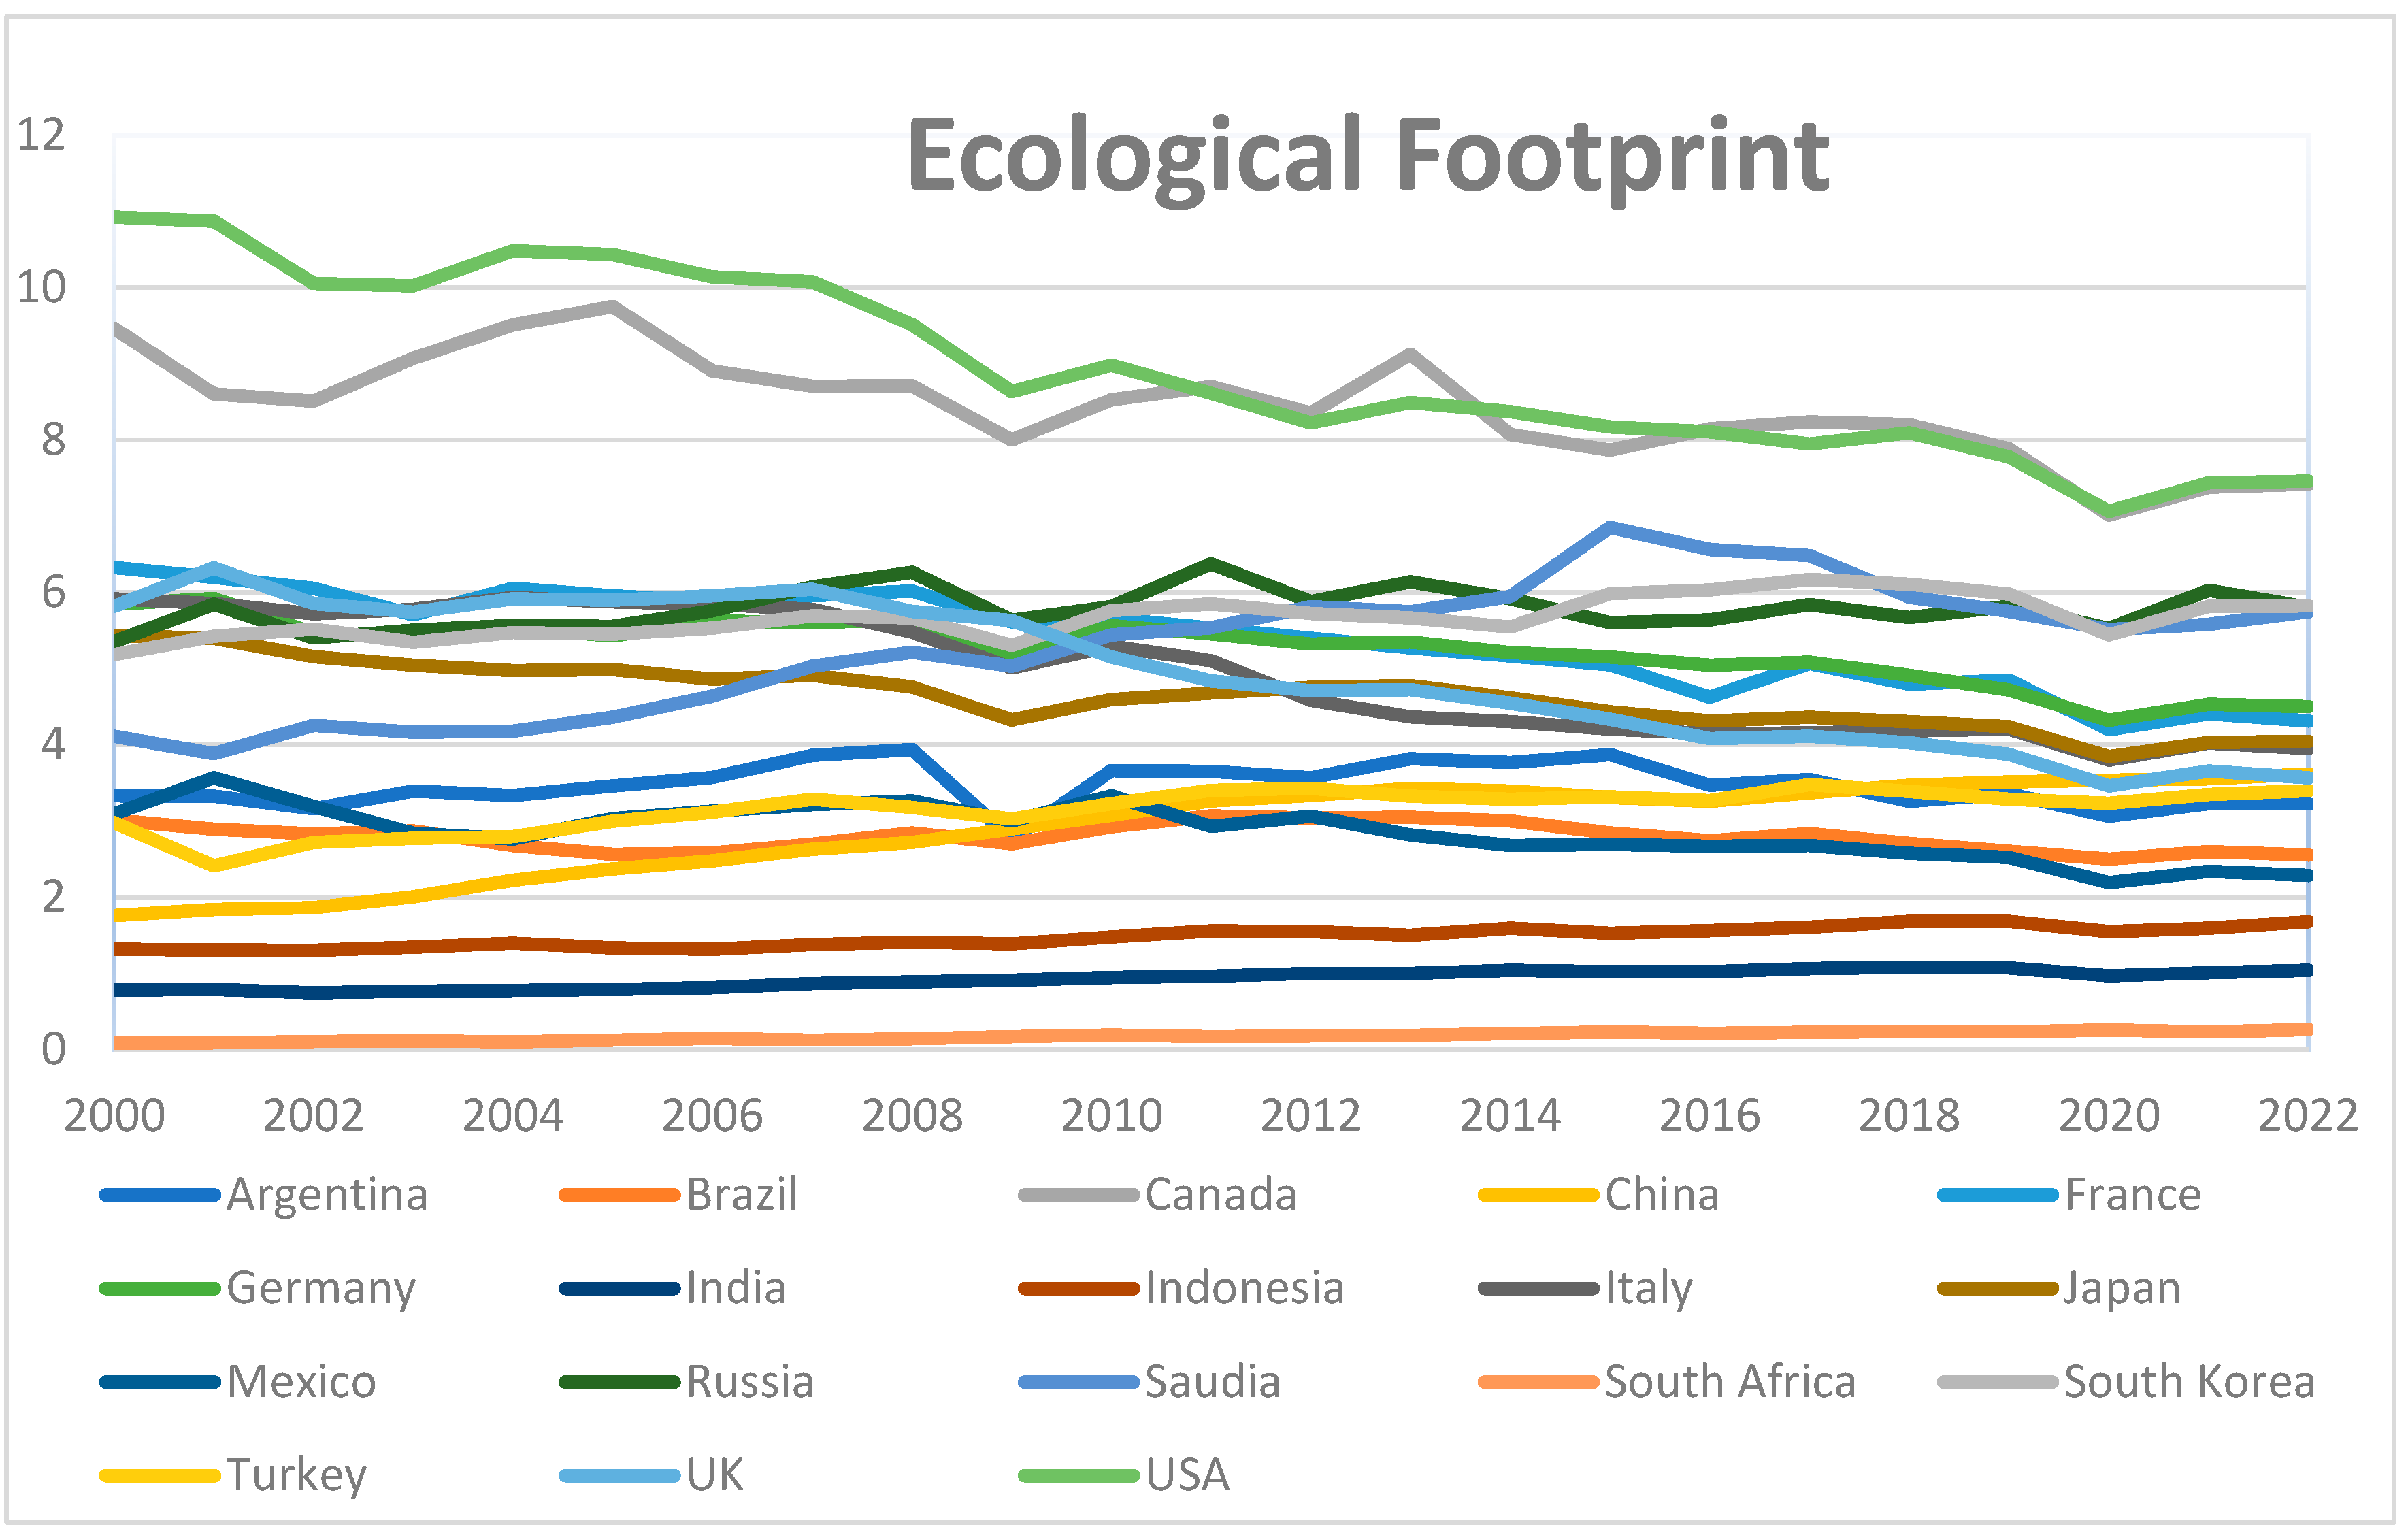
15]. Given these disparities, examining EF trends within G20 nations alongside key economic variables is essential. The ecological footprint (EF) trends for G20 countries, as shown in Figure 1, reveal significant variations in environmental impact. Notably, Canada and the United States consistently display the highest EF values, indicating greater per capita resource consumption and environmental strain. In contrast, countries like India and Indonesia exhibit lower EF values, suggesting relatively lower resource use and environmental pressure. To enhance clarity, the figure highlights the persistent gap between high and low EF nations, emphasizing the disparities in ecological sustainability. These variations underscore the necessity for differentiated environmental policies and targeted sustainability strategies tailored to each country’s economic and environmental context.
The primary aim of the United Nations’ SDG-12 is to address the ED caused by population and ECD and promote a shift towards a more environmentally friendly and socially inclusive global ECD [16,17]. Nevertheless, the progress in minimizing our ecological impact may be hindered, as all nations tend to prioritize economic expansion over enacting measures to mitigate the effects [18]. As a result of policies that prioritize ECD and the emergence of more affordable and efficient energy sources, there has been a significant increase in the demand for NRS and their subsequent processing during the previous century. This has led to a significant expansion of our EF [19,20]. On certain occasions, this has resulted in significant damage to humans [21]. Since 1961, the global EF of humans has increased twofold, and now, we deplete renewable resources at a rate of 20 to 50% faster than the world can replenish them [22]. On a global scale, no country has successfully achieved sustainable resource utilization; in fact, we are increasingly deviating from sustainable principles [23,24]. The primary objective of the EF is to measure the utilization of NRS and the degree to which nature can replace this utilization [25]. In addition, a significant scarcity of NRS plays a significant role in causing ecological strain due to the requirements of water, energy and infrastructural systems [26]. The literature extensively explores the economic consequences of natural resource exploitation and depletion. In this context, the ecological footprint (EF) has proven to be a reliable indicator of the environmental pressure caused by human resource consumption [27]. The original concept of EF assesses the biologically productive land required to sustain a given population, while it also measures the ecological assets necessary to produce environmental resources. It is vital to prioritize the G-20 as a focal point for EF research on ecological viability due to multiple factors. 
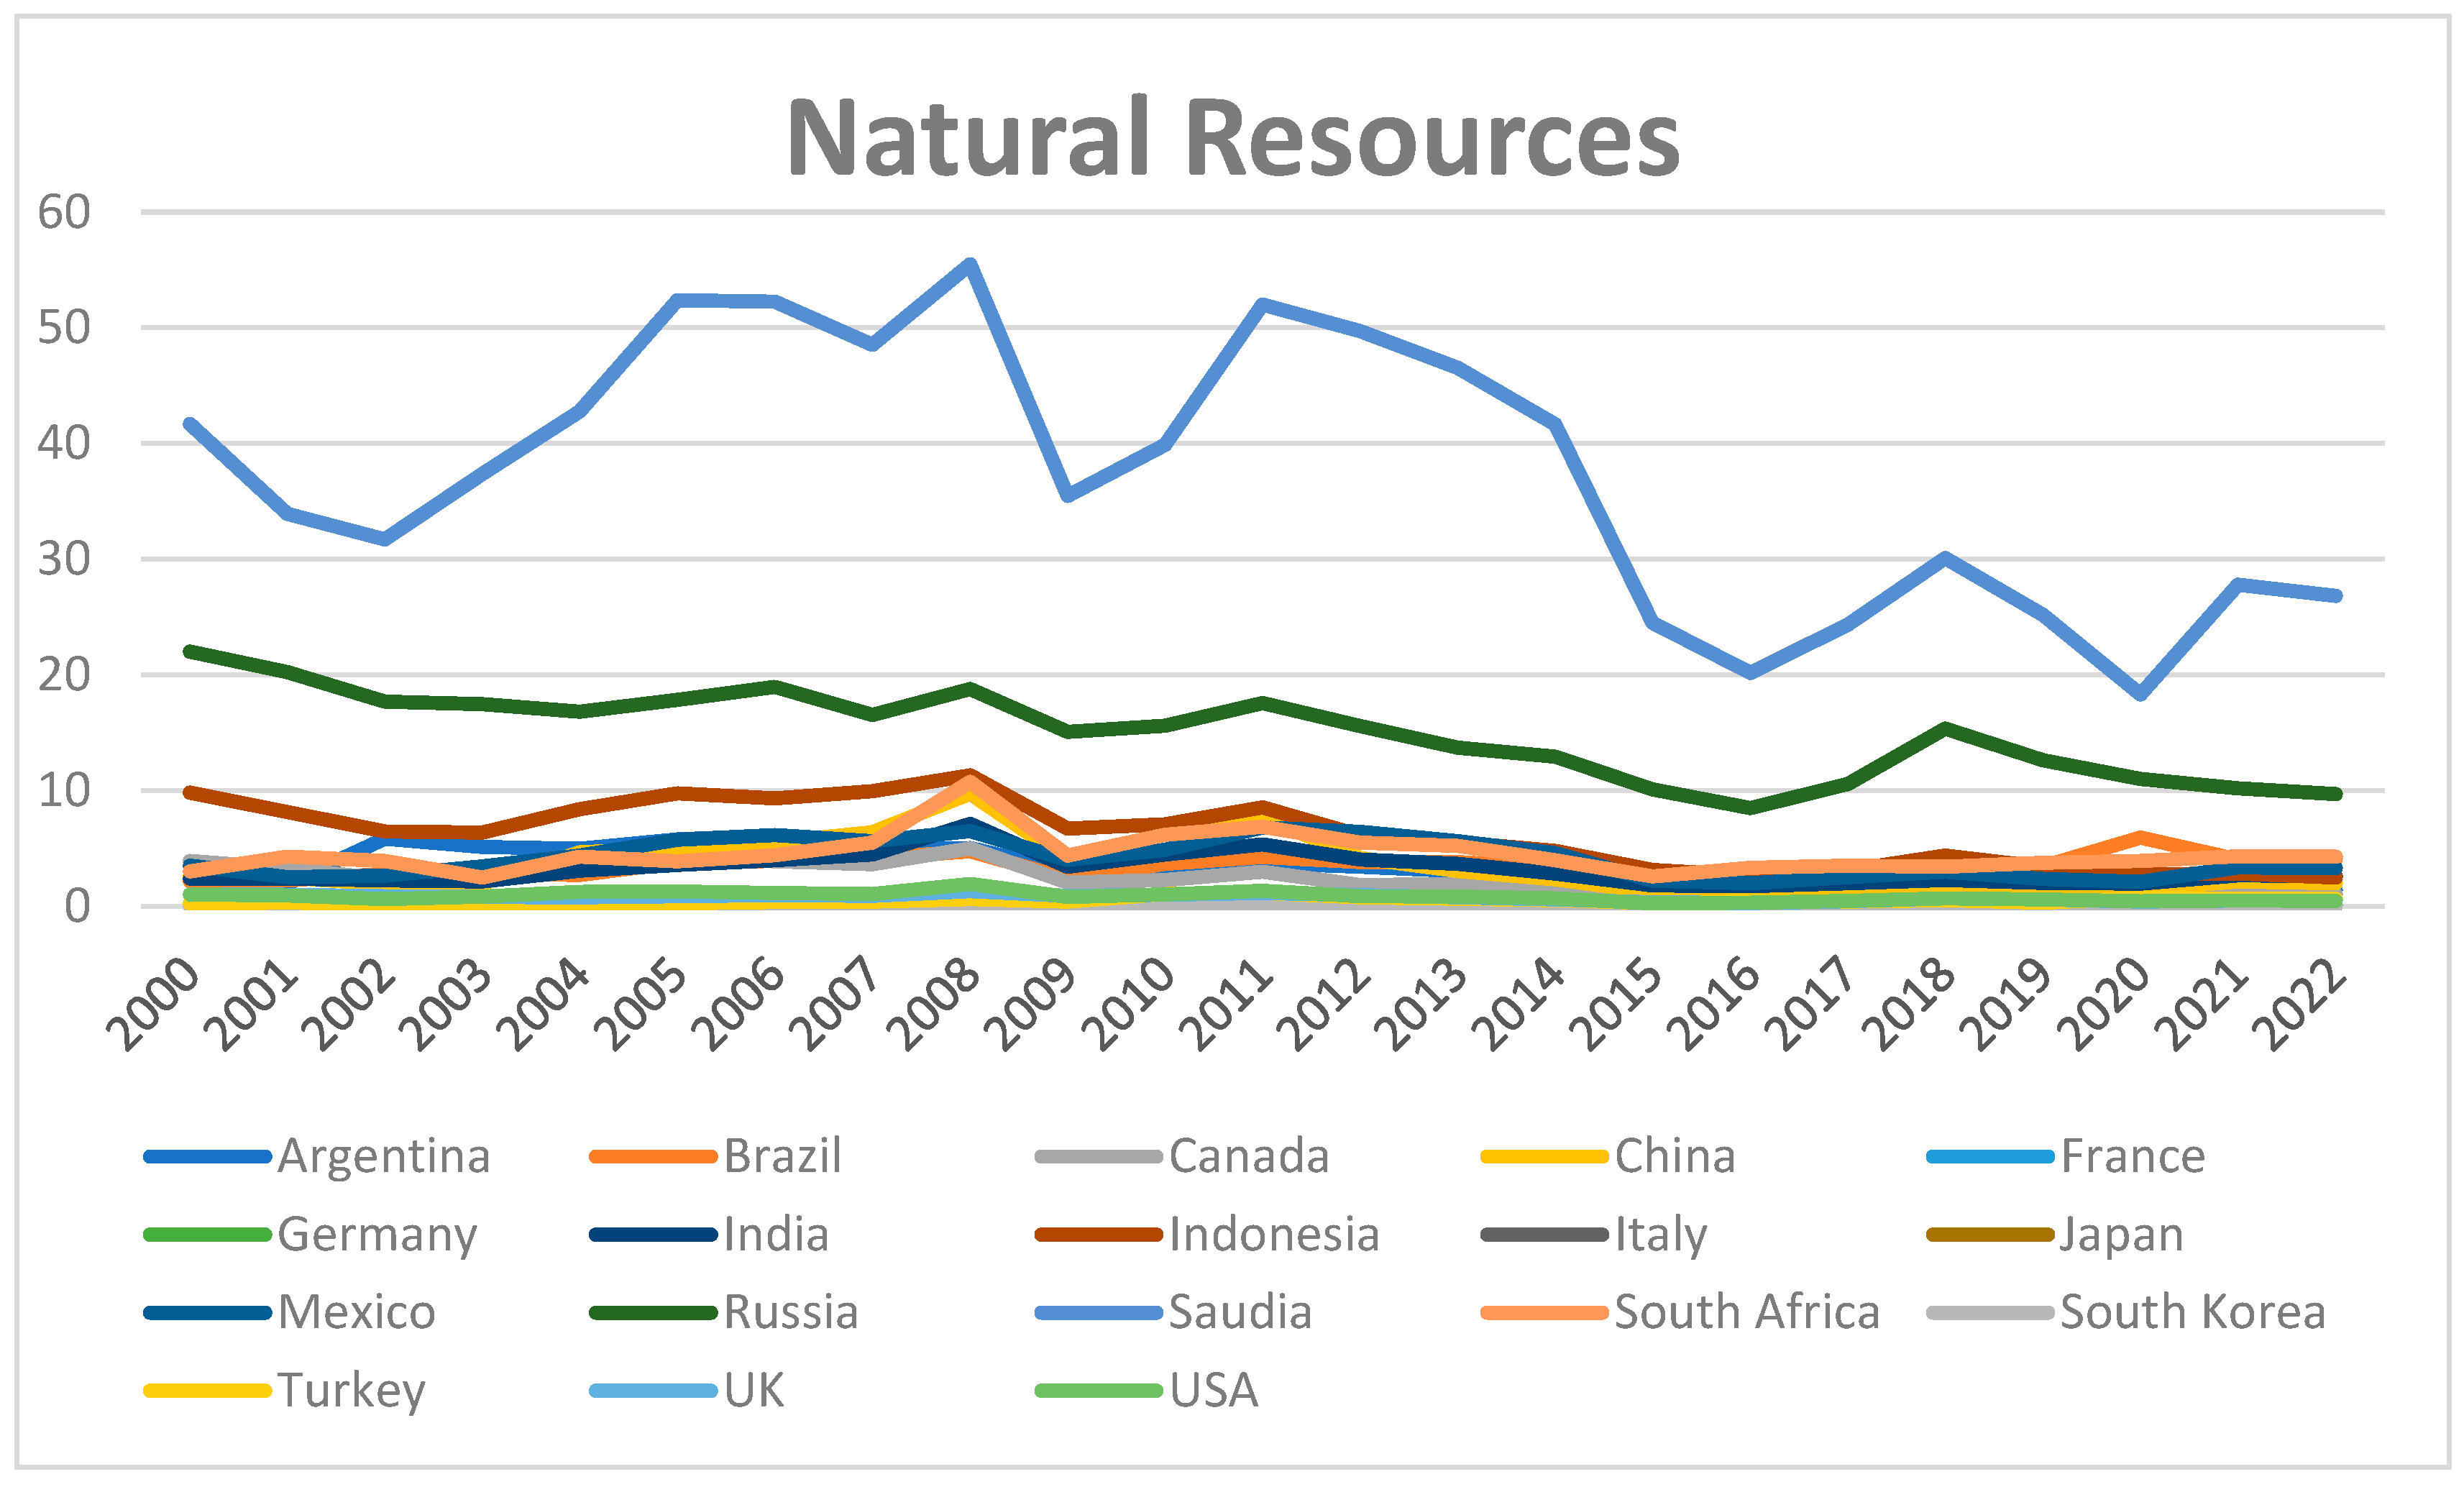
Figure 2 illustrates the trends in NRS utilization across G20 countries from 2000 to 2022. Saudi Arabia exhibits the highest NRS consumption, particularly peaking between 2005 and 2013. The United States and Russia also demonstrate relatively high yet stable consumption patterns, whereas China and India show a gradual increase in resource utilization over time. Conversely, European nations such as Germany, France, and the UK maintain consistently lower levels of NRS consumption. These trends reflect varying resource dependencies across economies, shaping their sustainability challenges and policy needs.
There has been a significant and swift rise in ecological breakdowns, affecting all economies globally. This means that every country is vulnerable to the consequences of climate change [28,29]. During serious environmental problems, the financial markets and institutions have undergone significant changes due to the emergence of new financial technology developments [30]. However, fintech (FNT) refers to technology-based advancements and is based on the principles of Industry 4.0 and promotes the adoption of circular economy practices [31,32]. Therefore, it offers the potential to foster ECD while ensuring SD [33]. Moreover, FNT instruments reduces the expenses associated with standardized financial processes and the imbalance of information while effectively using less resources and encouraging sustainable methods of financing [34]. As a result, FNT is strategically environmentally friendly and essential for promoting SD and optimizing resource allocation. Moreover, worldwide, the revenues generated from the use of FNT have increased twofold since 2017. According to the facts, the entire value of FNT improvements is projected to reach USD 179 billion by 2022. Additionally, it is estimated that 30,000 entrepreneurs will benefit from these enhancements. FNT developments ultimately discourage reliance on NRS and traditional energy sources by promoting the adoption of green energy and sophisticated green technologies [35,36]. According to a recent assessment by [37], FNT promotes green digital trading and green innovations by reducing the financial risks connected with them. This ultimately contributes to the development of low-carbon economies. Moreover, FNT enhances the process of creating capital and attracting investments in industries that are abundant in resources and have a high carbon footprint, resulting in increased energy consumption and carbon emissions [38,39]. Similarly, the enhanced FNT-related apps consume significant resources, require electricity, and produce electronic trash, hence contributing to the depletion of resources and environmental footprint [
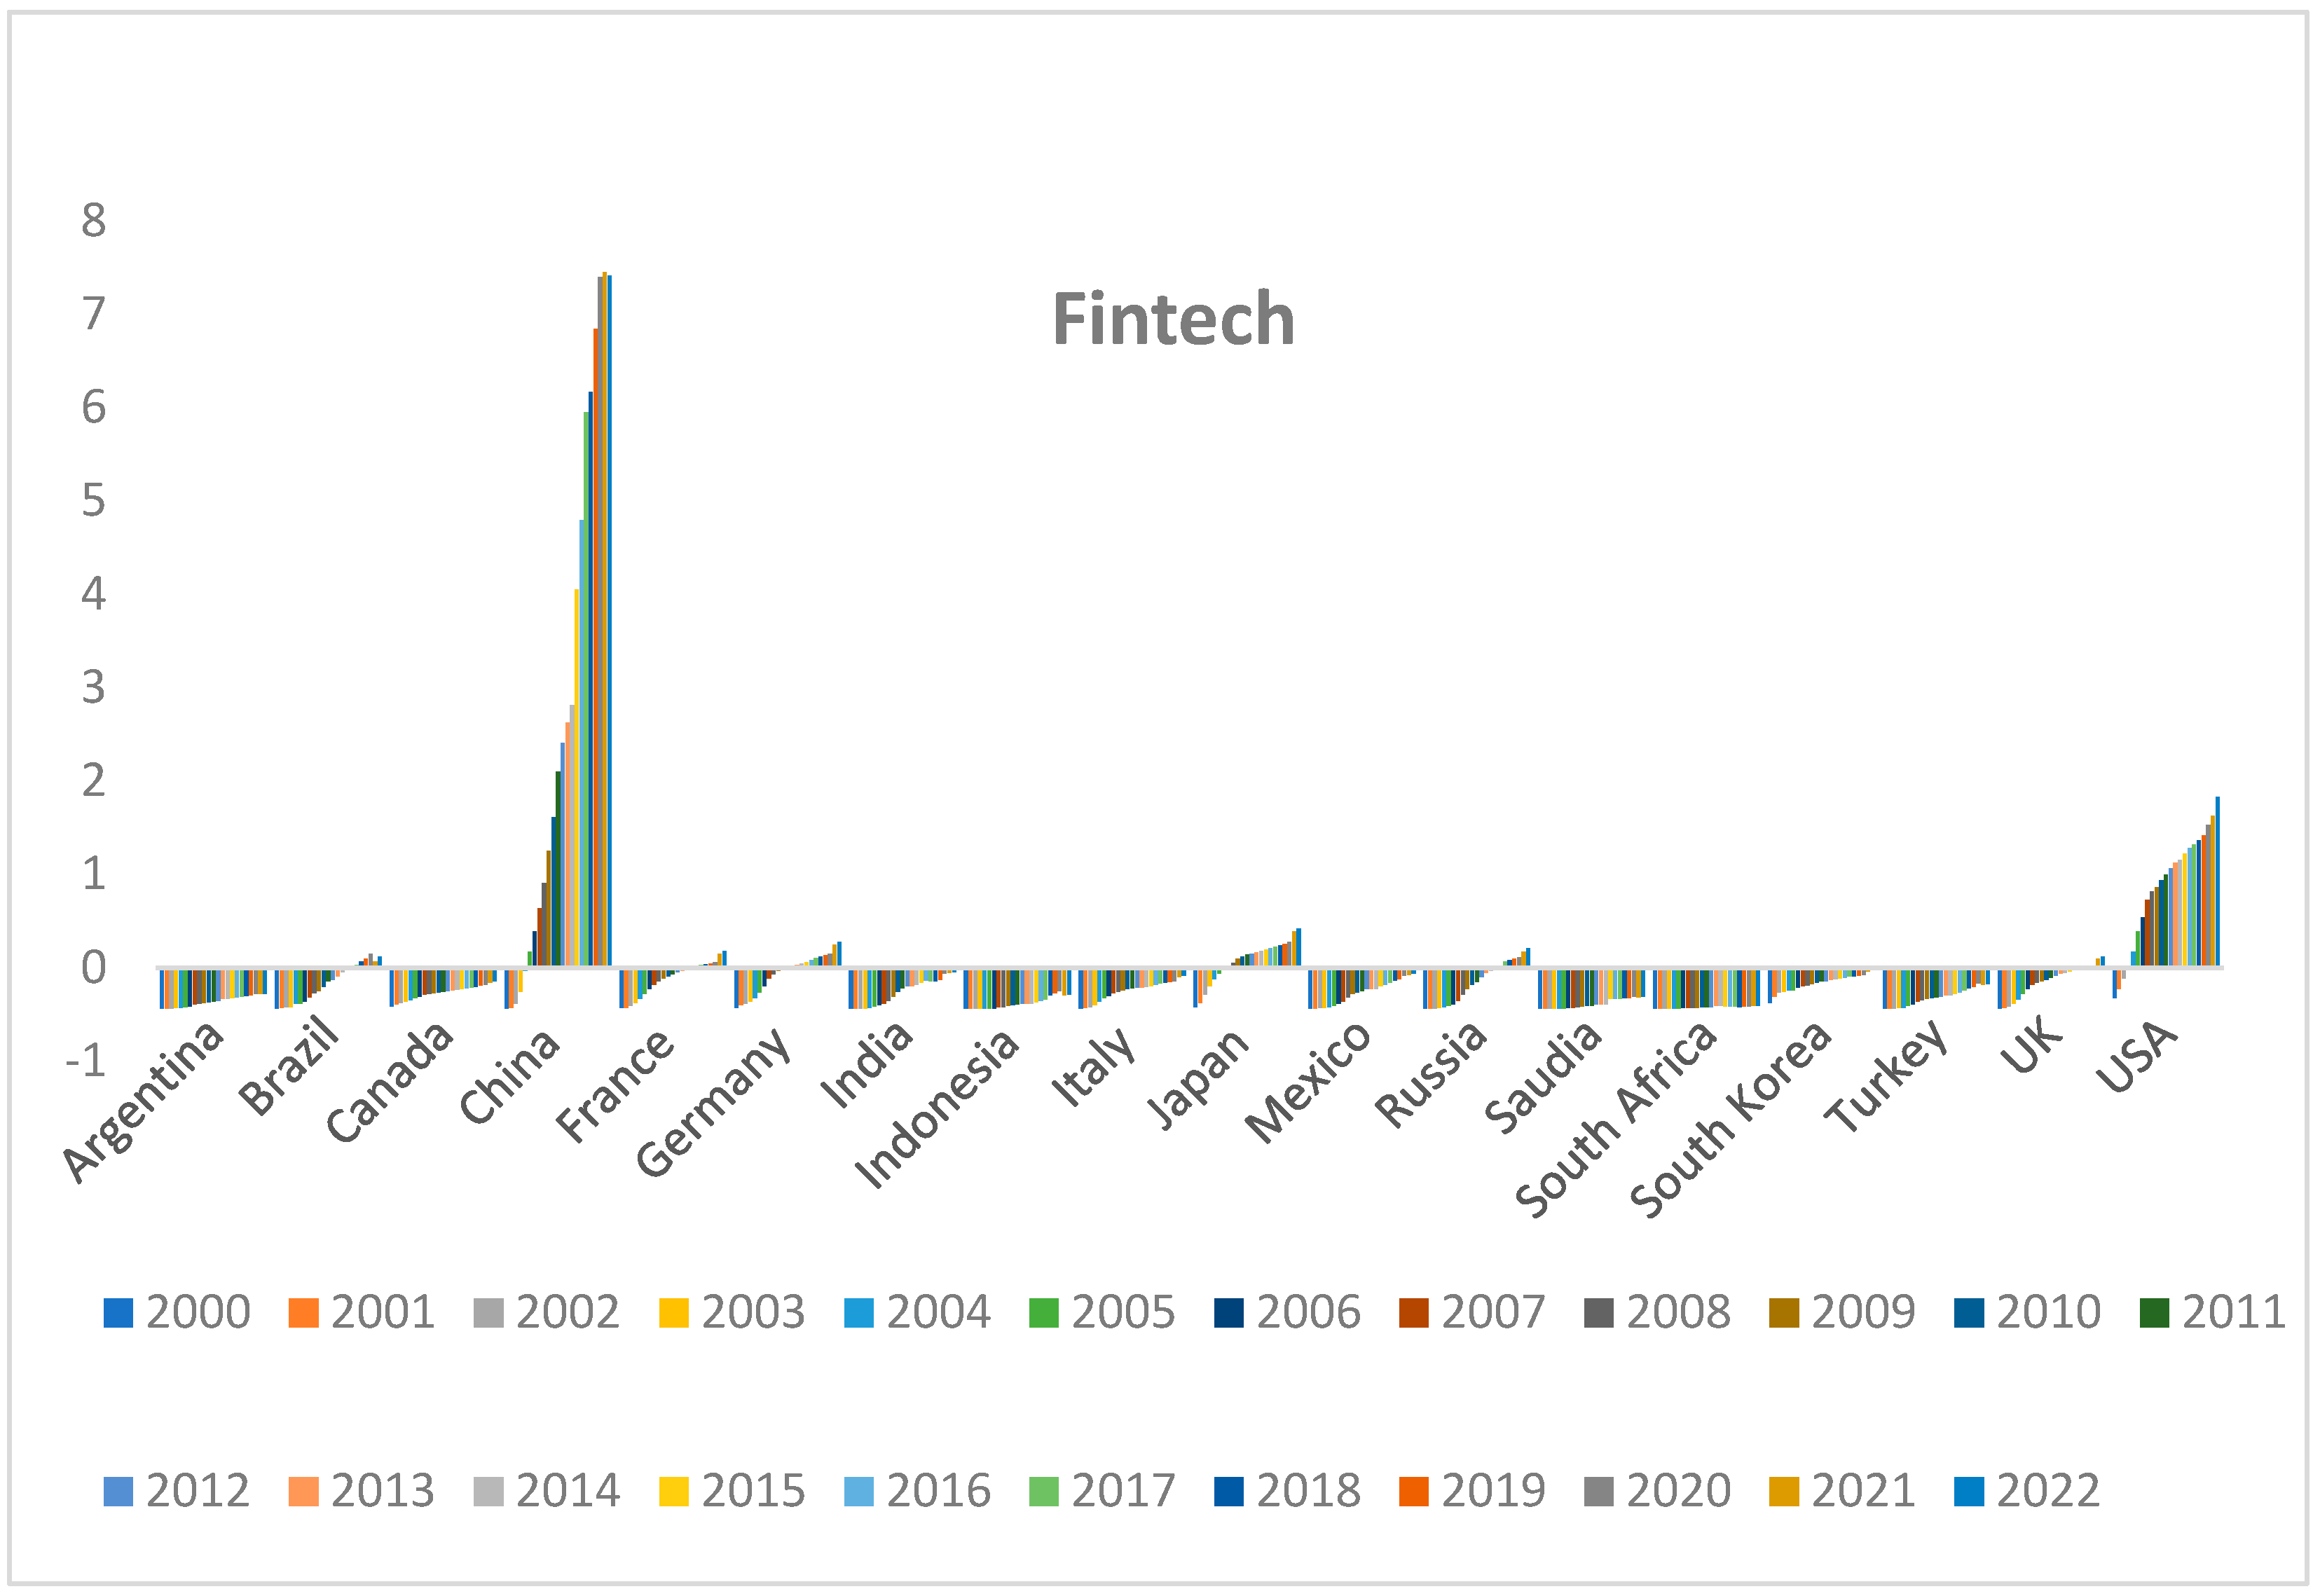
40]. In continuation of this information, Figure 3 indicates the FNT trends in G20. From 2000 to 2022, the FNT indices for the G20 countries reveal several trends. China shows a remarkable and consistent rise, peaking at 7.412 in 2022. Similarly, the USA demonstrates a steady upward trend, reaching 1.826 in 2022. Conversely, most other countries, including Argentina, Germany, and South Africa, display negative values, suggesting less significant growth in their FNT sectors. These data indicate substantial FNT advancement in China and the USA, contrasting with slower or negative growth in many other G20 nations.
Furthermore, it is imperative for the government to develop and implement comprehensive environmental regulatory frameworks that promote the use of sustainable energy and hinder the excessive use of resources and development of waste. Ecological regulations can be designed to achieve various advantages. For example, strict environmental policies can help improve energy efficiency, reduce the use of fossil fuels, encourage the production of renewable energy (RE), and mitigate the anticipated negative environmental effects of ECD [41]. Nevertheless, permissive environmental law (ENL) and inadequate institutional framework allow for influx of foreign direct investment into outdated technology [28]. The statement suggests that ENL lacks the necessary capacity to fully benefit from the positive environmental effects. This happens because environmental regulations are not strictly enforced, allowing industries to keep using old, polluting technologies. As a result, the benefits of environmental laws—like reducing pollution, saving resources, and supporting sustainability—are weakened, making them less effective in protecting the environment. Consequently, several studies have confirmed that ENL plays a negligible role in reducing the EF [42]. Furthermore, ecological governance rules are formulated with a long-term perspective, requiring enterprises to adapt their operations based on the impact of marginal taxes [43]. Thus, it is crucial to reassess the function of ENL in reducing EF. Research indicates that the G20 nations are prioritizing the regulation of ED through the implementation of effective ENL. These laws are seen as crucial tools for enhancing the overall SD of G20 countries. According to ENL [44], nations such as France and Germany, who have high stringency ratings and are seeing rising trends, should continue to improve their regulatory systems. On the other hand, countries like Russia and South Africa, who have lower or inconsistent ENL scores, would benefit from implementing stronger policies and utilizing international collaborations to strengthen their ENL frameworks. It is imperative for these emerging nations to implement policies that promote SD and a transition towards environmentally friendly economies. A more detailed view can be seen from Figure 4, where ENL trends in G20 have been shown. Notably, Brazil and China exhibit a substantial increase in scores, with Brazil peaking in 2007 and China showing steady growth. On the other hand, countries like Argentina and Saudi Arabia have more fluctuating patterns, with notable highs and lows throughout the period. Most of the G20 countries, including the USA, UK, and Germany, display a general upward trend, reflecting enhanced environmental regulations and enforcement over the years.
The preceding discourse promotes additional empirical inquiries and the development of more accurate remedies through further scientific investigation to aid diverse policymakers. Undoubtedly, institutional studies emphasize the urgency of addressing sustainable development (SD) as a critical concern for communities and governments, necessitating the implementation of related policies and actions [45]. Hence, the main objective of this study is to investigate the impact of institutional quality (INQ), fintech (FNT) and environmental law (ENL) on ecological sustainability and economic competitiveness in the G20 nations by examining three current inquiries: What is the immediate influence of fintech and natural resources on the ecological footprint? Can FNT and NRS efficiently regulate the relationship between important socioeconomic variables and the EF? Furthermore, can environmental regulations adequately address the unforeseen external disruptions that have impacted the global ECD and therefore affected environmental conditions? Responding to these inquiries will assist us in providing accurate assessments and identifying domains where policy conflicts arise within the recipient panel.
Moreover, this research is crucial due to the urgent necessity to tackle the deteriorating ecological crisis resulting from pollution and our reliance on conventional energy sources and NRS. Hence, numerous nations, including those in the G-20, endorse the necessity of SD and carbon neutrality as delineated in the SDGs [
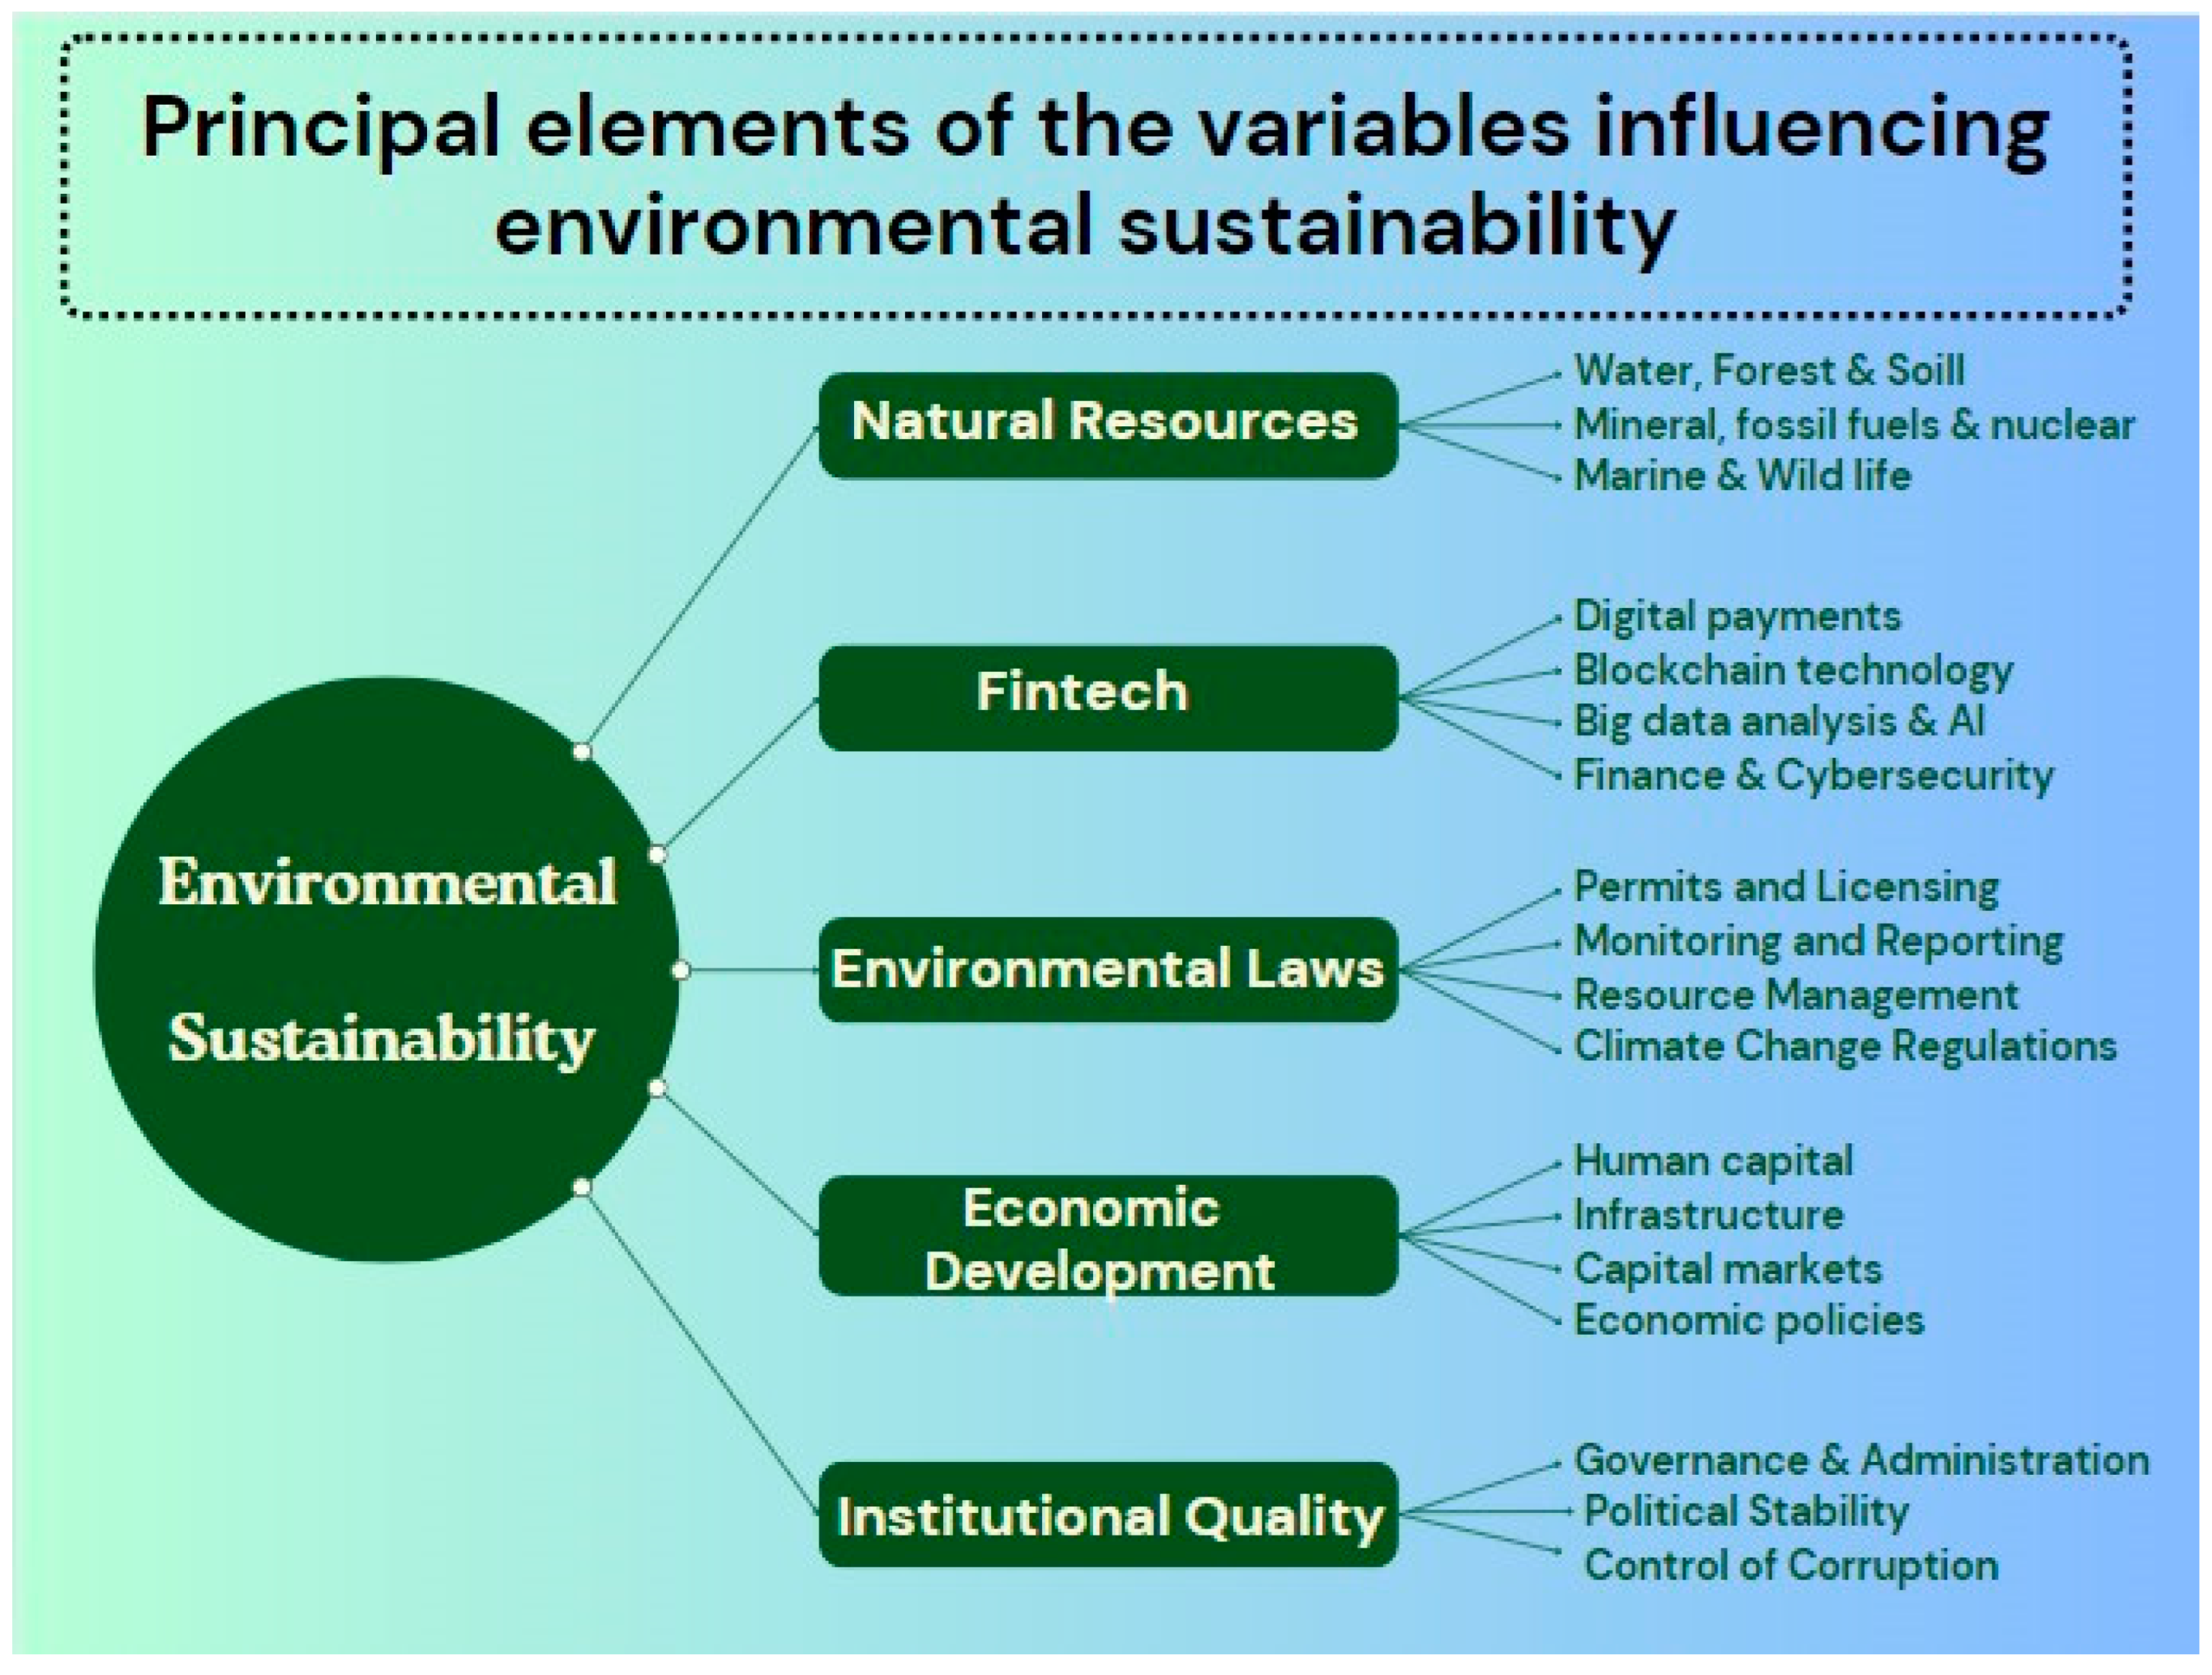
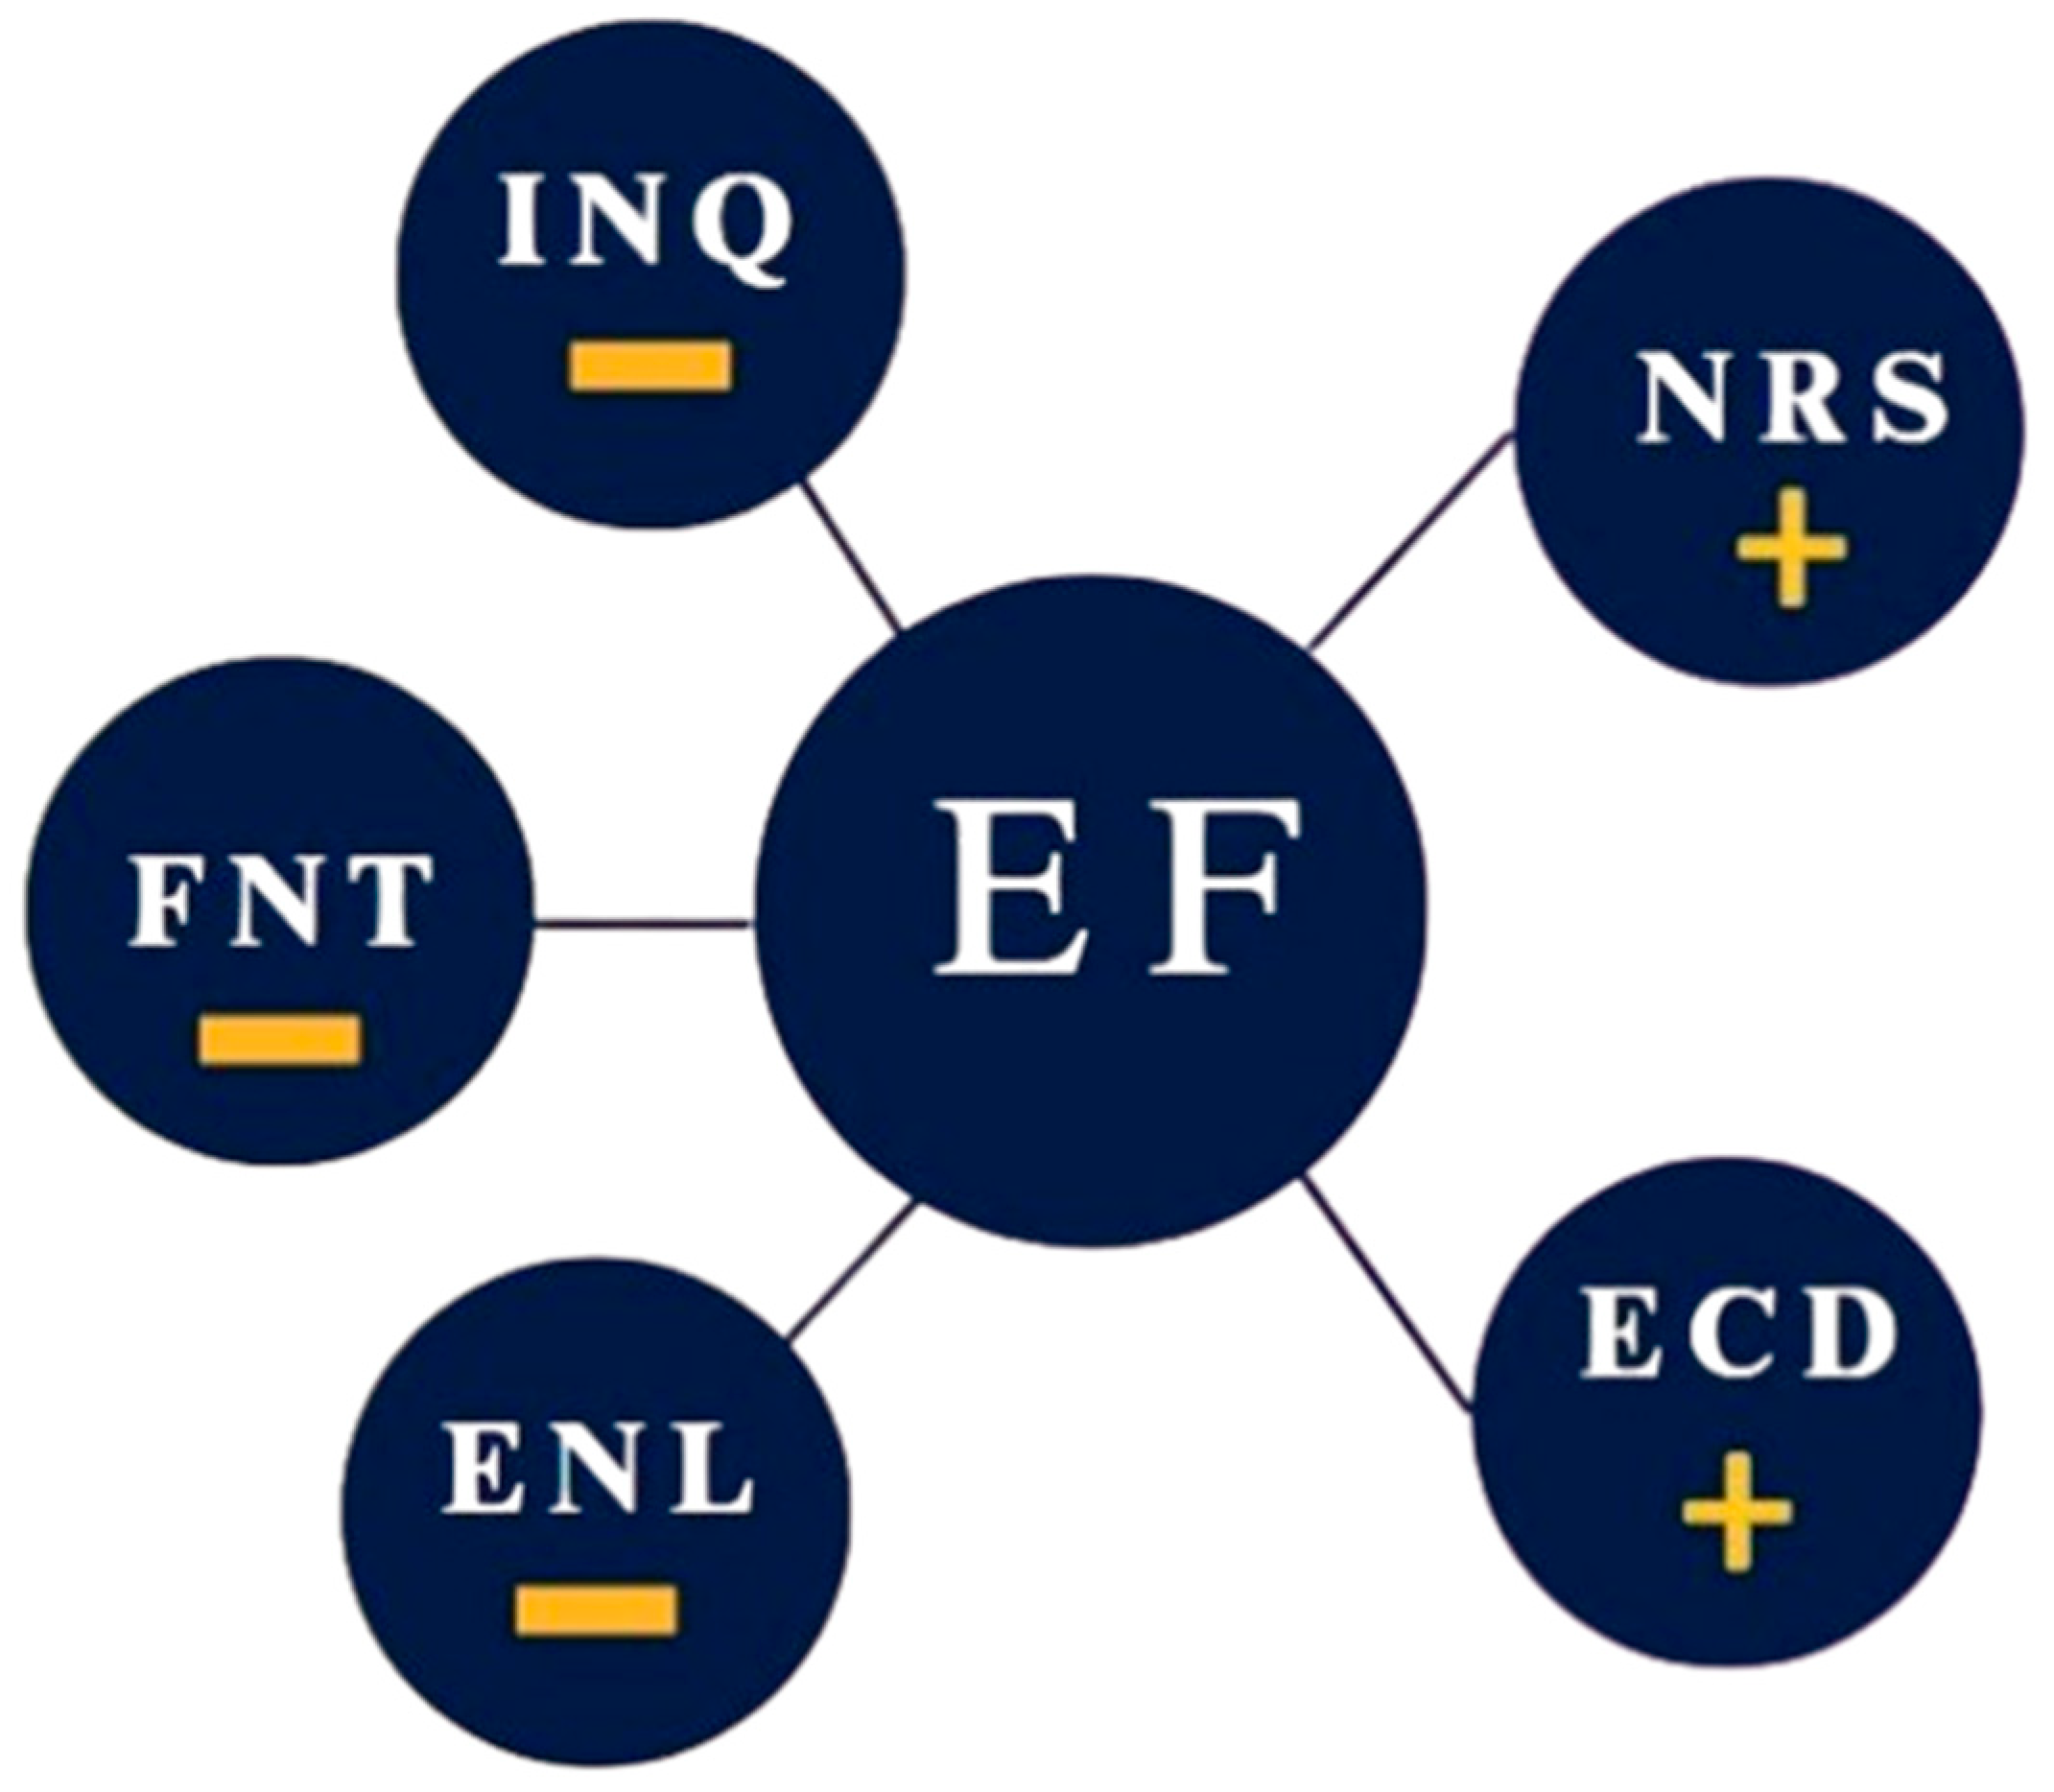
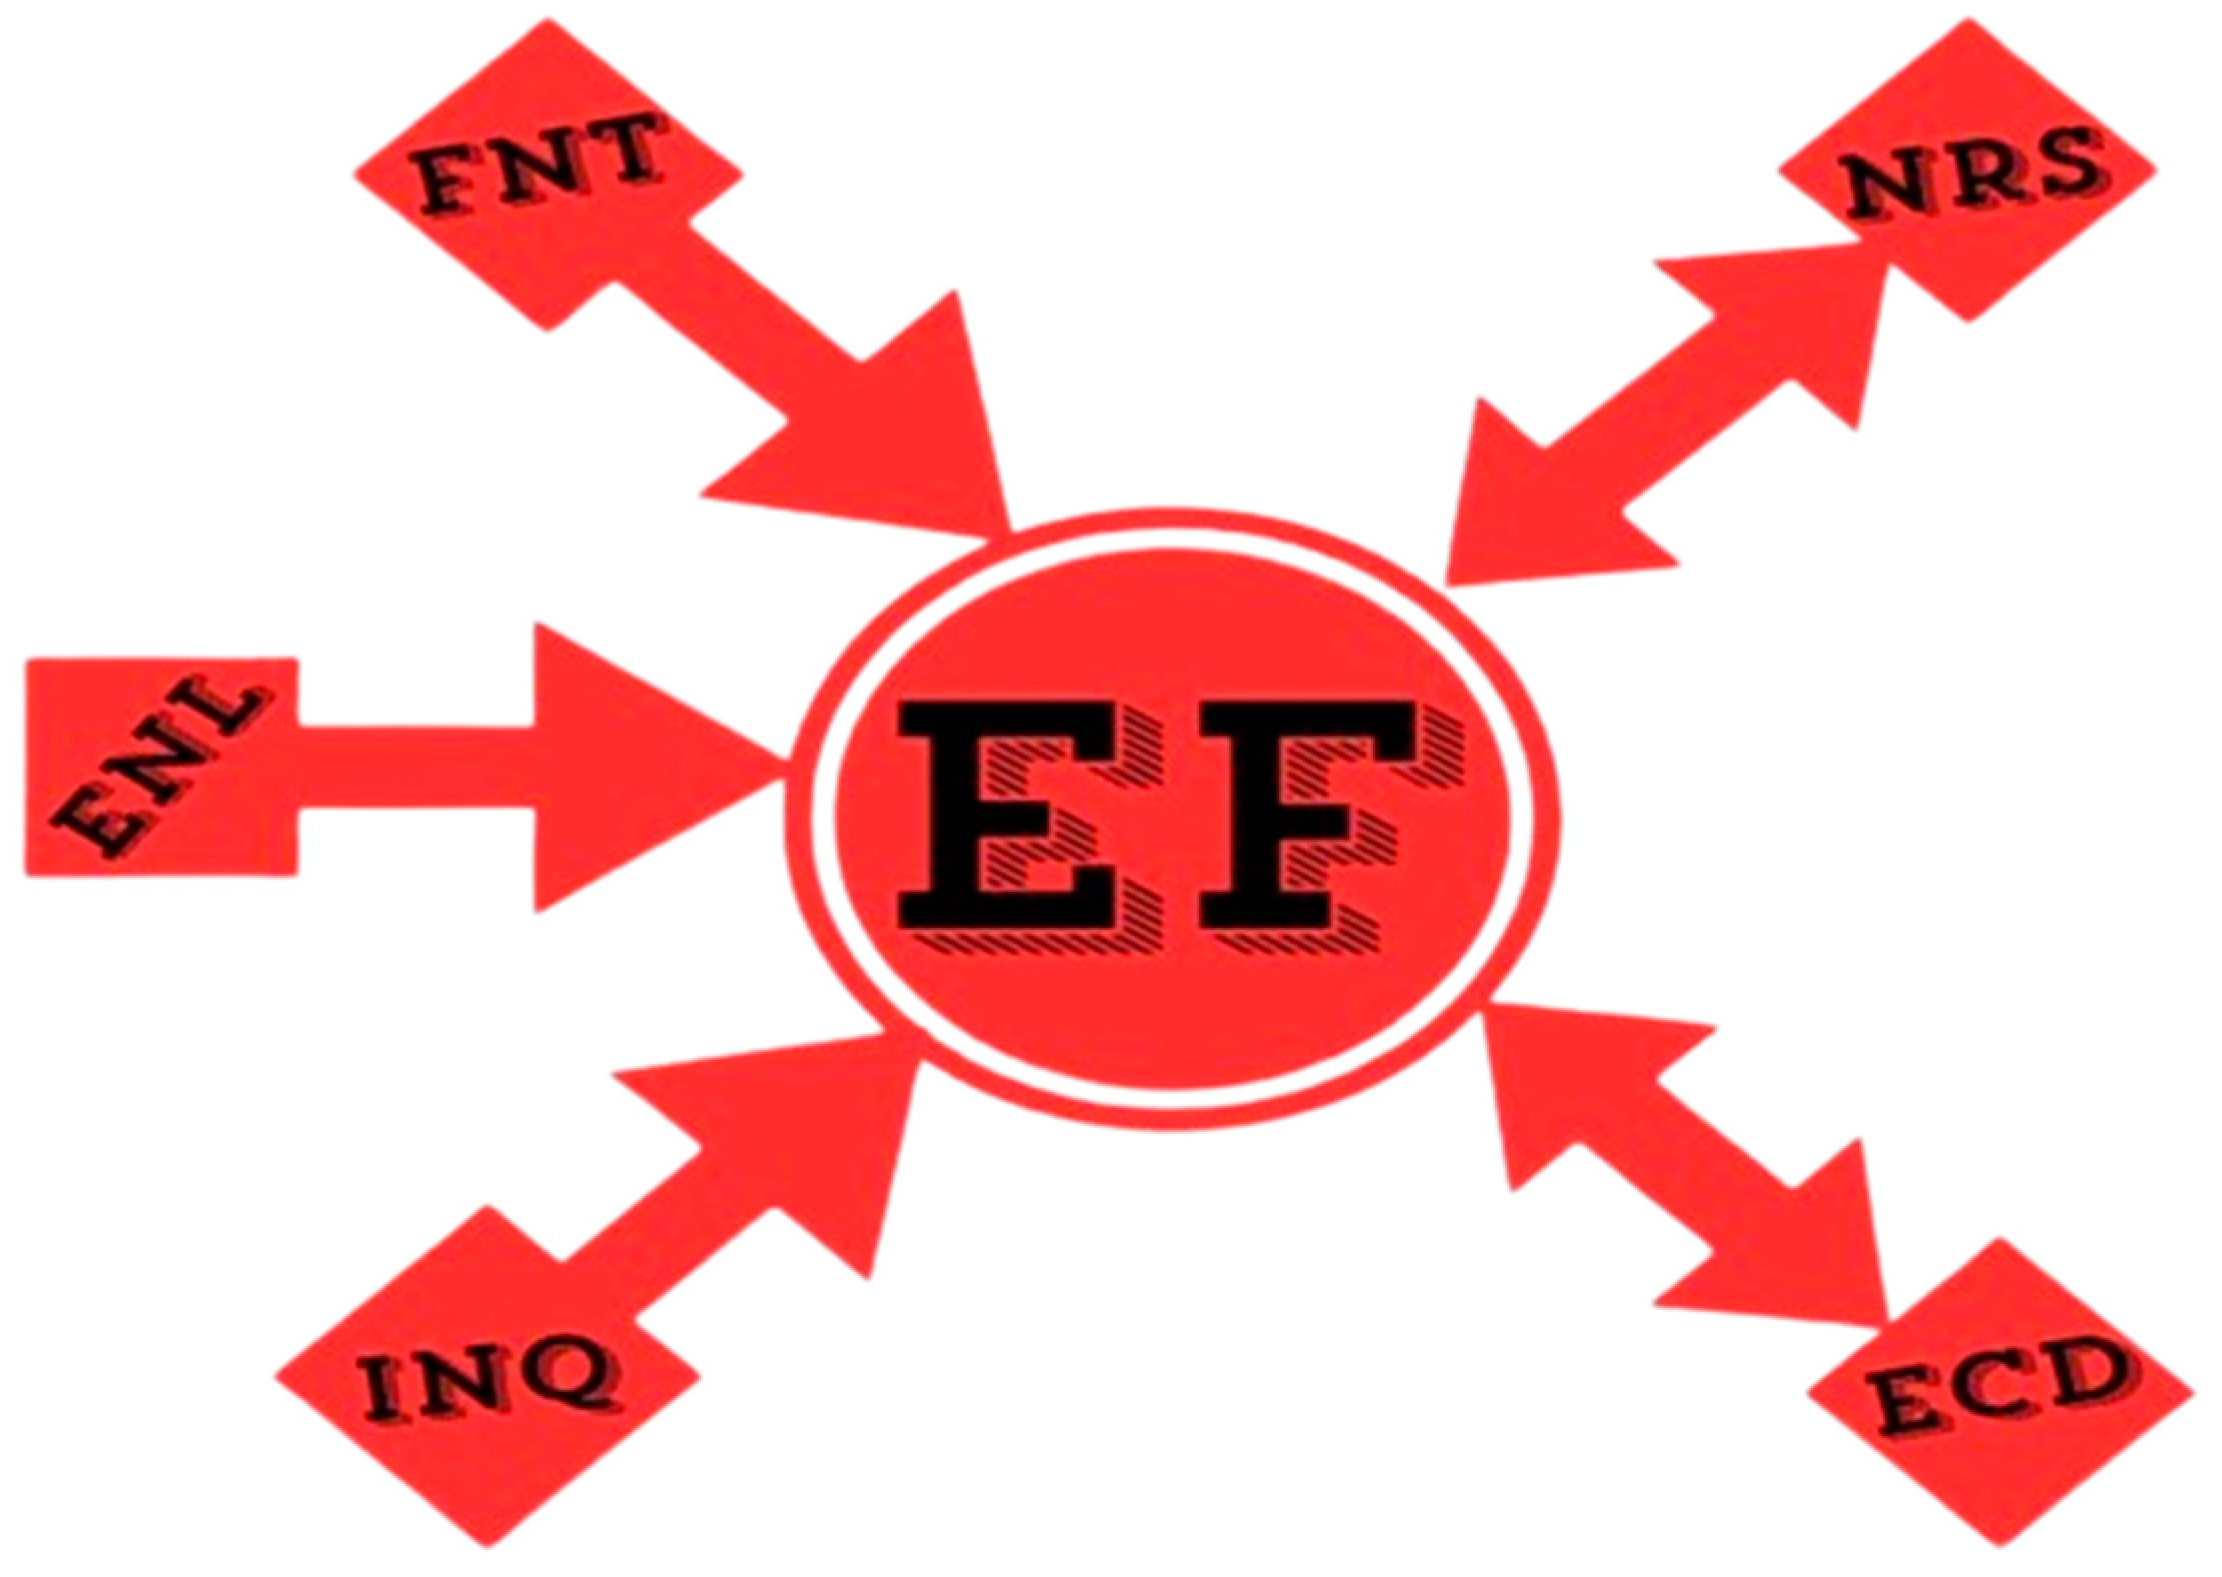
46]. SDG7 aims to achieve modern, reliable, and ecologically sustainable energy sources by the year 2030. The accomplishment of this objective can solely be attained by shifting away from fossil fuels. This study centers on G20 nations, as they have made a commitment to fully eliminate the usage of fossil fuels and transition to RE sources by the year 2040. Therefore, this study is conducted to enhance the current information base and offer valuable insights for policymakers, and the scientific community by examining the SD in the G20 countries by analyzing the influence of NRS, FNT, and ENL. This study uses panel models to evaluate the influence of NRS, ENL, and FNT on EF in the G20 nations. This study aims to fill a knowledge gap regarding the efficacy of FNT and ENL in reducing environmental impacts. The study also examines the relationship between ECD, INQ, and EF. It offers insights into the dynamics and trajectories of ecological impacts. Considering the pressing nature of the climate emergency, the G20 nations have established a target of achieving complete neutrality in emissions by 2040, which is five years ahead of the original schedule. It intends to transition to RE sources to meet all its energy requirements by that same year. To summarize how the variables’ elements impact sustainability, we presented the summary in Figure 5 to illustrate the principal factors impacting the SD in G20. It illustrates the key elements influencing environmental sustainability in G20 countries. It highlights how natural resources, fintech, environmental laws, economic development, and institutional quality interact to shape sustainability outcomes. These factors contribute by affecting resource management, technological advancements, policy enforcement, financial systems, and governance structures. Each component plays a critical role in either promoting or hindering sustainable practices [47].
The remaining sections of the article are as follows: Section two discusses the literature review on EF, NRS, ENL, FNT, ECD, and INQ. Section three covers the data, methodology, preliminary tests, and regression techniques. Section four uncovers the study’s findings. Section five is about the discussion of outcomes. The last section of the study represents the conclusion and policy recommendations, as well as the study’s limitations.

2. Literature Review

2.1. Natural Resources and Sustainability

The extraction and utilization of natural resources play a pivotal role in shaping sustainability outcomes. Consequently, scholars have increasingly investigated their impact on ecological footprint (EF); however, findings remain inconsistent. For instance, ref. [48] examined the relationship between clean energy (RE), NRS, and urbanization on EF in BRICS countries from 1992 to 2016, employing FMOLS and DOLS. Their results indicate that both RE and NRS negatively impact EF. Similarly, ref. [49] analyzed the long-term impact of NRS on sustainability in the US over the past 50 years, revealing that resource allocation and human capital development can mitigate environmental degradation. Nevertheless, the broader relationship between NRS and EF remains complex and highly context dependent. While some studies suggest that NRS contributes to sustainable development (SD), others highlight its detrimental effects on SD. Moreover, this heterogeneity is evident in studies that employ different methodological approaches. For example, ref. [50] explored the impact of NRS, human capital, and financial inclusion on EF in G7 countries from 1992 to 2018, using advanced panel techniques (Cup-FM, Cup-BC). Their findings indicate that both NRS and human capital negatively impact EF, implying that resource abundance alone does not guarantee sustainability. Furthermore, limited access to financial services appears to exacerbate environmental degradation, thereby reinforcing the need for sustainable financial products.
The varying outcomes in the literature can be attributed to differences in regional contexts, economic structures, and governance mechanisms. Specifically, the resource curse hypothesis suggests that resource-rich economies, particularly in G20 nations, often experience environmental deterioration due to over-reliance on extraction-driven growth. Likewise, the pollution haven hypothesis posits that these economies attract high-emission industries, thereby escalating ecological degradation [51]. On the other hand, ecological modernization theory argues that economic progress can support sustainability, provided it is complemented by effective governance and green innovations. However, weak institutional frameworks and excessive resource extraction frequently counteract these potential benefits. Therefore, given these contradictory findings, further research is necessary to disentangle the precise mechanisms through which NRS influences EF across different economic and policy settings. A more nuanced understanding of these dynamics is crucial for formulating targeted policies that balance resource utilization with ecological sustainability [52]. Thus, we propose the following hypothesis:
H1. 
NRS negatively impacts environmental sustainability in the G20 nations.

2.2. Fintech and Sustainability

As economies seek sustainable growth, FNT has emerged as a transformative force, not only reshaping global stock markets but also influencing environmental sustainability [53]. Therefore, FNT has transformed the financial landscape, and at the same time, it has reshaped global economies while creating profound implications for environmental sustainability. By leveraging various technologies, FNT aids corporate entities and individuals in effectively overseeing commercial procedures and activities [54]. For instance, by 2030, the development of sustainable growth models facilitated by FNT could generate an annual economic value of USD 12 trillion [55]. Moreover, FNT enables shareholders to shift their investments towards products ensuring sustainable development (SD) through innovations such as cryptocurrencies and other digital financial platforms [56]. Given its transformative role, researchers have increasingly explored the link between FNT and SD across different economic blocs, including the BRICS, OECD, and G20 nations. In this regard, ref. [57] assessed the impact of FNT on SD in BRICS nations using the CS-ARDL estimator with data spanning 1990 to 2020. Their findings suggest that FNT enhances SD by attracting sustainable foreign direct investment (FDI) and reducing asymmetrical information regarding green projects. Similarly, ref. [58] investigated the association between FNT and NRS in OECD economies using the MMQR technique. They discovered that FNT reduces resource consumption and reliance on NRS at all levels, with the most pronounced effects observed in economies with higher natural resource consumption. Furthermore, FNT satisfies the growing consumer demand for environmentally friendly products while expanding green finance offerings to maintain competitiveness within the financial system.
However, despite these insights, the literature remains limited in exploring the role of FNT in the environmental sustainability of G20 nations, which is the primary focus of this study. While some studies have assessed the environmental implications of FNT, they largely center on BRICS and OECD economies. For example, ref. [56] examined the impact of FNT on carbon emissions in the BRICS region using MMQR data from 2000 to 2019. Their results indicate that FNT exacerbates environmental degradation by increasing CO2 emissions across all quantiles. One major concern is the direct relationship between Bitcoin mining and excessive energy consumption, predominantly sourced from non-renewable energy such as coal and thermal power plants, leading to significant emissions and environmental harm [59,60]. These findings raise concerns about the trade-off between financial innovation and environmental sustainability. Although existing research has made strides in understanding the relationship between FNT and sustainability, there remains a gap in empirical studies focusing specifically on G20 nations. Given that G20 countries account for the majority of global financial transactions and emissions, it is imperative to examine how FNT influences environmental outcomes in these economies. Thus, this study aims to bridge this gap by investigating the environmental impact of FNT in the G20 context, offering insights that align more closely with the study’s core objectives. Given these perspectives, green finance theory suggests that FinTech facilitates environmentally friendly financial products, directing investments toward sustainable initiatives. Additionally, technological spillover theory highlights how FinTech innovations enhance efficiency, reducing dependence on traditional resource-intensive financial systems. However, the Jevons paradox cautions that increased efficiency may lead to higher financial activity, potentially amplifying environmental pressures. Considering these theoretical insights, we propose the following hypothesis:
H2. 
FNT improves environmental sustainability in the G20 nations.

2.3. Environmental Law and Sustainability

Environmental law (ENL) has long played a pivotal role in shaping ecological conservation and sustainable development (SD) [61]. Historically, regulatory frameworks emerged in response to increasing industrialization and environmental degradation. Seminal works, such as the United Nations Conference on the Human Environment (Stockholm, 1972) and the Brundtland Report (1987), laid the groundwork for integrating legal mechanisms into environmental governance [62]. The introduction of the Kyoto Protocol (1997) and the Paris Agreement (2015) further strengthened international commitments to mitigating ecological harm [63]. Over time, ENL has evolved into a global benchmark for assessing the strictness and effectiveness of environmental policies, imposing both explicit and implicit costs on activities detrimental to the environment [64]. Numerous studies have examined how stringent environmental governance systems contribute to SD by reducing ecological degradation. For instance, another study investigated the impact of ENL on ecological footprint (EF) in BRICS-T nations using data from 1995 to 2021. Employing the MMQR technique, their findings suggest that ENL effectively curbs ecological degradation, reinforcing the notion of a negative relationship between ENL and EF. Similarly, ref. [65] examined the suppressive effect of ENL on CO2 emissions in Nordic nations using the CS-ARDL technique, while ref. [41] assessed its impact on EF through the AMG approach in South Asian economies. Their results demonstrate that government-imposed environmental policies successfully enhance SD by reducing EF across all analyzed nations, reinforcing a negative correlation. Furthermore, ref. [28] confirmed that ENL significantly contributes to reducing EF in G7 economies (1985–2017) by promoting renewable energy adoption while discouraging reliance on traditional fossil fuels.
Moreover, taxation-based ENL mechanisms have gained traction as a policy tool. In their study, ref. [66] explored the role of taxation in promoting SD in G7 countries. This approach involves levying environmental taxes on corporations and individuals, thereby incentivizing them to adopt green initiatives and align with sustainability goals. However, despite its potential benefits, the effectiveness of ENL is not uniform across all regions. Furthermore, ref. [42] highlighted that ENL fails to adequately curb EF in MENA nations due to weak enforcement mechanisms, underscoring the necessity of refining regulatory strategies. Likewise, ref. [43] argued that many environmental policies prioritize long-term goals, necessitating adaptive corporate strategies in response to fluctuating tax regulations. Additionally, ref. [67] conducted a comprehensive meta-analysis on environmental pollution and ENL, revealing persistent uncertainties regarding its long-term effects on ecological degradation. Given these mixed findings, further interdisciplinary research is required to evaluate how environmental regulations can be optimized to maximize their impact on sustainability. Building on environmental regulation theory, effective ENL are expected to drive sustainability by enforcing policies that promote green technologies and cleaner production [68]. The Porter hypothesis suggests that well-designed environmental regulations can stimulate innovation, making industries more resource-efficient and reducing their ecological footprint [69]. Additionally, institutional theory highlights that stringent eco-governance frameworks create a compliance-driven culture, pushing firms toward sustainable practices. However, the effectiveness of ENL depends on enforcement mechanisms and regulatory quality. Considering these theoretical insights, we propose the following hypothesis:
H3. 
Effective ENL in the G20 strengthens environmental sustainability by encouraging green technology and cleaner production.

2.4. Institutional Quality and Sustainability

Recent studies have made notable contributions to the ongoing discourse on the relationship between institutional quality (INQ) and environmental degradation (ED). While empirical findings generally support the role of strong institutions in reducing environmental harm, differences in the choice of INQ indicators introduce variability in results, necessitating a nuanced interpretation. For instance, refs. [70,71] employed democracy as a proxy for INQ to examine its impact on air pollution. Their findings indicate that democratic governance fosters transparency and public accountability, thereby contributing significantly to environmental protection. In contrast, refs. [72,73] used corruption, law, and order as alternative measures of INQ and found that lower corruption levels and stronger legal frameworks are associated with significant reductions in carbon emissions. These contrasting results suggest that different dimensions of INQ may capture distinct mechanisms through which governance influences environmental sustainability. Expanding on this, ref. [74] examined the interplay between regulatory quality, CO2 emissions, and financial growth in Sub-Saharan Africa. Their findings demonstrate that while economic growth tends to exacerbate CO2 emissions, high-quality regulations mitigate these effects by promoting sustainable practices. Similarly, ref. [75] explored the influence of governmental stability, democratic governance, and control of corruption on greenhouse gas emissions in Africa. The study revealed a strong correlation between institutional effectiveness and reduced CO2 emissions, reinforcing the argument that well-functioning institutions play a pivotal role in ecological governance.
Further, refs. [76,77] analyzed the moderating role of institutional quality in the relationship between sustainability and economic prosperity in South Asia. Their results indicate that robust institutional frameworks enhance environmental governance by regulating the environmental consequences of investment-driven growth. However, ref. [78] investigated governmental effectiveness and its impact on ED in a panel of three Asian nations from 1990 to 2016, reporting mixed outcomes. Their study suggests that while strong institutions can help control environmental harm, in some cases, ineffective governance may fail to curb carbon emissions. Aligning with this, ref. [79] used administrative capability, governmental stability, and accountability as proxies for INQ, finding that institutional quality positively influences energy utilization and environmental degradation, further highlighting the complexity of these interactions. Given these varying perspectives, the choice of INQ proxies is crucial in shaping empirical findings [80]. While democracy and regulatory quality emphasize transparency and enforcement, corruption control and law enforcement highlight institutional efficiency in deterring environmentally harmful practices [81]. Thus, future research should carefully align the selected INQ metrics with the specific environmental outcomes under investigation to ensure accurate interpretations and policy relevance. Building on institutional theory, higher INQ is expected to enhance environmental sustainability by fostering clean energy adoption and equitable resource distribution [82]. Strong institutions ensure effective governance, reduce corruption, and promote transparent policies that support sustainable development. The environmental Kuznets curve (EKC) hypothesis suggests that as institutions strengthen, economies transition towards greener practices, reducing environmental degradation. Additionally, regulatory quality theory highlights that well-functioning institutions enforce environmental policies, encouraging cleaner production and responsible resource management [83]. However, the impact of INQ depends on governance effectiveness and policy enforcement. Based on these insights, we propose the following hypothesis:
H4. 
Higher INQ in the G20 improves environmental sustainability by adopting clean energy practices and equitable resource distribution.

2.5. Economic Development and Sustainability

The impact of economic expansion on environmental degradation (ED) is extensively examined through the lens of the Environmental Kuznets Curve (EKC) theory. This hypothesis suggests that economic growth initially exacerbates environmental harm but later leads to ecological improvements once a certain income threshold is reached. While numerous studies support this idea, alternative economic theories, such as the Porter Hypothesis and Degrowth Theory, offer additional perspectives on the economy-environment nexus, providing a more comprehensive understanding of sustainability dynamics [84]. For instance, ref. [85] investigated the effect of ECD on environmental conservation, by analyzing data from 1995 to 2017. The study observed a non-linear relationship between economic expansion and the EF, confirming an inverted U-shaped curve and validating the EKC hypothesis. Similarly, ref. [86] examined economic complexity’s impact on EF and carbon dioxide (CO2) emissions in Germany, Switzerland, and Sweden. Their findings revealed an EKC-type relationship in Germany and Sweden, but not in Switzerland, suggesting that country-specific economic structures may influence environmental outcomes. Expanding on this, ref. [87] explored the Pollution Haven Hypothesis (PHH) in Thailand by analyzing FDI, EF, CO2 emissions, and load capacity. Their findings substantiated the pollution haven effect for CO2 emissions but contradicted its validity for EF, highlighting the nuanced impact of economic activity on different environmental indicators. Additionally, ref. [88] assessed the relationship between ECD and external current account balances in high-income, upper-middle-income, and lower-middle-income nations. The study confirmed the EKC hypothesis across all panels, demonstrating that economic expansion initially hinders sustainability until a critical income level is reached, after which environmental conditions improve.
Despite the widespread application of the EKC framework, its validity remains contested. Numerous studies have challenged its assumptions, arguing that structural economic factors, policy interventions, and technological advancements influence environmental outcomes independently of income levels [89]. Moreover, alternative perspectives provide valuable insight into the relationship between economic expansion and environmental sustainability. The Porter Hypothesis suggests that stringent environmental regulations can drive innovation and economic competitiveness, leading to both growth and ecological improvements [90]. In contrast, Degrowth Theory challenges the pursuit of perpetual economic expansion, advocating for a steady-state economy that prioritizes ecological balance over GDP growth. These frameworks highlight the role of policy, market mechanisms, and societal choices in shaping sustainability outcomes. While the EKC hypothesis posits that ECD initially worsens ED before reaching a threshold where sustainability improves, this transition is not uniform across nations. In many G20 economies, rapid industrialization and resource exploitation may extend the degradation phase, delaying environmental recovery. Similarly, the Pollution Haven Hypothesis (PHH) suggests that economic expansion can attract high-emission industries, further exacerbating ecological harm. Additionally, the scale effect implies that as economies grow, resource consumption intensifies, increasing their ecological footprint. Given these theoretical perspectives, we propose:
H5. 
ECD deteriorates the environmental sustainability in the G20 nations.

2.6. Literature Gap

The existing literature provides valuable insights into the impact of technological innovation, economic development, natural resources, finance, and energy consumption on ecological footprint. However, key gaps remain unaddressed. Most studies have examined these factors in isolation, overlooking their interconnected effects on ecological sustainability. Additionally, prior research predominantly relies on CO2 emissions as a proxy for environmental degradation, while ecological footprint offers a more comprehensive measure. Methodologically, many studies apply linear estimation techniques, which may fail to capture the non-linear and asymmetric relationships among variables. This study bridges these gaps by integrating an advanced framework that examines the complex interplay between financial technology, natural resources, environmental regulations, economic development, and institutional quality in G20 countries. Specifically, it contributes to the literature by utilizing a multi-dimensional approach that moves beyond conventional linear estimations. Given their significant contribution to global emissions and economic activities, analyzing G20 nations offers critical policy implications. To address methodological shortcomings, we employ a non-linear estimation approach using CS-ARDL, AMG, and CCEMG, which effectively accounts for heterogeneity, cross-sectional dependence, and asymmetries across different ecological footprint quantiles. Additionally, PCA is used to construct a financial technology index, enhancing the measurement precision of financial innovations, while ANN ensures the robustness of our findings by providing machine learning-based validation. This comprehensive methodological framework not only strengthens the empirical validity of the study but also offers more dynamic insights into ecological sustainability in G20 economies.

3. Data Sources and Methodological Framework

3.1. Data Collection and Model

We sourced data from four well-established online databases to ensure comprehensive coverage and reliability. The Global Footprint Network (GFN) was selected for ecological footprint (EF) data due to its extensive and standardized approach to measuring human demand on natural resources. The World Development Indicators (WDI) database, maintained by the World Bank, provided data for NRS and economic development (ECD), as it is widely recognized for its broad coverage and consistency in economic and environmental statistics [91,92]. Institutional quality (INQ) data were obtained from the Worldwide Governance Indicators (WGI) database, which offers a globally accepted assessment of governance performance across countries. Moreover, the fintech (FNT) index is developed using Principal Component Analysis (PCA), incorporating internet users’ rate, broadband subscriptions, and mobile subscriptions as key indicators. Since PCA assigns weights based on the variance explained by each component, we allocated weights reflecting their relative importance in fintech adoption. The rate of internet users receives the highest weight (45%) because it directly represents the accessibility and penetration of digital financial services. Broadband subscriptions (35%) follow, as they facilitate stable internet connections necessary for fintech applications. Mobile subscriptions (20%) receive a lower weight, as mobile access is widespread but does not necessarily indicate active fintech engagement. These assigned weights ensure that the composite index effectively captures fintech development across the diverse G20 economies. Lastly, ENL data were collected from the Organization for Economic Co-operation and Development (OECD) database, known for its reliable and standardized energy statistics. While these databases provide high-quality data, potential limitations include reporting inconsistencies across countries, time lags in data updates, and varying measurement methodologies, which we have accounted for by cross-validating sources and applying robust estimation techniques. Table 1 displays the study variables, their abbreviations, and the data sources used. It presents details of the variables used in this study, including their short forms, data sources, and corresponding links.
The variables under study are important and essential to studying the relationship with EF in G20 countries, as these variables are highly associated with EF. EF represents the view of the impact of human activities on the environment. ECD is an economic variable representing a country’s economic welfare and development. INQ can capture the effectiveness and efficacy of institutions in promoting SD. This study uses the following empirical model equations to investigate the impact of NRS, FNT, ENL, ECD, and INQ on EF for G20 countries.
E F = f ( N R S , F N T , E N L , E C D , I N Q )
E F i t = α o + β 1 N R S i t + β 2 F N T i t + β 3 E N L i t + β 4 E C D i t + β 5 I N Q i t + ε i t
Here, EF stands for ecological footprint, NRS for natural resources, FNT for fintech, ENL for ENL, ECD for economic development, and INQ for institutional quality. In Equation (2), i is representing countries’ cross-section, α   a n d   β are used to represent intercept term and slope coefficients. Finally, t has been used to represent time (Number of years).

3.2. Methodological Approaches

This work utilizes advanced econometric techniques to develop the econometric model. Given the panel nature of the dataset, the first step involves conducting the cross-sectional dependence (CD) test [93] to detect common shocks and interdependencies across countries, which, if ignored, could lead to biased estimations. To account for potential heterogeneity in country-specific dynamics, the heterogeneity test is applied to assess slope variations in the panel data [94]. Next, the CIPS and CADF unit root tests are employed to determine the stationarity properties of the variables, as traditional unit root tests may be unreliable in the presence of cross-sectional dependence. Following this, a panel cointegration test [95] is conducted to examine the long-term equilibrium relationships among EF, FNT, NRS, ENL, ECD, and INQ. Given the need to capture both long- and short-term dynamics while addressing cross-sectional dependence and heterogeneity, the CS-ARDL approach is chosen, as it is well-suited for heterogeneous panels with complex interactions. Additionally, the Granger causality test [96] is employed to explore the directional influence among variables, providing insights into causal linkages. To further validate the robustness of our findings, we incorporate the Artificial Neural Network (ANN) approach, which offers a machine learning perspective on pattern recognition and non-linear relationships, complementing the econometric results. These methodological choices are driven by their ability to handle cross-country variations, dynamic relationships, and potential endogeneity concerns, ensuring a comprehensive analysis of fintech, natural resources, and environmental sustainability. Moreover, the econometric techniques employed in the study are presented in Figure 6.

3.3. Cross-Sectional Dependence

Before analyzing the panel data, it is essential to assess cross-sectional dependence (CD) to determine whether economic and environmental factors in G20 countries are interrelated. CD occurs when cross-sectional units are influenced by common shocks or shared external conditions, making standard estimators unreliable if ignored [97,98]. Given the interconnected nature of global trade, finance, and environmental policies, changes in fintech adoption, natural resource utilization, or environmental regulations in one G20 country can have spillover effects on others [99]. For instance, shifts in green finance policies or carbon regulations in a major economy can impact supply chains, investment flows, and ecological footprints across the group. To further justify our methodological approach, we employ the Breusch–Pagan LM test and the Pesaran CD test, two widely used methods for detecting cross-sectional dependence in panel datasets. The Breusch–Pagan LM test is effective for large panels where T (time dimension) is greater than N (cross-sections), while the Pesaran CD test is more suited for cases with relatively small T [100]. By comparing results from both tests, we ensure a comprehensive assessment of interdependencies among G20 economies. A rejection of the null hypothesis would indicate strong interconnectivity, reinforcing the necessity of panel estimators that account for CD effects in our empirical analysis. Equation (3) is employed to formally test for CD:
C D = 2 T N ( N 1 ) i = 1 N 1   j = i + 1 N   ρ ^ i j N ( 0,1 ) i , j ,
w h e r e , C D = 1,2 , 3,4 15 N .
In Equation (3), T is the time period, N is the number of units, and ρ ^ i j represents the correlation between residuals. If the panel data do not exhibit cross-sectional dependence, the null hypothesis should be accepted.

3.4. Slope Homogeneity Test

The study examines the homogeneity of slope coefficients using the slope heterogeneity test developed by Hashem Pesaran and Yamagata [101]. Given the diverse economic structures, policy frameworks, and environmental commitments across the G20 countries, it is crucial to assess whether the relationships between ecological footprints, fintech, natural resources, and other variables exhibit uniformity or vary significantly across nations. Ignoring slope heterogeneity could lead to biased estimates, misrepresenting the true impact of key factors on environmental sustainability [102]. This test is particularly relevant for our study, as G20 countries exhibit structural differences in economic resilience, regulatory intensity, and environmental policies. If significant slope heterogeneity is detected, it would justify the use of advanced estimators like Mean Group (MG) or Common Correlated Effects Mean Group (CCEMG) [103], ensuring that our findings accurately capture cross-country variations in the determinants of ecological sustainability Panel estimators may be influenced by variations in economic development, industrialization levels, regulatory frameworks, and technological adoption across G20 economies. By conducting this test, we determine whether a common estimation approach is appropriate or if country-specific factors necessitate a more flexible modeling strategy, ensuring the robustness of our empirical analysis. The empirical model for this test is expressed in Equations (4) and (5).
Δ ~ S H = ( N ) 1 2 ( 2 K ) 1 2 1 N s ~ k
Δ ~ A S H = ( N ) 1 2 2 k ( T k 1 ) T + 1 1 2 1 N s ~ k
In the above equation, the symbol Δ ~ A S H is used to represent adjusted delta tilde and the symbol Δ ~ S H represents the delta tilde.

3.5. Unit Root Test

To ensure a robust assessment of panel data integration, it is essential to employ both parametric and non-parametric methodologies, particularly given the presence of CD. Standard unit root tests often fail to account for CD and heterogeneity, leading to unreliable inferences where the null hypothesis of stationarity may be incorrectly rejected [104,105]. Since environmental and economic dynamics in G20 countries are highly interconnected—through trade, policy diffusion, and financial markets—ignoring CD could distort the estimation of relationships between ecological footprint, fintech, natural resources, and other key variables. To address this issue, we utilize the Cross-Sectionally Augmented Dickey–Fuller (CADF) and Cross-Sectionally Augmented Im-Pesaran-Shin (CIPS) tests. These second-generation unit root tests account for both common shocks and individual country dynamics, ensuring a more accurate determination of stationarity in the dataset [106]. In this study, the CADF test is applied using Equation (6) as follows:
Δ Y i t = β i + a i y i , t 1 + b i y ¯ t 1 + d i Δ y ¯ t + μ i t .
The study has a single lag, and the equation is represented as follows:
Δ Y i t = β i + a i y i , t 1 + b i y ¯ t 1 + j = 0 p   d i j Δ y ¯ t j + j = 1 p   δ i j Δ y i , t j + μ i t .
From Equations (6) and (7), the symbol Δ y i , t j is used to represent the first cross-section difference and y ¯ t j has been used for lagged level average. Moreover, the equation for CIPS is shown below:
C I P S = N 1 i = 1 N   t i ( N , T ) .

3.6. Co-Integration Test

Before proceeding with the estimation, it is crucial to establish the long-term equilibrium relationship between EF and key explanatory variables, including FNT, ENL, NRS, ECD, and INQ, by conducting stationarity diagnostics. To ensure robust findings, this study employs the Westerlund cointegration test [95], which is well-suited for panel data with CD. Unlike traditional cointegration tests, the Westerlund approach accounts for heterogeneous dynamics and common shocks across G20 countries, making it particularly relevant for analyzing environmental sustainability in an interconnected global economy [107]. Since policies, technological advancements, and resource management strategies vary across nations, ignoring these interdependencies could lead to misleading inferences. The null hypothesis (H0) assumes no cointegration between variables, while the alternative suggests a long-term equilibrium relationship. The test evaluates this hypothesis using four key statistics: Gt, Ga, Pt, and Pa. The generalized version of the test is formulated in Equation (9):
α i ( L ) Δ y i t = γ 1 i + γ 2 i t + β i ( y i t 1   á ixit   1 ) + γ i ( L ) v i t + η i .
Equation (9) displays the cointegration vector across parameters FNT, ENL, NRS, ECD, and INQ. The test’s statistics are represented by the following equations:
G t = 1 N i = 1 N     á   i S E ( á   i )
P t =   á   S E ( á )
G a = 1 N i = 1 N   T   á   i   á   i ( 1 )
P a = T   á .
The abbreviations Gt and Ga represent mean group statistics, whereas Pt and Pa represent panel characteristics in Equations (10)–(13).

3.7. Regression Estimation Through CS-ARDL

This study employs the CS-ARDL technique due to the significant presence of CD in the data. Unlike traditional panel estimation methods, CS-ARDL accounts for cross-sectional interdependencies and heterogeneous slope coefficients, making it well-suited for analyzing the interconnected environmental and economic dynamics of G20 countries [108]. A key advantage of CS-ARDL is its ability to incorporate dynamic common correlated effects (DCCE), which helps mitigate bias arising from unobserved common factors. However, like any econometric approach, it has certain limitations. One potential drawback is its sensitivity to small sample sizes, which can affect the efficiency of parameter estimates. Additionally, while CS-ARDL effectively captures both long-term and short-term dynamics, its performance heavily depends on the appropriate selection of lag structures, which, if not carefully determined, may introduce estimation complexity [109]. To ensure the accuracy of our lag selection, we employ standard information criteria, such as AIC and BIC, optimizing the model specification for reliable inference.
Moreover, considering the relevance of interaction effects in economic and environmental studies, we incorporate interaction terms where appropriate to assess the combined impact of key variables. This allows us to explore whether relationships vary under different conditions, offering deeper insights into the role of fintech, natural resources, and policy interventions in shaping ecological and economic outcomes. Additionally, to address the limitations of CS-ARDL and enhance the robustness of our findings, we conduct robustness checks using alternative estimation techniques such as AMG and CCEMG, ensuring consistency in results. We did not use PMG-ARDL because it assumes long-run slope homogeneity, which is unrealistic given the diverse economic structures and policies of G20 countries. Additionally, PMG-ARDL does not account for CD [110], a key factor in our study. In contrast, CS-ARDL accommodates heterogeneous slopes and addresses CSD, making it the more suitable choice. Finally, we verify the stability of our results by adjusting lag lengths and testing for parameter consistency across different model specifications, reinforcing the reliability of our conclusions. Equation (14) is used for regression in CS-ARDL.
Δ E F i , t = i + l = 1 p   α i l E F i , t l + l = 0 p   α i l X i , t l + l = 0 1   α i l z ¯ i , t l + ε i , t
In the above equation, EF represents ecological footprint, the main endogenous variable. Moreover, z ¯ t = Δ E F ¯ t , X ¯ t   and   X i , t = F N T i t , N R S i t , E N L i t , E C D i t , I N Q i t .
An econometric model can be harmed by both cross-sectional dependence and heterogeneity. This can cause panel estimators to give wrong and inconsistent results, which can lead to wrong conclusions [111]. Ref. [112] suggested an AMG technique as a solution to these problems. Policymakers may be able to achieve more precise policy goals by using AMG regression. The following equation represents the two-phase process for AMG.
Δ Y i t = α i + β i Δ x i t + γ i g t + t = 2 T   η i Δ R t + μ i t
β ^ A M G = N 1 i = 1 N   β ^ i
In this work, the CCEMG approach was used to perform a CD and heterogeneity evaluation of individual cross-sections. This test can address unit root, CD, and a slope heterogeneity [113]. Equation (17) illustrates anatomical representation of CCEMG regression.
Π ~ M G = 2 Π ~ M G 1 2 Π ^ M G a + Π ^ M G b  
Moreover, this study employs Artificial Neural Networks (ANN) to enhance robustness and validate the findings. ANN plays a crucial role in enhancing the robustness of econometric analysis, particularly in the presence of CSD [114]. Traditional panel estimation techniques, including CS-ARDL, AMG, and CCEMG, are well-suited for capturing heterogeneous slopes and unobserved common factors. However, they may still be limited in detecting complex, non-linear relationships among variables. ANN provides a data-driven, flexible modeling approach that can uncover intricate dependencies and interaction effects that conventional econometric methods might overlook [94]. In the context of CS-ARDL, ANN serves as a complementary robustness check by offering an alternative perspective on long-run and short-run relationships while accommodating the inherent interdependencies among cross-sectional units [115]. Unlike linear econometric models, ANN can adaptively learn patterns from the data without imposing restrictive assumptions about functional forms, making it particularly valuable in dynamic economic and environmental studies [116]. Moreover, its ability to process high-dimensional data ensures that key variables, including those influenced by external shocks, are effectively incorporated into the analysis. By integrating ANN alongside CS-ARDL, AMG, and CCEMG, this study enhances the reliability of its findings, ensuring that results remain robust under different methodological approaches. The inclusion of ANN strengthens predictive accuracy, reinforces the stability of estimated coefficients, and provides additional validation for policy implications derived from the study.

3.8. Panel Causality Test

Panel causality test was developed to tackle the difficulties presented by panel data models with heterogeneous characteristics, since it effectively considers CD issues while ignoring the time dimension. Furthermore, it exhibits strong and reliable performance when applied to imbalanced panels [96]. The D-H panel causality test may be analyzed using the symmetric model described in Equation (18):
Y i , t = α i + k = 1 K   γ i ( k ) Y i , t k + k = 1 K   β i ( k ) X i , t k + ε i , t .
The statistical test panel is examined in Equation (19) as follows:
W N . T H N C = N 1 i = 1 N   W i , T .
Ref. [96] suggested using the test statistic from Equation (20) when dealing with larger temporal dimensions (T > N), as seen below:
Z N , T H N C = N 2 K W N , T H N C K .

4. Results

Table 2 presents the descriptive statistics for G20 countries, highlighting significant variability across key variables. The ecological footprint (EF) averages 4.28, with a slight right skewness, indicating that while most countries have lower EF values, a few exhibit much higher footprints (0.09–10.93). Natural resource extractions (NRS) show substantial heterogeneity, with a mean of 4.73 and a large standard deviation of 9.15, reflecting stark differences in resource dependence. Similarly, economic development (ECD) varies widely, averaging 13,418 with a high standard deviation (16,960) and a range from −9601.34 to 61,855.52, emphasizing economic disparities within the G20. Environmental laws (ENL) exhibit positive skewness, with most countries having moderate regulatory frameworks but a few enforcing much stronger policies (1.45–25.23). Fintech (FNT) is highly skewed, with minimal development in most countries but significantly higher levels in a few (−0.43 to 7.45). Institutional quality (INQ) averages 65.94, showing a relatively balanced distribution but with notable governance disparities (6.53–97.56). The high variability in NRS, ECD, and INQ underscores the diverse economic, governance, and environmental contexts among G20 nations, influencing sustainability outcomes and policy effectiveness.
Moreover, liberalization and globalization have transformed the world into a highly interconnected global community, where economic and environmental changes in one country can influence others [94]. Given this interdependence, addressing CD in panel data is crucial. This study employs the CD test to assess the extent of interrelationships among G20 nations, focusing on EF, NRS, FNT, ENL, ECD, and INQ. The test results, presented in Table 3, indicate a significant CD at the 1% level, confirming that changes in these variables in one G20 country can transmit effects across the group. For instance, fluctuations in NRS or ENL in one nation can shape sustainability policies and economic growth trajectories in others. Similarly, FNT and INQ can have spillover effects, influencing financial systems and governance structures beyond national borders. These findings underscore the G20’s economic and environmental interconnectedness, reinforcing the need for coordinated policies. Ignoring CD could lead to biased estimates and misinterpretation of policy impacts. Therefore, accounting for CD ensures a more robust analysis of sustainability trends and policy implications within the G20 framework.
After confirming the presence of CD in the dataset, it is essential to assess the homogeneity of slope coefficients to determine whether G20 countries exhibit similar relationships among the studied variables. The null hypothesis (H0) assumes slope homogeneity, implying uniform effects across countries, while its rejection suggests heterogeneity. Table 4 presents the slope homogeneity test results, showing that the null hypothesis is rejected at a 1% significance level (p-values for both delta and adj. delta = 0.000). This confirms significant variations among the G20 countries, indicating that environmental sustainability determinants differ based on country-specific economic structures, policy frameworks, and resource endowments. These findings highlight the need for tailored policy approaches rather than one-size-fits-all solutions.
After confirming the presence of CD and data heterogeneity, it is crucial to assess the stationarity properties of the variables to ensure the reliability of regression analysis. Given the presence of CD, second-generation unit root tests, such as CIPS and CADF, are employed for more accurate stationarity detection. Table 5 presents the results, indicating that all variables—EF, NRS, FNT, ENL, ECD, and INQ—are non-stationary at level but become stationary at I(1). In CADF, EF, ECD, and INQ achieve stationarity at I(1) at the 5% level, while the remaining variables are significant at the 1% level. In CIPS, all variables are stationary at I(1) at the 1% significance level. The presence of unit roots at level suggests that these variables exhibit long-term trends, meaning shocks can have persistent effects. However, stationarity at first difference (I(1)) ensures valid long-run relationships, supporting the suitability of cointegration techniques for policy-relevant insights into environmental sustainability dynamics in G20 countries.
After confirming the integration order of the data series, it is necessary to check for co-integration among the time series to verify the long-run relationships among the variables. When CD and heterogeneity are present in the panel data, the second-generation co-integration tests are recommended. This is why Westerlund co-integration is a good way to look at the long-term equilibrium between the variables because it can deal with CD and different types of data. In our study, CD and slope heterogeneity exist in the dataset; therefore, we used a second-generation Westerlund co-integration test to check the long-run co-integration among the study variables EF, NRS, FNT, ENL, ECD, and INQ for the G20 countries. The null hypothesis of Westerlund co-integration indicates that there is no co-integration among the time series, and H1 rejects that hypothesis. Table 6 displays the results of the Westerlund co-integration test. The p-values of Gt and Pt at the 1% level of significance indicate the rejection of H0 and acceptance of H1. Hence, there is long-term co-integration among the study variables.
To ensure the reliability of our findings, we evaluated model selection using the Akaike Information Criterion (AIC) and Bayesian Information Criterion (BIC). Lower AIC and BIC values indicate a better-fitting model. As shown in Table 7, the full model, which includes all explanatory variables, has the lowest AIC (278.54) and BIC (287.91), confirming its superior fit compared to other specifications. Additionally, we conducted a robustness check using the Common Correlated Effects Mean Group (CCEMG) model, which accounts for cross-sectional dependencies. The CCEMG robustness model yielded an AIC of 283.76 and a BIC of 292.43, reinforcing the validity of our main results. These findings confirm that the selected model effectively captures the relationship between financial technology, environmental policies, and ecological footprint in G20 economies.
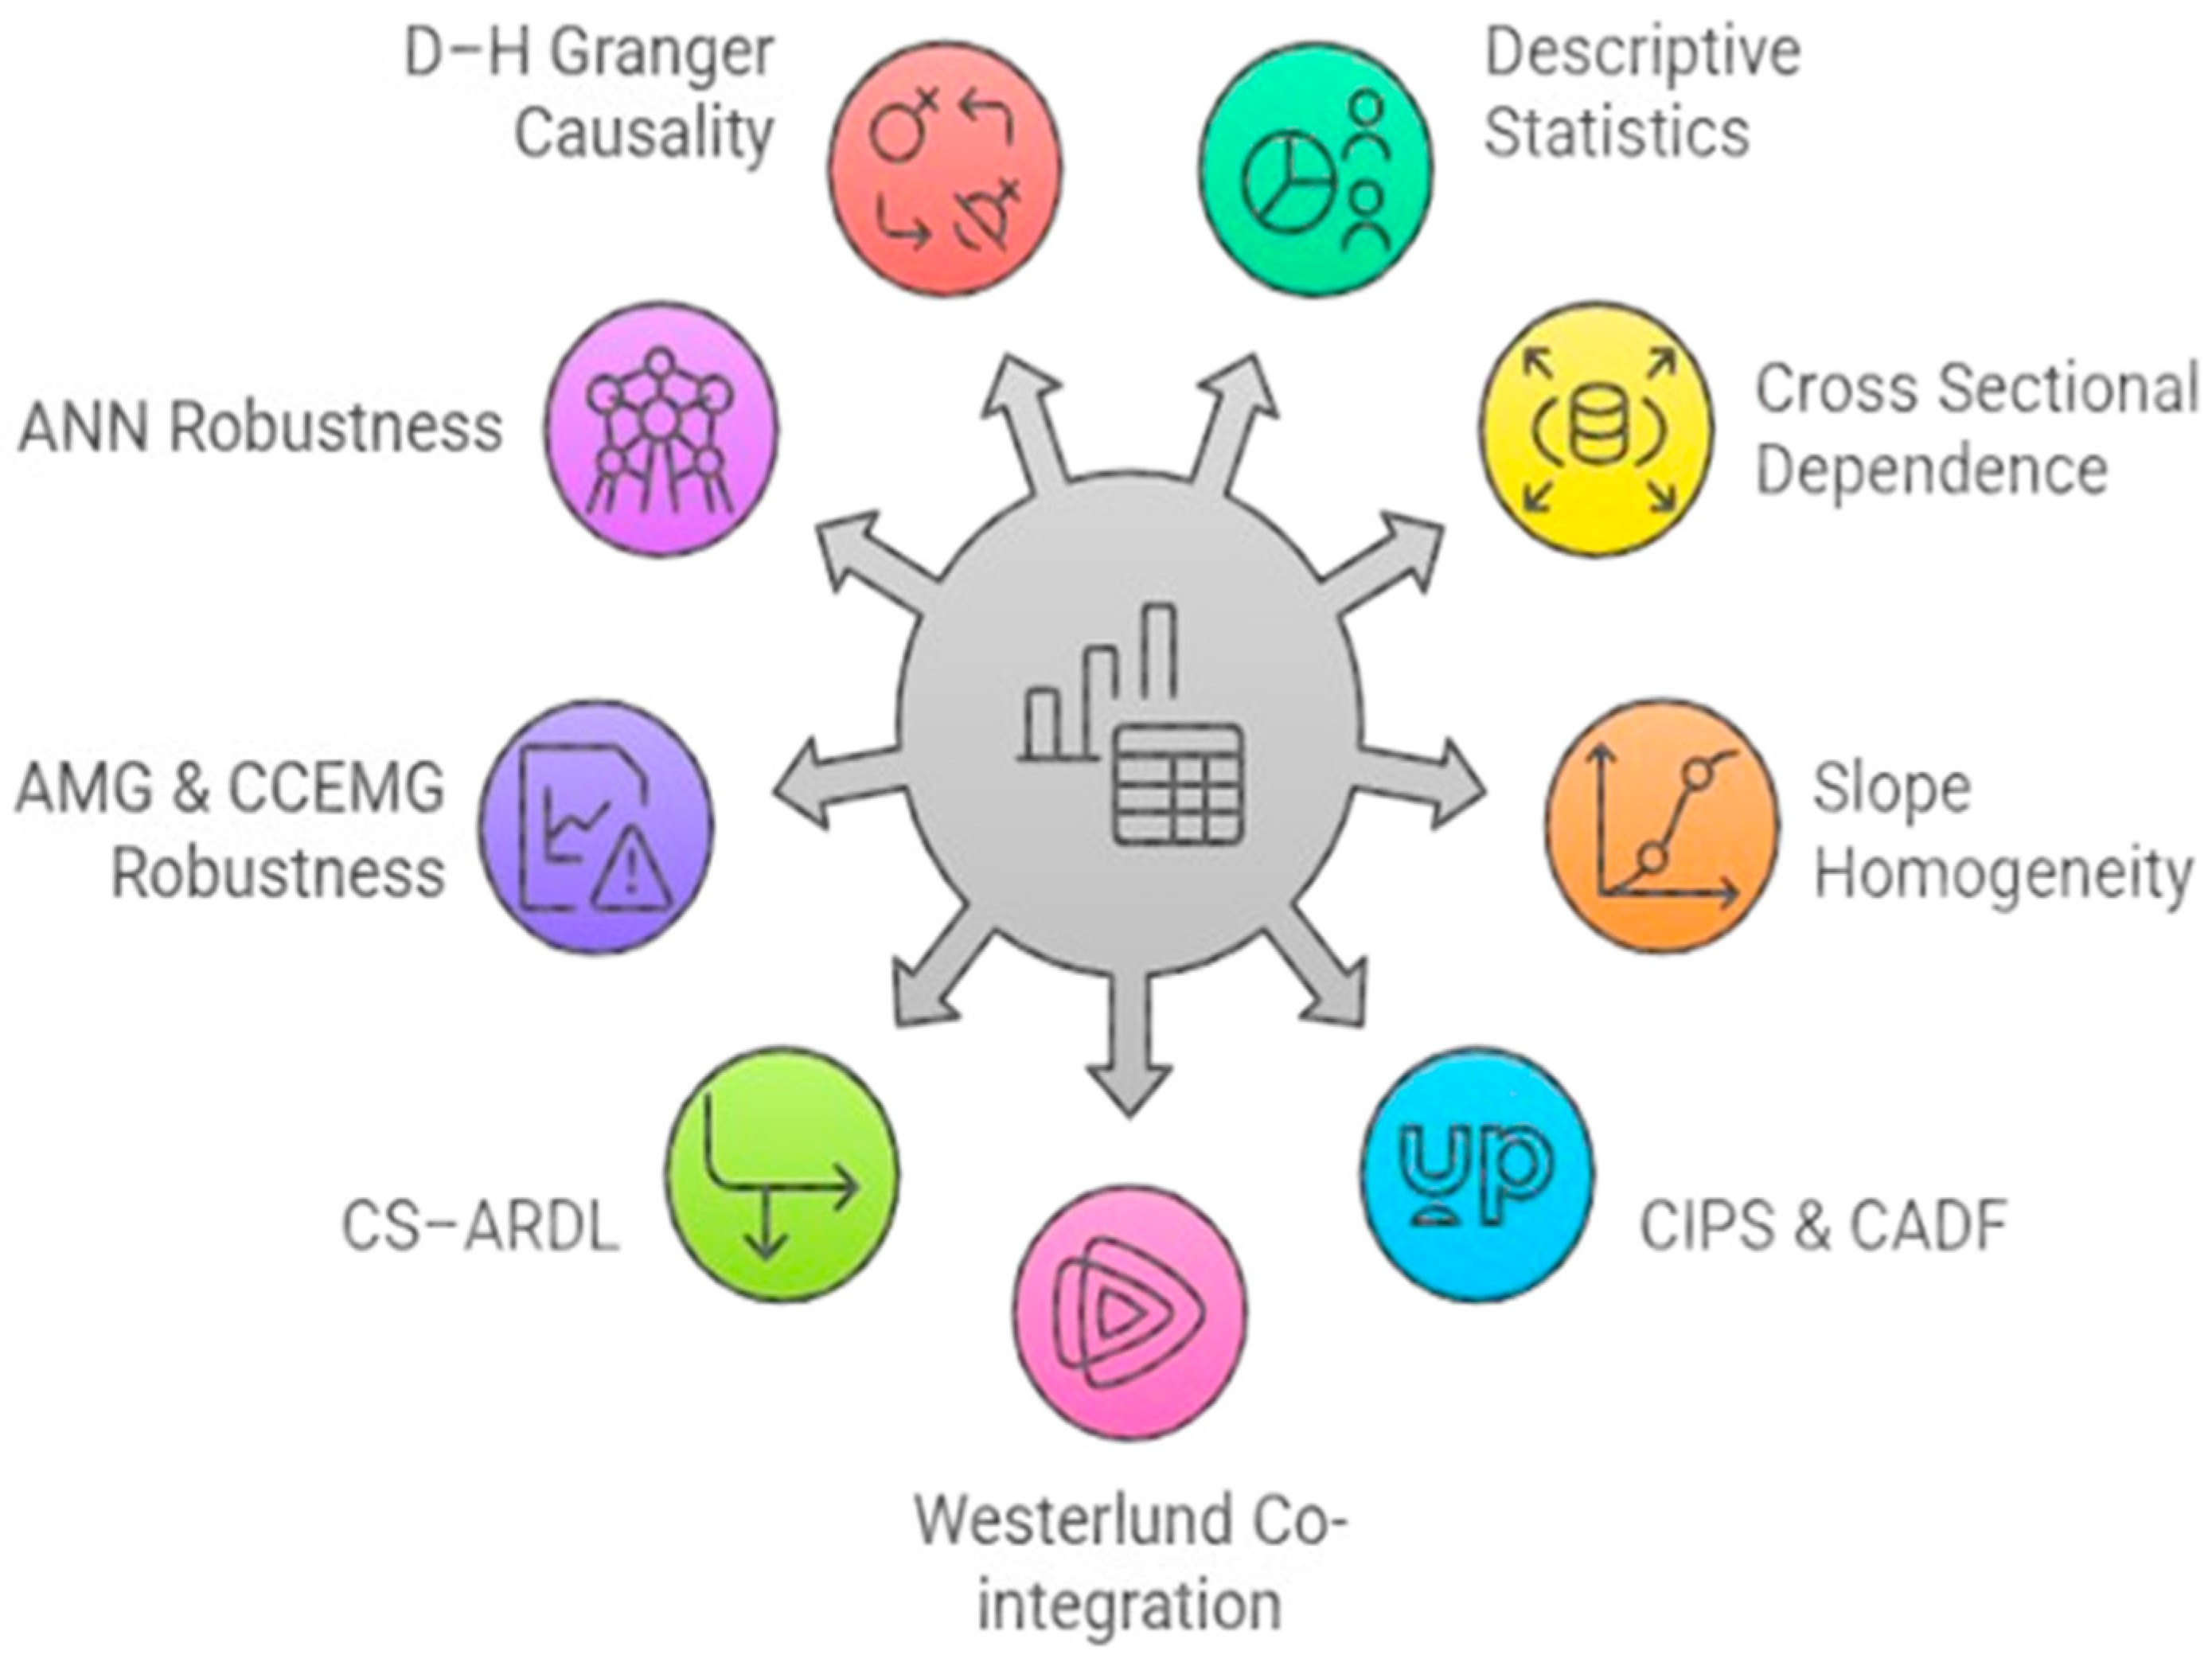
After performing the pre-requisite tests, including CD, slope homogeneity, unit root, Westerlund co-integration and AIC/BIC, the next stage is to evaluate the long-run and short-run impact of FNT, NRS, ENL, ECD and INQ on EF for G20 countries. As is evident from the results of CD, slope test, and Westerlund co-integration test, there exist CD and SH among the data series, indicating that our dataset exhibits mixed co-integration and non-linear linkage. Due to mixed co-integration and the presence of CD and heterogeneity, the preferred regression method is CS-ARDL. The long- and short-run results of CS-ARDL have been shown in Table 8.
The findings indicate that NRS have a significant positive effect (0.1103, p < 0.01), implying that resource exploitation contributes to environmental pressure in the long run. Whereas ENL demonstrates a significant negative impact (−0.0664, p < 0.01), suggesting that stronger environmental regulations help mitigate environmental degradation. Furthermore, FNT also shows a negative and significant effect (−0.2539, p < 0.01), implying that advancements in financial technology contribute to environmental sustainability. ECD has a small but significant positive coefficient (0.0002, p < 0.01), suggesting that higher economic activity may intensify environmental pressure. Finally, INQ has a negative coefficient (−0.0324, p < 0.01), indicating that better governance contributes to environmental improvements. The ECT is negative (−0.1218, p < 0.01), confirming the model’s convergence to long-run equilibrium. In the short run, NRS maintains a positive effect (0.1509, p < 0.01), consistent with long-term findings. ENL remains negatively significant (−0.0220, p < 0.05), reinforcing its role in mitigating environmental degradation. FNT continues to exhibit negative effects (−0.0269, p < 0.05), though its magnitude is smaller than in the long run. ECD has a significant positive impact (0.0121, p < 0.05), indicating short-term economic activities contribute to environmental strain. INQ remains negatively associated (−0.0152, p < 0.05), implying its role in short-term environmental improvements. These results highlight both immediate and long-term dynamics of environmental sustainability determinants within the G20 context. The graphical representation of these findings is shown in Figure 7.
Furthermore, our study employs AMG and CCEMG techniques to validate the CS-ARDL findings, addressing issues such as CD, fractional integration, and slope heterogeneity in panel data. These second-generation methods are particularly useful for handling non-stationarity and unobserved common factors, enhancing the robustness of our analysis. Table 9 presents the results, showing that AMG and CCEMG confirm the CS-ARDL findings, reinforcing the reliability of our conclusions. Specifically, NRS and ECD exhibit a positive relationship with EF, while FNT, ENL, and INQ show an inverse relationship across all methods. However, slight variations in coefficient magnitudes between AMG, CCEMG, and CS-ARDL may arise due to differences in estimation techniques and their sensitivity to cross-sectional dependencies. These differences highlight the need for a nuanced interpretation of the results, ensuring that policy recommendations account for methodological variations. The consistent directional findings across all models emphasize the robustness of our conclusions and the necessity for targeted policies to balance economic development and sustainability in G20 countries.
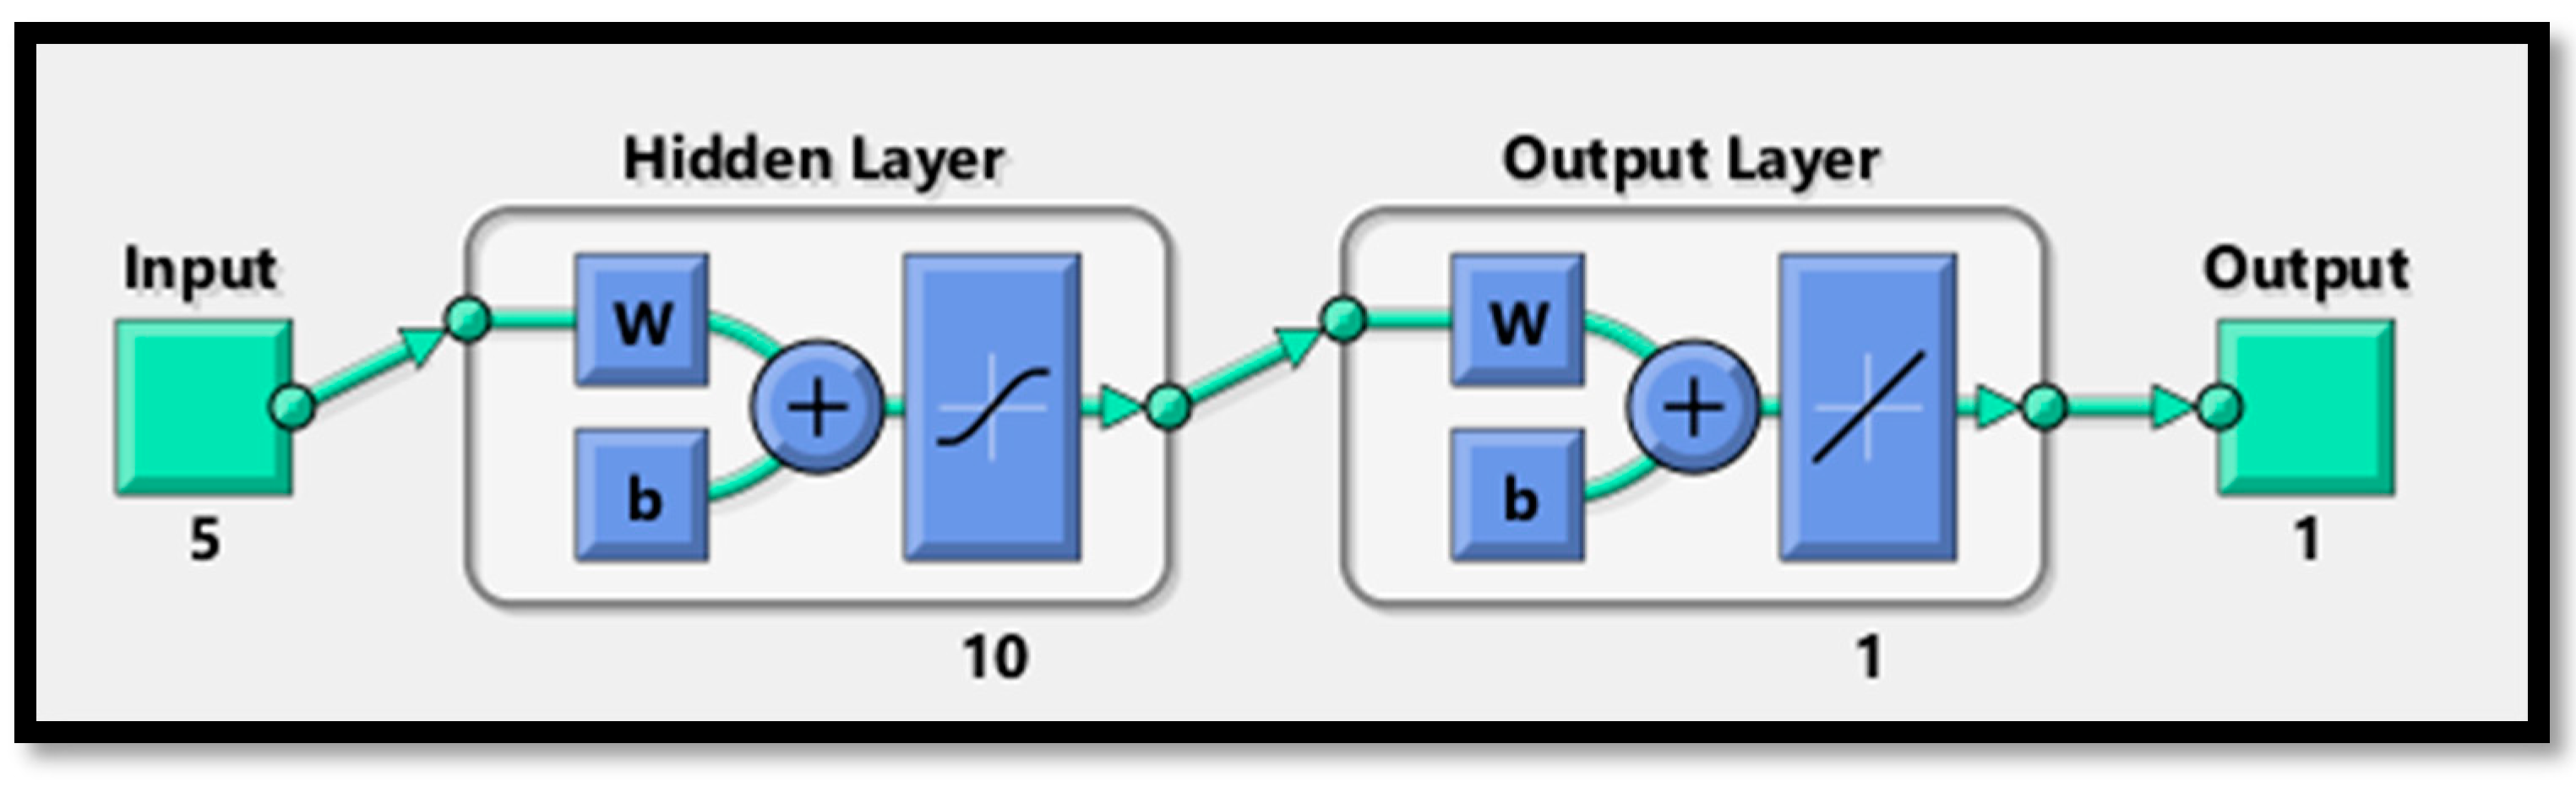
After assessing the durability of CS-ARDL using AMG and CCEMG, our study additionally employs the Artificial Neural Network (ANN) method to enhance the reliability of our results. In the field of artificial intelligence, ANN is a highly accurate and reliable approach for choosing study variables. Furthermore, we used ANN models to address the issue of improving prediction accuracy and identifying the most influential factors. We believe that using ANN may be an efficient and effective method for projecting the economies of the G20 nations, resulting in improved EF management. The research used an ANN model with 5 input variables, a hidden layer of 10 neurons, an output layer, and a solitary output variable. Figure 8 illustrates the network structure of the ANN model used in this study.
The dataset was divided into three subsets: a training set (70%), a validation set (15%), and a testing set (15%). The model was trained using the Levenberg–Marquardt backpropagation technique, ensuring efficient convergence and optimal weight adjustments. 
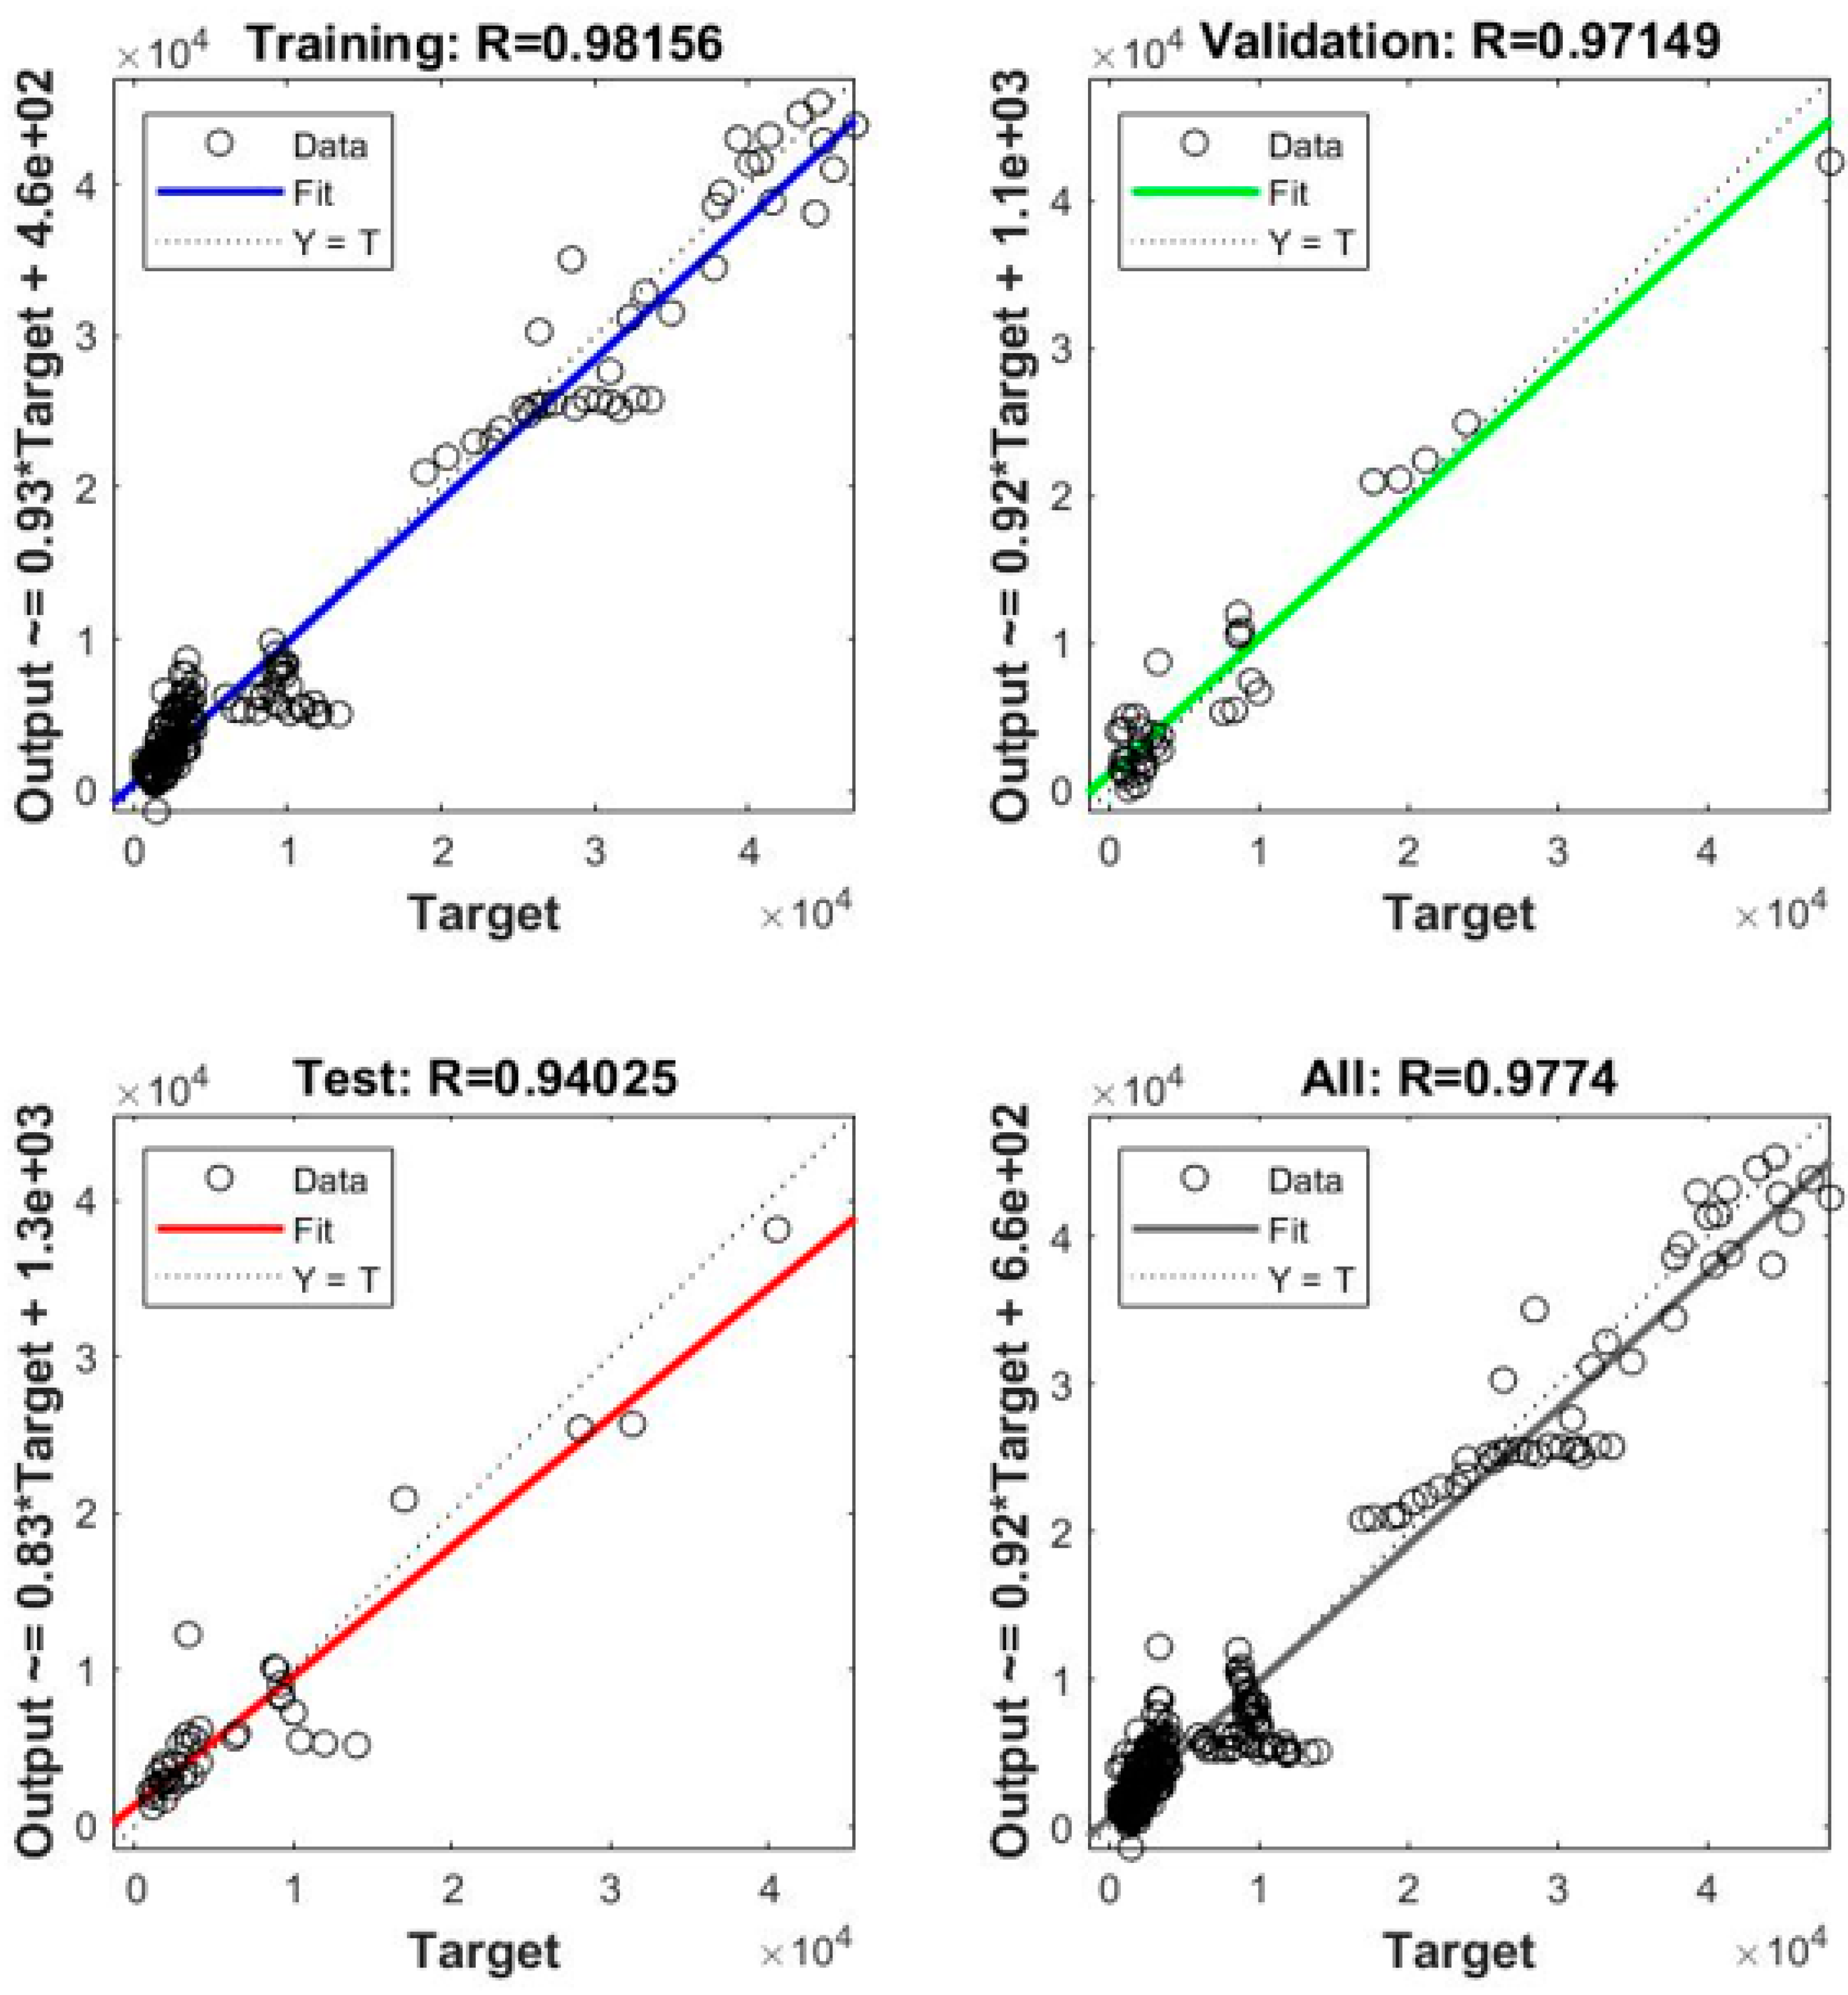
Figure 9 presents the ANN model’s predictive performance, demonstrating a strong correlation between predicted and actual values, as indicated by the high overall R value of 0.915. The high R value of 0.915 indicates strong predictive accuracy, suggesting that the ANN model effectively captures the underlying relationships between variables. This result reinforces the reliability of the model in predicting ecological outcomes based on input factors. Additionally, the consistency of high R values across training, validation, and test sets implies that the model generalizes well without significant overfitting. Compared to econometric models, which assume specific functional relationships, ANN offers a more flexible, data-driven approach that adapts to non-linear and complex interactions. This capability is particularly valuable in environmental studies, where multiple factors interact in dynamic and non-linear ways. The strong predictive performance of the ANN model underscores its potential as a complementary tool alongside traditional econometric methods, enhancing the study’s methodological depth.
Moreover, EF, NRS, FNT, ENL, ECD, and INQ are interrelated variables influencing environmental and economic dynamics in the G20 countries. However, correlation does not imply causation; therefore, we employ the Dumitrescu–Hurlin (D-H) causality test to determine the direction of these relationships. Table 10 presents the findings, highlighting both bidirectional and unidirectional causalities.
The bidirectional causality between NRS, ECD, and EF suggests a reinforcing cycle where natural resource utilization and economic development both drive and are influenced by environmental changes. This aligns with resource-based economic theories, which argue that environmental degradation results from resource exploitation while, in turn, resource availability is affected by ecological conditions. Similarly, the reciprocal causality between ECD and EF implies that economic complexity contributes to environmental impacts, while environmental degradation may, in turn, shape economic decisions through regulatory policies or sustainability-driven market shifts. Conversely, the unidirectional causality from FNT, ENL, and INQ to EF indicates that financial technologies, energy consumption, and institutional quality drive ecological changes, but not vice versa. This aligns with the argument that financial advancements, energy use patterns, and governance structures shape environmental policies and sustainability outcomes, but environmental factors alone do not necessarily alter these determinants in the short run. These findings underscore the complex interactions within G20 economies, emphasizing the need for policy interventions that consider both direct and feedback effects in environmental sustainability strategies. Figure 10 provides a visual representation of these relationships.

5. Discussion

Our findings indicate that natural resource extraction (NRS) significantly contributes to increasing the ecological footprint (EF) in G20 nations. The results from Table 8 reveal that in the long run, a 1% increase in NRS leads to a 0.11025% rise in EF, while in the short run, the increase is 0.1508%. Although these values may seem numerically small, their cumulative impact is substantial, given the scale of resource exploitation in G20 economies. For instance, countries heavily dependent on natural resources, such as Brazil (due to deforestation) and Saudi Arabia (due to oil extraction), experience severe environmental degradation. Our findings support H1, demonstrating that NRS adversely affects environmental sustainability in G20 nations. This aligns with the results of [117,118], though it contrasts with [119], which found differing outcomes for BRICS nations. In contrast, some studies suggest that resource-rich nations can mitigate these impacts by adopting sustainable extraction technologies and green energy transitions, a strategy that the G20 must further integrate. A key finding in this study is that effective environmental legislation (ENL) significantly reduces the ecological footprint in both the short and long run. A 1% increase in ENL leads to a 0.0664% decrease in EF in the long run and a 0.0219% reduction in the short run. The results of our study confirm H3, which states that effective environmental legislation (ENL) in the G20 strengthens environmental sustainability by encouraging green technology and cleaner production. Our findings are consistent with the findings of [28,58]. However, ref. [42] findings for MENA countries do not align with our study’s findings. These findings demonstrate that stronger regulatory frameworks play a crucial role in reducing the ecological footprint and promoting sustainable economic transitions. Furthermore, the practical significance of this effect can be observed in countries such as Germany, which has effectively utilized carbon taxes and renewable energy subsidies to limit ecological harm. These policies have led to a measurable decline in carbon emissions and resource depletion.
Similarly, financial technology (FNT) plays a crucial role in reducing EF. The results show that a 1% increase in FNT leads to a 0.2538% reduction in EF in the long run and a 0.0268% decrease in the short run. The results of our study validate H2, indicating that financial technology (FNT) improves environmental sustainability in G20 nations. Our findings highlight the role of FNT in facilitating green investments, enhancing energy efficiency, and promoting sustainable financial practices that contribute to lower ecological footprints. Furthermore, this result aligns with the findings of [57]. However, findings of [56] contradict ours outcomes. The impact of FNT is particularly notable in developing economies within the G20, where digital financial services have improved accessibility to green investments and low-carbon technologies. For instance, during the COVID-19 pandemic, financial technology facilitated a surge in digital transactions, reducing reliance on paper-based banking and transportation-related emissions. The strong negative relationship between FNT and EF indicates that expanding digital financial solutions, such as green bonds, carbon trading platforms, and blockchain-based sustainability tracking, could further mitigate environmental damage. Institutional quality (INQ) is another essential factor influencing environmental sustainability. Our study finds a 0.0323% reduction in EF for a 1% increase in INQ in the long run and a 0.0151% decrease in the short run. The findings support H4, confirming that higher institutional quality (INQ) in G20 nations enhances environmental sustainability by promoting clean energy adoption and ensuring equitable resource distribution. These results align with the findings of [120,121], reinforcing the critical role of strong institutions in driving sustainable environmental policies. Countries with higher institutional transparency and governance, such as Canada and Australia, have successfully leveraged their institutional frameworks to reduce pollution and enforce climate policies. The results highlight the need for G20 nations to strengthen governance mechanisms that promote accountability, transparency, and regulatory compliance to achieve long-term environmental goals. Economic development (ECD), on the other hand, is positively associated with EF, indicating that growth-driven expansion increases environmental burdens. A 1% rise in ECD leads to a 0.0002% increase in EF in the long run and a 0.01205% rise in the short run. Although the numerical values are small, the impact becomes significant when scaled across high-growth economies like China, India, and the U.S. Our findings confirm H5, indicating that economic development (ECD) negatively impacts environmental sustainability in G20 nations. This result aligns with the findings of [122], further emphasizing the environmental challenges associated with economic expansion. For instance, the expansion of fossil fuel-based industries and deforestation for infrastructure development are major contributors to EF in fast-growing economies. Therefore, sustainable development strategies—such as green economic policies, circular economy initiatives, and low-carbon industrial frameworks—are crucial for balancing economic progress with environmental conservation.
This study makes a significant contribution by presenting a triple helix approach to environmental sustainability in the G20, integrating environmental law, financial technology, and institutional quality as critical enablers of ecological resilience. Unlike previous research that largely focuses on economic growth and emissions, our study provides a more comprehensive perspective by highlighting the interplay between governance, technological advancement, and financial mechanisms. By contextualizing effect sizes and demonstrating their practical implications, we offer actionable insights for policymakers, advocating for stricter regulations, fintech-driven green financing, and governance reforms as essential tools to mitigate the ecological footprint. Our findings underscore that while economic growth and resource dependence pose environmental challenges, strategic policy interventions—rooted in law, technology, and governance—can pave the way for a greener and more sustainable future in the G20 and beyond.

6. Conclusions and Policy Implications

Environmental degradation (ED) remains a critical global challenge, threatening ecosystems, climate stability, and human well-being. This issue is particularly pressing within the G20, where industrialization and economic expansion exert immense pressure on natural resources and contribute to environmental stress. To assess environmental sustainability in G20 economies, this study examines the long-run and short-run relationships between EF and key determinants, including NRS, FNT, ENL, INQ, ECD, using data from 2000 to 2022.
Employing the CS-ARDL approach, we establish that ECD and NRS significantly increase EF in both the long and short run, indicating that economic expansion and resource extraction contribute to environmental degradation. Conversely, FNT, ENL, and INQ demonstrate a negative association with EF, suggesting their role in mitigating ecological pressures. Robustness checks using MG and CCEMG confirm these relationships, and the ANN model further strengthens the reliability of our findings. The Dumitrescu–Hurlin causality test identifies bi-directional causality between NRS and ECD, reinforcing the interconnected nature of economic growth and resource utilization, while unidirectional causality from FNT, ENL, and INQ to EF highlights their independent influence on sustainability.
While these findings highlight pathways to reducing environmental footprints, they also expose the inherent tensions between economic growth and sustainability. Policymakers must navigate trade-offs between resource-driven economic expansion and ecological preservation. For instance, while promoting industrialization fosters economic development, it simultaneously amplifies environmental pressures. Similarly, fintech and institutional improvements can enhance sustainability, yet their effectiveness may vary depending on regulatory frameworks and economic structures. These findings contribute to the theoretical discourse by underscoring the dual role of economic development and natural resource exploitation in shaping environmental outcomes. The study extends the sustainability literature by demonstrating how fintech and institutional factors can counterbalance the ecological footprint driven by economic and resource-intensive activities. Furthermore, the results align with ecological modernization theory, which posits that technological and institutional advancements can facilitate environmental improvements despite economic expansion. By integrating fintech as a transformative force, this research broadens existing perspectives on the digital economy’s potential role in sustainability transitions within industrialized economies.
Moreover, effective policy interventions are crucial for balancing economic growth with environmental sustainability in the G20 nations. Given the diverse development stages, institutional frameworks, and ecological challenges across these countries, tailored strategies are essential. Policies should focus on sustainable resource management, green financial innovations, stricter environmental regulations, and institutional transparency to mitigate ecological degradation while fostering long-term economic resilience.
  • Since NRS positively impacts EF, implementing strict resource management, promoting resource-efficient technologies, and incentivizing alternative industries can help mitigate environmental degradation.
  • Given that FNT negatively influences EF, fostering green fintech solutions, integrating sustainable finance mechanisms, and expanding digital financial tools can support environmental sustainability.
  • Because ENL reduces EF, strengthening environmental laws, ensuring strict enforcement, and integrating market-based incentives will drive sustainable practices.
  • Considering that INQ lowers EF, enhancing governance, reducing corruption, and promoting institutional transparency can improve environmental policies and resource management.
  • As ECD contributes to EF, balancing economic growth with sustainability through investments in green technologies, renewable energy, and circular economy practices is necessary.
  • Recognizing the diversity among G20 nations, policy strategies should be tailored—developed economies can spearhead green innovations, while emerging economies should prioritize capacity-building and policy reforms for sustainable development.
Although this study provides a comprehensive analysis of the relationships among FNT, ENL, NRS, ECD, INQ, and EF within G20 countries, certain limitations present opportunities for further research. Future studies could explore additional factors influencing environmental sustainability, such as the digital economy, technological forecasting, social change, economic complexity, tourism, net savings, and human capital, particularly in relation to EF and biocapacity. Moreover, expanding the scope beyond G20 to include regions such as CAREC, ASEAN, APEC, SAARC, GCC, and OPEC could offer comparative insights into the impact of economic variables on environmental outcomes. Extending the study period beyond 2000–2022 would also allow for assessing long-term trends and policy shifts. Methodologically, future research could employ alternative techniques like Driscoll-Kraay Standard Errors, MMQR, Dynamic Common Correlated Effects, Generalized Method of Moments, and Panel Smooth Transition Regression to enhance robustness. Additionally, multi-model approaches could complement single-model frameworks, leading to more comprehensive findings. Addressing these gaps will contribute to a deeper understanding of environmental sustainability and inform more targeted policy interventions.

Author Contributions

Conceptualization, H.Z.; software, H.Z.; validation, H.Z.; formal analysis, H.Z.; investigation, H.Z.; resources, H.Z.; data curation, H.Z.; writing—review and editing, H.Z.; visualization, H.Z.; supervision, H.Z.; project administration, H.Z. Methodology, A.P.; validation, A.P.; writing—original draft preparation, A.P.; writing—review and editing, A.P. All authors have read and agreed to the published version of the manuscript.

Funding

This research received no external funding.

Institutional Review Board Statement

Not applicable.

Informed Consent Statement

Not applicable.

Data Availability Statement

Data will be available upon request.

Conflicts of Interest

The authors declare no conflicts of interest.

Abbreviations

AbbreviationFull Form
NRSNatural resources
ENLEnvironmental law
FNTFintech
EFEcological footprint
ECDEconomic development
INQInstitutional quality
ANNArtificial neural network
AMGAugmented Mean Group
CCEMGCommon Correlated Effects Mean Group
CS-ARDL Cross-Sectional Autoregressive Distributed Lag
CIPSCross-Sectionally Augmented IPS
CADFCross-Sectional Augmented Dickey–Fuller
SDSustainable development
EDEnvironmental degradation
PCAPrincipal component analysis
GFNGlobal footprint network
WDIWorld development indicators
WGIWorld governance indicators
OECD Organization for Economic Co-operation and Development
CDCross-sectional dependence
SHSlope heterogeneity

References

  1. Apergis, N.; Garćıa, C. Environmentalism in the EU-28 Context: The Impact of Governance Quality on Environmental Energy Efficiency. Environ. Sci. Pollut. Res. 2019, 26, 37012–37025. [Google Scholar] [CrossRef]
  2. Zhao, S.; Zhang, L.; Peng, L.; Zhou, H.; Hu, F. Enterprise Pollution Reduction through Digital Transformation? Evidence from Chinese Manufacturing Enterprises. Technol. Soc. 2024, 77, 102520. [Google Scholar] [CrossRef]
  3. Di Santo, N.; Russo, I.; Sisto, R. Climate Change and Natural Resource Scarcity: A Literature Review on Dry Farming. Land 2022, 11, 2102. [Google Scholar] [CrossRef]
  4. Shrinkhal, R. Economics, Technology, and Environmental Protection. In Phytomanagement of Polluted Sites: Market Opportunities in Sustainable Phytoremediation; Elsevier: Amsterdam, The Netherlands, 2019; ISBN 9780128139127. [Google Scholar]
  5. United Nations. What Are the Sustainable Development Goals? United Nations Development Program. 2019. Available online: https://www.undp.org/sustainable-development-goals (accessed on 20 December 2024).
  6. Xi, X.; Xi, B.; Miao, C.; Yu, R.; Xie, J.; Xiang, R.; Hu, F. Factors Influencing Technological Innovation Efficiency in the Chinese Video Game Industry: Applying the Meta-Frontier Approach. Technol. Forecast. Soc. Change 2022, 178, 121574. [Google Scholar] [CrossRef]
  7. Saqib, N.; Ozturk, I.; Usman, M. Investigating the Implications of Technological Innovations, Financial Inclusion, and Renewable Energy in Diminishing Ecological Footprints Levels in Emerging Economies. Geosci. Front. 2023, 14, 101667. [Google Scholar] [CrossRef]
  8. Xu, A.; Siddik, A.B.; Sobhani, F.A.; Rahman, M.M. Driving Economic Success: Fintech, Tourism, FDI, and Digitalization in the Top 10 Tourist Destinations. Humanit. Soc. Sci. Commun. 2024, 11, 1–11. [Google Scholar] [CrossRef]
  9. Chodor, T. The G-20 since the Global Financial Crisis: Neither Hegemony nor Collectivism. Glob. Gov. 2021, 23, 205–223. [Google Scholar] [CrossRef]
  10. Liu, T.; Imran, A. Green Economy Advancement: Evaluating the Role of Digitalization, Technological Innovation, and Natural Resources in Shaping Environmental Quality Amid Globalizations. Sustainability 2024, 16, 10673. [Google Scholar] [CrossRef]
  11. Eufrasio Espinosa, R.M.; Lenny Koh, S.C. Forecasting the Ecological Footprint of G20 Countries in the next 30 Years. Sci. Rep. 2024, 14, 1–13. [Google Scholar] [CrossRef]
  12. Xu, A.; Wang, W.; Zhu, Y. Does Smart City Pilot Policy Reduce CO2 Emissions from Industrial Firms? Insights from China. J. Innov. Knowl. 2023, 8, 100367. [Google Scholar] [CrossRef]
  13. Qiu, L.; Yu, R.; Hu, F.; Zhou, H.; Hu, H. How Can China’s Medical Manufacturing Listed Firms Improve Their Technological Innovation Efficiency? An Analysis Based on a Three-Stage DEA Model and Corporate Governance Configurations. Technol. Forecast. Soc. Change 2023, 194, 122684. [Google Scholar] [CrossRef]
  14. Zhao, S.; Guan, Y.; Zhou, H.; Hu, F. Making Digital Technology Innovation Happen: The Role of the CEO’s Information Technology Backgrounds. Econ. Model. 2024, 140, 106866. [Google Scholar] [CrossRef]
  15. McDowell, N. Ecological Footprint Forecasts Face Sceptical Challenge. Nature 2002, 419, 656. [Google Scholar] [CrossRef]
  16. Dasgupta, P.; Dasgupta, A.; Barrett, S. Population, Ecological Footprint and the Sustainable Development Goals. Environ. Resour. Econ. 2021, 84, 659–675. [Google Scholar] [CrossRef]
  17. Wackernagel, M.; Hanscom, L.; Lin, D. Making the Sustainable Development Goals Consistent with Sustainability. Front. Energy Res. 2017, 5, 18. [Google Scholar] [CrossRef]
  18. Gabbi, G.; Matthias, M.; Patrizi, N.; Pulselli, F.M.; Bastianoni, S. The Biocapacity Adjusted Economic Growth. Developing a New Indicator. Ecol. Indic. 2021, 122, 107318. [Google Scholar] [CrossRef]
  19. Kutlar, A.; Gulmez, A.; Kabasakal, A.; Kutlar, S. Ecological Footprint, Energy Usage, and Economic Progress Relationship: The MINT Countries. Econ. Res. 2022, 35, 4457–4480. [Google Scholar] [CrossRef]
  20. Xu, X.; Liu, Z.; Liu, W.; Pei, C.; Wu, X.; Nie, Z. A Sustainable Development Benchmarking Framework for Energy Companies Based on Topic Mining and Knowledge Graph: The Case of Oil and Gas Industry. Renew. Sustain. Energy Rev. 2024, 196, 114350. [Google Scholar] [CrossRef]
  21. Nansai, K.; Tohno, S.; Chatani, S.; Kanemoto, K.; Kagawa, S.; Kondo, Y.; Takayanagi, W.; Lenzen, M. Consumption in the G20 Nations Causes Particulate Air Pollution Resulting in Two Million Premature Deaths Annually. Nat. Commun. 2021, 12, 6286. [Google Scholar] [CrossRef]
  22. Bhattacharya, H. Climate Justice Implications of the Relationship between Economic Inequality and Carbon Emissions in India. In Climate Justice in India; Cambridge University Press: Cambridge, UK, 2022; pp. 98–114. [Google Scholar]
  23. O’Neill, D.W.; Fanning, A.L.; Lamb, W.F.; Steinberger, J.K. A Good Life for All within Planetary Boundaries. Nat. Sustain. 2018, 1, 88–95. [Google Scholar] [CrossRef]
  24. Fang, K. Moving Away from Sustainability. Nat. Sustain. 2022, 5, 5–6. [Google Scholar] [CrossRef]
  25. Kitzes, J.; Wackernagel, M. Answers to Common Questions in Ecological Footprint Accounting. Ecol. Indic. 2009, 9, 812–817. [Google Scholar] [CrossRef]
  26. Wang, J.; Dong, K. What Drives Environmental Degradation? Evidence from 14 Sub-Saharan African Countries. Sci. Total Environ. 2019, 656, 165–173. [Google Scholar] [CrossRef]
  27. Borucke, M.; Moore, D.; Cranston, G.; Gracey, K.; Iha, K.; Larson, J.; Lazarus, E.; Morales, J.C.; Wackernagel, M.; Galli, A. Accounting for Demand and Supply of the Biosphere’s Regenerative Capacity: The National Footprint Accounts’ Underlying Methodology and Framework. Ecol. Indic. 2013, 24, 518–533. [Google Scholar] [CrossRef]
  28. Ahmed, Z.; Ahmad, M.; Rjoub, H.; Kalugina, O.A.; Hussain, N. Economic Growth, Renewable Energy Consumption, and Ecological Footprint: Exploring the Role of Environmental Regulations and Democracy in Sustainable Development. Sustain. Dev. 2022, 30, 595–605. [Google Scholar] [CrossRef]
  29. Li, T.; Yu, L.; Ma, Y.; Duan, T.; Huang, W.; Zhou, Y.; Jin, D.; Li, Y.; Jiang, T. Carbon Emissions of 5G Mobile Networks in China. Nat. Sustain. 2023, 6, 1620–1631. [Google Scholar] [CrossRef]
  30. Tao, R.; Su, C.W.; Naqvi, B.; Rizvi, S.K.A. Can Fintech Development Pave the Way for a Transition towards Low-Carbon Economy: A Global Perspective. Technol. Forecast. Soc. Change 2022, 174, 121278. [Google Scholar] [CrossRef]
  31. Pizzi, S.; Corbo, L.; Caputo, A. Fintech and SMEs Sustainable Business Models: Reflections and Considerations for a Circular Economy. J. Clean. Prod. 2021, 281, 125217. [Google Scholar] [CrossRef]
  32. Li, T.; Li, Y. Artificial Intelligence for Reducing the Carbon Emissions of 5G Networks in China. Nat. Sustain. 2023, 6, 1522–1523. [Google Scholar] [CrossRef]
  33. Beier, G.; Ullrich, A.; Niehoff, S.; Reißig, M.; Habich, M. Industry 4.0: How It Is Defined from a Sociotechnical Perspective and How Much Sustainability It Includes—A Literature Review. J. Clean. Prod. 2020, 259, 120856. [Google Scholar]
  34. Nenavath, S. Impact of Fintech and Green Finance on Environmental Quality Protection in India: By Applying the Semi-Parametric Difference-in-Differences (SDID). Renew. Energy 2022, 193, 913–919. [Google Scholar] [CrossRef]
  35. Li, C.Z.; Razzaq, A.; Ozturk, I.; Sharif, A. Natural Resources, Financial Technologies, and Digitalization: The Role of Institutional Quality and Human Capital in Selected OECD Economies. Resour. Policy 2023, 81, 103362. [Google Scholar] [CrossRef]
  36. Chen, Y.; Li, Q.; Liu, J. Innovating Sustainability. J. Organ. End User Comput. 2024, 36, 1–22. [Google Scholar] [CrossRef]
  37. Wang, T.; Ding, Y.; Gao, K.; Sun, R.; Wen, C.; Yan, B. Toward Sustainable Development: Unleashing the Mechanism Among International Technology Spillover, Institutional Quality, and Green Innovation Capability. Front. Psychol. 2022, 13, 912355. [Google Scholar] [CrossRef]
  38. Wang, L.; Vo, X.V.; Shahbaz, M.; Ak, A. Globalization and Carbon Emissions: Is There Any Role of Agriculture Value-Added, Financial Development, and Natural Resource Rent in the Aftermath of COP21? J. Environ. Manag. 2020, 268, 110712. [Google Scholar] [CrossRef]
  39. Hu, F.; Qiu, L.; Xiang, Y.; Wei, S.; Sun, H.; Hu, H.; Weng, X.; Mao, L.; Zeng, M. Spatial Network and Driving Factors of Low-Carbon Patent Applications in China from a Public Health Perspective. Front. Public Health 2023, 11, 1121860. [Google Scholar] [CrossRef]
  40. Delahaye, J.-P. Cryptocurrencies and Blockchains. Inference Int. Rev. Sci. 2016, 4, 67–104. [Google Scholar] [CrossRef]
  41. Murshed, M.; Rahman, M.A.; Alam, M.S.; Ahmad, P.; Dagar, V. The Nexus between Environmental Regulations, Economic Growth, and Environmental Sustainability: Linking Environmental Patents to Ecological Footprint Reduction in South Asia. Environ. Sci. Pollut. Res. 2021, 28, 49967–49988. [Google Scholar] [CrossRef]
  42. Omojolaibi, J.A.; Nathaniel, S.P. Assessing the Potency of Environmental Regulation in Maintaining Environmental Sustainability in MENA Countries: An Advanced Panel Data Estimation. J. Public Aff. 2022, 22, e2526. [Google Scholar] [CrossRef]
  43. Bashir, M.F.; MA, B.; Bashir, M.A.; Radulescu, M.; Shahzad, U. Investigating the Role of Environmental Taxes and Regulations for Renewable Energy Consumption: Evidence from Developed Economies. Econ. Res. 2022, 35, 1262–1284. [Google Scholar] [CrossRef]
  44. Kruse, T.; Dechezleprêtre, A.; Saffar, R.; Robert, L. Measuring Environmental Policy Stringency in OECD Countries: An Update of the OECD Composite EPS Indicator. OECD Econ. Dep. Work. Pap. 2022, 1703, 1–56. [Google Scholar]
  45. Gupta, M.; Saini, S.; Sahoo, M. Determinants of Ecological Footprint and PM2.5: Role of Urbanization, Natural Resources and Technological Innovation. Environ. Chall. 2022, 7, 100467. [Google Scholar] [CrossRef]
  46. Shyu, C.W. A Framework for ‘Right to Energy’ to Meet UN SDG7: Policy Implications to Meet Basic Human Energy Needs, Eradicate Energy Poverty, Enhance Energy Justice, and Uphold Energy Democracy. Energy Res. Soc. Sci. 2021, 79, 102199. [Google Scholar] [CrossRef]
  47. Xie, J.; Tian, J.; Hu, Y.; Wang, Q.; Dai, Z. Imported Intermediate Goods, Intellectual Property Protection, and Innovation in Chinese Manufacturing Firms. Econ. Model. 2025, 144, 106960. [Google Scholar] [CrossRef]
  48. Sharif, A.; Godil, D.I.; Xu, B.; Sinha, A.; Rehman Khan, S.A.; Jermsittiparsert, K. Revisiting the Role of Tourism and Globalization in Environmental Degradation in China: Fresh Insights from the Quantile ARDL Approach. J. Clean. Prod. 2020, 272, 122906. [Google Scholar] [CrossRef]
  49. Zafar, M.W.; Shahbaz, M.; Hou, F.; Sinha, A. From Nonrenewable to Renewable Energy and Its Impact on Economic Growth: The Role of Research & Development Expenditures in Asia-Pacific Economic Cooperation Countries. J. Clean. Prod. 2019, 212, 1166–1178. [Google Scholar] [CrossRef]
  50. Liu, J.; Kim Loan, V.T.; Mousa, S.; Ali, A.; Muda, I.; Cong, P.T. Sustainability and Natural Resources Management in Developed Countries: The Role of Financial Inclusion and Human Development. Resour. Policy 2023, 80, 103143. [Google Scholar] [CrossRef]
  51. Caetano, R.V.; Marques, A.C. Could Energy Transition Be a Game Changer for the Transfer of Polluting Industries from Developed to Developing Countries? An Application of Game Theory. Struct. Change Econ. Dyn. 2023, 65, 351–363. [Google Scholar] [CrossRef]
  52. Zhang, S.; Li, X.; Zhang, C.; Luo, J.; Cheng, C.; Ge, W. Measurement of Factor Mismatch in Industrial Enterprises with Labor Skills Heterogeneity. J. Bus. Res. 2023, 158, 113643. [Google Scholar] [CrossRef]
  53. Wang, R.; Liu, J.; Luo, H. Fintech Development and Bank Risk Taking in China. Eur. J. Financ. 2021, 27, 397–418. [Google Scholar] [CrossRef]
  54. Karim, S.; Naz, F.; Naeem, M.A.; Vigne, S.A. Is FinTech Providing Effective Solutions to Small and Medium Enterprises (SMEs) in ASEAN Countries? Econ. Anal. Policy 2022, 75, 335–344. [Google Scholar] [CrossRef]
  55. Rodriguez-Crespo, E.; Picatoste, X. Trade Facilitation and SDGs: Role of Infrastructure, Institutions, and ICT. In Industry, Innovation and Infrastructure; Springer International Publishing: Cham, Switzerland, 2021. [Google Scholar]
  56. Lisha, L.; Mousa, S.; Arnone, G.; Muda, I.; Huerta-Soto, R.; Shiming, Z. Natural Resources, Green Innovation, Fintech, and Sustainability: A Fresh Insight from BRICS. Resour. Policy 2023, 80, 103119. [Google Scholar] [CrossRef]
  57. Udeagha, M.C.; Muchapondwa, E. Striving for the United Nations (UN) Sustainable Development Goals (SDGs) in BRICS Economies: The Role of Green Finance, Fintech, and Natural Resource Rent. Sustain. Dev. 2023, 31, 3657–3672. [Google Scholar] [CrossRef]
  58. Li, J.; Dong, K.; Wang, K.; Dong, X. How Does Natural Resource Dependence Influence Carbon Emissions? The Role of Environmental Regulation. Resour. Policy 2023, 80, 103268. [Google Scholar] [CrossRef]
  59. Dilek, Ş.; Furuncu, Y. Bitcoin Mining and Its Environmental Effects. İktisadi Ve İdari Bilim. Derg. 2018, 73, 136–159. [Google Scholar]
  60. Zhang, S.; Zhang, C.; Su, Z.; Zhu, M.; Ren, H. New Structural Economic Growth Model and Labor Income Share. J. Bus. Res. 2023, 160, 113644. [Google Scholar] [CrossRef]
  61. Dai, Y.; Tong, X.; Jia, X. Executives’ Legal Expertise and Corporate Innovation. Corp. Gov. An Int. Rev. 2024, 32, 954–983. [Google Scholar] [CrossRef]
  62. Wu, Q. From Bits to Emissions: How FinTech Benefits Climate Resilience? Empir. Econ. 2024, 67, 2009–2037. [Google Scholar] [CrossRef]
  63. Schröder, E.; Storm, S. Economic Growth and Carbon Emissions: The Road to “Hothouse Earth” Is Paved with Good Intentions. Int. J. Polit. Econ. 2020, 49, 153–173. [Google Scholar] [CrossRef]
  64. Luo, S.; Mabrouk, F. Nexus between Natural Resources, Globalization and Ecological Sustainability in Resource-Rich Countries: Dynamic Role of Green Technology and Environmental Regulation. Resour. Policy 2022, 79, 103027. [Google Scholar] [CrossRef]
  65. Sharif, A.; Kartal, M.T.; Bekun, F.V.; Pata, U.K.; Foon, C.L.; Kılıç Depren, S. Role of Green Technology, Environmental Taxes, and Green Energy towards Sustainable Environment: Insights from Sovereign Nordic Countries by CS-ARDL Approach. Gondwana Res. 2023, 117, 194–206. [Google Scholar] [CrossRef]
  66. Hao, L.N.; Umar, M.; Khan, Z.; Ali, W. Green Growth and Low Carbon Emission in G7 Countries: How Critical the Network of Environmental Taxes, Renewable Energy and Human Capital Is? Sci. Total Environ. 2021, 752, 141853. [Google Scholar] [CrossRef]
  67. Shahzad, U. Environmental Taxes, Energy Consumption, and Environmental Quality: Theoretical Survey with Policy Implications. Environ. Sci. Pollut. Res. 2020, 27, 24848–24862. [Google Scholar] [CrossRef]
  68. Zhong, S.; Su, B. Assessing Factors Driving International Trade in Natural Resources 1995–2018. J. Clean. Prod. 2023, 389, 136110. [Google Scholar] [CrossRef]
  69. Aziz, N.; Hossain, B.; Lamb, L. Does Green Policy Pay Dividends? Env. Econ. Policy Stud. 2021, 24, 147–172. [Google Scholar] [CrossRef]
  70. Arvin, M.B.; Lew, B. Does Democracy Affect Environmental Quality in Developing Countries? Appl. Econ. 2011, 43, 1151–1160. [Google Scholar] [CrossRef]
  71. Satrovic, E.; Ahmad, M.; Muslija, A. Does Democracy Improve Environmental Quality of GCC Region? Analysis Robust to Cross-Section Dependence and Slope Heterogeneity. Environ. Sci. Pollut. Res. 2021, 28, 62927–62942. [Google Scholar] [CrossRef]
  72. Goel, R.K.; Herrala, R.; Mazhar, U. Institutional Quality and Environmental Pollution: MENA Countries versus the Rest of the World. Econ. Syst. 2013, 37, 508–521. [Google Scholar] [CrossRef]
  73. Fatima, N.; Zheng, Y.; Guohua, N. Globalization, Institutional Quality, Economic Growth and CO2 Emission in OECD Countries: An Analysis with GMM and Quantile Regression. Front. Environ. Sci. 2022, 10, 967050. [Google Scholar] [CrossRef]
  74. Adedoyin, F.F.; Bekun, F.V.; Eluwole, K.K.; Adams, S. Modelling the Nexus between Financial Development, FDI, and CO2 Emission: Does Institutional Quality Matter? Energies 2022, 15, 7464. [Google Scholar] [CrossRef]
  75. Abid, M. Impact of Economic, Financial, and Institutional Factors on CO2 Emissions: Evidence from Sub-Saharan Africa Economies. Util. Policy 2016, 41, 85–94. [Google Scholar] [CrossRef]
  76. Jianguo, D.; Ali, K.; Alnori, F.; Ullah, S. The Nexus of Financial Development, Technological Innovation, Institutional Quality, and Environmental Quality: Evidence from OECD Economies. Env. Sci. Pollut. Res. 2022, 2938, 58179–58200. [Google Scholar] [CrossRef]
  77. Hunjra, A.I.; Tayachi, T.; Chani, M.I.; Verhoeven, P.; Mehmood, A. The Moderating Effect of Institutional Quality on the Financial Development and Environmental Quality Nexus. Sustainability 2020, 12, 3805. [Google Scholar] [CrossRef]
  78. Salman, M.; Long, X.; Dauda, L.; Mensah, C.N. The Impact of Institutional Quality on Economic Growth and Carbon Emissions: Evidence from Indonesia, South Korea and Thailand. J. Clean. Prod. 2019, 241, 118331. [Google Scholar] [CrossRef]
  79. Azam, M.; Liu, L.; Ahmad, N. Impact of Institutional Quality on Environment and Energy Consumption: Evidence from Developing World. Environ. Dev. Sustain. 2021, 23, 1646–1667. [Google Scholar] [CrossRef]
  80. Dam, M.M.; Işık, C.; Ongan, S. The Impacts of Renewable Energy and Institutional Quality in Environmental Sustainability in the Context of the Sustainable Development Goals: A Novel Approach with the Inverted Load Capacity Factor. Environ. Sci. Pollut. Res. 2023, 30, 95394–95409. [Google Scholar] [CrossRef]
  81. Bernauer, T.; Koubi, V. Effects of Political Institutions on Air Quality. Ecol. Econ. 2009, 68, 1355–1365. [Google Scholar] [CrossRef]
  82. Gani, A. Fossil Fuel Energy and Environmental Performance in an Extended STIRPAT Model. J. Clean. Prod. 2021, 297, 126526. [Google Scholar] [CrossRef]
  83. Bhutta, U.S.; Tariq, A.; Farrukh, M.; Raza, A.; Iqbal, M.K. Green Bonds for Sustainable Development: Review of Literature on Development and Impact of Green Bonds. Technol. Forecast. Soc. Change 2022, 175, 121378. [Google Scholar] [CrossRef]
  84. Zhang, S.; Wu, Z.; Wang, Y.; Hao, Y. Fostering Green Development with Green Finance: An Empirical Study on the Environmental Effect of Green Credit Policy in China. J. Environ. Manage. 2021, 296, 113159. [Google Scholar] [CrossRef]
  85. Lee, H.S.; Chia, C.J.; Liew, P.X.; Lee, S.Y.; Har, W.M. The Heterogeneous Effect of Economic Growth on the Ecological Footprint in OECD Countries. In Proceedings of the IOP Conference Series: Earth and Environmental Science, Kufa, Iraq, 20–21 September 2023. [Google Scholar]
  86. Pata, U.K.; Hizarci, A.E. Investigating the Environmental Kuznets Curve in the Five Most Complex Countries: Insights from a Modified Ecological Footprint Model. Energy Environ. 2023, 34, 2990–3019. [Google Scholar] [CrossRef]
  87. Adebayo, T.S.; Pata, U.K.; Akadiri, S. Saint A Comparison of CO2 Emissions, Load Capacity Factor, and Ecological Footprint for Thailand’s Environmental Sustainability. Environ. Dev. Sustain. 2024, 26, 2203–2223. [Google Scholar] [CrossRef]
  88. Ali, Q.; Yaseen, M.R.; Anwar, S.; Makhdum, M.S.A.; Khan, M.T.I. The Impact of Tourism, Renewable Energy, and Economic Growth on Ecological Footprint and Natural Resources: A Panel Data Analysis. Resour. Policy 2021, 74, 102365. [Google Scholar] [CrossRef]
  89. Wang, N.; Zhu, H.; Guo, Y.; Peng, C. The Heterogeneous Effect of Democracy, Political Globalization, and Urbanization on PM2.5 Concentrations in G20 Countries: Evidence from Panel Quantile Regression. J. Clean. Prod. 2018, 194, 54–68. [Google Scholar] [CrossRef]
  90. Zhao, A.; Wang, J.; Sun, Z.; Guan, H. Environmental Taxes, Technology Innovation Quality and Firm Performance in China—A Test of Effects Based on the Porter Hypothesis. Econ Anal Policy 2022, 74, 309–325. [Google Scholar] [CrossRef]
  91. Emara, N. Asymmetric and Threshold Effects of Fintech on Poverty in SSA Countries. SSRN Electron. J. 2022, 50, 921–946. [Google Scholar] [CrossRef]
  92. Tan, Q.; Yasmeen, H.; Ali, S.; Ismail, H.; Zameer, H. Fintech Development, Renewable Energy Consumption, Government Effectiveness and Management of Natural Resources along the Belt and Road Countries. Resour. Policy 2023, 80, 103251. [Google Scholar] [CrossRef]
  93. Pesaran, M.H. General Diagnostic Tests for Cross-Sectional Dependence in Panels. Empir. Econ. 2021, 60, 13–50. [Google Scholar] [CrossRef]
  94. Qin, F.; Imran, A. Greening the Gulf: A Deep-Dive into the Synergy Between Natural Resources, Institutional Quality, Foreign Direct Investment, and Pathways to Environmental Sustainability. Sustainability 2024, 16, 11250. [Google Scholar] [CrossRef]
  95. Westerlund, J. Testing for Error Correction in Panel Data. Oxf. Bull. Econ. Stat. 2007, 69, 709–748. [Google Scholar] [CrossRef]
  96. Dumitrescu, E.I.; Hurlin, C. Testing for Granger Non-Causality in Heterogeneous Panels. Econ. Model. 2012, 29, 1450–1460. [Google Scholar] [CrossRef]
  97. Liu, J.; Murshed, M.; Chen, F.; Shahbaz, M.; Kirikkaleli, D.; Khan, Z. An Empirical Analysis of the Household Consumption-Induced Carbon Emissions in China. Sustain. Prod. Consum. 2021, 26, 943–957. [Google Scholar] [CrossRef]
  98. Nathaniel, S.P.; Murshed, M.; Bassim, M. The Nexus between Economic Growth, Energy Use, International Trade and Ecological Footprints: The Role of Environmental Regulations in N11 Countries. Energy Ecol. Environ. 2021, 6, 496–512. [Google Scholar] [CrossRef]
  99. Wang, A.; Rauf, A.; Ozturk, I.; Wu, J.; Zhao, X.; Du, H. The Key to Sustainability: In-Depth Investigation of Environmental Quality in G20 Countries through the Lens of Renewable Energy, Economic Complexity and Geopolitical Risk Resilience. J. Environ. Manage. 2024, 352, 120045. [Google Scholar] [CrossRef]
  100. Musah, M.; Kong, Y.; Mensah, I.A.; Antwi, S.K.; Donkor, M. The Connection between Urbanization and Carbon Emissions: A Panel Evidence from West Africa. Environ. Dev. Sustain. 2021, 23, 11525–11552. [Google Scholar] [CrossRef]
  101. Hashem Pesaran, M.; Yamagata, T. Testing Slope Homogeneity in Large Panels. J. Econom. 2008, 142, 50–93. [Google Scholar] [CrossRef]
  102. Cheng, Y.; Zeng, B.; Lin, W. Heterogenous Effects of Inclusive Digital Economy and Resource Distribution Mismatch on Corporate ESG Performance in China. Resour. Policy 2024, 92, 104973. [Google Scholar] [CrossRef]
  103. Bosah, P.C.; Li, S.; Ampofo, G.K.M. Natural Resource Rents and Financial Inclusion Nexus: Evidence from Africa. Resour. Policy 2024, 94, 105134. [Google Scholar] [CrossRef]
  104. Maddala, G.S.; Wu, S. A Comparative Study of Unit Root Tests with Panel Data and a New Simple Test. Oxf. Bull. Econ. Stat. 1999, 61, 631–652. [Google Scholar] [CrossRef]
  105. Choi, I. Unit Root Tests for Panel Data. J. Int. Money Financ. 2001, 20, 249–272. [Google Scholar] [CrossRef]
  106. Yunzhao, L. Modelling the Role of Eco Innovation, Renewable Energy, and Environmental Taxes in Carbon Emissions Reduction in E−7 Economies: Evidence from Advance Panel Estimations. Renew. Energy 2022, 190, 309–318. [Google Scholar] [CrossRef]
  107. Ali, S.; Yusop, Z.; Kaliappan, S.R.; Chin, L. Dynamic Common Correlated Effects of Trade Openness, FDI, and Institutional Performance on Environmental Quality: Evidence from OIC Countries. Environ. Sci. Pollut. Res. 2020, 27, 11671–11682. [Google Scholar] [CrossRef] [PubMed]
  108. Suki, N.M.; Suki, N.M.; Sharif, A.; Afshan, S. The Role of Logistics Performance for Sustainable Development in Top Asian Countries: Evidence from Advance Panel Estimations. Sustain. Dev. 2021, 29, 595–606. [Google Scholar] [CrossRef]
  109. Hussain, M.; Dogan, E. The Role of Institutional Quality and Environment-Related Technologies in Environmental Degradation for BRICS. J. Clean. Prod. 2021, 304, 127059. [Google Scholar] [CrossRef]
  110. Adedoyin, F.F.; Alola, A.A.; Bekun, F.V. The Nexus of Environmental Sustainability and Agro-Economic Performance of Sub-Saharan African Countries. Heliyon 2020, 6, e04878. [Google Scholar] [CrossRef]
  111. Li, J.; Imran, A. Sustainable Transitions: Navigating Green Technologies, Clean Energy, Economic Growth, and Human Capital for a Greener Future. Sustainability 2025, 17, 3446. [Google Scholar] [CrossRef]
  112. Eberhardt, M.; Bond, S. Cross-Section Dependence in Nonstationary Panel Models: A Novel Estimator. MPRA Pap. 2009, 63, 103–137. [Google Scholar]
  113. Hussain, J.; Khan, A.; Zhou, K. The Impact of Natural Resource Depletion on Energy Use and CO2 Emission in Belt & Road Initiative Countries: A Cross-Country Analysis. Energy 2020, 199, 296–315. [Google Scholar] [CrossRef]
  114. Xing, W.; Imran, A. Financial and Technological Drivers of Sustainable Development: The Role of Communication Technology, Financial Efficiency and Education in BRICS. Sustainability 2025, 17, 2326. [Google Scholar] [CrossRef]
  115. Malakauskas, A.; Lakštutienė, A. Financial Distress Prediction for Small and Medium Enterprises Using Machine Learning Techniques. Eng. Econ. 2021, 32, 4–14. [Google Scholar] [CrossRef]
  116. Roumiani, A.; Mofidi, A. Predicting Ecological Footprint Based on Global Macro Indicators in G-20 Countries Using Machine Learning Approaches. Environ. Sci. Pollut. Res. 2022, 29, 11736–11755. [Google Scholar] [CrossRef]
  117. Zhao, X.; Adebayo, T.S.; Kong, X.; Al-Faryan, M.A.S. Relating Energy Innovations and Natural Resources as Determinants of Environmental Sustainability: The Role of Globalization in G7 Countries. Resour. Policy 2022, 79, 103073. [Google Scholar] [CrossRef]
  118. Li, Y.; Wang, X.; Imran, A.; Aslam, M.U.; Mehmood, U. Analyzing the Contribution of Renewable Energy and Natural Resources for Sustainability in G-20 Countries: How Gross Capital Formation Impacts Ecological Footprints. Heliyon 2023, 9, e18882. [Google Scholar] [CrossRef] [PubMed]
  119. Adebayo, T.S.; Ullah, S.; Kartal, M.T.; Ali, K.; Pata, U.K.; Ağa, M. Endorsing Sustainable Development in BRICS: The Role of Technological Innovation, Renewable Energy Consumption, and Natural Resources in Limiting Carbon Emission. Sci. Total Environ. 2023, 859, 160181. [Google Scholar] [CrossRef]
  120. Al-Mulali, U.; Ozturk, I.; Lean, H.H. The Influence of Economic Growth, Urbanization, Trade Openness, Financial Development, and Renewable Energy on Pollution in Europe. Nat. Hazards 2015, 79, 621–644. [Google Scholar] [CrossRef]
  121. Shahbaz, M.; Khan, S.; Ali, A.; Bhattacharya, M. The Impact of Globalization On Co2 Emissions in China. Singap. Econ. Rev. 2017, 62, 929–957. [Google Scholar] [CrossRef]
  122. Zhang, X.; Song, X.; Lu, J.; Liu, F. How Financial Development and Digital Trade Affect Ecological Sustainability: The Role of Renewable Energy Using an Advanced Panel in G-7 Countries. Renew. Energy 2022, 199, 1005–1015. [Google Scholar] [CrossRef]
Figure 1. EF trends in G20. Source: Global Footprint Network. Graph crafted by the authors.
Sustainability 17 04043 g001
Figure 2. NRS trends in G20. Source: World Development Indicators. Graph crafted by the authors.
Sustainability 17 04043 g002
Figure 3. Fintech (FNT) trends in G20. Source: World Development Indicator. Graph crafted by the authors.
Sustainability 17 04043 g003
Figure 4. ENL trends in G20. Source: OECD database. Graph crafted by the authors.
Sustainability 17 04043 g004
Figure 5. Principal factors impacting environmental sustainability. The figure is crafted by the authors, based on insights from the existing literature on sustainability determinants.
Sustainability 17 04043 g005
Figure 6. The econometric approaches used for our study. Source: Authors’ compilation.
Sustainability 17 04043 g006
Figure 7. The graphical representation of the findings. Source: Authors’ compilation based on study’s findings.
Sustainability 17 04043 g007
Figure 8. Architecture used for ANN in study. Source: Created using MATLAB R2024b, based on the analyzed data.
Sustainability 17 04043 g008
Figure 9. Regression outcomes under ANN. Source: Created using MATLAB R2024b, based on the analyzed data.
Sustainability 17 04043 g009
Figure 10. D-H causality relationships. Source: Authors’ compilation based on results obtained from Dumitrescu–Hurlin Causality test using EViews 13.
Sustainability 17 04043 g010
Table 1. Variables and Sources.
VariablesShort FormsSourceData Source Link
Ecological footprintEFGFNhttps://t.ly/rNjcD (accessed on 20 Decembre 2024)
Natural resourcesNRSWDIhttps://t.ly/Dk8K1 (accessed on 20 Decembre 2024)
Environmental lawENLOECDhttps://data.oecd.org/ (accessed on 20 Decembre 2024)
Fintech (PCA: self-calculated)FNTWDIhttps://t.ly/Dk8K1 (accessed on 20 Decembre 2024)
EconomyECDWDIhttps://t.ly/Dk8K1 (accessed on 20 Decembre 2024)
Institutional qualityINQWGIhttps://t.ly/cif6d (accessed on 20 Decembre 2024)
Note: PCA = Principal component analysis.
Table 2. Descriptive statistics.
EFNRSENLFNTECDINQ
Mean4.2817114.72945210.26145−4.83 × 10−913,417.9765.93799
Median4.2200421.9200289.965000−0.2383827200.47263.06999
Maximum10.9268155.4750625.230007.45145161,855.5297.56097
Minimum0.0872670.0106881.450000−0.434960−9.6013406.530000
Std. Dev.2.3250179.1503813.5972201.00001016,959.9923.15406
Skewness0.3247153.4589090.9619365.4744501.212713−0.468912
Kurtosis2.93645715.689165.41176636.388303.1693972.584851
Note: Source: Authors’ calculations based on data from GFN, WDI, OECD, and WGI.
Table 3. CD test.
Table 3. CD test.
VariablesBreusch-Pagan LMPesaran CDPesaran Scaled LM
Statistics p-ValueStatistics p-ValueStatistics p-Value
EF224.1119 ***0.00008.0502 ***0.000031.9614 ***0.0000
NRS234.3139 ***0.000014.0901 ***0.000030.4599 ***0.0000
FNT265.0301 ***0.000014.9104 ***0.000035.0071 ***0.0000
ENL250.1709 ***0.000015.0188 ***0.000031.4508 ***0.0000
ECD263.1974 ***0.000012.1304 ***0.000034.6690 ***0.0000
INQ272.9431 ***0.000011.9417 ***0.000036.0107 ***0.0000
Note: *** p < 1%. Source: Authors’ calculations using EViews 13 with data from WDI, OECD, GFN, and WGI.
Table 4. Slope test.
TestValue p-Value
Delta12.536 ***0.000
Adj. Delta15.031 ***0.000
Note: *** p < 1%. Source: Authors’ calculations using Stata 18 with data from WDI, OECD, GFN, and WGI.
Table 5. Unit root tests.
VariablesCIPS TestCADF Test
I(0)I(i)I(0)I(i)
EF−2.201−4.356 ***−1.471−2.401 **
NRS−2.452−4.214 ***−1.183−2.253 ***
ENL−1.234−5.141 ***−1.281−2.460 ***
FNT−2.367−4.509 ***−1.307−2.429 ***
ECD−1.043−3.731 ***−0.542−2.302 **
INQ−2.101−3.611 ***−1.703−2.301 **
Note: *** p < 1%, ** p < 5%. Source: Authors’ calculations using Stata 18 with data from WDI, OECD, GFN, and WGI.
Table 6. Westerlund Co-integration test.
StatisticsValueZ-Valuep-Value
Gt−4.194 ***−6.8890.000
Ga−10.6232.2400.988
Pt−19.302 ***−8.5430.000
Pa−12.122−0.4110.341
Note: *** p < 1%. Source: Authors’ calculations using Stata 18 with data from WDI, OECD, GFN, and WGI.
Table 7. AIC/BIC Test.
Model SpecificationAICBIC
Baseline Model302.45310.12
Model with FNT and ENL289.67298.34
Model with INQ and NRS295.32303.89
Full Model (All Variables)278.54287.91
CCEMG Robustness Model283.76292.43
Table 8. CS ARDL test.
VariableCoefficientStd. Errort-Statisticp-Value
Long-Run Equation
NRS0.110251 ***0.0220335.0038000.0000
ENL−0.066419 ***0.010967−2.5448610.0033
FNT−0.253869 ***0.067404−3.7663990.0002
ECD0.000204 ***2.91 × 10−57.0261820.0000
INQ−0.032388 ***0.006472−5.0041990.0000
Short-Run Equation
ECT−0.121765 ***0.048962−2.4869390.0038
NRS0.150870 ***0.1419670.5413600.0032
ENL−0.021961 **0.020243−1.0848770.0295
FNT−0.026866 **1.056856−1.0137290.0191
ECD0.012051 **0.0051152.3560750.0196
INQ−0.015190 **0.004362−0.8757540.0157
Note: *** p < 1%, ** p < 5%. Source: Authors’ calculations using Stata 18 with data from WDI, OECD, GFN, and WGI.
Table 9. Robustness tests.
VariablesAMGCCEMG
Coefficient p-ValueCoefficient p-Value
NRS0.123 ***0.00130.035 ***0.0030
ENL−0.074 **0.0414−0.137 **0.0221
FNT−1.014 **0.0301−0.021 **0.0307
ECD0.319 **0.01121.013 *0.0841
INQ−0.023 ***0.0041−0.301 **0.0234
Note: *** p < 1%, ** p < 5%, * p < 10%. Source: Authors’ calculations using Stata 18 with data from WDI, OECD, GFN, and WGI.
Table 10. Pairwise panel causality test.
Null HypothesisF-Statp-ValueDecision
EF⇸NRS4.127 ***0.0000Bi-directional
NRS⇸EF6.751 ***0.0000
EF⇸ENL0.3190.5764Uni-directional
ENL⇸EF5.367 ***0.0013
EF⇸FNT0.9370.8461Uni-directional
FNT⇸EF5.913 ***0.0053
EF⇸ECD4.337 **0.0134Bi-directional
ECD⇸EF3.149 ***0.0041
EF⇸INQ0.1380.7541Uni-directional
INQ⇸EF4.516 ***0.00411
Note: *** p < 1%, ** p < 5%. Source: Authors’ calculations using EViews 13 with data from WDI, OECD, GFN, and WGI.
Disclaimer/Publisher’s Note: The statements, opinions and data contained in all publications are solely those of the individual author(s) and contributor(s) and not of MDPI and/or the editor(s). MDPI and/or the editor(s) disclaim responsibility for any injury to people or property resulting from any ideas, methods, instructions or products referred to in the content.

