Article

Sustainability of Urban Green Spaces: A Multidimensional Analysis

by
Veljko Dmitrović
1,
Svetlana Ignjatijević
2,*,
Jelena Vapa Tankosić
2,
Radivoj Prodanović
2,
Nemanja Lekić
3,
Aleksandra Pavlović
4,
Miroslav Čavlin
2,
Jovana Gardašević
2 and
Julijana Lekić
5
1
Faculty of Organizational Sciences, University of Belgrade, Jove Ilića 154, 11000 Belgrade, Serbia
2
Faculty of Economics and Engineering Management in Novi Sad, University Business Academy in Novi Sad, Cvećarska 2, 21000 Novi Sad, Serbia
3
Department of Business and Information Studies, Belgrade Business and Arts Academy of Applied Studies, Kraljice Marije 73, 11050 Belgrade, Serbia
4
The Academy of Applied Technical Studies—Polytechnic, Katarine Ambrozić 3, 11050 Belgrade, Serbia
5
Faculty of Technical Sciences, Kneza Milosa 7, 38220 Kosovska Mitrovica, Serbia
*
Author to whom correspondence should be addressed.
Sustainability 2025, 17(9), 4026; https://doi.org/10.3390/su17094026
Submission received: 9 April 2025 / Revised: 25 April 2025 / Accepted: 28 April 2025 / Published: 29 April 2025

Abstract

Urban green spaces (UGS) play a crucial role in enhancing the quality of life in urban environments by offering a wide range of ecological, psychological, socio–cultural, and economic benefits. This research addresses the multidimensional impact of functional characteristics of UGS on user satisfaction in Novi Sad, focusing on the various ways in which these spaces contribute to well-being. By integrating multiple perspectives, including ecological benefits like stress reduction, social and cultural aspects such as fostering community connections, and economic factors like enhancing property values, this study presents a holistic analysis of UGS. Through a mixed-methods approach, combining surveys and regression analysis, the research explores how different UGS functions interact to shape users’ perceptions. The findings highlight the importance of socio–cultural and ecological functions in improving the urban experience, providing key insights for urban planning that aims to create sustainable, inclusive, and resilient green spaces. This study emphasises the significance of considering these diverse dimensions in the development and management of urban green spaces for long-term sustainability and user satisfaction.

1. Introduction

Urbanisation, as a widespread global phenomenon, has precipitated numerous challenges related to environmental degradation and the declining quality of life in urban environments. Its intensification, closely linked with processes of industrialisation and globalisation, has significantly amplified ecological stressors, particularly in developing countries, where pollution increasingly jeopardises public health and long-term sustainability [1]. The accelerated expansion of urban areas, especially over the past few decades, has contributed to spatial disparities, the depletion of natural resources, and growing pressure on existing infrastructure [2]. In response, there is a growing and urgent demand for more extensive, high-quality UGS, due to their proven ability to reduce negative urban externalities such as air pollution, high temperatures, and noise. Pollution from industry, transport, and municipal services directly affects physical and mental health, reducing the urban quality of life and posing long-term risks to public well-being. Recent studies underline the potential of green infrastructure to mitigate urban heat island effects, reduce air pollution, and improve health-related outcomes, reaffirming their relevance for sustainable urban planning [3].
UGS are defined as publicly accessible, purposefully planned vegetated areas within urban environments, including parks, public gardens, tree-lined streets, lawns, and recreational zones. They also offer recreational and experiential value, considered essential for psychological restoration and daily urban quality of life [4]. These spaces perform multiple functions: ecological, social, aesthetic, and health-related. They are fundamental to improving the quality of life in urban settings. UGS contribute to the regulation of microclimatic conditions, the absorption of pollutants, the preservation of biodiversity, and the mitigation of the urban heat island effect [5,6]. As integral components of sustainable urban planning frameworks, they are increasingly regarded as strategic assets for enhancing climate resilience and mitigating the adverse impacts of climate change in densely built environments [7]. Their contribution to mental well-being is also well documented as they help reduce psychological stress, promote physical activity, and foster social cohesion within urban populations [8,9].
In light of these recognised benefits, recent scholarly discourse increasingly positions UGS as critical components of sustainable urban development and public health strategies. However, persistent disparities in the distribution, quality, and accessibility of UGS remain evident, while their perception and valuation are shaped by a constellation of factors, including users’ sociodemographic profiles, levels of urbanisation, and the orientation of local planning policies [10,11]. Users evaluate UGS not only for their ecological functions but also through psychological, cultural, and social aspects, such as place identity, opportunities for gathering, and daily interaction [12,13]. At the same time, urban planning agendas are increasingly attuned to the imperative of equitable access and to the risks associated with green gentrification, which may undermine social inclusiveness and exacerbate disparities in the distribution of urban resources [14]. Consequently, there is growing emphasis on integrative research approaches that capture ecological, social, economic, and cultural dimensions in exploring user perceptions and satisfaction. Empirical studies consistently affirm that the perceived quality, functionality, and role of UGS within local communities exert a measurable influence on user well-being and satisfaction levels [15,16]. In addition, gender-specific preferences and age-related differences in green space use, especially among older populations, shape satisfaction outcomes and should inform inclusive design practices [17]. The shift to green urban policies and sustainable resource governance is now seen as essential, especially in cities facing growing climate, social, and economic pressures [18], highlighting the importance of context-specific investigations that explore how UGS are perceived, experienced, and valued in distinct urban settings.
This study examines the role of ESG (Environmental, Social, and Governance) factors, which have gained importance in urban green space (UGS) management. Integrating ESG practices into urban planning improves the sustainability and inclusivity of UGS. ESG factors are essential for assessing how environmental, social, and governance practices influence UGS management, contributing to their preservation and development in line with sustainable urban goals. By focusing on these factors, UGS can preserve ecological integrity, promote social well-being, and enhance governance transparency [19]. This is further supported by the emerging literature identifying ESG dimensions as risk-mitigating elements in long-term urban investment and governance strategies [20].
This study builds on existing evidence to examine how residents of Novi Sad perceive, value, and engage with UGS. The city is experiencing rapid development and increasing ecological challenges. The research focuses on identifying the key economic, ecological, psychological, cultural, and social dimensions of UGS that users find most relevant and analysing the main predictors of overall user satisfaction.
As one of the fastest-growing and strategically positioned urban centres in Serbia and the wider region, Novi Sad provides a distinct context for examining the sustainability of urban green spaces (UGS). The city is characterised by rapid spatial development, infrastructural strain, and increasing pressure on natural resources. Despite the formal integration of green areas into urban plans, challenges persist, including unequal distribution, limited accessibility, and insufficient participatory governance. These conditions make Novi Sad a pertinent setting for exploring the multifaceted challenges of green space provision in medium-sized Southeast European cities. Emerging approaches to participatory democracy and digital tool integration in urban planning further support the call for inclusive, data-informed, and adaptive green infrastructure strategies [21,22].
While interest in UGS multifunctionality is increasing, there is still a lack of context-specific, integrated studies connecting user perceptions with ESG-oriented planning in Southeast European cities. This study addresses this gap by providing an empirical assessment of user satisfaction, expectations, and evaluations of UGS in Novi Sad while integrating ESG-related dimensions into the analytical framework [4,23].
Environmental, Social, and Governance (ESG) factors in the context of urban green space (UGS) management refer to an integrated assessment framework encompassing ecological dimensions (e.g., biodiversity, air quality, climate resilience), social aspects (e.g., equitable access, social cohesion, community engagement), and governance mechanisms (e.g., transparency, participatory planning, long-term management sustainability), aligned with contemporary ESG practices in natural resource governance [19]. In this study, ESG principles are operationalised through the evaluation of user perceptions regarding the presence and relevance of these factors in the management of UGS in Novi Sad.

2. User Experience and Functionality in Urban Green Infrastructure

Contemporary research highlights the essential role of urban green infrastructure, commonly embodied by urban green spaces (UGS), in enhancing urban quality of life by addressing a range of ecological, social, psychological, economic, and cultural challenges [24]. To effectively address external pressures such as climate change and urban pollution, the management of green infrastructure requires strategies that go beyond spatial preservation, incorporating functional and socio–cultural values [25]. This approach demands a comprehensive understanding of key user preferences, including the importance of space, facilities, and natural elements that foster environmental benefits, stress reduction, and social interaction [26]. UGS play a significant role in mitigating pollution, regulating temperatures, improving public health, and supporting the long-term sustainability of urban ecosystems. As integral components of urban planning, these spaces help counteract the adverse effects of urbanisation, such as the urban heat island effect, air pollution, and broader environmental degradation [3]. Despite their importance, however, these spaces face challenges from urban expansion, real estate speculation, and fragmented institutional oversight, which limit their protection and growth, even when formally included in urban plans [27].
Effective sustainability reporting allows companies to track their environmental and social impacts systematically, thereby contributing to the advancement and enhancement of UGS. Innovations in reporting methodologies enable the identification and implementation of ecological initiatives such as tree planting, park restoration, and the integration of green infrastructure. The adoption of agro-ecological practices in urban environments, including composting, afforestation, and the use of environmentally sustainable technologies, plays a crucial role in reducing the ecological footprint and improving environmental quality [28]. Research confirms that managing sustainable business practices is vital for achieving broader sustainability goals, with innovative approaches to sustainability reporting becoming increasingly important. Improvements in ESG reporting methodologies are key to fostering transparent, accountable business models that actively contribute to sustainable urban development [29]. These practices enhance transparency and support the integration of ecological and social considerations into business strategies, positively influencing urban green spaces and overall quality of life in cities [30]. Within this framework, improved reporting mechanisms help manage UGS more efficiently, mitigate environmental impacts, and promote healthier, more liveable and resilient urban areas. Furthermore, the integration of ESG-related risk factors, particularly those related to carbon and environmental sustainability, provides a more comprehensive understanding of the financial and social impacts associated with business practices. Recent studies suggest that ESG factors, though not always directly priced into returns, play a significant role in asset pricing models and can guide investment strategies aimed at long-term sustainability [20,31].
Understanding user perceptions is crucial, as these can vary according to sociodemographic factors such as age, education, income, and residential context, whether urban or peri-urban. These factors significantly influence how individuals experience and value UGS [11,32]. Research also identifies gender-based difference, with women often placing greater importance on lighting, safety, playgrounds, and attractive surroundings, which are frequently tied to caregiving responsibilities and regular use of neighbourhood green spaces [33]. Older individuals tend to prioritise tranquillity, safety, and accessibility, while younger populations emphasise recreational and sports facilities [10,34].
The social and communal functions of UGS lie in their capacity to facilitate everyday encounters, support both spontaneous and organized gatherings, strengthen collective identities, and foster a sense of belonging. In urban areas characterized by migration and social fragmentation, these spaces can play a pivotal role in integrating vulnerable groups and building trust among residents [13,35]. To fully realize these functions, research identifies key attributes that UGS should possess, such as accessibility, connectivity, diversity of activities, opportunities for social interaction, provision of amenities, safety, and aesthetic value. Together, these qualities enhance social cohesion and overall urban quality of life [4]. Importantly, user satisfaction is not always correlated with quantitative factors such as surface area or the number of facilities. Instead, it is more influenced by perceived quality, maintenance standards, safety, accessibility, and the subjective experience of benefits [16,36]. Public green spaces have been shown to significantly improve life satisfaction among urban residents, and their thoughtful integration into urban planning can contribute meaningfully to individual well-being and collective quality of life [37]. In this respect, the provision of adequate and inclusive green spaces should be a priority in efforts to create healthier and more equitable urban environments.
In addition to their ecological, social, and cultural roles, user satisfaction and visitation patterns are shaped by various interrelated factors. Among the most influential are physical accessibility, proximity to residential areas, the presence and quality of amenities, perceived safety, maintenance standards, and the variety of activities available in these spaces [38]. Individuals are more likely to engage with spaces that offer walking paths, sports facilities, resting areas, playgrounds, and environments suited for cultural or educational use. However, it is not only the physical attributes that determine satisfaction; subjective perceptions of safety, comfort, and overall utility often play a more decisive role [39]. Evidence suggests that green areas that are aesthetically appealing, functionally coherent, and consistently maintained contribute to increased social interaction, reduced psychological stress, and a stronger sense of local belonging. Well-designed and effectively managed public spaces are therefore considered essential for enhancing physical, emotional, and social well-being, further emphasizing their contribution to urban quality of life [40,41].
The frequency of use and level of satisfaction with green spaces depend not only on physical accessibility and the range of amenities, but also on the quality of infrastructure, maintenance standards, and the degree of participatory management. Contemporary studies show that environments with well-designed paths, benches, public lighting, sanitary facilities, and spaces for different age groups are perceived as more appealing [39]. The maintenance of vegetation, cleanliness, and the integration of ecological features such as rainwater harvesting systems or composting facilities further enhance users’ perception of order and functionality. Active citizen involvement in the planning and use of green areas through consultation, educational programs, and community-based initiatives ensures their long-term sustainability and responsiveness to local needs. International research suggests that older adults especially value spaces that are both functionally accessible and aesthetically pleasing, allowing them to engage actively and enjoy the space visually, regardless of cultural or social background [42]. Additionally, the creation of green infrastructure with an emphasis on climate resilience, such as tree planting, biodiversity preservation, and reducing urban heat island effects, plays a vital role in securing the ecological stability of urban environments over time [38].
Assessing the relevance of green infrastructure increasingly involves a multidimensional perspective that accounts for its contribution to environmental sustainability and public health. A growing body of evidence indicates that exposure to natural urban environments has beneficial effects on psychological and physical well-being, including stress reduction, stimulation of physical activity, and therapeutic outcomes, particularly among individuals with chronic health conditions [9,15]. In addition, ecological functions such as microclimate regulation, pollutant filtration, and biodiversity preservation are widely recognised and valued by the public [6,43]. However, overall satisfaction is also closely linked to spatial accessibility, functional design, perceived safety, aesthetic experience, and the consistency of maintenance. People are more likely to engage with green areas that are well connected to urban infrastructure, adapted to diverse demographic profiles, and equipped with inclusive amenities [38]. The presence of educational, cultural, and nature-based activities further enhances levels of engagement and encourages more frequent use. Safety-related aspects, including adequate lighting, routine upkeep, visible staff, and environmental cleanliness, are essential in shaping favourable perceptions and supporting prolonged use [39]. Infrastructural elements such as walking paths, seating zones, playgrounds, and vegetated surroundings not only increase practical utility but also foster a sense of comfort and encourage social interaction, contributing to the overall appeal and long-term usability of green areas.
Multidimensional evaluations increasingly recognise the economic value of urban green infrastructure, including its role in enhancing property values, supporting tourism, and stimulating local economies through organised activities and community events [44]. In parallel, green environments serve as cultural anchors, reflecting collective memory, symbolism, and shared identity [12,45]. Growing attention is also being directed towards toward the integration of digital innovation into sustainable urban management. The development of smart public parks illustrates how technology can promote physical activity, social inclusion, and preventive healthcare, especially among older adults. Smart features such as automated lighting, health-monitoring sensors, interactive fitness equipment, and real-time data collection have the potential to support active ageing and improve overall user experience [46]. These advancements enhance inclusiveness by enabling older individuals to engage with green environments in meaningful ways, without requiring advanced digital literacy. Their successful implementation, however, relies on interdisciplinary cooperation and strong institutional commitment to the creation of adaptable and accessible public spaces. Digital transformation is increasingly acknowledged as a strategic driver of sustainability, not only in agriculture but also in urban planning, where it facilitates more responsive and efficient management of green systems [47]. By integrating sensor-based monitoring, usage data, and participatory digital platforms, urban policies can better reflect actual community needs [5]. Moreover, investment in public green areas is now widely recognised as a cost-effective public health strategy as access to well-designed green infrastructure has been shown to enhance population well-being and reduce healthcare expenditures over time [48].
Contemporary urban waste management challenges, particularly related to solid waste generation and disposal, have intensified the need to embed green infrastructure within broader sustainable development strategies. Efficient municipal waste handling, especially through organic matter valorisation via composting and anaerobic digestion, is increasingly recognised as essential for building ecologically resilient cities [49]. Evidence from cities like Nakuru and Mombasa in Kenya demonstrates the relevance of integrating green technologies and circular economy principles, including composting and recycling, into local systems. These practices reduce environmental pressure and strengthen the ecological functionality of open spaces, linking waste recovery directly with landscape regeneration and long-term urban sustainability [50].
The integration of green infrastructure into circular economy strategies, particularly through composting and anaerobic digestion, plays a crucial role in reducing pollution and ensuring effective organic waste utilisation. By alleviating environmental pressures and supporting renewable resource flows, such approaches contribute directly to the sustainability of urban ecosystems. In addition to ecological benefits, circularity enhances economic resilience by creating jobs and encouraging new business models in the recycling and reuse sectors, strengthening local communities. It also supports more efficient resource use and waste minimisation through environmentally sound technologies and closed-loop systems [51]. These practices form a foundation for enduring ecological and economic transformation in urban contexts. When recycling and reuse are integrated into urban planning, they generate inclusive growth by aligning environmental objectives with social and economic development [52]. Systematic application of these principles helps address contemporary waste challenges by increasing resource efficiency and promoting sustainable urban systems [23].
Evidence from agri-environmental policy research in Serbia highlights the value of agro-ecological measures in enhancing biodiversity and improving environmental quality. Such interventions can support the development of healthier urban landscapes while extending the application of ecological standards through nature-based infrastructure. Embedding these concepts within broader societal and economic agendas is critical for advancing responsible resource governance and safeguarding natural capital as a basis for future urban sustainability [53]. Moreover, the deployment of photovoltaic systems for irrigation infrastructure in landscaped areas facilitates sustainable water management by reducing reliance on fossil fuels and lowering carbon emissions. The use of solar energy for powering pumps not only improves energy efficiency over time but also contributes to the overall environmental performance of green infrastructure [54].
Accordingly, the recent literature advocates integrative and participatory approaches that align user preferences, sustainable resource management, and urban resilience to support more equitable and functional cities [14,55]. Although rapid urbanisation intensifies pressure on natural systems by causing habitat degradation and increasing greenhouse gas emissions, it also creates opportunities to implement innovative practices aligned with sustainable urban planning goals [56]. Nevertheless, the planning and evaluation of green infrastructure remain complex and context-dependent, shaped by interconnected physical, institutional, psychological, transport, and socio–cultural factors [38]. While the benefits of green spaces are well documented, less attention has been paid to how diverse user groups assess their functions, especially in mid-sized cities in Southeast Europe. This represents a significant gap in the literature, highlighting the need for empirical insights into user-specific experiences and contextual influences in cities undergoing rapid spatial and demographic change.
Against this background, the present study aims to examine the multidimensional perceptions of use, satisfaction, and functional value of green areas among residents of Novi Sad. As one of the fastest-developing urban centres in the region, the city faces growing pressures related to urban expansion, environmental sustainability, and quality of life. Understanding how users engage with, assess, and prioritise different attributes of green infrastructure can offer valuable insights for evidence-based urban planning and support the design of more inclusive and resilient public spaces.

3. Research Methodology

The empirical research was conducted from 1 October 2024 to 1 March 2025 in the city of Novi Sad. Data were collected through an anonymous survey targeting a sample of the population with diverse age, social, and economic characteristics. A total of 1400 questionnaires were distributed, and 1080 valid responses were included in the analysis, yielding a response rate of 74.29%.
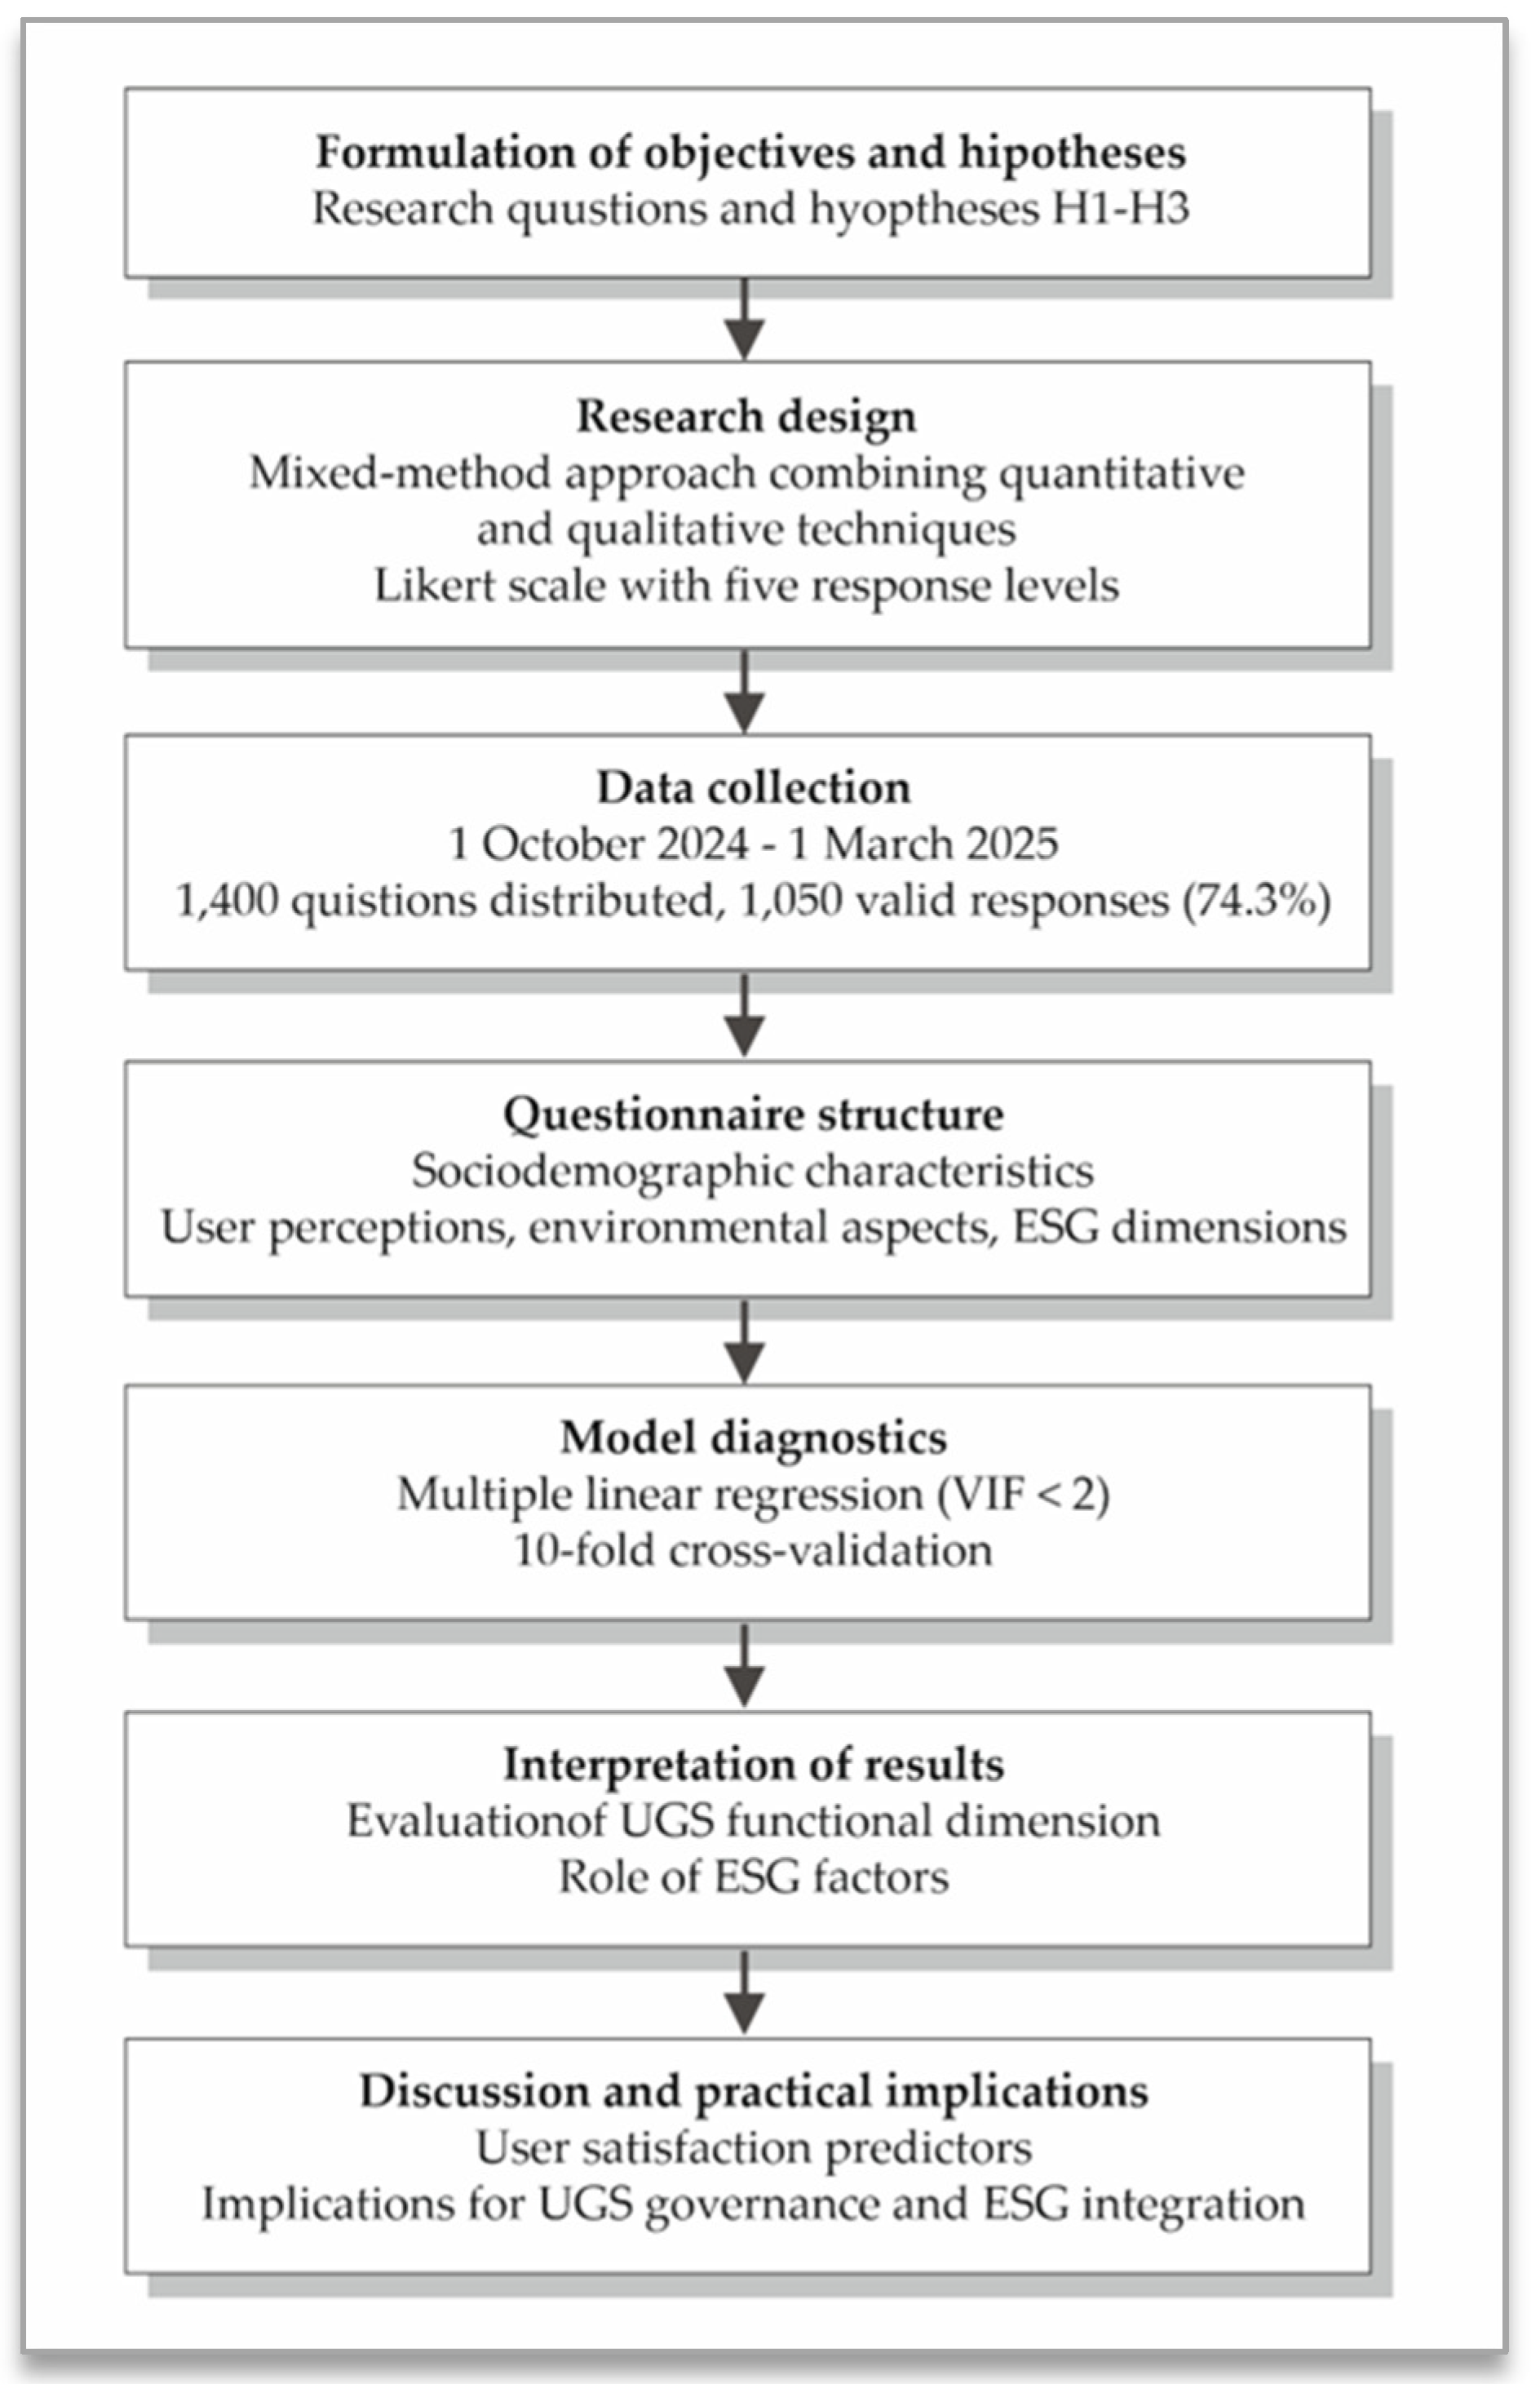
To ensure methodological comprehensiveness, a mixed-methods design was employed, combining structured quantitative data with qualitative insights derived from open-ended responses and contextual comments. The integration of both data types was achieved through triangulation, where qualitative observations were used to interpret statistical results, particularly in instances where unexpected or counterintuitive relationships were revealed through regression modelling. This approach enabled a more nuanced understanding of user experiences with urban green spaces and strengthened conclusion validity. To illustrate the research design and sequential analytical phases, Figure 1 presents a flowchart outlining key steps, including hypothesis formulation, data collection, questionnaire structure, model diagnostics, and interpretation of results. This structure highlights how the triangulation of methods contributed to a more robust interpretation of the data and enhanced the explanatory depth of the research findings.
In order to enhance the representativeness of the findings, the sampling frame was aligned with recent census data, incorporating variations in gender, age, income levels, and household composition. Stratified sampling was applied to ensure sufficient diversity across user profiles. Special care was taken to include respondents with varying patterns of green space usage and motivations, thereby supporting more inclusive and context-sensitive subgroup analysis.
The survey instrument was designed to capture relevant sociodemographic information about respondents and their perceptions of various dimensions of urban green spaces (UGS). A Likert scale with five levels (1—strongly disagree, 5—strongly agree) was applied to all items. In total, 67 variables were included, grouped into 6 inter-related analytical areas: sociodemographic characteristics, perceptions of social and community functions of UGS, user satisfaction with UGS, evaluations of the role and significance of UGS, perceived benefits and values of UGS, and perceptions of the economic, ecological, psychological, and cultural functions of these spaces. In addition to these core dimensions, the survey also included items evaluating the perceived relevance of ESG factors for the management and long-term sustainability of UGS. ESG-related questions focused on how respondents perceive the integration of ecological sustainability, social equity, and transparent governance in UGS management. These factors are crucial for understanding how sustainable urban planning practices influence user satisfaction with UGS and their overall perception of urban green spaces as essential components of community well-being.
In order to examine the relationship between the functional aspects of urban green spaces (UGS) and user satisfaction, the following hypotheses were formulated:
H1: 
The economic–ecological functions of UGS have a statistically significant positive impact on overall user satisfaction.
H2: 
The psychological–cultural functions of UGS have a statistically significant impact on overall user satisfaction.
H3: 
The social and communal functions of UGS have a statistically significant positive impact on overall user satisfaction.
For the analysis of quantitative data, the IBM SPSS Statistics software version 26 was used. Descriptive statistics, Pearson’s chi-square test (χ2), and stepwise multiple linear regression were applied. This method of regression allows for the sequential inclusion of only those predictors that have a statistically significant contribution to explaining the dependent variable. The effectiveness of this method in identifying relevant factors has been demonstrated in previous empirical analyses of complex systems [57,58]. The reliability of the measurement scales was tested by calculating the Cronbach’s alpha coefficient, and all coefficients exceeded the recommended threshold of 0.70, confirming the internal consistency and methodological reliability of the scales used [59].
The methodological framework applied in this study aligns with contemporary research that uses multiple regression analysis to examine user perceptions and behaviours in urban settings. Similar approaches are evident in the work of Li et al. [60], who analysed the influence of urban green space characteristics on citizen visitation and satisfaction, as well as in Kothencz et al. [8], where factors related to well-being and UGS perceptions were identified. Methodologically similar analyses, focusing on identifying multiple determinants of user behaviour toward ecological resources, were also employed by Vapa Tankosić et al. [28] in their study on factors influencing the adoption of agro-ecological practices among farmers. These studies underscore the effectiveness of multiple regression in revealing complex relationships between variables and user behaviour, enabling precise modelling and a deeper understanding of urban green space dynamics. This approach offers a comprehensive framework for analysing complex systems and allows for the identification of patterns that inform both theoretical and practical applications in urban planning and sustainability. Model diagnostics, including multicollinearity tests (VIF) and 10-fold cross-validation, were conducted to ensure the robustness and generalisability of the regression models.

4. Results

4.1. Use and Perceptions of Urban Green Space

This subsection provides an overview of how users engage with urban green spaces (UGS) in Novi Sad, focusing on their demographic characteristics, frequency and motives of visits, and perceived functions of UGS. Through descriptive analysis supported by Figure 1, Figure 2, Figure 3, Figure 4, Figure 5, Figure 6, Figure 7 and Figure 8, the findings shed light on behavioural patterns and user preferences, offering insight into how different population groups interact with and value green infrastructure.
Gender of respondents (Figure 2) shows that the majority of users are women (56.9%), while men constitute 43.1%, which may reflect women’s higher engagement in outdoor and family-oriented activities, as well as a potentially greater sensitivity to the health and social benefits offered by UGS.
Figure 2. Distribution of respondents by gender.
Sustainability 17 04026 g002
Age structure (Figure 3) reveals a predominance of users aged 41–50 (45.6%), suggesting that middle-aged individuals represent the most active demographic group when it comes to visiting UGS. In contrast, the youngest group (16–30) and the oldest (over 60) are significantly less represented. This lower participation among younger users may be attributed to different lifestyle priorities or limited awareness of UGS benefits, while the under-representation of older users could reflect mobility constraints or safety concerns. These insights highlight the need for age-inclusive green space planning and tailored features to encourage engagement across all age groups.
Figure 3. Age structure of UGS users in Novi Sad.
Sustainability 17 04026 g003
Regarding economic background, the data on monthly income (Figure 4) indicate that the most frequent users of UGS earn up to 800 euros per month (39.3%), followed by those earning between 1501 and 2500 euros (20.7%). The remaining users are almost evenly split between the 801–1500 euros (20.4%) and over 2500 euros (19.6%) categories. These findings suggest that urban green spaces primarily attract individuals from lower- and middle-income groups, potentially due to the accessibility and cost-free nature of these public amenities.
Figure 4. Monthly income distribution of UGS users.
Sustainability 17 04026 g004
Figure 5 provides insights into companionship patterns during visits to UGS, showing that the largest share of respondents (39.3%) is accompanied by different people on different occasions. Meanwhile, 20.4% visit UGS with children, 19.6% with a partner, and 20.7% with both partner and children. This distribution underlines the multifunctional and inclusive character of urban green spaces, suggesting their relevance not only for individual relaxation but also for fostering family bonding, intergenerational interaction, and informal social gatherings across various household and relational contexts, particularly during weekends and leisure periods.
Figure 5. People accompanying respondents during visits to UGS.
Sustainability 17 04026 g005
Frequency of visits (Figure 6) indicates that 40.7% of respondents visit UGS several times per year, while fewer report visiting several times per month (20.7%), per week (19.6%), or daily (18.9%). This suggests that the use of UGS in Novi Sad is more occasional than routine, which may be influenced by seasonal weather patterns, limited proximity to green areas, work and family obligations, insufficient maintenance, or a lack of attractive and engaging infrastructure and programming that would motivate more regular and purposeful visits.
Figure 6. Respondents’ frequency of UGS visits.
Sustainability 17 04026 g006
The main reasons for visiting UGS (Figure 7) show that most respondents frequent these spaces to relax and connect with nature (41.1%) or to engage in leisure activities (40.0%). A smaller proportion (18.9%) report walking dogs as their primary motive, suggesting that UGS are predominantly appreciated for rest, relaxation, and psychological recovery, rather than for routine or task-oriented purposes. These findings highlight the central importance of recreational and restorative functions of green spaces in everyday urban life, reflecting a strong user preference for natural settings that offer a welcome break from daily stress and urban congestion.
Figure 7. The main reasons for visiting UGS.
Sustainability 17 04026 g007
Preferred times of day for visiting UGS (Figure 8) indicate that the majority of respondents prefer afternoon visits (42.1%), followed by those selecting “other” unspecified times (31.8%), while early morning (8.9%), morning (8.3%), and night-time visits (8.9%) are notably less common. This distribution suggests that UGS are most frequently used during daylight hours, aligning with typical leisure periods and possibly reflecting users’ work schedules, safety perceptions, lighting conditions, and ambient temperature preferences.
Figure 8. Preferred times of day for visiting UGS.
Sustainability 17 04026 g008
Reported duration of stay in UGS (Figure 9) shows that the majority of users spend relatively short periods in green spaces. Most respondents stay less than one hour (41.1%) or between one and two hours (39.3%), while only 18.9% remain for more than two hours. These findings suggest that visits to UGS in Novi Sad are typically brief and likely focused on specific activities such as short walks, rest during daily routines, or time-limited leisure. The low proportion of extended stays may reflect limited availability of facilities that support longer visits (e.g., cafés, shaded resting areas, or organised activities), or a preference for UGS as transitional rather than destination spaces. Future improvements could consider how to enhance comfort and diversify offerings to encourage longer and more varied use of these urban areas.
The descriptive insights drawn from Figure 2, Figure 3, Figure 4, Figure 5, Figure 6, Figure 7, Figure 8 and Figure 9 provide a well-rounded snapshot of user demographics, visit frequencies, motivations, and behavioural patterns related to UGS-NS. Together, these visual elements depict not only who uses urban green spaces in Novi Sad but also how, when, and why they do so. What emerges is a portrait of users whose experiences are shaped by social roles, income levels, time availability, and expectations from green infrastructure. This foundation sets the stage for a more structured evaluation of perceived functions, explored further through tabular summaries and inferential analyses in the following sections.
User perceptions of the social and communal functions of UGS-NS are systematically summarised in Table 1, offering contextual depth that complements the visual findings from previous figures. High internal consistency of the scale was confirmed with a Cronbach’s alpha of 0.983, affirming the reliability of the instrument. On average, respondents expressed a positive attitude toward these functions, with mean scores ranging from 3.41 to 4.39 and an overall average of 4.07 (Std. Dev. = 1.137). These results point to a broadly shared recognition of the communal relevance and societal contribution of urban green spaces. They also reflect a widespread appreciation of the role that UGS play in fostering everyday social interaction. Statements that received the highest ratings refer to UGS as places for intergenerational contact, cultural exchange, children’s play and learning, and healthy living. Each of these statements scored an average of 4.39, highlighting the strong value users assign to UGS in terms of facilitating social interaction and promoting collective well-being. Such consistently high evaluations suggest that users associate UGS-NS with inclusive and accessible environments that reinforce local identity and social connectivity. They are viewed not only as physical spaces but also as symbolic anchors of community life. It is important to consider how these perceptions vary with users’ age, life stage, or household structure as such factors may influence expectations and preferences for communal green space design. Incorporating features that support shared use, such as open play areas, shaded seating, and designated gathering zones, can further promote social engagement across different user groups. Pearson’s χ2 test revealed statistically significant gender-based differences across all items (p < 0.05), with men typically assigning higher ratings. This pattern may reflect differences in experience, expectations, or perceived relevance of communal green space functions between genders. Presenting these data in tabular form enables a closer analysis of the variables that influence social integration outcomes, providing practical insight for urban planning strategies aimed at inclusivity and cohesion.
The reliability of the scale concerning user satisfaction with UGS-NS was confirmed by the high value of Cronbach’s alpha coefficient (α = 0.963), indicating a high degree of internal consistency of the scale. Respondents, on average, expressed moderate satisfaction with various aspects of urban green spaces, with average scores ranging from 2.01 to 3.40. The highest satisfaction was expressed in relation to the development of partnerships between owners and users of private and public green spaces (Mean = 3.40; Std. Dev. = 0.805), while the lowest satisfaction was expressed concerning the design and planning of UGS-NS (Mean = 2.01; Std. Dev. = 0.627). The overall mean satisfaction value was 2.92 (Std. Dev. = 0.864), indicating room for improvement in the quality and management of UGS-NS (Table 2). The results of Pearson’s χ2 test indicate statistically significant differences between male and female respondents for all statements (p < 0.05), with average scores generally being higher among women. These differences may reflect different patterns of perception and priorities regarding the functionality and quality of UGS-NS between male and female users.
The reliability of the scale assessing the variables related to the perception of the role and significance of UGS-NS was confirmed by a high degree of internal consistency, with a Cronbach’s alpha coefficient of 0.944. On average, respondents expressed a positive attitude toward the functions of UGS NS, indicating that these spaces have multiple roles and contribute to various aspects of urban life. The mean scores for the variables range from 2.80 to 4.39, with an overall mean value of 3.49 (Std. Dev. = 1.094), suggesting a moderately positive outlook on the analysed statements (Table 3). The highest-rated statement concerns the perception that the distribution of UGS NS is not optimal (Mean = 4.39; Std. Dev. = 1.209), reflecting users’ critical awareness of the spatial organisation of green spaces. Furthermore, high ratings were given to statements regarding the importance of integrating new knowledge and experiences into planning (Mean = 4.01; Std. Dev. = 1.270) and the role of green corridors in connecting different areas of the city, thus facilitating user access (Mean = 3.99; Std. Dev. = 1.103). Conversely, the lowest ratings were given to statements about the development of strategies to reduce the maintenance costs of UGS-NS (Mean = 2.80; Std. Dev. = 0.980), as well as the existence of conflicts and disagreements in UGS-NS (Mean = 2.82; Std. Dev. = 1.152), which suggests a need for improvement in these areas. The results of the χ2 test reveal statistically significant differences by gender for most statements, with women generally providing higher ratings compared to men. These differences may point to distinct patterns of perception and evaluation of the functions of UGS NS based on the gender of the users.
The reliability of the scale assessing the perceived benefits and values of UGS NS was confirmed by a high degree of internal consistency with a Cronbach’s alpha coefficient of 0.961. The mean ratings of respondents fall within a narrow range from 3.98 to 4.19, with an overall average of 4.13 (Std. Dev. = 1.200), indicating a strong consensus regarding the usefulness and significance of UGS NS across various aspects (Table 4). Almost all of the statements evaluated received high average ratings, suggesting that respondents place significant value on the ecological, social, and functional benefits of UGS NS. Particularly notable is the perception of UGS NS as a public good, accessible to all generations, as well as their value regardless of commercial use. This perception reflects a collective recognition of green spaces as shared community assets, essential to both environmental quality and everyday well-being. The results of Pearson’s χ2 test reveal statistically significant differences by gender for all statements (p < 0.05), with male respondents generally providing slightly higher ratings. These differences in evaluations suggest the presence of distinct patterns of valuing public spaces based on the gender of the user.
The reliability of the scale assessing the economic, ecological, psychological, and cultural functions of UGS-NS was confirmed by a high degree of internal consistency, with a Cronbach’s alpha coefficient of 0.900. The mean ratings of respondents range from 3.41 to 4.39, with an overall average of 3.99 (Std. Dev. = 0.887), indicating a high level of agreement regarding the multifaceted benefits of UGS-NS (Table 5). The highest-rated aspects of UGS-NS include their role in providing Novi Sad with a unique identity and making it more attractive to live in, as well as offering spaces for rest, recreation, and physical activity for all age groups. The presence of natural elements, such as trees, water, and animals, is appreciated for its ability to reduce anxiety and aggression. These factors all received a mean score of 4.39, reflecting their significant impact on the user experience. Additionally, UGS-NS are valued for reducing stress and fatigue and improving productivity and concentration (mean = 4.19), underscoring their importance in enhancing both mental and physical health. This pattern of responses highlights a widespread recognition of the restorative, aesthetic, and functional roles that green spaces play in urban life.
Pearson’s χ2 test results show statistically significant differences by gender (p < 0.05), with male respondents generally providing slightly higher ratings. Gender-based contrasts in the assessment of UGS functions may reflect diverging needs, preferences, or experiences related to accessibility, safety, or recreational usage. Presenting the data in a separate table enables a clearer view of the multidimensional benefits of UGS-NS, particularly those related to health, city identity, and ecological value.

4.2. Predictors of Satisfaction and Regression Analysis

Following the confirmation of the statistical significance of the model, the contribution of individual predictors was examined across all three regression specifications. The key regression indicators are presented in Table 6, with the models developed using the stepwise method to assess the influence of various UGS functions on overall user satisfaction in Novi Sad. This detailed analysis allows for a clear identification of the most impactful factors influencing user satisfaction, providing valuable insights for urban planners and policymakers in optimising UGS design and management. Standardised beta coefficients were interpreted to compare the relative strength of predictors within each model, enabling an assessment of which UGS function exerted the greatest influence on satisfaction. The model sequence also clarifies how each predictor gradually enhances the overall explanatory power.
In Model 1, where only the economic–ecological function was included as a predictor, the correlation coefficient was R = 0.755, and the coefficient of determination (R2) was 0.571, with an adjusted R2 of 0.570, indicating a stable model. The standard error of estimate (SEE) was 0.46848, suggesting a good model fit. When psychological–cultural functions were added in Model 2, the explained variance increased to R2 = 0.614, with the adjusted R2 remaining unchanged. The correlation increased to R = 0.784, while the standard error decreased to 0.44427. Finally, in Model 3, which included socio–community functions, the coefficient of determination reached R2 = 0.695, with a nearly perfect correlation (R = 0.834) and a very low standard error of estimate (SEE = 0.39537), highlighting the exceptional predictive power of this model. Although slightly lower than in the initially estimated model, this revised R2 value still reflects strong explanatory power, particularly considering the complexity and multidimensionality of the user satisfaction construct.
To mitigate potential multicollinearity within the socio–community construct, a composite variable named Social Cohesion of UGS was created. It synthesises three highly correlated items capturing the role of UGS-NS in fostering belonging, encouraging bonding, and enhancing social relations: (1) green spaces bring people together and foster social ties; (2) they provide a sense of community belonging; and (3) they improve social relationships in the city. These closely inter-related items share a conceptual foundation and underline the community-building role of UGS in diverse and evolving urban contexts. The aggregation was both theoretically supported and statistically validated, with internal consistency confirmed (Cronbach’s α = 0.866), thereby ensuring interpretive clarity, analytical precision, and mitigating potential collinearity [61,62].
In addition to this refinement, comprehensive model diagnostics were undertaken to further ensure the robustness, reliability, and generalisability of the regression results. Condition Index values were below 10 for all models and below 15 for Model 3, remaining well within acceptable thresholds [63,64,65], thereby confirming the absence of harmful multicollinearity. These procedures collectively reinforce the credibility of the final model and strengthen the validity of the inferences drawn from the analysis.
The results of the ANOVA analysis (Table 7) confirm the high statistical significance of all models (p < 0.001). The F-test values significantly exceed the critical thresholds, further validating that all predictors included in the models are relevant for explaining the variance in overall user satisfaction with UGS-NS.
The contribution of each predictor is detailed in Table 8, offering a clear comparison of how different UGS functions influence overall user satisfaction in Novi Sad.
In Model 1, the economic–ecological functions demonstrate a positive and highly significant effect (B = 0.718; Beta = 0.755; t = 37.852; p < 0.001). In Model 2, their influence further strengthens (B = 0.863; Beta = 0.907), while the psychological–cultural functions exhibit a negative and statistically significant impact (B = −0.239; Beta = −0.258; t = −11.033; p < 0.001), suggesting a potential mismatch between user expectations and actual experiences associated with cultural and psychological features of UGS-NS. Possible contributors may include perceived lack of safety, insufficient cultural programming, or under-maintained areas. In Model 3, the economic–ecological effect decreases (B = 0.782; Beta = 0.822), whereas the negative influence of psychological–cultural functions intensifies (B = −0.447; Beta = −0.483; t = −19.530; p < 0.001). The most substantial positive contribution comes from socio–community functions (B = 0.251; Beta = 0.401; t = 16.848; p < 0.001), highlighting their key role in shaping a positive user experience in Novi Sad.
Testing of hypotheses:
H1: The testing of statistical significance confirms a positive relationship between the economic and ecological functions and overall satisfaction (Model 1: B = 0.718; Beta = 0.755/Model 2: B = 0.863; Beta = 0.907/Model 3: B = 0.782; Beta = 0.822; all p < 0.001). Hypothesis H1 is confirmed through all model specifications.
H2: Psychological–cultural functions show a negative and statistically significant relationship with satisfaction (Model 2: Beta = −0.258; t = −11.033/Model 3: Beta = −0.447; t = −19.530; p < 0.001). Hypothesis H2 is confirmed, but in the negative direction.
H3: Socio–community functions have the strongest positive impact on satisfaction (Model 3: Beta = 0.251; t = 16.848; p < 0.001), confirming Hypothesis H3 as the positive predictor of overall user satisfaction with UGS.
These findings are generally in line with previous research by Kothencz et al. [8] and Li et al. [60], which emphasise the importance of social functions for urban green space satisfaction. However, the role of psychological dimensions remains less consistently reported across studies. Despite the robustness of the regression models, it is important to note certain limitations. These include reliance on self-reported perceptions, which may introduce subjectivity, and the contextual specificity of Novi Sad, which may affect the broader generalisability of the results. The results clearly confirm that the perception of specific functions of urban green spaces significantly shapes user satisfaction, with socio–community dimensions playing a central role in creating a positive experience in the urban environment. To further validate the strength of the final model, model diagnostics including multicollinearity testing (VIF < 2 for all predictors) and 10-fold cross-validation were applied. These procedures confirmed the stability and generalisability of the regression results and supported the robustness of the findings, particularly in capturing the multidimensional influences on user satisfaction with UGS in Novi Sad.

5. Discussion

The role of urban green spaces (UGS) in enhancing the quality of life in cities has been extensively studied, particularly in terms of their ecological, social, economic, and psychological functions. These studies frequently emphasise the significant impact of UGS on physical and mental well-being, their role in fostering social integration, preserving biodiversity, and alleviating the adverse effects of urban environments. Given the increasing emphasis on sustainable urban development, this research on user perceptions and functional assessments of UGS in Novi Sad offers valuable insights into the specific benefits and challenges associated with urban planning of these spaces.
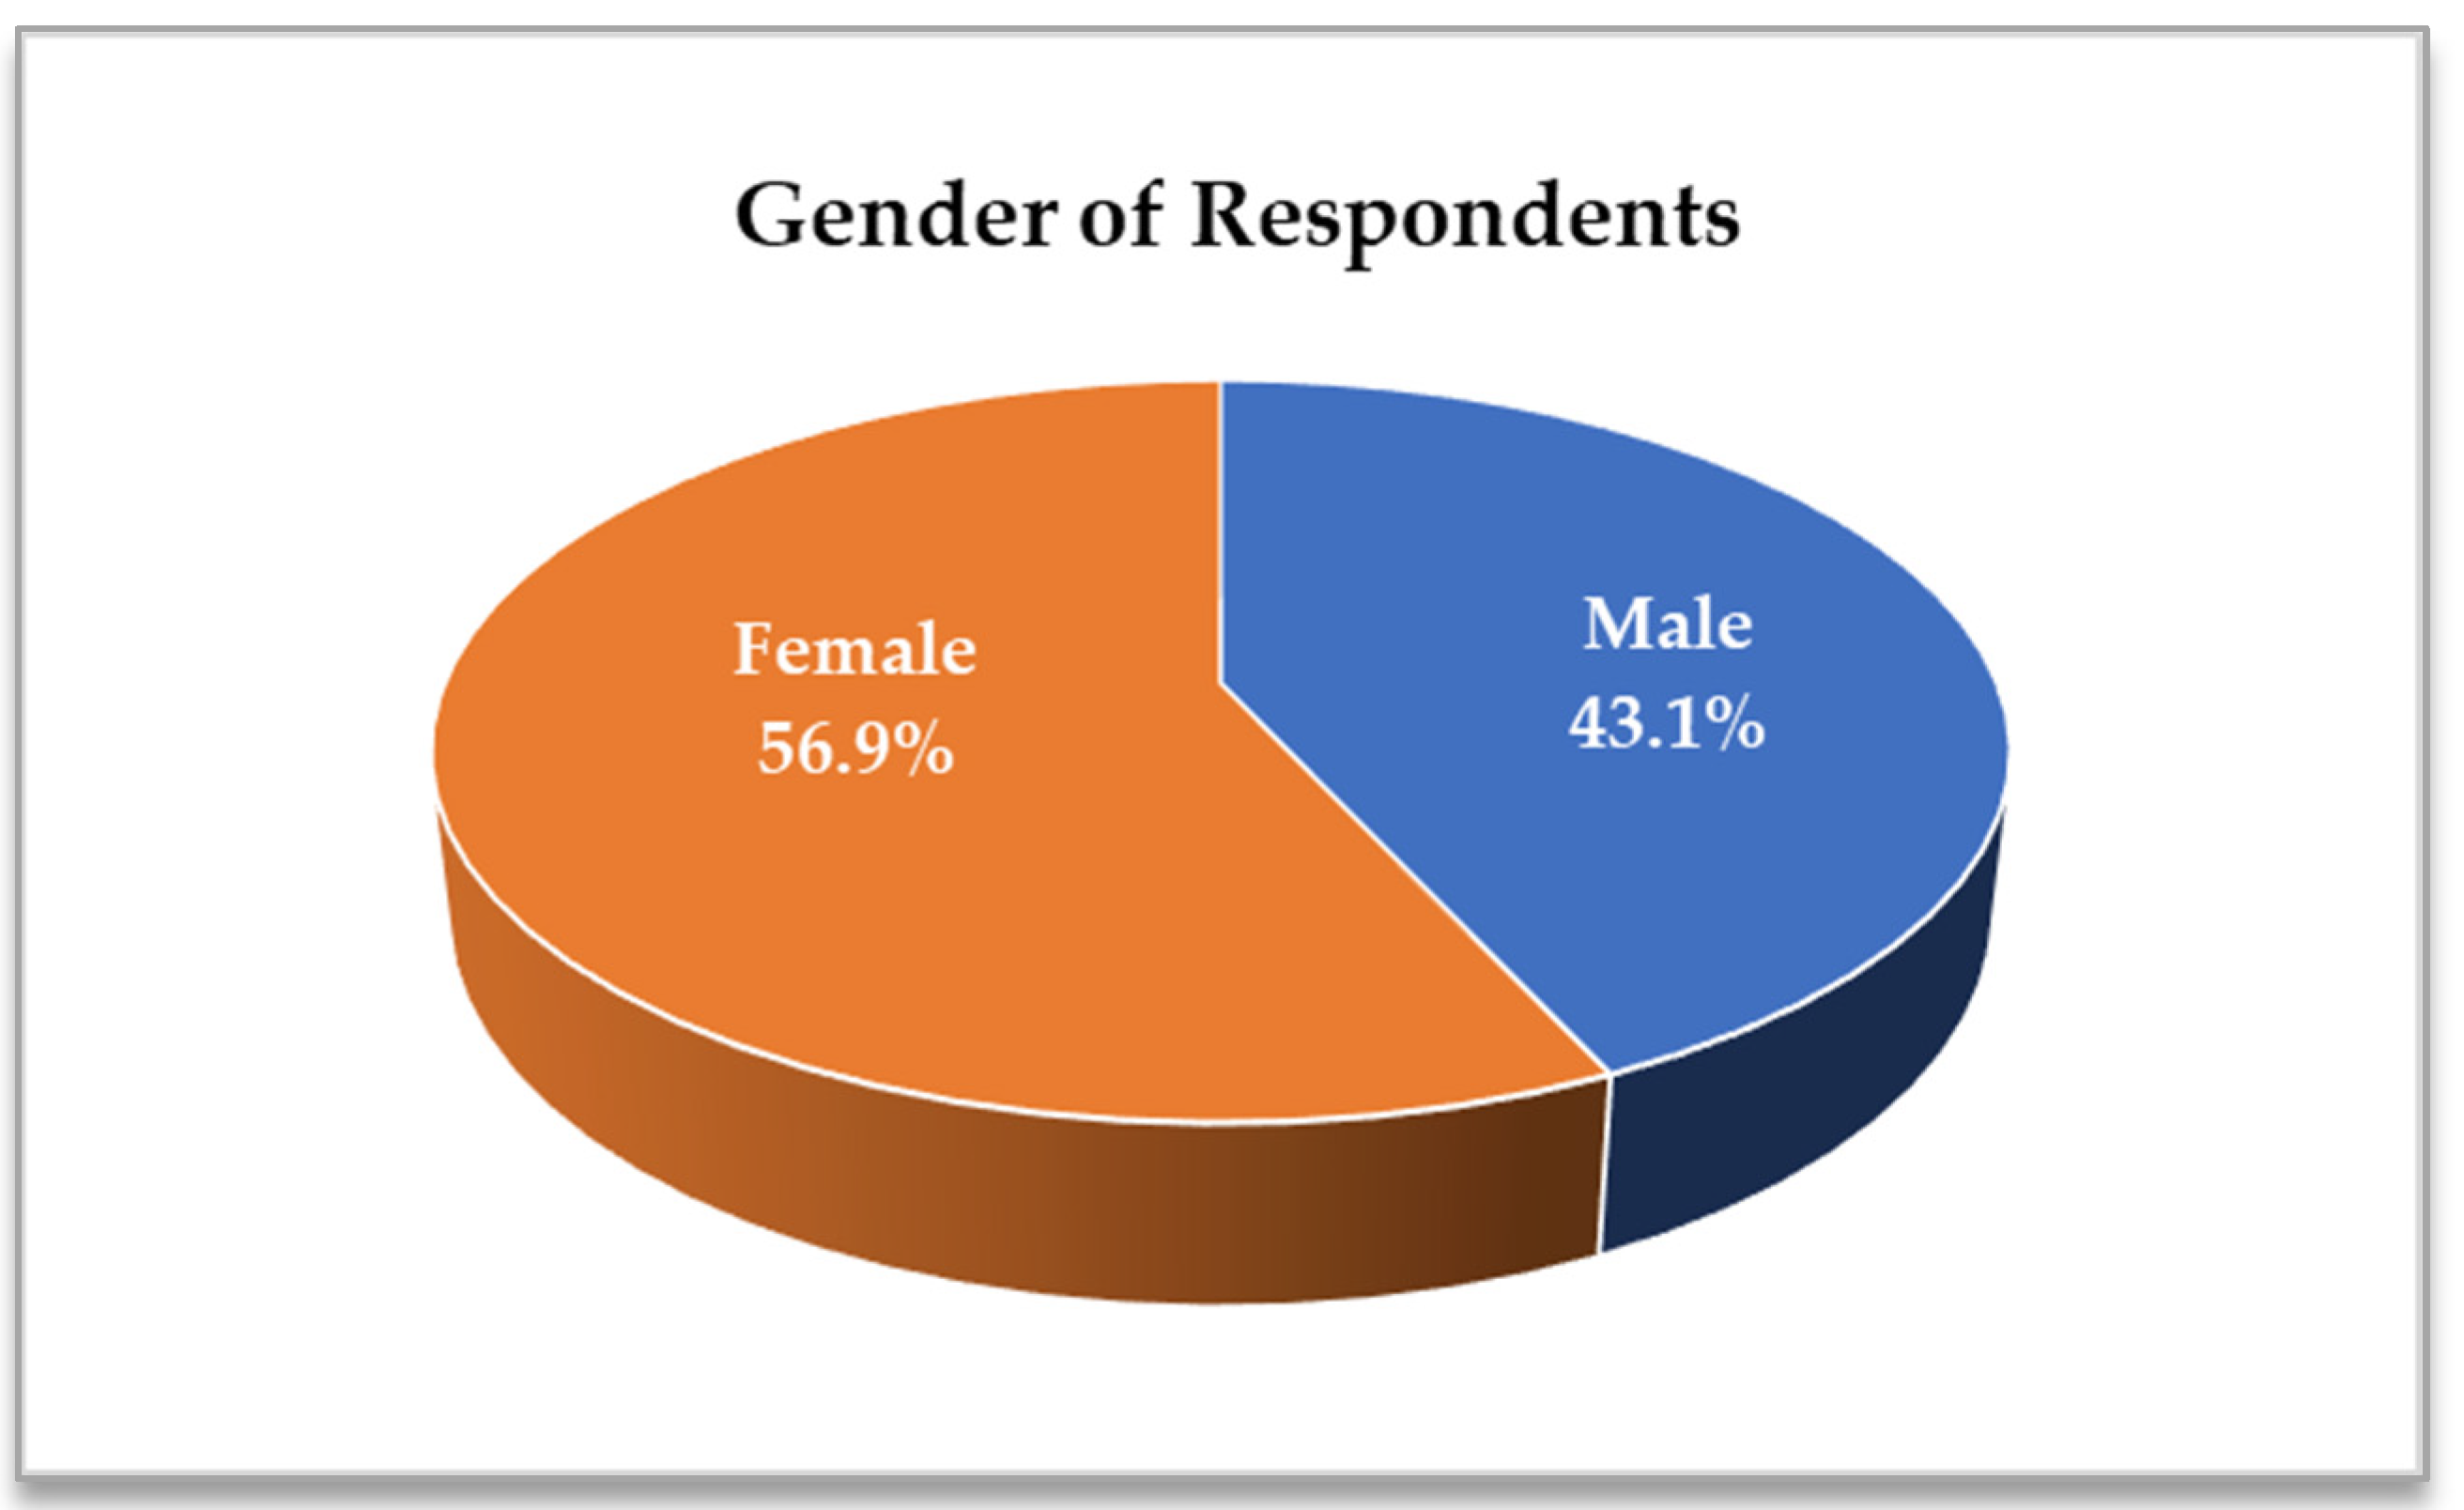
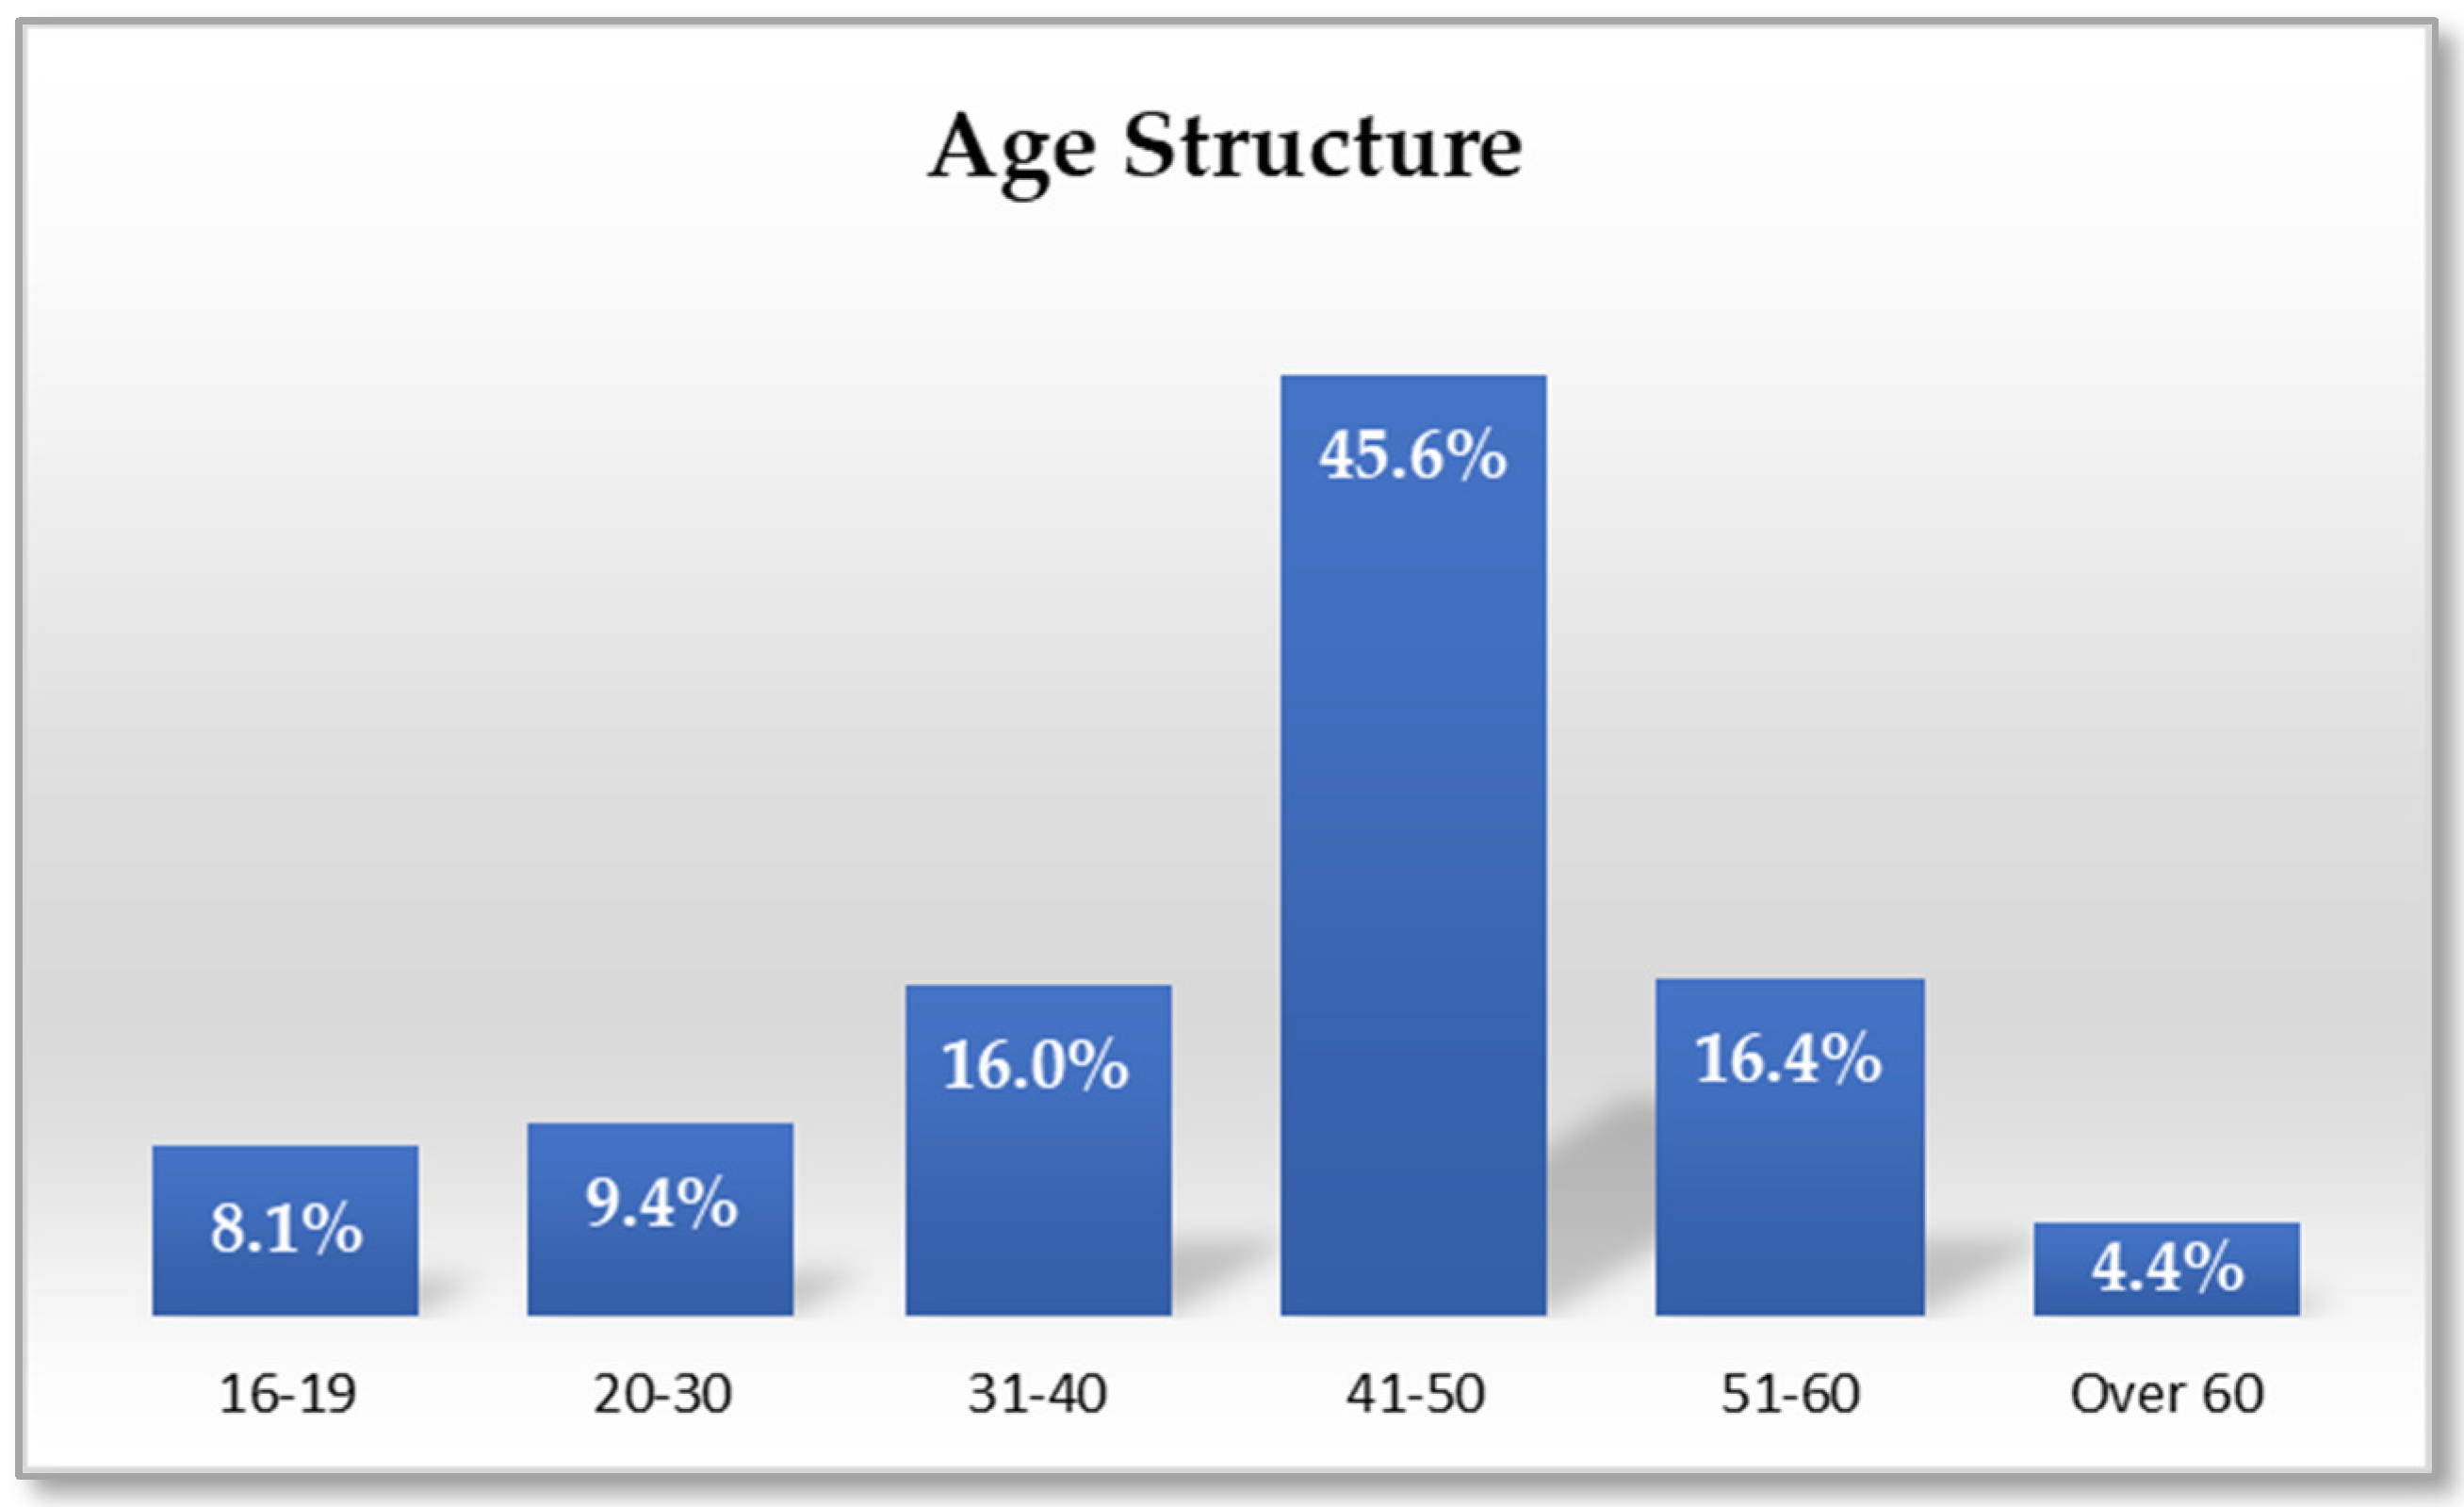
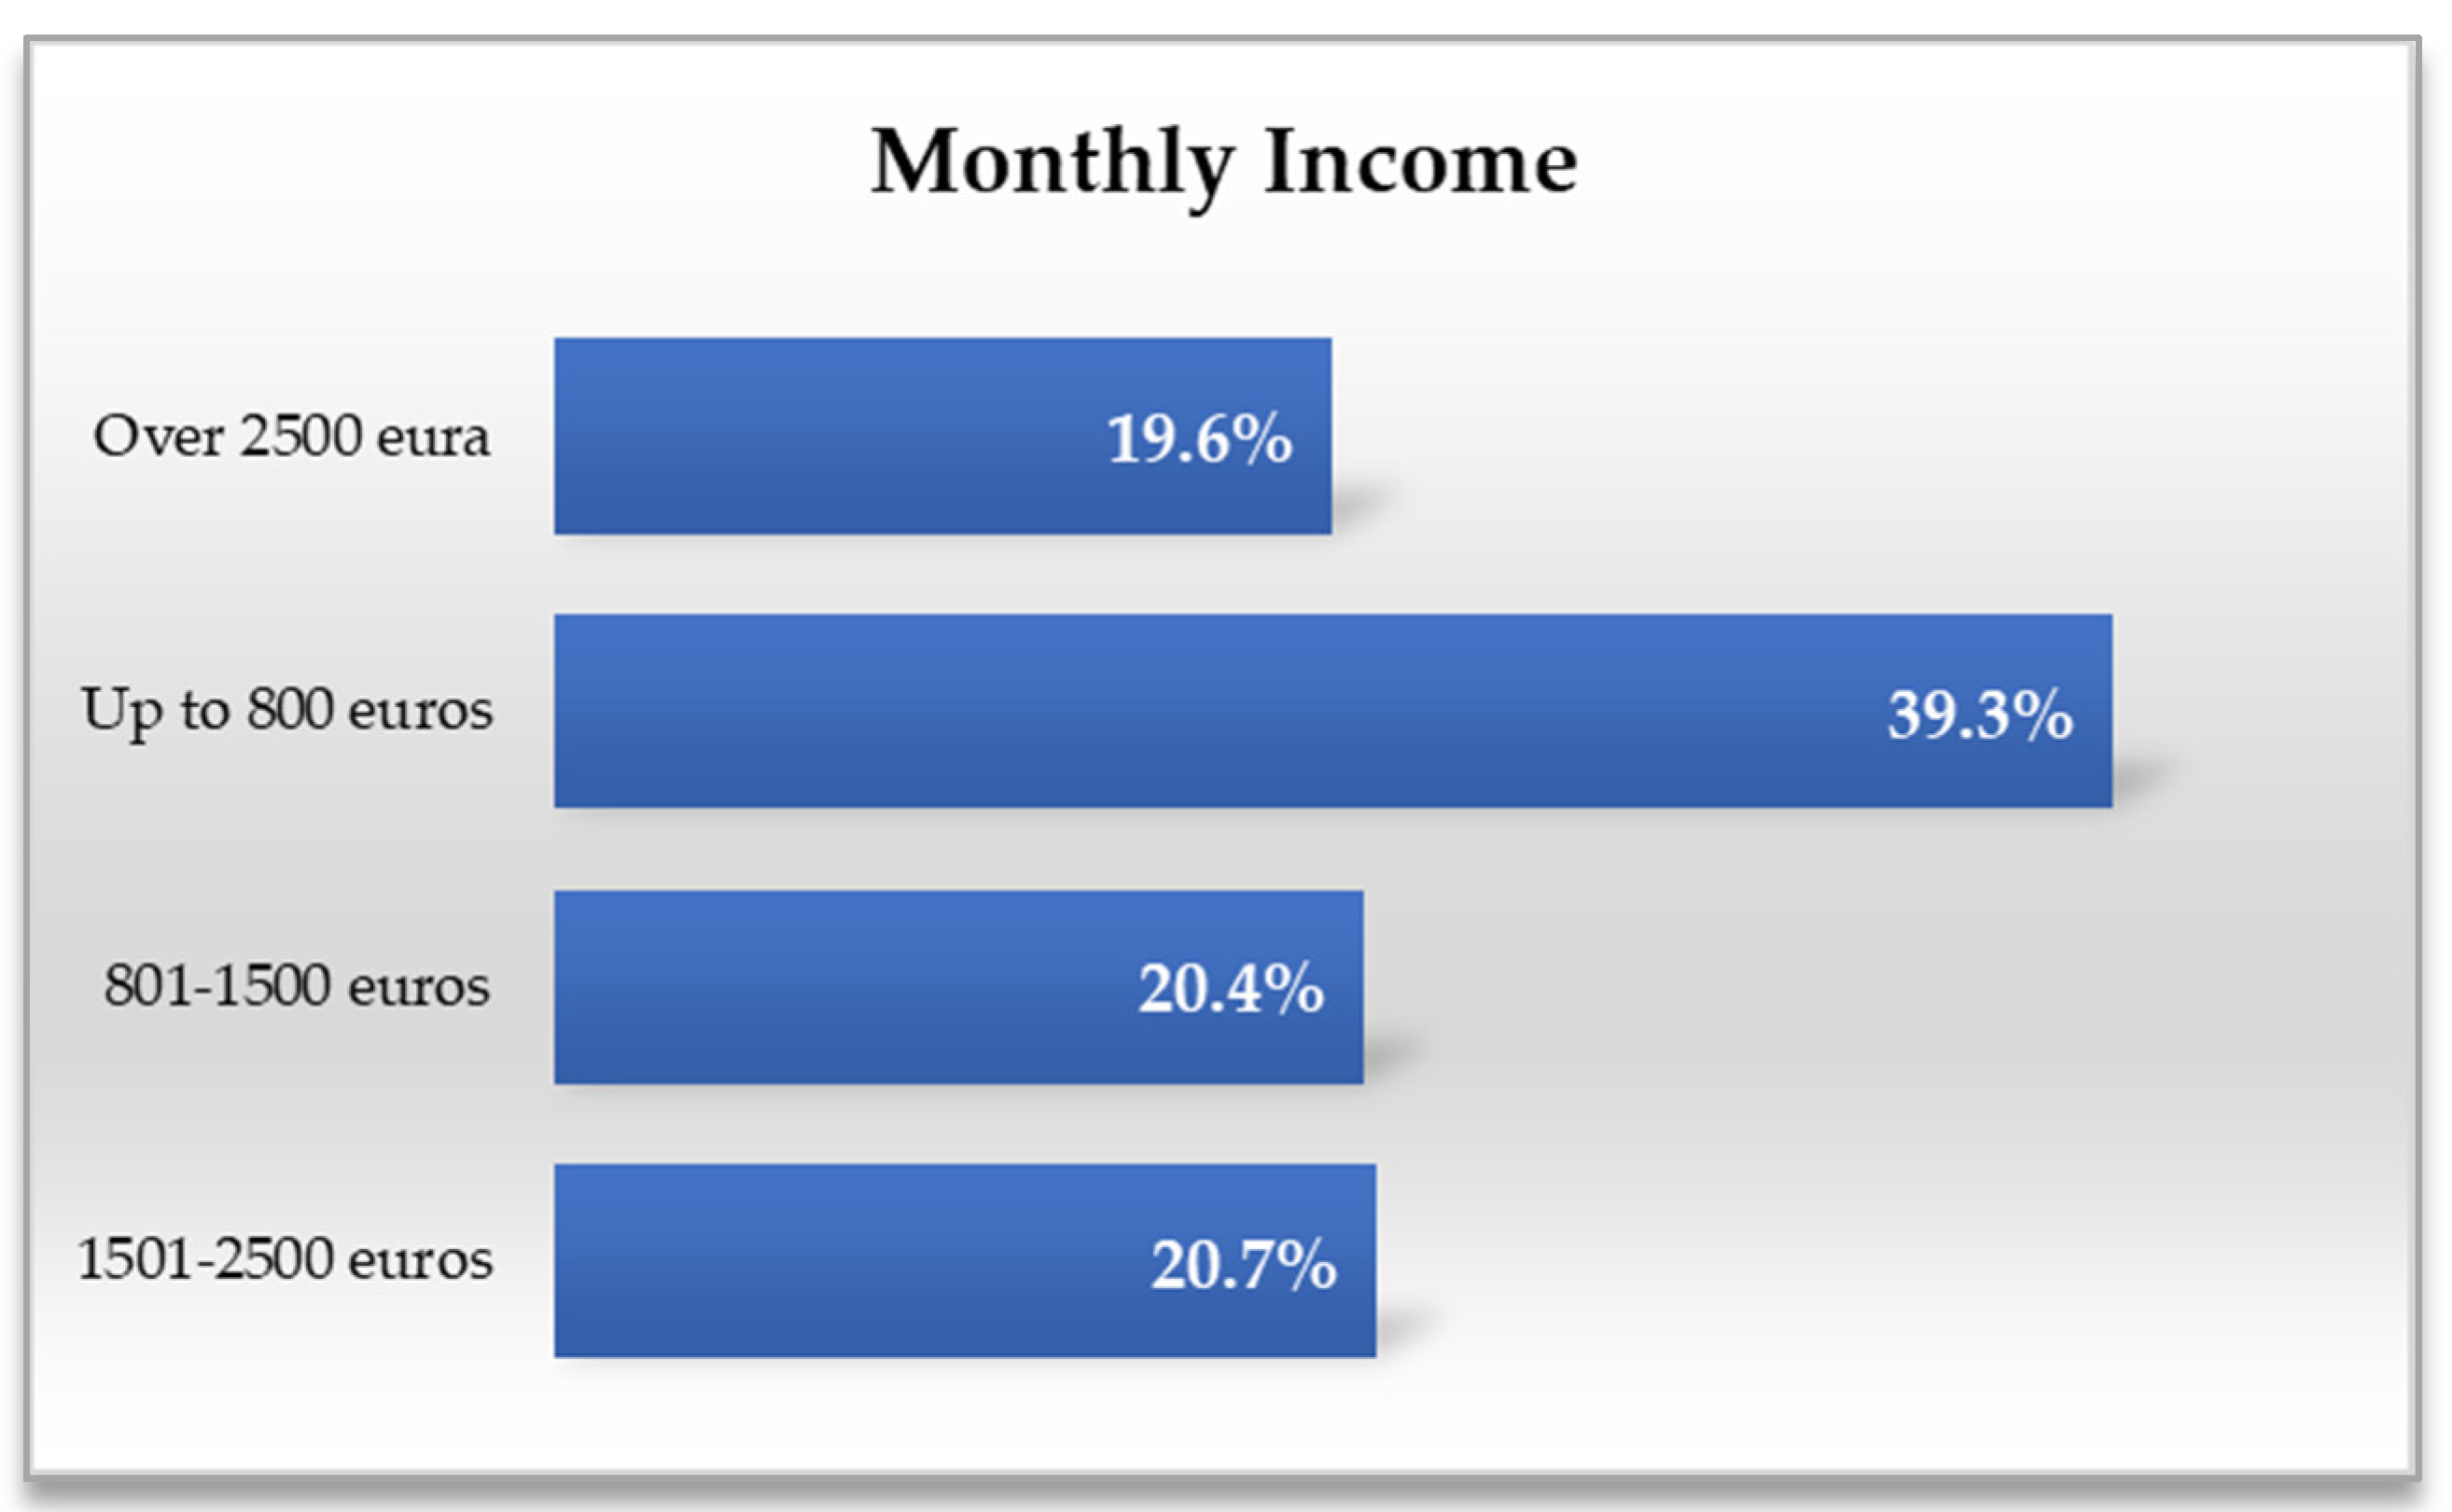
The results reveal that the majority of urban green space users in Novi Sad are women (56.9%), while men represent 43.1%. The age distribution of users reveals that they are predominantly middle-aged, with the largest proportion falling between 41 and 50 years old (45.6%), and those over 60 years old being the least represented (4.4%). Regarding monthly income, the highest number of respondents earn up to 800 euros (39.3%), while a smaller group earns more than 2500 euros (19.6%). These findings are consistent with previous studies suggesting that women are more frequent users of urban green spaces, likely due to their greater interest in health and social interactions [45]. Additionally, older individuals and those with lower incomes tend to use green spaces less, highlighting the opportunity to improve the accessibility and inclusiveness of these spaces [32].
The analysed perceptions of users regarding the social functions of urban green spaces indicate that UGS are recognised as spaces for social interactions, connecting individuals of various ages and cultures, and enhancing the quality of social relationships within urban environments. Furthermore, significant differences in perceptions between male and female respondents were identified, with men generally providing higher ratings. These findings highlight the role of UGS in fostering social cohesion, in line with research suggesting that green spaces are essential for strengthening social bonds and reducing social isolation [66]. These findings are consistent with recent research by Xu et al., which confirms the role of UGS in fostering community belonging and bridging social differences in medium-sized European cities [7]. The observed differences in perception between genders may reflect distinct needs and expectations, particularly regarding safety and privacy, which should be carefully considered when designing and adapting urban green spaces. These findings are in line with Gao et al., who identified clear gender-based distinctions in how older men and women perceive UGS in Macau, particularly in relation to children’s facilities, social activities, and landscape preferences [17].
Users of UGS in Novi Sad express moderate satisfaction with various aspects. The highest satisfaction is observed regarding social and recreational facilities, while the lowest ratings are for safety, cleanliness, and infrastructure. Women and middle-aged individuals (41–50 years) report the highest satisfaction, while older users and those with lower incomes show lower satisfaction. These findings align with previous studies linking satisfaction to infrastructure quality, safety, and maintenance [67]. Low satisfaction with cleanliness and safety highlights the need for increased investment in maintenance and security [68]. Additionally, fostering partnerships between property owners and users in the upkeep and development of amenities may improve satisfaction, supporting earlier research on collaborative management [69].
The functions of UGS in Novi Sad that received the highest ratings include stress reduction, improvement of microclimate, pollution reduction, and enhancement of overall health. These results align with previous studies highlighting the significant ecological and psychological benefits that UGS provide to users, such as reducing stress and improving mental health [70]. Furthermore, UGS play a crucial role in supporting mental health, particularly among individuals living alone [71]. Visitor numbers and traffic noise significantly influence user preferences for UGS, with similar preferences observed concerning psychological benefits. This indicates that targeted UGS design can address specific restorative needs of users [72]. These findings reinforce the need for strategies that incorporate wider pathways, trees, and small urban forests, as well as the reduction of traffic noise, to optimise the psychological benefits for users. Recent studies by Ghavimi et al. also support the significance of integrating recreational and environmental values into green space design for increased user satisfaction and mental well-being [4].
Users of UGS in Novi Sad rated the ecological and economic values of these spaces highly, including their impact on increasing property values in surrounding areas, reducing urban noise, and their cultural significance. These findings support theories that emphasise UGS as not only ecologically vital but also as having a significant economic and cultural impact on cities. The data suggest that green spaces can positively influence the real estate market and contribute to the creation of a city’s cultural identity [73]. This confirms that investing in UGS can yield long-term economic benefits for the community. By strengthening cultural identity and economic vitality, UGS also directly contribute to the urban quality of life, particularly in rapidly developing urban centres. Similar conclusions have been reached in studies on the cultural ecosystem services of UGS, highlighting their importance for urban quality of life and public health, as well as their role in enhancing ecological awareness and fostering social cohesion. Urban green spaces, especially parks, play a critical role in improving social interaction and promoting social cohesion among visitors, further confirming the value of these spaces in modern urban communities [74]. Moreover, UGS play an important role in social cohesion by encouraging positive social interactions that can contribute to better health outcomes through increased physical activity and social engagement [66].
Novi Sad, often referred to as the “Serbian Athens”, is known for its vibrant cultural scene, including renowned events such as the EXIT Festival and Sterijino Pozorje, as well as cultural institutions like Matica Srpska and the Gallery of Matica Srpska. However, unlike some European cities where green spaces frequently serve as venues for organised cultural events, respondents in this study expressed expectations for more cultural activities to be hosted within UGS-NS. This perceived discrepancy between cultural expectations and actual usage may help explain the negative influence of psychological–cultural functions on overall satisfaction. A similar gap between expectation and experience was identified by Neuner et al., who noted that users often associate cultural functions with place identity, and when such associations are absent, satisfaction tends to decline [69]. Further research could explore this divergence in more depth and assess its implications for cultural programming in urban green spaces.
The results of the regression analysis clearly indicate that the economic–ecological functions of UGS have a significant impact on overall user satisfaction, while psychological–cultural functions, although significant, exhibit a negative influence in some models. Given the strong correlation (R = 0.834) in Model 3, which incorporates socio–community functions, it can be concluded that these functions are crucial in shaping a positive user experience. These findings align with prior research that underscores the multifaceted role of urban green spaces, highlighting their significant contribution to social cohesion and mental health [71].
The influence of socio–community functions in our study confirms that urban green spaces play a vital role in fostering social connections and reducing social isolation. This finding aligns with previous research indicating that green spaces can contribute to improved social integration and stress reduction [66]. Although psychological–cultural functions had a negative impact in some instances, the results highlight that these aspects warrant further exploration, especially regarding user expectations and their specific needs. The apparent mismatch between expectations and user experiences, as revealed in the analysis, could explain the negative assessments in certain areas. This discrepancy likely reflects the insufficient presence or visibility of cultural infrastructure, programming, and activities in UGS-NS. While users may associate green spaces with opportunities for cultural engagement, such as public performances, exhibitions, or educational programming, the limited availability of such features in Novi Sad’s green areas might result in unmet expectations and, consequently, lower satisfaction scores for this functional dimension [4,69]. This underscores the need for future research to focus on the more precise design of green spaces that address the distinct social and psychological needs of users.
Through the regression model analysis and the contribution of each predictor, it is evident that an increase in socio–community functions can significantly enhance user satisfaction, aligning with studies confirming that social cohesion and interactions are key to improving health and quality of life [73]. These findings carry significant implications for strategic urban planning and the effective implementation of green infrastructure, emphasising the need for a holistic approach that integrates economic, ecological, psychological, and social dimensions. Future research should further explore how specific characteristics of urban green spaces, such as size and vegetation type, may influence these dimensions, as well as how such spaces can be more effectively utilised to enhance environmental quality and promote social integration.
Considering the pivotal role of socio–community functions in shaping user satisfaction, it is crucial to emphasise that urban green space planning should prioritise designs that encourage social cohesion and foster positive social interactions. Future research should focus on the specific characteristics of urban green spaces that impact different demographic groups, as well as the long-term effects on mental health and social integration. Additionally, well-designed urban green spaces are a vital component of sustainable urban development as they help mitigate the adverse effects of urbanisation, such as pollution and climate change, while enhancing the overall quality of life in cities. Studies confirm the importance of urban green spaces for the real estate market, cultural identity, and their positive influence on social cohesion and mental health [73,74,75]. These findings underscore that investments in urban green spaces can bring long-term economic and social benefits, highlighting the need for strategies focused on the sustainable management and planning of green spaces in urban areas. In this context, the integration of ESG factors is becoming increasingly important as it supports not only the ecological but also the social dimensions of user satisfaction and enhances the governance practices in urban green space management. These findings are in line with research by Sondou et al., which emphasises the importance of strengthening participatory governance in urban planning to improve trust, inclusiveness, and responsiveness to local needs [21]. Incorporating ESG-related practices into urban planning frameworks ensures that green spaces are managed in a way that meets sustainability goals, fosters social inclusivity, and promotes long-term ecological health [19,29,30]. This is further supported by recent research on the integration of digital tools and AI-powered systems in public and educational sectors, which shows their potential to enhance transparency, stakeholder engagement, and strategic decision-making processes [76]. The integration of AI tools into different urban planning phases can further support public participation and streamline formal procedures, offering planners analytical, textual, and visual assistance, without replacing human decision-making, as emphasised by Othengrafen et al. [22].
The findings of this study reaffirm the multidimensional value of UGS, especially their capacity to support sustainability, inclusivity, and public health objectives, with a particular emphasis on their socio–community, ecological, and psychological functions. By integrating comparative research insights and recognising the growing importance of participatory approaches and digital tools, this analysis offers a deeper understanding of user satisfaction in urban environments. The incorporation of ESG principles and AI-supported mechanisms into planning processes presents further opportunities to enhance governance quality, transparency, and social inclusiveness. These perspectives provide a strong foundation for the concluding considerations and recommendations aimed at fostering more sustainable and socially responsive urban green space management.

6. Conclusions

This study examined how the functional characteristics of urban green spaces (UGS) in Novi Sad influence user satisfaction, confirming their contribution to quality of life and sustainability. The analysis focused on the impacts of ecological, economic, psychological, and socio–community dimensions, underscoring the importance of a multidimensional approach to evaluating the sustainability of these spaces. The findings indicate that users highly value the ecological, economic, and social functions of UGS, particularly those related to stress reduction, improved microclimates, pollution mitigation, and enhanced social cohesion. These factors not only support improvements in physical and mental health but also significantly enhance the urban quality of life by shaping positive user experiences and fostering social interaction.
The increase in user satisfaction with UGS in Novi Sad reinforces the need to strategically integrate a broader range of functional characteristics into the planning and development of these spaces. Sustainable management and inclusive design of urban green spaces are essential for securing long-term ecological, social, and economic benefits. Environmental, Social, and Governance (ESG) factors are key to enhancing the planning, coordination, and maintenance of UGS as they enable better consideration of community needs and ecological responsibility.
Urban planners could prioritise targeted investments in safety infrastructure and cultural programming within UGS to address identified gaps in satisfaction, particularly among older and lower-income users. Additionally, participatory planning mechanisms and the strategic use of digital tools could support greater inclusiveness and responsiveness in green space governance. These findings provide actionable guidance for local authorities in aligning urban green space planning more closely with community priorities and long-term sustainability objectives.
Based on this research, it is recommended that urban planners and decision-makers continue to implement strategies that improve access to and usage of UGS, including reducing access barriers, improving infrastructure, and engaging the community in the maintenance and use of these spaces. Moreover, the integration of ESG factors in the strategic planning and management of UGS will further contribute to the sustainability and long-term well-being of urban communities.
Further research should focus on the specific characteristics of UGS that have the greatest impact on different demographic groups, as well as the long-term effects on mental health and social integration. Additionally, future studies can aid in better understanding and evaluating the various functional characteristics that contribute to the overall quality of life and sustainability of urban environments, with ESG factors playing a crucial role in enhancing the management of these spaces. This study has certain limitations. The findings are based on data collected from a single urban setting, Novi Sad, which may affect their applicability to cities with different socio–cultural, economic, or spatial characteristics. Moreover, the cross-sectional design does not allow for insights into seasonal or longitudinal changes in user perceptions. The governance component within the ESG framework was assessed through perceptual indicators, without direct evaluation of institutional performance. Future research should integrate user-centred insights with institutional and spatial assessments, employing longitudinal designs to more accurately capture the dynamic relationships between green space characteristics and user outcomes.

Author Contributions

Conceptualization, V.D.; methodology, S.I.; software, J.L.; validation, R.P. and A.P.; formal analysis, N.L.; investigation, J.G.; resources, M.Č.; data curation, M.Č.; writing—original draft preparation, S.I.; writing—review and editing, J.V.T.; visualization, R.P.; supervision, A.P.; project administration, J.G.; funding acquisition, S.I. All authors have read and agreed to the published version of the manuscript.

Funding

This research received no external funding.

Institutional Review Board Statement

Not applicable.

Informed Consent Statement

Not applicable.

Data Availability Statement

The original contributions presented in this study are included in the article. Further inquiries can be directed to the corresponding author.

Acknowledgments

This research was supported by grant No. 142-451 “Improving the competitiveness of organic food products in the functions of sustainable development of AP Vojvodina”.

Conflicts of Interest

The authors declare no conflicts of interest.

References

  1. Aroh, K. Globalization, industrialization and population growth: The fundamental drivers of pollution in a given society (India). SSRN Electron. J. 2018. [CrossRef]
  2. Angel, S.; Parent, J.; Civco, D.L.; Blei, A.; Potere, D. The dimensions of global urban expansion: Estimates and projections for all countries, 2000–2050. Prog. Plan. 2011, 75, 53–107. [Google Scholar] [CrossRef]
  3. Lopes, H.S.; Vidal, D.G.; Cherif, N.; Silva, L.; Remoaldo, P.C. Green infrastructure and its influence on urban heat island, heat risk, and air pollution: A case study of Porto (Portugal). J. Environ. Manag. 2025, 376, 124446. [Google Scholar] [CrossRef] [PubMed]
  4. Ghavimi, A.; Schuessler, F.; Pesch, R. A framework to evaluate public green spaces with an emphasis on recreational values for sustainable urban and rural areas: A systematic review and content analysis. Heliyon 2025, 11, e41553. [Google Scholar] [CrossRef]
  5. Sousa-Silva, R.; Zanocco, C. Assessing public attitudes towards urban green spaces as a heat adaptation strategy: Insights from Germany. Landsc. Urban Plan. 2024, 245, 105013. [Google Scholar] [CrossRef]
  6. Zhang, F.; Qian, H. A comprehensive review of the environmental benefits of urban green spaces. Environ. Res. 2024, 252, 118837. [Google Scholar] [CrossRef]
  7. Xu, Z.; Georgiadis, T.; Cremonini, L.; Marini, S.; Toselli, S. The perceptions and attitudes of residents towards urban green spaces in Emilia-Romagna (Italy)—A case study. Land 2025, 14, 13. [Google Scholar] [CrossRef]
  8. Kothencz, G.; Kolcsár, R.A.; Cabrera-Barona, P.; Szilassi, P. Urban green space perception and its contribution to well-being. Int. J. Environ. Res. Public Health 2017, 14, 766. [Google Scholar] [CrossRef]
  9. Mayen Huerta, C. Understanding the pathways between the use of urban green spaces and self-rated health: A case study in Mexico City. PLoS ONE 2023, 18, e0295013. [Google Scholar] [CrossRef]
  10. Phillips, A.; Khan, A.Z.; Canters, F. Use-related and socio-demographic variations in urban green space preferences. Sustainability 2021, 13, 3461. [Google Scholar] [CrossRef]
  11. Egea-Cariñanos, P.; Calaza-Martínez, P.; López Roche, D.; Cariñanos, P. Uses, attitudes and perceptions of urban green spaces according to the sociodemographic profile: An exploratory analysis in Spain. Cities 2024, 150, 104996. [Google Scholar] [CrossRef]
  12. Jim, C.Y.; Shan, X. Socioeconomic effect on perception of urban green spaces in Guangzhou, China. Cities 2013, 31, 123–131. [Google Scholar] [CrossRef]
  13. Dawson, L.; Elbakidze, M.; Yamelynets, T.; Kraft van Ermel, L.E.; Johansson, K.E.; Schaffer, C. Urban greenspace for social integration: Which types of greenspace do new-Swedes prefer and why? Urban For. Urban Green. 2024, 95, 128310. [Google Scholar] [CrossRef]
  14. Wolch, J.R.; Byrne, J.; Newell, J.P. Urban green space, public health, and environmental justice: The challenge of making cities ‘just green enough’. Landsc. Urban Plan. 2014, 125, 234–244. [Google Scholar] [CrossRef]
  15. Haq, S.M.A.; Islam, M.N.; Siddhanta, A.; Ahmed, K.J.; Chowdhury, M.T.A. Public perceptions of urban green spaces: Convergences and divergences. Front. Sustain. Cities 2021, 3, 755313. [Google Scholar] [CrossRef]
  16. Latinopoulos, D. Evaluating the importance of urban green spaces: A spatial analysis of citizens’ perceptions in Thessaloniki. Euro-Mediterr. J. Environ. Integr. 2022, 7, 299–308. [Google Scholar] [CrossRef]
  17. Gao, Y.-F.; Ye, X.; Li, W.-K.; Zhou, Q.-Q.; Li, R.-Y.; Wang, H.-Y.; Shang, Y.-Z. Older people’s perceptions of urban green spaces in Macau and gender differences. Proc. Inst. Civ. Eng. Urban Des. Plan. 2025, 178, 21–41. [Google Scholar] [CrossRef]
  18. Ivaniš, M.; Vapa Tankosić, J.; Ignjatijević, S.; Lekić, N. Green Banking Transition as a Factor of Sustainable Development. Ekon. Teor. I Praksa 2024, 17, 1–16. [Google Scholar] [CrossRef]
  19. Kopnina, H.; Zhang, S.R.; Anthony, S.; Hassan, A.; Maroun, W. The inclusion of biodiversity into Environmental, Social, and Governance (ESG) framework: A strategic integration of ecocentric extinction accounting. J. Environ. Manag. 2024, 351, 119808. [Google Scholar] [CrossRef]
  20. Dobrick, J.; Klein, C.; Zwergel, B. ESG as a risk factor. J. Asset Manag. 2025, 26, 44–70. [Google Scholar] [CrossRef]
  21. Sondou, T.; Dotsu, M.Y.; Anoumou, K.R.; Samon, S.P.; Chenal, J.; Aholou, C.C. Urban planning through participatory democracy: Analysis of citizen participation in urban planning in Ho (Ghana) and Kpalimé (Togo). Sustainability 2025, 17, 1161. [Google Scholar] [CrossRef]
  22. Othengrafen, F.; Sievers, L.; Reinecke, E. From vision to reality: The use of artificial intelligence in different urban planning phases. Urban Plan. 2025, 10, 8576. [Google Scholar] [CrossRef]
  23. Sesay, R.E.V.; Fang, P. Circular economy in municipal solid waste management: Innovations and challenges for urban sustainability. J. Environ. Prot. 2025, 16, 35–65. [Google Scholar] [CrossRef]
  24. Ashinze, U.K.; Edeigba, B.A.; Umoh, A.A.; Biu, P.W.; Daraojimba, A.I. Urban green infrastructure and its role in sustainable cities: A comprehensive review. World J. Adv. Res. Rev. 2024, 21, 928–936. [Google Scholar] [CrossRef]
  25. Čavlin, M.; Prdić, N.; Ignjatijević, S.; Vapa Tankosić, J.; Lekić, N.; Kostić, S. Research on the determination of the factors affecting business performance in beekeeping production. Agriculture 2023, 13, 686. [Google Scholar] [CrossRef]
  26. Palliwoda, J.; Priess, J.A. What do people value in urban green? Linking characteristics of urban green spaces to users’ perceptions of nature benefits, disturbances, and disservices. Ecol. Soc. 2021, 26, 28. [Google Scholar] [CrossRef]
  27. World Bank Group. Održivi Gradovi u Srbiji: Oslobađanje Transformacionog Potencijala Gradova za Zelenu Tranziciju; World Bank Group: Washington, DC, USA, 2023; Available online: https://thedocs.worldbank.org/en/doc/6a5f2aabc657d772378d066419c62dbe-0080012024/original/SRB-Serbia-Sustainable-Cities-June-2023.pdf (accessed on 15 March 2025).
  28. Vapa Tankosić, J.; Prodanović, R.; Medović, V. Analysis of agri-environmental management practices and their implementation in the agricultural policies of the Republic of Serbia. Sustainability 2023, 15, 12476. [Google Scholar] [CrossRef]
  29. Čavlin, M.; Dmitrović, V.; Jakovljević, N.; Đurović, M. An innovative model for performance analysis of sustainability reports. J. Agron. Technol. Eng. Manag. 2024, 7, 1276–1287. [Google Scholar] [CrossRef]
  30. Dmitrović, V.; Čavlin, M.; Jakovljević, N. Važnost izveštavanja o održivosti u funkciji poboljšanja društvene odgovornosti preduzeća. Ekon. Teor. I Praksa 2024, 17, 115–140. [Google Scholar] [CrossRef]
  31. Covachev, S.; Martel, J.; Brito-Ramos, S. Are ESG factors truly unique? N. Am. J. Econ. Financ. 2025, 77, 102386. [Google Scholar] [CrossRef]
  32. Saha, B.; Haq, S.M.A. Perception of urban green space among university students in Bangladesh. PLoS ONE 2024, 19, e0311033. [Google Scholar] [CrossRef]
  33. Braçe, O.; Garrido-Cumbrera, M.; Correa-Fernández, J. Gender differences in the perceptions of green spaces characteristics. Soc. Sci. Q. 2021, 102, 9. [Google Scholar] [CrossRef]
  34. Marin, A.M.; Kičić, M.; Vuletić, D.; Krajter Ostoić, S. Perception and attitudes of residents towards green spaces in Croatia—An exploratory study. South-East Eur. For. 2021, 12, 123–134. [Google Scholar] [CrossRef]
  35. Ordóñez, C.; Wheeler, M.A.; Raynor, K.; Panza, L.; Seely, H.; Adamovic, M. Advancing research on urban greenspace experiences and perceptions in disadvantaged communities: A social housing perspective. Urban For. Urban Green. 2022, 74, 127754. [Google Scholar] [CrossRef]
  36. Krajter Ostoić, S.; Konijnendijk van den Bosch, C.C.; Vuletić, D.; Stevanov, M.; Živojinović, I.; Mutabdžija-Bećirović, S.; Lazarević, J.; Stojanova, B.; Blagojević, D.; Stojanovska, M.; et al. Citizens’ perception of and satisfaction with urban forests and green space: Results from selected Southeast European cities. Urban For. Urban Green. 2017, 23, 93–103. [Google Scholar] [CrossRef]
  37. Ambrey, C.; Fleming, C. Public greenspace and life satisfaction in urban Australia. Urban Stud. 2013, 51, 1290–1321. [Google Scholar] [CrossRef]
  38. Terefe, A.E.; Hou, Y. Determinants influencing the accessibility and use of urban green spaces: A review of empirical evidence. City Environ. Interact. 2024, 24, 100159. [Google Scholar] [CrossRef]
  39. Rai, C.M.; Dorji, Y.; Zangmo, S. User satisfaction and the social and environmental benefits of urban green spaces: A case study of Thimphu city, Bhutan. Nakhara J. Environ. Des. Plan. 2022, 21, 216. [Google Scholar] [CrossRef]
  40. Jabbar, M.; Yusoff, M.M.; Aziz, S. Assessing the role of urban green spaces for human well-being: A systematic review. GeoJournal 2021, 87, 4405–4423. [Google Scholar] [CrossRef]
  41. Borycz, J.; Olendorf, R.; Specht, A.; Grant, B.; Crowston, K.; Tenopir, C.; Allard, S.; Rice, N.M.; Hu, R.; Sandusky, R.J. Perceived benefits of open data are improving but scientists still lack resources, skills, and rewards. Humanit. Soc. Sci. Commun. 2023, 10, 339. [Google Scholar] [CrossRef]
  42. Senetra, A.; Czaplicka, M.; Dudzińska, M.; Dawidowicz, A. Functional and aesthetic factors for well-being in age-friendly residential areas (AFRA) in Poland: An international comparative perspective. Sustainability 2024, 16, 8571. [Google Scholar] [CrossRef]
  43. Chen, W.; Huang, H.; Dong, J.; Zhang, Y.; Tian, Y.; Yang, Z. Social functional mapping of urban green space using remote sensing and social sensing data. ISPRS J. Photogramm. Remote Sens. 2018, 146, 436–452. [Google Scholar] [CrossRef]
  44. Zhao, Y.; van den Berg, P.E.W.; Ossokina, I.V.; Arentze, T.A. How do urban parks, neighbourhood open spaces, and private gardens relate to individuals’ subjective well-being: Results of a structural equation model. Sustain. Cities Soc. 2024, 101, 105094. [Google Scholar] [CrossRef]
  45. Law, C.M.Y.; Hui, L.C.; Jim, C.Y. Evaluation-perception of site attributes and plant species selection in the public urban green space of a compact city. Ecol. Soc. 2023, 28, 22. [Google Scholar] [CrossRef]
  46. Boavida, J.; Ayanoglu, H.; Pereira, C.V.; Hernandez-Ramirez, R. Active aging and smart public parks. Geriatrics 2023, 8, 94. [Google Scholar] [CrossRef]
  47. Vapa Tankosić, J.; Mirjanić, B.; Prodanović, R.; Lekić, S.; Carić, B. Digitalization in agricultural sector: Agriculture 4.0 for sustainable agriculture. J. Agron. Technol. Eng. Manag. 2024, 7, 1036–1042. [Google Scholar] [CrossRef]
  48. Wilson, J.; Xiao, X. The economic value of health benefits associated with urban park investment. Int. J. Environ. Res. Public Health 2023, 20, 4815. [Google Scholar] [CrossRef]
  49. Abdel-Shafy, H.I.; Mansour, M.S.M. Solid waste issue: Sources, composition, disposal, recycling, and valorization. Egypt. J. Pet. 2018, 27, 1275–1290. [Google Scholar] [CrossRef]
  50. Otundo Richard, M. Challenges in urban waste management and the role of green technology: Exploring future trends in circular economy for sustainable solutions in Nakuru and Mombasa, Kenya. SSRN Electron. J. 2024. [Google Scholar] [CrossRef]
  51. Velenturf, A.P.M.; Purnell, P. Principles for a sustainable circular economy. Sustain. Prod. Consum. 2021, 27, 1437–1457. [Google Scholar] [CrossRef]
  52. Nyika, J.; Dinka, M.O. The role of solid waste management in boosting sustainable development goals. In Exploring Waste Management in Sustainable Development Contexts; Mohan, C., Jeet, S., Dixit, S., Carabineiro, S.A.C., Eds.; IGI Global: New York, NY, USA, 2023; pp. 109–124. [Google Scholar] [CrossRef]
  53. Vapa Tankosić, J.; Ignjatijević, S.; Lekić, N.; Kljajić, N.; Ivaniš, M.; Andžić, S.; Ristić, D. The role of environmental attitudes and risk for adoption with respect to farmers’ participation in the agri-environmental practices. Agriculture 2023, 13, 2248. [Google Scholar] [CrossRef]
  54. Klimenta, D.; Lekić, J.; Arsić, S.; Tasić, D.; Krstić, N.; Radosavljević, D. A novel procedure for quick design of off-grid PV water pumping systems for irrigation. Elektron. Ir Elektrotechnika 2021, 27, 64–77. [Google Scholar] [CrossRef]
  55. Schrammeijer, E.A.; van Zanten, B.T.; Verburg, P.H. Whose park? Crowdsourcing citizen’s urban green space preferences to inform needs-based management decisions. Sustain. Cities Soc. 2021, 74, 103249. [Google Scholar] [CrossRef]
  56. James, N. Urbanization and its impact on environmental sustainability. J. Appl. Geogr. Stud. 2024, 3, 54–66. [Google Scholar] [CrossRef]
  57. Silhavy, R.; Silhavy, P.; Prokopova, Z. Analysis and selection of a regression model for the Use Case Points method using a stepwise approach. J. Syst. Softw. 2017, 125, 1–14. [Google Scholar] [CrossRef]
  58. Field, A.P. Discovering Statistics Using IBM SPSS Statistics, 6th ed.; Sage Publications: Los Angeles, CA, USA, 2024. [Google Scholar]
  59. Nunnally, J.C.; Bernstein, I.H. Psychometric Theory, 3rd ed.; McGraw-Hill: New York, NY, USA, 1994. [Google Scholar]
  60. Li, J.; Fu, J.; Gao, J.; Zhou, R.; Zhao, Z.; Yang, P.; Yi, Y. How do urban green space attributes affect visitation and satisfaction? An empirical study based on multisource data. Cities 2025, 156, 105543. [Google Scholar] [CrossRef]
  61. Song, M.K.; Lin, F.C.; Ward, S.E.; Fine, J.P. Composite variables: When and how. Nurs. Res. 2013, 62, 45–49. [Google Scholar] [CrossRef]
  62. Šverko, I.; Babatović, T. Applying career construction model of adaptation to career transition in adolescence: A two-study paper. J. Vocat. Behav. 2019, 111, 59–73. [Google Scholar] [CrossRef]
  63. Knoke, D.; Bohrnstedt, W.G.; Mee, A.P. Statistics for Social Data Analysis, 4th ed.; F.E. Peacock Publishers: Itasca, IL, USA, 2002. [Google Scholar]
  64. Belsley, D.A.; Kuh, E.; Welsch, R.E. Regression Diagnostics: Identifying Influential Data and Sources of Collinearity; John Wiley & Sons: Hoboken, NJ, USA, 2005. [Google Scholar]
  65. Dar, I.S.; Chand, S.; Shabbir, M.; Kibria, B.G. Condition-index based new ridge regression estimator for linear regression model with multicollinearity. Kuwait J. Sci. 2023, 50, 91–96. [Google Scholar] [CrossRef]
  66. Jennings, V.; Bamkole, O. The relationship between social cohesion and urban green space: An avenue for health promotion. Int. J. Environ. Res. Public Health 2019, 16, 452. [Google Scholar] [CrossRef] [PubMed]
  67. Loukaitou-Sideris, A. Is it Safe to Walk? 1 Neighborhood Safety and Security Considerations and Their Effects on Walking. J. Plan. Lit. 2006, 20, 219–232. [Google Scholar] [CrossRef]
  68. Tzoulas, K.; Korpela, K.; Venn, S.; Yli-Pelkonen, V.; Kaźmierczak, A.; Niemelä, J.; James, P. Promoting ecosystem and human health in urban areas using Green Infrastructure: A literature review. Landsc. Urban Plan. 2007, 81, 167–178. [Google Scholar] [CrossRef]
  69. Neuner, A.; Kremer, D.; Walker, B. Urban green spaces and mental wellbeing: A methodology for measuring structural characteristics of individual-level green space exposure and its associations with wellbeing. Geomatica 2025, 77, 100051. [Google Scholar] [CrossRef]
  70. Geary, R.S.; Thompson, D.A.; Garrett, J.K.; Mizen, A.; Rowney, F.M.; Song, J.; White, M.P.; Lovell, R.; Watkins, A.; Lyons, R.A.; et al. Green–blue space exposure changes and impact on individual-level well-being and mental health: A population-wide dynamic longitudinal panel study with linked survey data. Public Tyrväinen Health Res. 2023, 11, 1–176. [Google Scholar] [CrossRef]
  71. Pasanen, T.P.; White, M.P.; Elliott, L.R.; van den Bosch, M.; Bratman, G.N.; Ojala, A.; Korpela, K.; Fleming, L.E. Urban green space and mental health among people living alone: The mediating roles of relational and collective restoration in an 18-country sample. Environ. Res. 2023, 232, 116324. [Google Scholar] [CrossRef]
  72. Arnberger, A.; Eder, R.; Allex, B.; Wallner, P.; Weitensfelder, L.; Hutter, H.-P. Urban green space preferences for various health-related psychological benefits of adolescent pupils, university students, and adults. Urban For. Urban Green. 2024, 98, 128396. [Google Scholar] [CrossRef]
  73. Tyrväinen, L.; Ojala, A.; Korpela, K.; Lanki, T.; Tsunetsugu, Y.; Kagawa, T. The influence of urban green environments on stress relief measures: A field experiment. J. Environ. Psychol. 2014, 38, 1–9. [Google Scholar] [CrossRef]
  74. Dushkova, D.; Ignatieva, M.; Konstantinova, A.; Yang, F. Cultural ecosystem services of urban green spaces. How and what people value in urban nature? In Advanced Technologies for Sustainable Development of Urban Green Infrastructure; Springer International Publishing: Berlin/Heidelberg, Germany, 2021; pp. 292–318. [Google Scholar] [CrossRef]
  75. Paudel, S.; States, S.L. Urban green spaces and sustainability: Exploring the ecosystem services and disservices of grassy lawns versus floral meadows. Urban For. Urban Green. 2023, 84, 127932. [Google Scholar] [CrossRef]
  76. Su, M.; Ma, L.; Zhang, D.; Yunusa-Kaltungo, A.; Cheung, C. Exploring benefits and concerns of incorporating digital tools into engineering education. Eur. J. Educ. Pedagog. 2025, 6, 45–51. [Google Scholar] [CrossRef]
Figure 1. A flowchart of the analytical procedure used in the study.
Sustainability 17 04026 g001
Figure 9. Reported duration of stay in UGS.
Sustainability 17 04026 g009
Table 1. Perceptions of social and community functions of UGS-NS.
Social and Community Functions of UGS-NSMeanStd. Dev.MeanStd. Dev.MeanStd. Dev. χ2p-Value
TotalMaleFemale
UGS-NS facilitate social interaction by bringing together residents, serving as meeting points, and fostering social connections.3.411.3553.591.4853.291.234170.4820.000
UGS-NS contribute to the unique character of the city.3.981.273.831.2843.791.078170.7260.000
UGS-NS provide residents with a sense of belonging to their local community and the city.3.791.1754.261.2773.771.223169.6960.000
UGS-NS serve as spaces where people of different ages and cultural backgrounds come together.4.390.8044.041.2133.611.111169.6960.000
UGS-NS play a significant role in enhancing the quality of social relationships within the city.4.391.2094.520.8454.290.7573.9780.046
UGS-NS offer opportunities for academic education and student research.3.80.9924.301.2674.451.15935.4350.000
UGS-NS are valuable resources for researchers across various fields, including genetics, geology, biology, medicine, agriculture, and forestry.4.21.1763.811.0823.790.91714.5400.001
Children have opportunities for both play and learning in UGS-NS.4.391.2094.081.2114.291.1423.9780.046
UGS-NS offer suitable environments for informal education about nature, ecological processes, and environmental issues.4.191.1724.301.2674.451.159169.6960.000
UGS-NS are ideal spaces for recreation, providing areas for relaxation, sports, and play.3.981.274.281.2644.111.093169.6960.000
UGS-NS encourage healthy lifestyles.4.390.8044.261.2773.771.223169.6960.000
UGS-NS foster social cohesion by providing spaces for socialising, community development, and hosting cultural and social events.4.191.1724.520.8454.290.757169.6960.000
UGS-NS play a role in shaping the city’s cultural identity.3.811.1714.281.2644.111.09364.4700.000
Average value4.071.1374.161.1994.001.073
Source: Author’s calculation.
Table 2. Perceptions of user satisfaction with UGS-NS.
Satisfaction with UGS-NSMeanStd. Dev.MeanStd. Dev.MeanStd. Dev. χ2p-Value
TotalMaleFemale
Sports and recreational facilities of UGS-NS2.810.7522.820.8382.810.681169.6960.000
Cultural facilities of UGS-NS3.000.6392.790.4583.160.707169.6960.000
Children’s playgrounds in UGS-NS3.211.1662.830.8723.501.274171.1280.000
High level of public participation in the creation and maintenance of UGS-NS3.200.7523.030.7063.320.76463.0850.000
Development of partnerships between owners and users of private and public green spaces3.400.8053.310.8243.470.78414.5400.001
Accessibility, openness, and easy access to UGS-NS3.200.7543.290.8193.130.69375.7110.000
Attractiveness of UGS-NS3.211.1662.830.8723.501.274171.1280.000
Multifunctionality of UGS-NS and their adaptability to various user needs2.821.1542.841.2782.811.052170.7260.000
Social security at UGS-NS3.010.8912.810.8303.160.90664.4700.000
Care for the preservation of UGS-NS2.620.8072.580.8942.650.733170.4070.000
Cleanliness of UGS-NS3.210.7573.070.7263.310.76243.8410.000
Safety at UGS-NS3.010.8933.060.9882.970.811170.4820.000
Infrastructure of UGS-NS2.611.0042.561.0902.650.93244.0660.000
Development and planning of UGS-NS2.010.6271.800.4542.180.687168.0950.000
Isolation from crowds at UGS-NS2.420.7882.320.8182.500.75714.5400.001
Average value2.920.8642.800.8313.010.854
Source: Author’s calculation.
Table 3. Perceptions of the role and significance of UGS-NS.
Role and Significance of UGS-NSMeanStd. Dev.MeanStd. Dev.MeanStd. Dev. χ2p-Value
TotalMaleFemale
Conflicts and disagreements exist regarding UGS-NS.2.821.1522.581.1083.001.15464.7140.000
UGS-NS form the fundamental structure of the urban area.3.801.1693.581.1153.981.18164.7140.000
UGS-NS, as green corridors of Novi Sad, connect various zones and facilitate user access.3.991.1033.801.0754.141.10263.0850.000
The distribution of UGS-NS is not optimal.4.391.2094.301.2674.451.1593.9780.046
The integration of new knowledge and experience is essential in the planning of UGS-NS.4.011.2703.851.2954.131.23814.5400.001
Strategies are being developed to reduce the maintenance costs of UGS-NS.2.800.9802.530.8853.001.00161.2390.000
There are strategies to protect UGS-NS from other types of use.3.001.2702.550.9313.351.382167.8970.000
UGS-NS are well equipped and well maintained.3.411.0293.090.7673.661.130171.1480.000
UGS-NS provide facilities for recreation and relaxation.3.210.7573.070.7263.310.76243.8410.000
UGS-NS offer spaces for pets.3.001.0013.031.0012.961.0000.9310.335
The largest parks are considered the most important by users across the city of Novi Sad.3.801.1693.581.1153.981.18164.7140.000
Smaller parks near larger parks have a significant impact on the local community in Novi Sad.3.591.0223.761.0673.450.966169.7430.000
Average value3.491.0943.311.0293.621.105
Source: Author’s calculation.
Table 4. Perceived benefits and values of UGS-NS.
Benefits and Values of UGS-NSMeanStd. Dev.MeanStd. Dev.MeanStd. Dev. χ2p-Value
TotalMaleFemale
UGS-NS reduce stress, improve the microclimate, and reduce pollution.3.981.2704.261.2773.771.223169.6960.000
UGS-NS improve the urban climate and balance with natural environments.4.191.1724.281.2644.111.093169.6960.000
UGS-NS reduce air temperature in summer.4.191.1724.281.2644.111.093169.6960.000
UGS-NS reduce wind strength and speed.4.191.1724.281.2644.111.093169.6960.000
UGS-NS reduce urban noise.3.981.2704.261.2773.771.223169.6960.000
UGS-NS is a public good that benefits multiple people simultaneously, without limitations.4.191.1724.281.2644.111.093169.6960.000
UGS-NS have economic value even though they are not on the market for private profit.4.191.1724.281.2644.111.093169.6960.000
Average value4.131.2004.271.2684.011.130
Source: Author’s calculation.
Table 5. Perceptions of the economic, ecological, psychological, and cultural functions of UGS-NS.
Economic–Ecological and Psychological–Cultural Functions of UGS-NSMeanStd. Dev.MeanStd. Dev.MeanStd. Dev. χ2p-Value
TotalMaleFemale
UGS-NS contribute to the creation of new job opportunities in the city of Novi Sad.3.411.1923.331.2763.471.12243.8210.000
UGS-NS enhance investment in the urban environment, thus improving the city’s tourism offerings.3.980.8904.220.8233.800.89782.1680.000
UGS-NS increase property values in their surrounding areas.3.800.7423.790.8113.820.68643.8210.000
UGS-NS are a public good that serves multiple people simultaneously, without limitations.3.800.7423.790.8113.820.68643.8210.000
UGS-NS preserve natural heritage, provide habitats for diverse plant and animal species, and safeguard urban resources.3.600.7963.770.8183.470.75547.8610.000
People enjoy observing nature in UGS-NS.4.390.8034.260.8114.480.78535.4350.000
Natural elements in UGS-NS soften the harshness of the city’s architecture and provide relief from the cold.3.981.2704.470.9183.611.370169.6960.000
UGS-NS give Novi Sad a unique identity, making the city more attractive to live in.4.390.8044.520.8454.290.757169.6960.000
UGS-NS provide spaces for rest and recreation, encouraging physical activity for all age groups.4.390.8044.520.8454.290.757169.6960.000
Trees and urban greenery in UGS-NS reduce stress and fatigue, improving productivity and concentration.4.190.9834.490.8713.951.00080.7160.000
Natural elements (trees, water, animals) in UGS-NS help reduce anxiety and aggression.4.390.8044.520.8454.290.757169.6960.000
Access to quality UGS-NS enhances public health and reduces healthcare costs.3.600.8093.780.8533.470.74840.0160.000
Average values3.990.8874.120.8773.900.860
Source: Author’s calculation.
Table 6. Regression statistics.
ModelRR SquareAdjusted R SquareStd. Error of the Estimate
10.755 a0.5710.5700.46848
20.784 b0.6140.6140.44427
30.8340.6950.6940.39537
a Predictors: (Constant) economic–ecological functions of UGS-NS. b Predictors: (Constant) economic–ecological functions of UGS-NS, psychological–cultural functions of UGS-NS. c Predictors: (Constant) economic–ecological functions of UGS-NS, psychological–cultural functions of UGS-NS, socio–community functions of UGS-NS. Source: Author’s calculation.
Table 7. ANOVA a.
Table 7. ANOVA a.
ModelSum of SquaresdfMean SquareFSig.
1Regression314.4661314.4661432.7990.000 b
2Residual236.59610780.219
3Total551.0621079
1Regression338.4922169.246857.4950.000 c
2Residual212.57010770.197
3Total551.0621079
1Regression382.8623127.621816.4130.000 d
2Residual168.19910760.156
3Total551.0621079
a Dependent variable: overall satisfaction with UGS-NS. b Predictors: (Constant) economic–ecological functions of UGS-NS. c Predictors: (Constant) economic–ecological functions of UGS-NS, psychological–cultural functions of UGS-NS. d Predictors: (Constant) economic–ecological functions of UGS-NS, psychological–cultural functions of UGS-NS, socio–community functions of UGS-NS. Source: Author’s calculation.
Table 8. Coefficients a.
ModelUnstandardised CoefficientsStandardised CoefficientstSig
BStd. ErrorBeta
1(Constant)0.2460.072 3.4220.001
Economic–ecological functions of UGS-NS0.7180.0190.75537.8520.000
2(Constant)0.7080.080 8.8430.000
Economic–ecological functions of UGS-NS0.8630.0220.90738.7600.000
Psychological–cultural functions of UGS-NS−0.2390.022−0.258−11.0330.000
3(Constant)0.9010.072 12.4750.000
Economic–ecological functions of UGS-NS0.7820.0200.82238.3520.000
Psychological–cultural functions of UGS-NS 0.023−0.483−19.5300.000
Socio–community functions of UGS-NS0.2510.0150.40116.8480.000
a Dependent variable: overall satisfaction with UGS-NS. Source: Author’s calculation.
Disclaimer/Publisher’s Note: The statements, opinions and data contained in all publications are solely those of the individual author(s) and contributor(s) and not of MDPI and/or the editor(s). MDPI and/or the editor(s) disclaim responsibility for any injury to people or property resulting from any ideas, methods, instructions or products referred to in the content.

