Article

Response Pattern of Rainfall to the Efficiency and Threshold of Soil Water Recharge in Different Slopes

1
Key Laboratory of Intelligent Health Perception and Ecological Restoration of Rivers and Lakes, Ministry of Education, Hubei University of Technology, Wuhan 430068, China
2
Hubei Key Laboratory of Environmental Geotechnology and Ecological Remediation for Lake & River, Hubei University of Technology, Wuhan 430068, China
3
State Key Laboratory of Precision Blasting, Jianghan University, Wuhan 430056, China
*
Author to whom correspondence should be addressed.
Sustainability 2025, 17(9), 4018; https://doi.org/10.3390/su17094018
Submission received: 9 March 2025 / Revised: 13 April 2025 / Accepted: 25 April 2025 / Published: 29 April 2025

Abstract

:
Rational and effective utilization of rainfall is crucial to vegetation restoration and ecological reconstruction for engineering slopes. However, plant and vegetated concrete considerably affect soil water distribution and rainfall replenishment, which is rarely accounted for in current studies. To this end, the effects of plant and vegetated concrete on spatiotemporal distribution and soil water recharge were explored. First, four field model slopes were constructed to monitor soil water content. The spatiotemporal variations and distribution characteristics of soil water under different restoration modes were analyzed. The indicators including amount, efficiency, and threshold of soil water recharge in ecological slopes were assessed. At last, the effects of plant and vegetated concrete on the spatiotemporal distribution and recharge characteristics of soil water were discussed. Results showed that ecological restoration alters spatiotemporal distribution characteristics and reduces soil water content of engineering slopes. During rainfall process, ecological restoration extends the lag time but increases amount and efficiency of rainfall replenishment. Comparably, ecological shrub slope gains the highest lag time and rainfall threshold. Cynodon dactylon is superior to Magnolia multiflora in raising rainfall replenishment capacity. Additionally, vegetated concrete enhances rainfall replenishment efficiency by altering soil properties and interacting with plants. This study deepened the understanding of hydrological effects of ecological restoration on slopes and provided a theoretical basis for ensuring sustainable slope management.

1. Introduction

Global climate change and human activities have gradually aggravated the problem of ecosystem security. In China, numerous exposed engineering slopes had formed during infrastructure construction, triggering geological disasters such as landslides, mudslides, and flash floods [1]. Fortunately, ecological restoration provides an easy way to prevent disaster and protect the environment [2,3]. Soil erosion will be reduced by more than 60% after ecological restoration of the project slope [4]. In the process of ecological restoration, soil water plays a critical role in the soil–plant–atmosphere continuum (SPAC) [3]. The ecological restoration of a slope can not only reduce soil erosion, but also improve soil quality. Planting concrete is an important ecological restoration measure for slopes. Soil water balance is crucial to maintaining the healthy development of a SPAC system, affected by vegetation covers [5], rainfall characteristics [6], and soil physicochemical properties [7]. The addition of cement in planting concrete can significantly affect soil structure, nutrients, and physicochemical properties. This changes the vegetation cover of the slope and in turn affects the soil water balance. Among them, plant activities can dissipate soil water and alter its spatiotemporal distribution [8]. Rainfall is the main source of soil water recharge (SWR) and determines the effectiveness and sustainability of plant restoration, which in turn intervenes in the rainfall infiltration process [9,10]. Therefore, exploring the relationships among soil water, plants, and rainfall is the scientific basis for revealing the maintenance mechanism of vegetation ecosystems in ecological slopes.
Soil water distribution is crucial to the hydrological processes and long-term stability of ecological slopes [3]. Many publications have studied the relationship between ecological restoration and soil water, mainly focusing on the soil water variation caused by plants and rainfall infiltration [11]. Zhu et al. [12] observed that the response of soil water to precipitation is greatly affected by plant types and precipitation properties. Yu et al. [13] indicated that soil water differs in spatial domains due to root water uptake and land use types. Tao et al. [7] claimed that rain is an important factor influencing the instability of ecological slopes. Obviously, plants significantly alter the spatiotemporal distribution of soil water and the rainfall infiltration process [14]. This influence is particularly critical in the application of plant concrete. It is because its properties further regulate the interaction between vegetation and water. It should be pointed out that vegetated concrete is commonly first sprayed on the slope’s surface, which generally consists of planting soil, cement, organic matter, and regulators [15,16]. It can enhance erosion resistance, improve the physicochemical properties of surface soil, and create a favorable plant growth environment. Mertens et al. [17] presented that the addition of vegetated concrete can alter soil hydraulic properties. Biochar combined with clay vegetated concrete significantly leads to a lower soil water content [18]. Wu et al. [19] proposed that vegetated concrete can improve the uniformity of soil water distribution. Obviously, the addition of vegetated concrete influences the performance of plant restoration. The processes of water dissipation and replenishment would also be altered simultaneously, thereby affecting soil water distribution across the ecological slope. However, at present, there are few studies on the SPAC effect of planting concrete, and there is a lack of further quantitative analysis.
On the other hand, rational and effective utilization of rainfall is the key to ecological restoration. The processes of rainfall infiltration and redistribution determine the rainfall replenishment effect and utilization efficiency [20,21]. Commonly, the rainfall replenishment efficiency and threshold are utilized to reflect the characteristics of SWR. Shang et al. [22] established an equation to analyze how vegetation roots affect the rainfall threshold of a slope. Sarris et al. [23] reckoned that rainfall, land use type, and vegetation cover can potentially shift rainfall replenishment thresholds. Maris et al. [24] explored the relationships among the rainfall thresholds, rainfall intensity, vegetation, and runoffs. However, these studies mainly focus on SWR in the Loess Plateau and mining areas. There have been no reports about the synergistic effect of plants and vegetated concretes on SWR in an ecologically restored slope. It can be foreseen that the distribution characteristics and mechanism of SWR would vary due to multiple factors such as precipitation, soil, and vegetation covers. The underlying interaction between soil water and rainfall becomes more complex, especially under the synergistic effect of a plant and vegetated concrete. To better guide ecological restoration efforts, there is a pressing need to study the influence of plants and vegetated concretes on SWR in order to improve rainfall utilization efficiency and vegetation sustainability.
To compensate for the aforementioned drawbacks, this study was intended to explore the spatiotemporal distribution of soil water and rainfall recharge capacity in ecological slopes. To achieve this goal, four model slopes were constructed to monitor soil water content (SWC). Then, the spatiotemporal variations and distribution characteristics of SWC under different restoration modes were analyzed. The amount, efficiency, and threshold of SWR in ecological slopes were successively computed and compared. At last, the effects of plants and vegetated concrete on the spatiotemporal distribution of soil water and SWR were discussed. It could provide a theoretical basis and strategic direction for ecological restoration of engineering slopes.

2. Materials and Methods

2.1. Outline of the Experiment Site

The research area is located in the Key Laboratory of Health Intelligent Perception and Ecological Restoration of River and Lake of The Ministry of Education, Wuhan, China (E 114°18′, N 30°29′), which has a northern subtropical monsoon climate, with an altitude of 375 m, and the average annual temperature varies between 15.8 °C and 17.5 °C. The rainy season typically occurs from June through July. The average annual rainfall is 1284.5 mm, and the annual number of sunshine hours totaling 1625. The mean minimum temperature ranges from 1 °C to 3 °C in January, while the mean maximum temperature ranges from 33 °C to 38 °C in July.

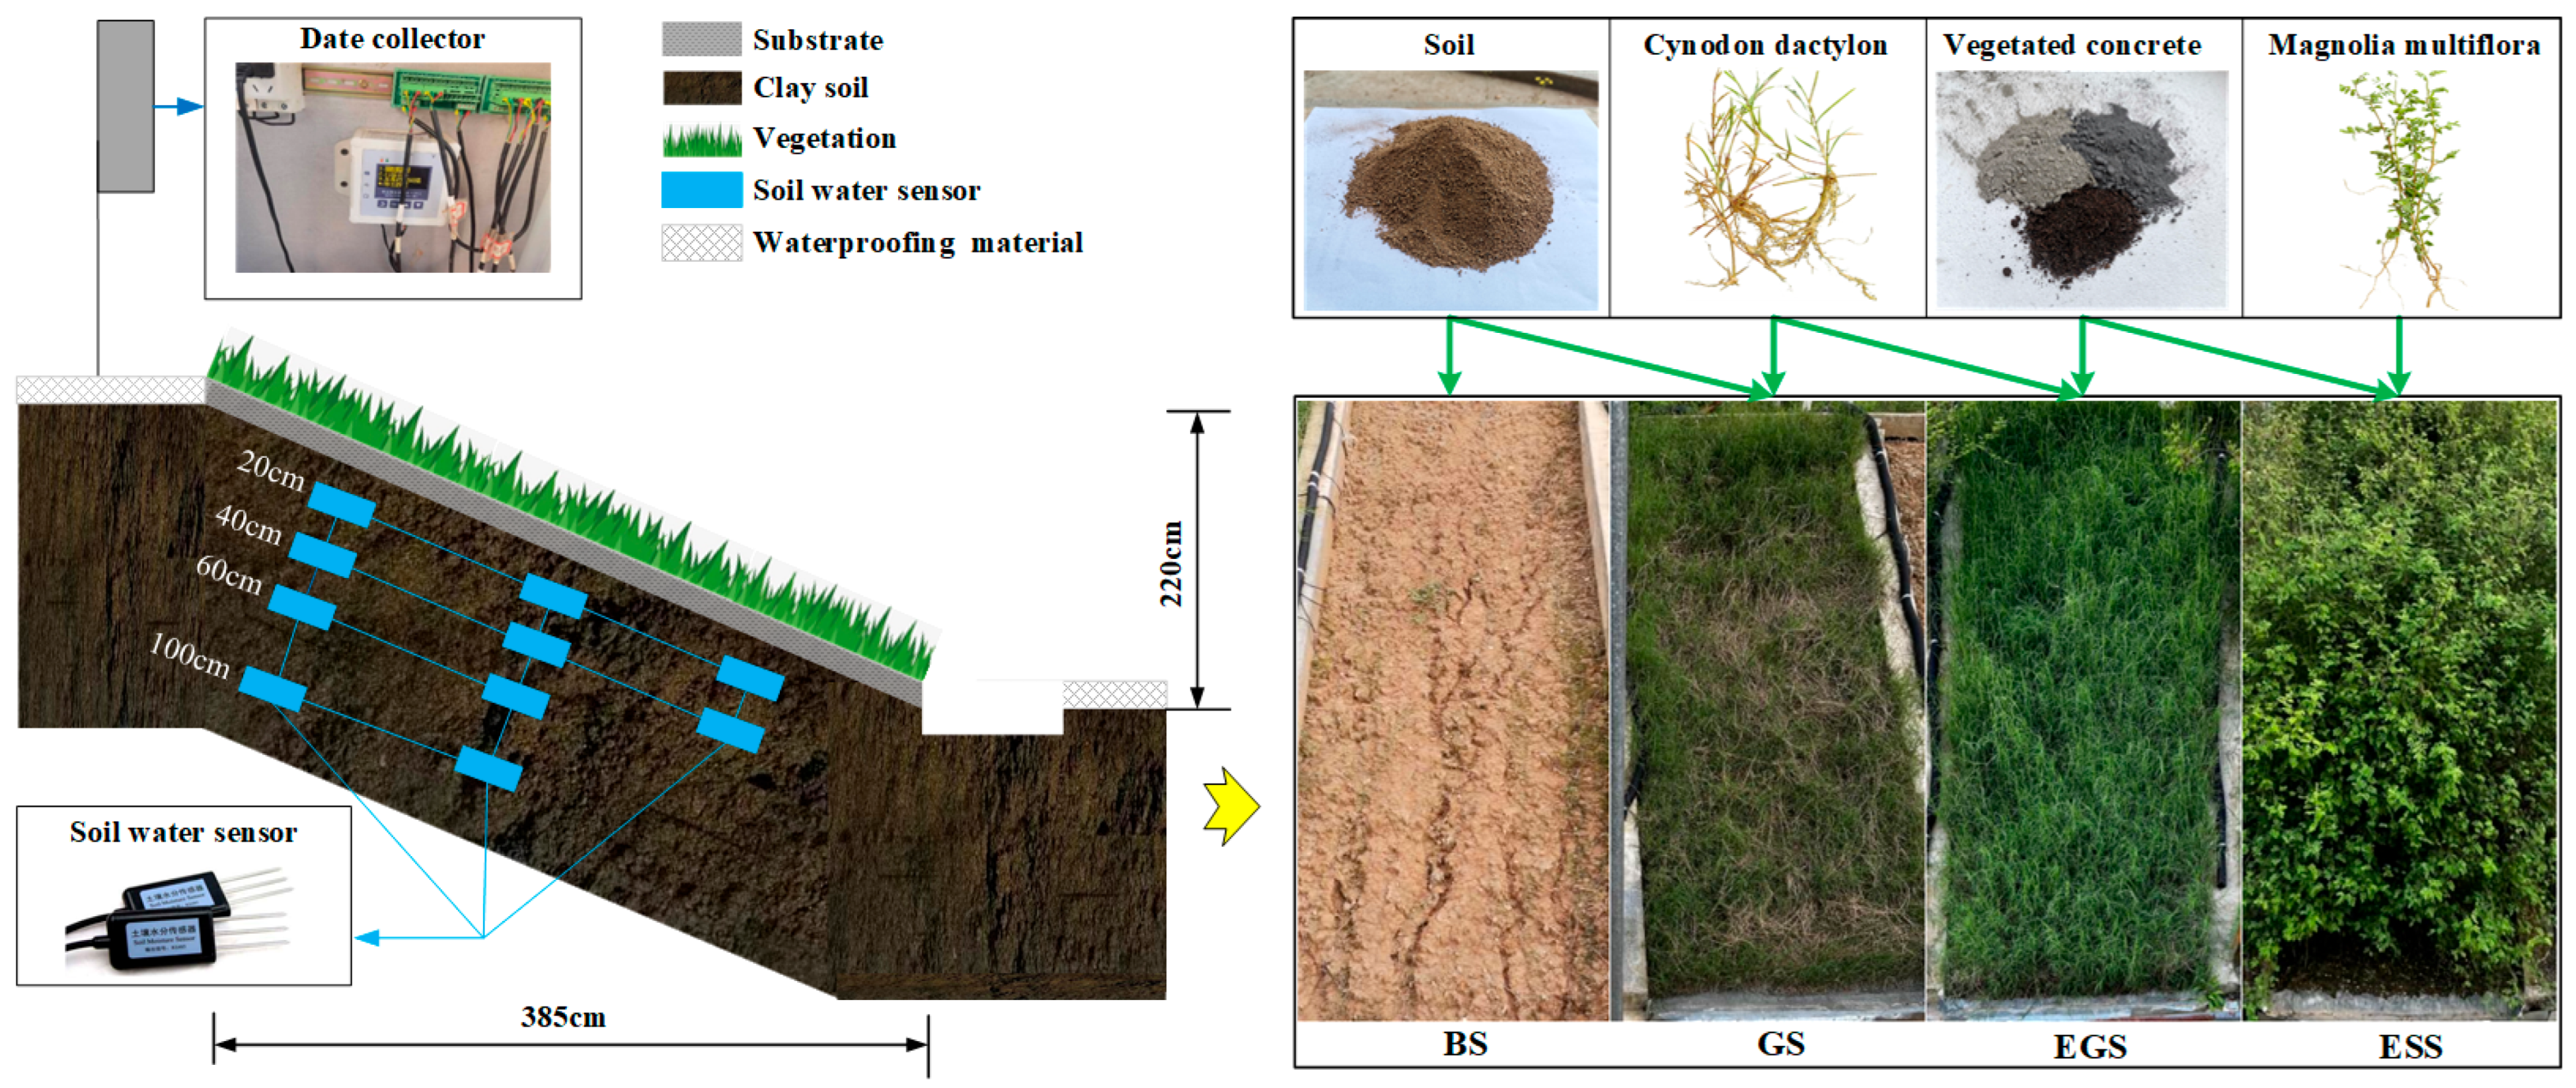
2.2. Experiment Design
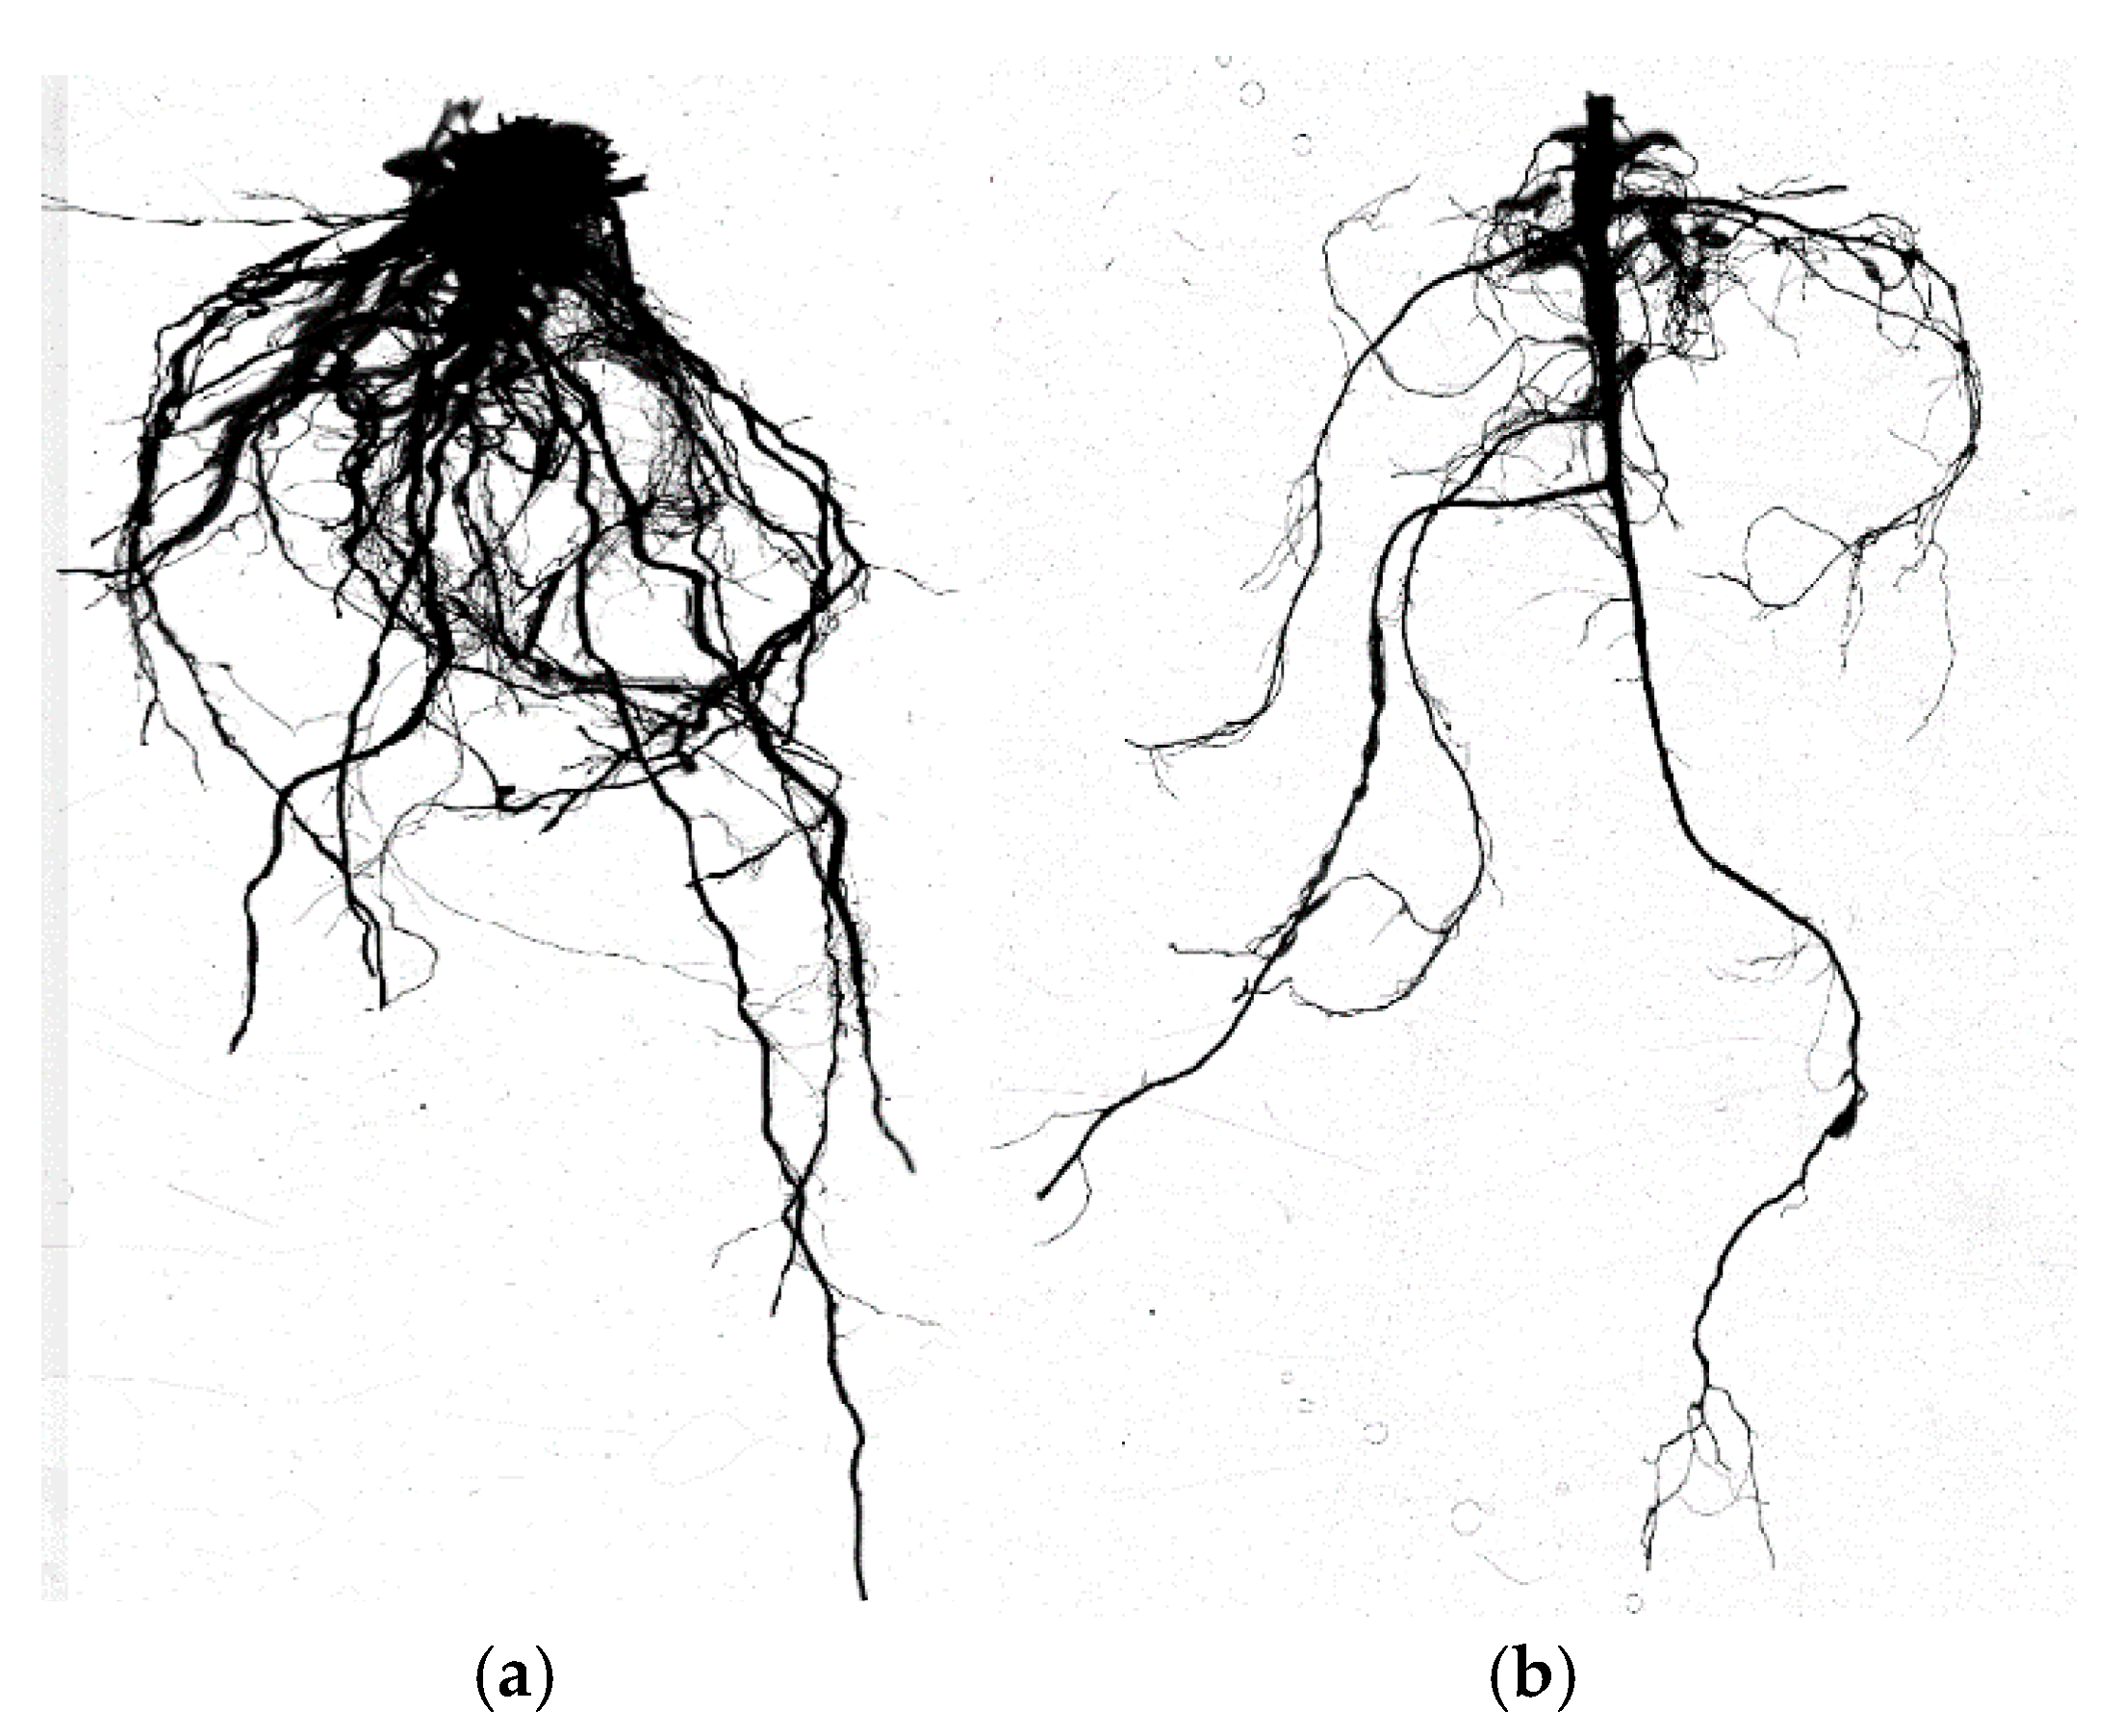
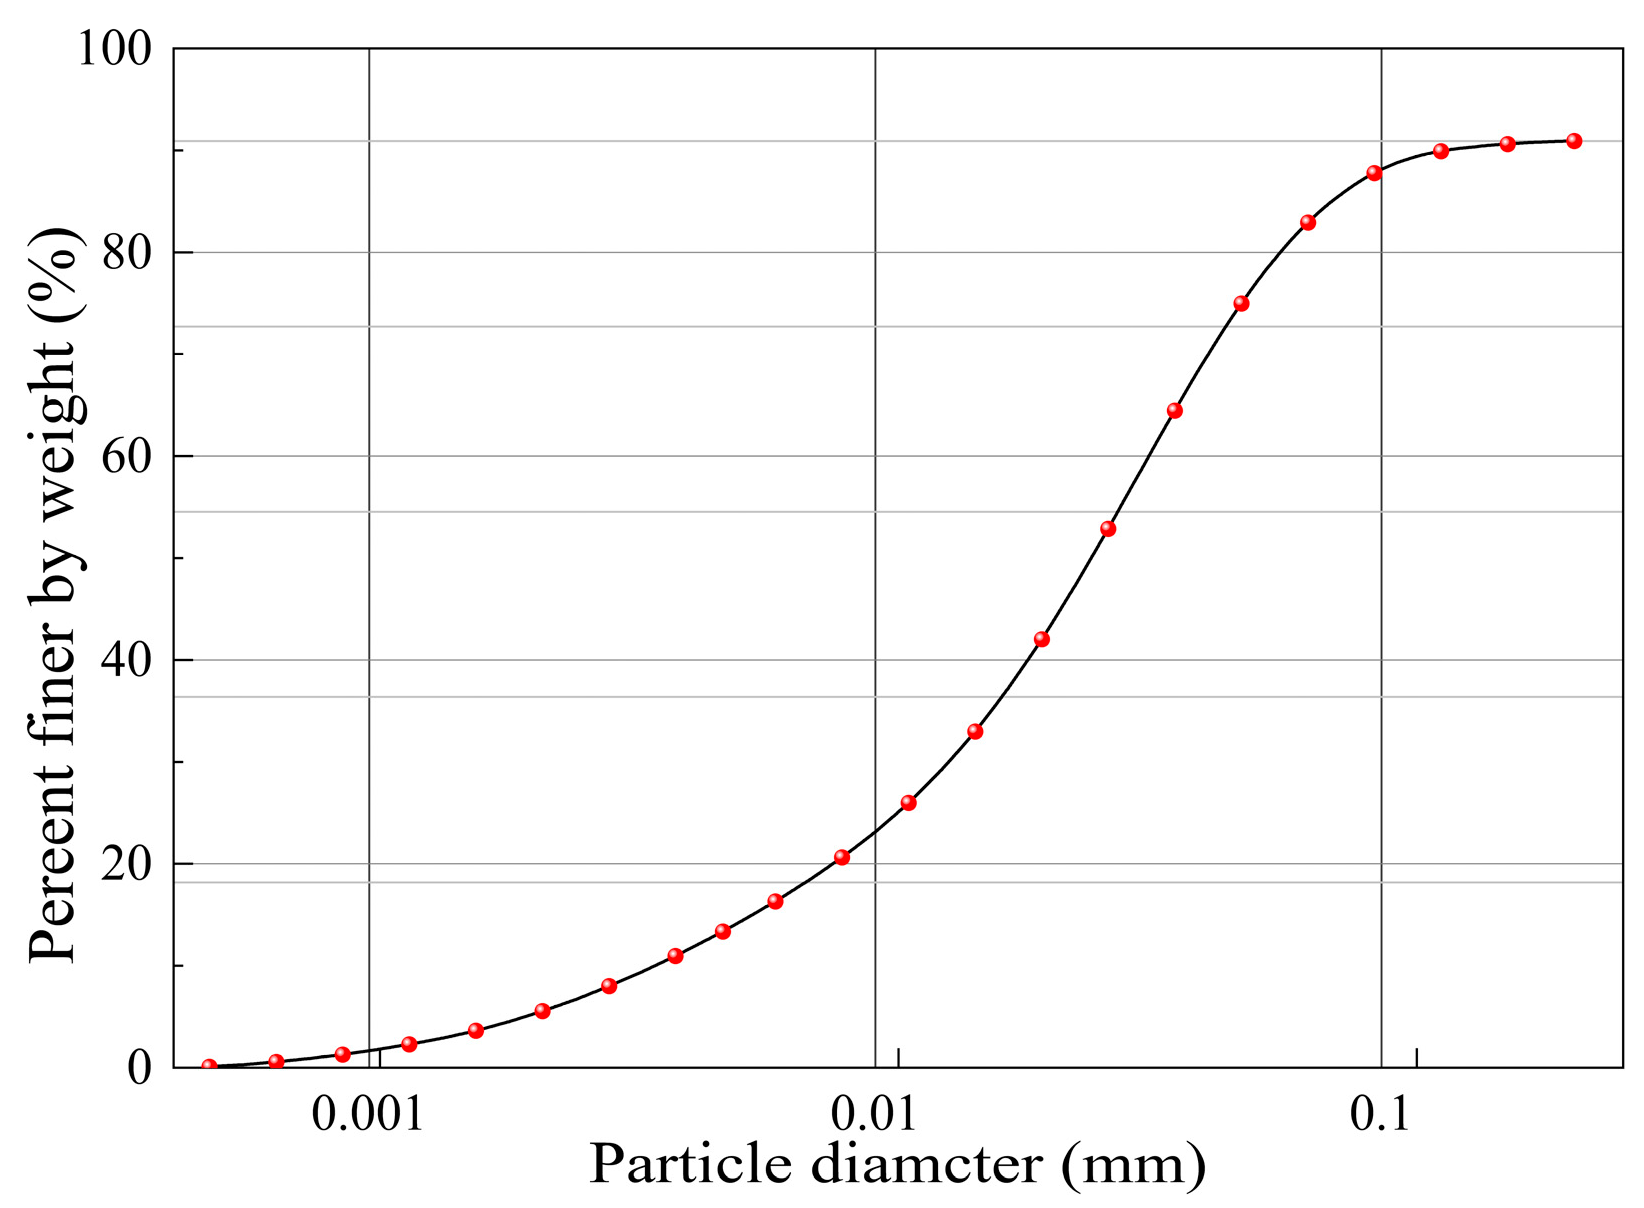
2.2.1. Materials

(1) Plant
Two plants commonly used for ecological restoration in Hubei Province were selected for this experimental study. The plants were Cynodon dactylon and Magnolia multiflora, which represent a grass and shrub, respectively. Among them, the seeding density of the grass and shrub was the same, as to control variables to facilitate the comparison of the ecological benefits of slopes. Cynodon dactylon has a dense root system, which can effectively cover the soil surface. Magnolia multiflora has a strong root system, which makes the soil more stable. The root scans of the two plants are shown in Figure 1. The plants were planted on slope surfaces after the model slopes in Section 2.2.2 were filled with clay soil.
(2) Soil
The experimental soil was a typical clay soil taken from a cut slope in Wuhan, Hubei Province. The soil particles are well graded, and the structure is dense, as shown in Figure 2. The soil particle distribution was measured by a laser particle size analyzer (LT3600 Plus, Truth Optics Manufacturing, Shenzhen, China.), revealing a distribution of 19.66% sand, 74.25 silt, and 6.09 clay. The basic physical properties are shown in Table 1.
(3) Vegetated concrete
The vegetated concrete consisted of 3% cement, 1.2% PH regulators (the main composition is a mixture of iron ore powder and calcium powder), 7% fertilizers, and 88.8% clay soil. To minimize the effects of other factors on this study, seeding rate, maintenance conditions, and soil compaction were kept consistent. Cement serves as an effective soil conditioner to reduce soil erosion. PH regulators could offer nutrients for plant growth. Fertilizers were composed of plant ash and chicken manure. Vegetated concretes are shown in Figure 3. The arrows that appear in Figure 3 all point to the corresponding physical photos.

2.2.2. Model Slope

To explore the effects of plant and vegetated concrete on soil water distribution and recharge characteristics, four model slopes were designed for study, namely, bare slope (BS), grass slope (GS), ecological grass slope (EGS), and ecological shrub slope (ESS). The basic characteristics were shown in Table 2. When the slope filling was completed, the slope was seeded. The seeds of vegetation were selected from the root of Cynodon dactylon and Magnolia multiflora. The slopes were all within the same size of 385 cm in length, 150 cm in width, and 220 cm in height. The top was covered with waterproofing material to prevent rainwater infiltration. The bottom was built with a drainage ditch to drain runoffs. The model slopes were separated by waterproofing materials. Before the experiment, the vegetation coverage had reached 100%. The average plant heights of GS, EGS, and ESS were approximately 17 cm, 25 cm, and 150 cm, respectively.

2.2.3. Rainfall and SWC Monitoring

Rainfall and SWC were synchronously monitored during experiments. Rainfall data were recorded every 1 h by an automatic meteorological station (NHQXZ604) installed nearby. SWC was detected with soil water sensors (SWR-100, CRUX, Los Angeles, CA, USA), installed in the depths of 20, 40, 60, and 100 cm (Figure 3). The data were collected every 30 min by using a data collector (LS-DL1). SWC and precipitation at the experimental site were continuously measured from October 2021 to May 2022.

2.3. Data Analysis

In the study, the coefficient of variation, soil water storage, recharge amount, lag time, rainfall replenishment rate, and rainfall replenishment efficiency were used to investigate the effects of plant and vegetated concrete on the response characteristics of soil water to individual rainfall events.

2.3.1. Coefficient of Variation

Coefficient of variation (CV) is commonly used to assess spatiotemporal heterogeneity of SWC, as divided in Table 3. It can be calculated by equation [3].
CV = SD θ i ¯
where θ i ¯ is the average SWC, mL∙mL−1, and SD represents the corresponding standard deviation, mm.

2.3.2. Soil Water Storage

Soil water storage refers to SWC in a certain depth [20]. It is calculated using the following equation [25].
S W S = i = 1 4 θ i d i
where SWS represents the soil water storage capacity of the 0~100 cm layer, mm; θ i is the SWC in different soil depths, mL∙mL−1; and d i is the i-th soil depth, mm.

2.3.3. Soil Water Recharge Amount

In this study, rainfall infiltration depth does not exceed 100 cm during the experimental period. Therefore, the focus of this study is to compare SWS at depths of 0~100 mm before and after rainfall. It can be computed by equation [26].
Δ S W = S W S max S W S 0
where ΔSW represents the amount of SWR, mm; SWSmax is the maximum value of SWS after a rainfall, mL∙mL−1; and SWS0 is the initial value of SWS before a rainfall, mm.

2.3.4. Lag Time

Rainfall that reaches the surface soil varies on different slopes [27]. The roots of grasses and shrubs are mainly distributed between 20 and about 60 cm [20]. Therefore, the depth of 20 cm is used as the beginning of the effective recharge of soil water. Lag time is calculated by equation [28].
t l = t 1 t 0
where tl represents the lag time of rainfall replenishment at the 20 cm soil layer, h; t1 is the time of soil water content starts to increase at the depth of 20 cm, h; and t0 is the time of rainfall start, h.

2.3.5. Rainfall Replenishment Rate

Rainfall replenishment rate is the ratio of the maximum SWR to the highest SWS. It can be calculated by equation [29].
r = Δ S W / t max t 1
where r represents the rainfall replenishment rate, mm∙h−1, and tmax is the maximum value of SWS, h.

2.3.6. Rainfall Replenishment Efficiency

Rainfall replenishment efficiency is defined as the ratio of SWR to rainfall amount. It is obtained from equation [30].
e = Δ S W / P × 100 %
where e represents rainfall replenishment efficiency, %, and P is the rainfall amount, mm.
In this study, Excel 2021 was used for data processing and statistical analysis. Origin 2021 and Visio 2021 software were used for plotting.

3. Results and Analysis

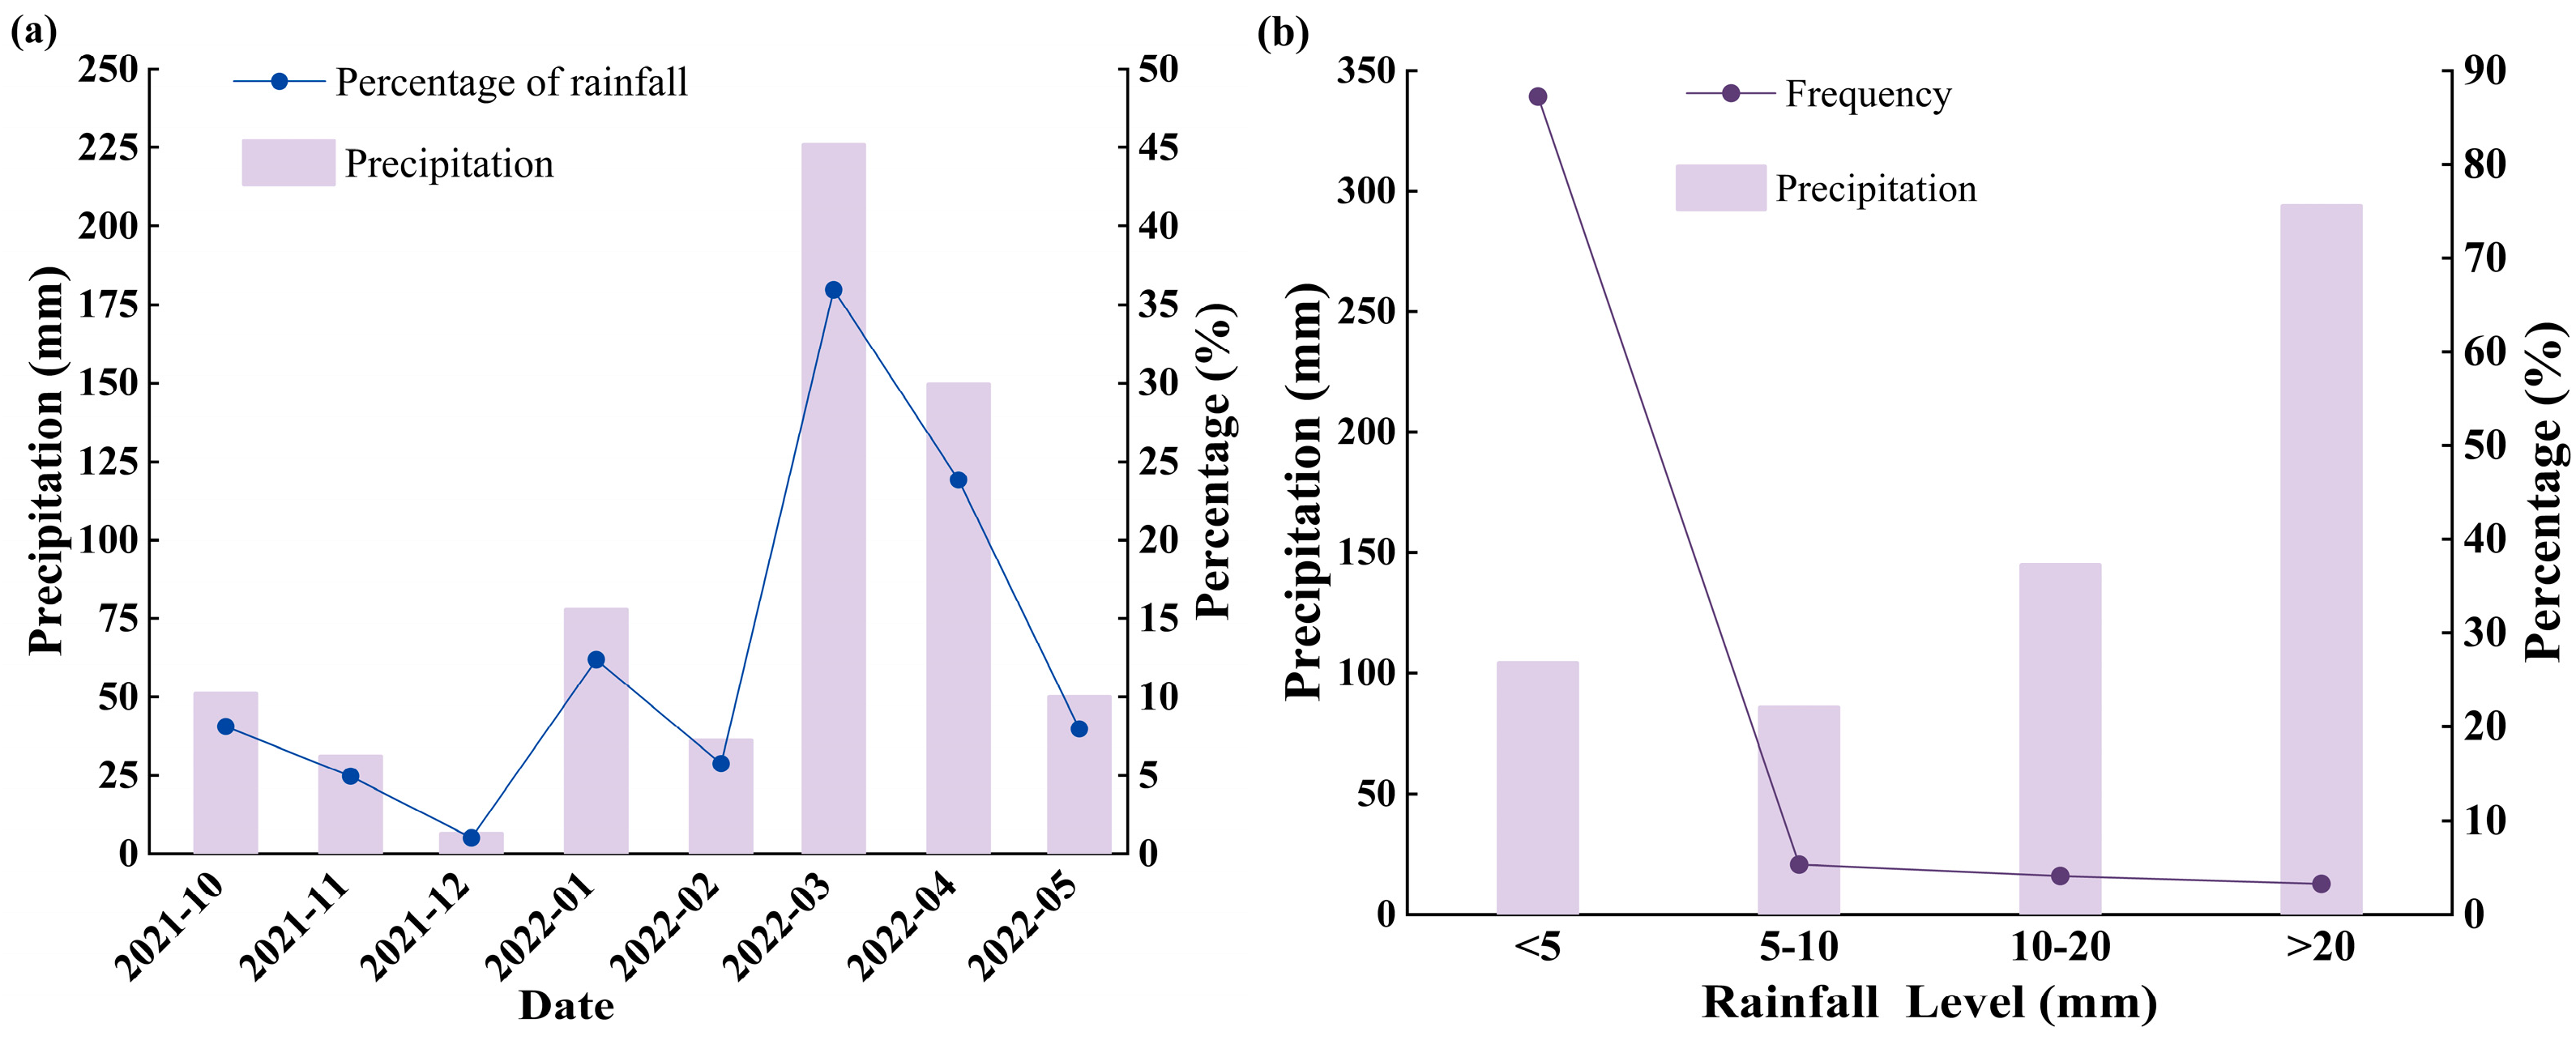
3.1. Characteristics of Precipitation During Experiment

Figure 4 gives the statistical characteristics of precipitation during the experimental periods. The average precipitations from October 2021 to May 2022 were 51.11 mm, 31.11 mm, 6.5 mm, 77.85 mm, 36.17 mm, 225.83 mm, 149.73 mm, and 50.05 mm, accounting for 8.13%, 4.95%, 1.03%, 12.39%, 5.76%, 35.94%, 23.83%, and 7.97%, respectively. Early March to early May is spring, early May to mid-October is summer, mid-October to early December is autumn, and mid-December to late February is winter in the Wuhan area. Combining precipitation data shows that rainfall events occur mostly in March and April (spring) and rarely in December (winter). In China, the precipitation is generally divided into four levels: <5 mm, 5–10 mm, 10–20 mm, and >20 mm [20]. As can be seen from Figure 4b, the total precipitations associated with four levels were 104.08 mm, 85.68 mm, 144.72 mm, and 293.87 mm, accounting for 87.24%, 5.35%, 4.12%, and 3.29%, respectively. Obviously, light rain was the most frequent during the experimental period, but the total precipitation was only 104.08 mm. Heavy rain and rainstorm only accounted for 7.41%, but the total precipitation reached 438.59 mm.

3.2. Spatiotemporal Distribution of Soil Water in Ecological Slopes

3.2.1. Temporal Variation of Soil Water Content

Figure 5 shows the variations of SWC during the experimental period. It should be pointed out that the SWC from 19 November 2021 to 23 November 2021 was missed due to power failure. Besides, sharp increases in SWC occurred on 1 December 2022 because artificial rainfall experiments were conducted.
Four slopes held comparable temporal variations of SWC. BS had the highest mean SWC, followed by GS, ESS, and EGS. It was clear that the variations of SWC were severely affected by rainfall intensities. EGS had the lowest mean SWC, which may be due to the high transpiration of Cynodon dactylon vegetation and strong substrate permeability. In this study, light rainfall events mainly occurred from early October to late December. Higher rainfall events frequently happened from early January to late April (Figure 5). Coincidentally, SWC significantly responded to high rainfall events but negligibly reacted to light rainfall events. Moreover, vegetation covers considerably reduced SWC. Such effects differed from each other due to varied plants. As demonstrated in Figure 5, EGS responded more significantly to rainfall than ESS. Vegetated concrete also affected the temporal variation of SWC, as reflected by EGS and GSS. Overall, the temporal variation of soil water in ecological slopes was simultaneously governed by rainfall intensity, vegetation cover, and vegetated concrete.

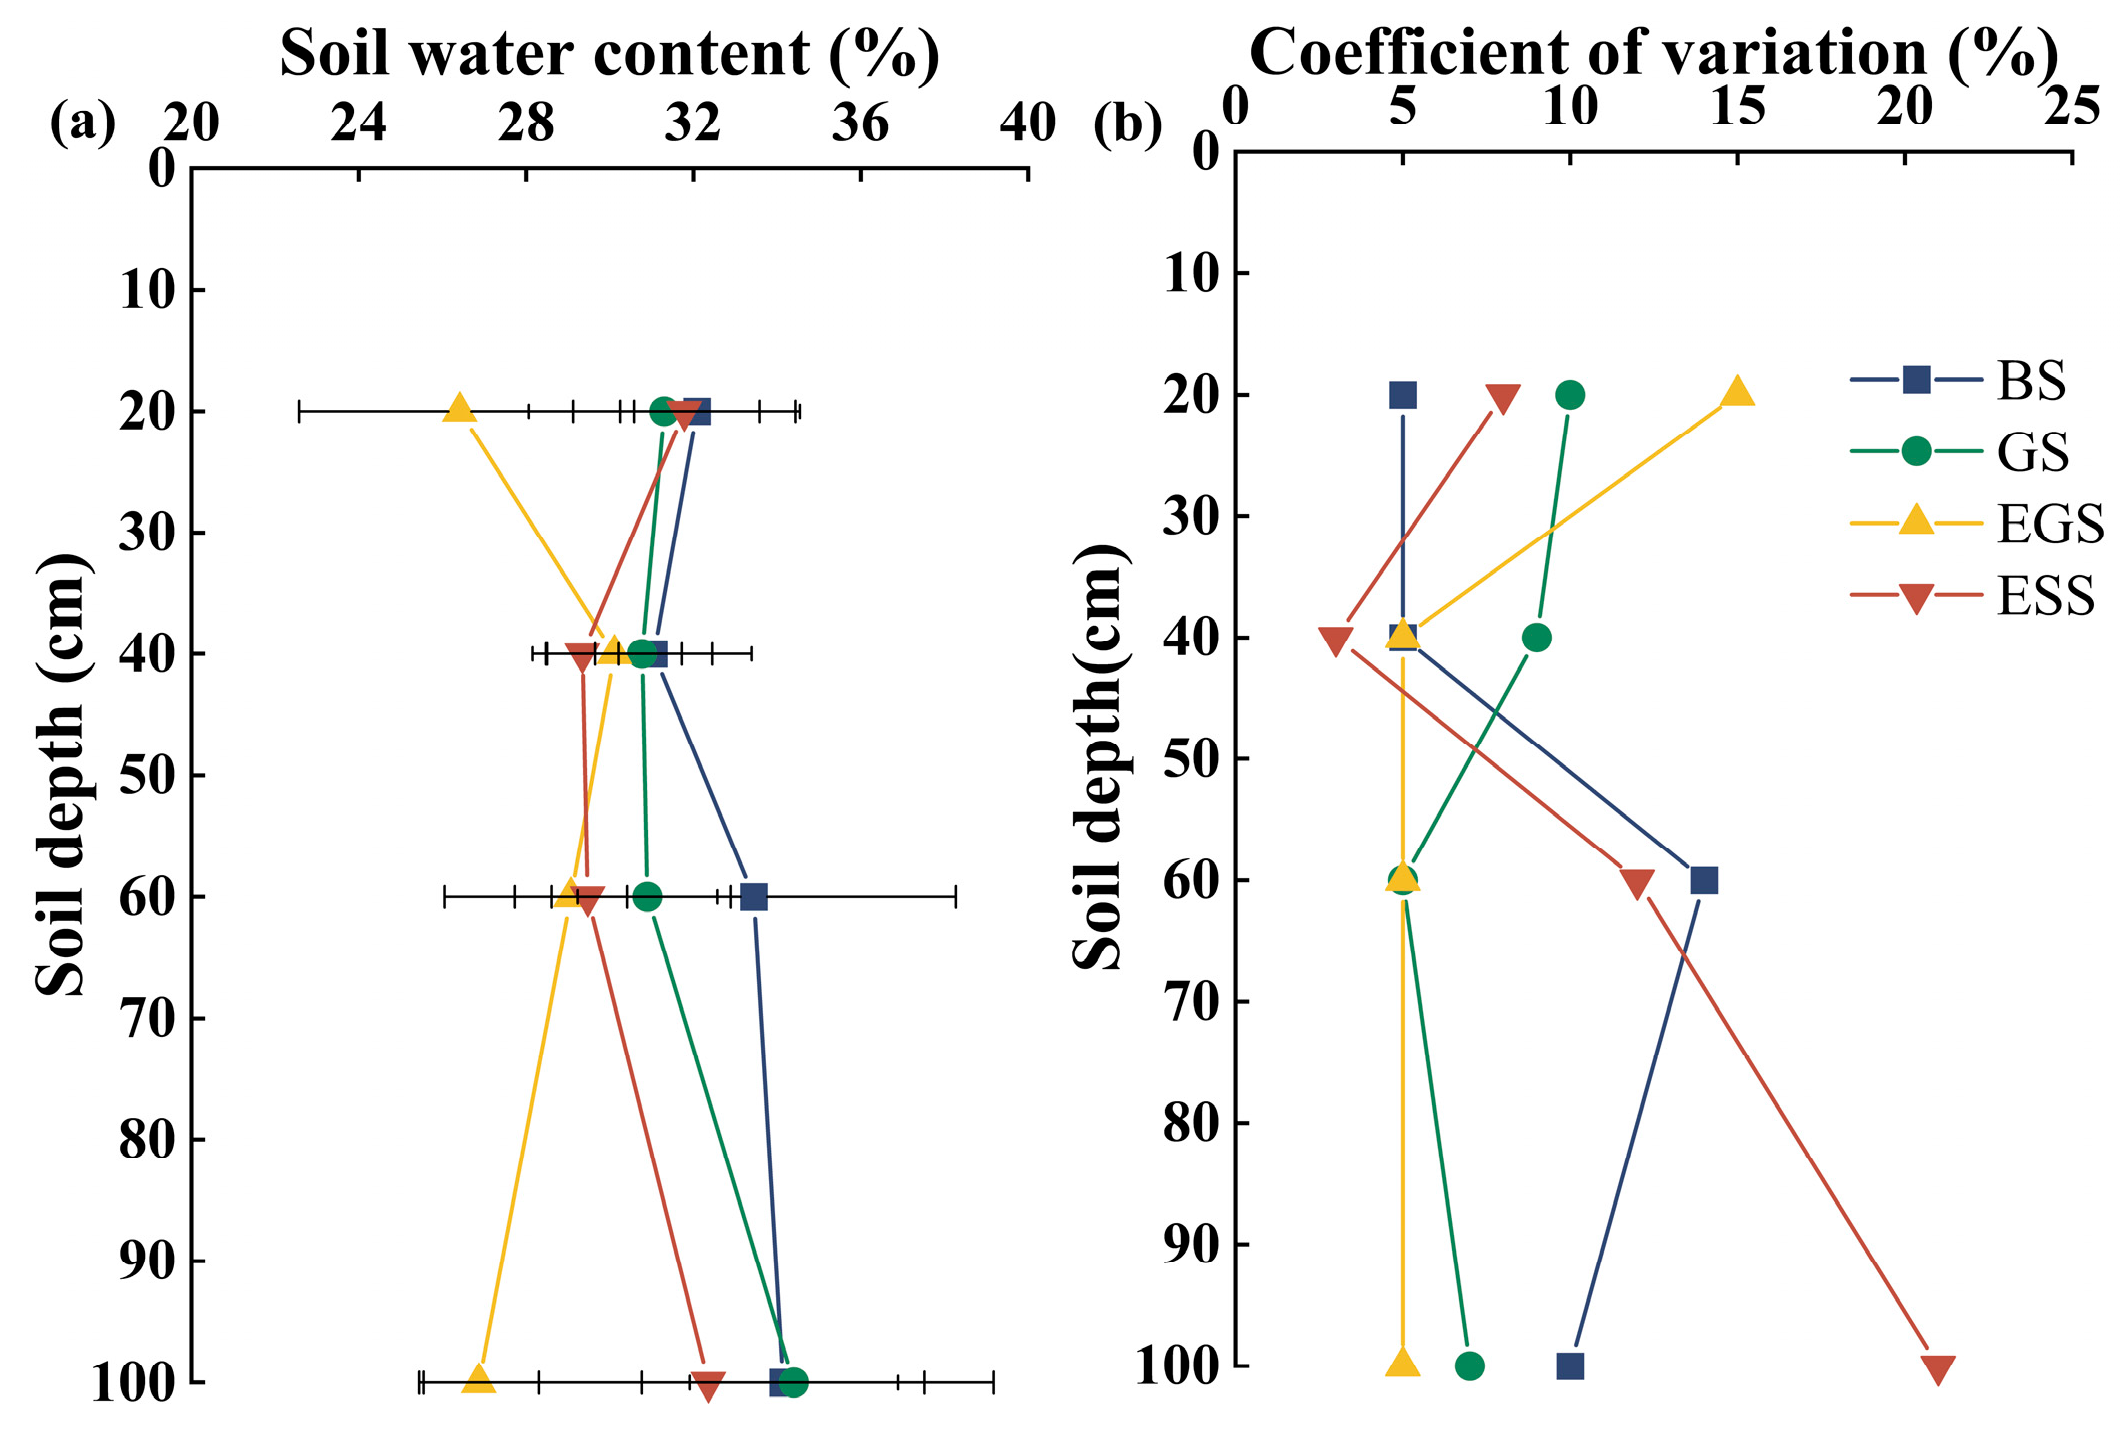
3.2.2. Spatial Distribution of Soil Water

Table 4 tabulated the statistics of SWC in four slopes. It was evident that the SWCs differed from each other. The CVs for BS and GS ranged from 0.05 to 0.14 and 0.05 to 0.10, respectively. Corresponding mean values were 8.50% and 7.75%. Evidently, plant covers reduced the spatial variability of soil water. As for GS and EGS, the mean CVs were 7.75% and 7.50%, and corresponding mean SDs were 2.51 and 2.06. Vegetated concrete also reduced the spatial variability of soil water in ecological slopes. But, such effects seemed to be slight compared with plants. As for ESS and EGS, the CVs ranged from 0.03 to 0.21 and 0.05 to 0.15, respectively. Corresponding mean values were 11.0% and 7.50%, reflecting moderate and weak variability, respectively. The spatial distributions of soil water under the combined action of plants and vegetated concretes were significantly different. At the same time, the coefficient of the variation of soil water in 60~100 cm of the four slopes was also different. It has to do with the groundwater level. This was because the groundwater affects the source, distribution, and variability of soil water. This directly affected the coefficient of variation of soil water. When the groundwater level was higher, the variability of soil water was smaller. When the groundwater level was low, the variability of soil water was greater. EGS maintained the most stable soil water state across slope profiles.
The average SWCs in different soil layers were displayed in Figure 6. The profile distribution of SWC could be divided into four levels, namely, rapid change level (CV > 30%, SD > 4%), active level (20% ≤ CV ≤ 30%, 3% ≤ SD ≤ 4%), sub-active level (10% ≤ CV ≤ 20%, 2% ≤ SD ≤ 3%), and stable level (CV < 10%, SD < 2%) [31]. However, it was practically difficult to satisfy both CV and SD requirements in an actual division process. In this study, CV was mainly adopted to classify the vertical variation of SWC. Clearly, the 0~40 cm soil layers of BS belonged to the stable level, while the 40~100 cm layers were the sub-active level. In GS and EGS, only the 0~20 cm layer belonged to the sub-active level, and all the deeper layers belonged to the stable level. As for ESS, the 0~40 cm layers belonged to the stable level (CV < 10%). But, the 40~60 cm and 60~100 cm layers changed into the sub-active level and active level with CVs of 12% and 21%, respectively.

3.3. Soil Water Recharge and Lag Time of Rainfall Events

3.3.1. Soil Water Recharge

To characterize the SWR of ecological slopes, a total of 10 typical rainfall events were selected, namely, 1 rainstorm event (16 March 2022), 2 heavy rainfall events (12 April 2022 and 24 April 2022), 2 moderate rainfall events (6 February 2022 and 30 March 2022), and 5 light rainfall events (16 November 2021, 24 December 2021, 3 March 2022, 6 March 2022, and 20 April 2022). These individual rainfall events were characterized by that no other rainfall occurs in the first 3 days and past 1 day [32].
Figure 7 compares the ΔSW values in four slopes. A positive correlation could be observed between ΔSW and rainfall intensity. Under light rainfall events, the average ΔSW showed BS (4.61 mm) < ESS (4.66 mm) < EGS (5.24 mm) < GS (15.77 mm). Under moderate rainfalls, the order varied as BS (20.58 mm) < ESS (21.04 mm) < GS (42.06 mm) < EGS (110.11 mm). Under heavy rainfalls, the average ΔSW showed BS (64.50 mm) < ESS (125.52 mm) < EGS (212.81 mm) < GS (216.68 mm). Under rainstorms, the order varied as BS (141.28 mm) < ESS (202.28 mm) < GS (325.87 mm) < EGS (355.43 mm). Obviously, the ΔSW values associated with four slopes were considerably different and climbed as rainfall intensity increased. Comparably, vegetational slopes were more conducive to SWR than bare slope. This showed that the replenishment ability of rainfall on a vegetated slope was stronger than that on a bare slope. Among them, the slope planted with Cynodon dactylon was superior in replenishing soil water than the slope planted with Magnolia multiflora.

3.3.2. Lag Time of Rainfall Events

Figure 8 demonstrates the lag time tl under different slopes after individual rainfall. The average tl of BS, GS, EGS, and ESS were 15.63 h, 18.62 h, 27.14 h, and 32.19 h, respectively. The wetting front reached 20 cm depth of BS 15.63 h later, explicating the rapidest recharge as rainfall occurred. The large tl of GS, EGS, and ESS compared to BS indicated that vegetation covers prevented the rainfall replenishment rate. The tl of ESS was higher than that of EGS, which revealed that Magnolia multiflora decelerated rainfall infiltration greater than Cynodon dactylon. Compared to EGS and GS, the addition of vegetated concrete prolonged the response time of soil water to rainfall. Notably, ESS had the longest tl. The wetting front took about 32.19 h to reach 20 cm depth, indicating the slowest rainfall replenishment rate.

3.4. Rainfall Replenishment Efficiency and the Threshold to Soil Water

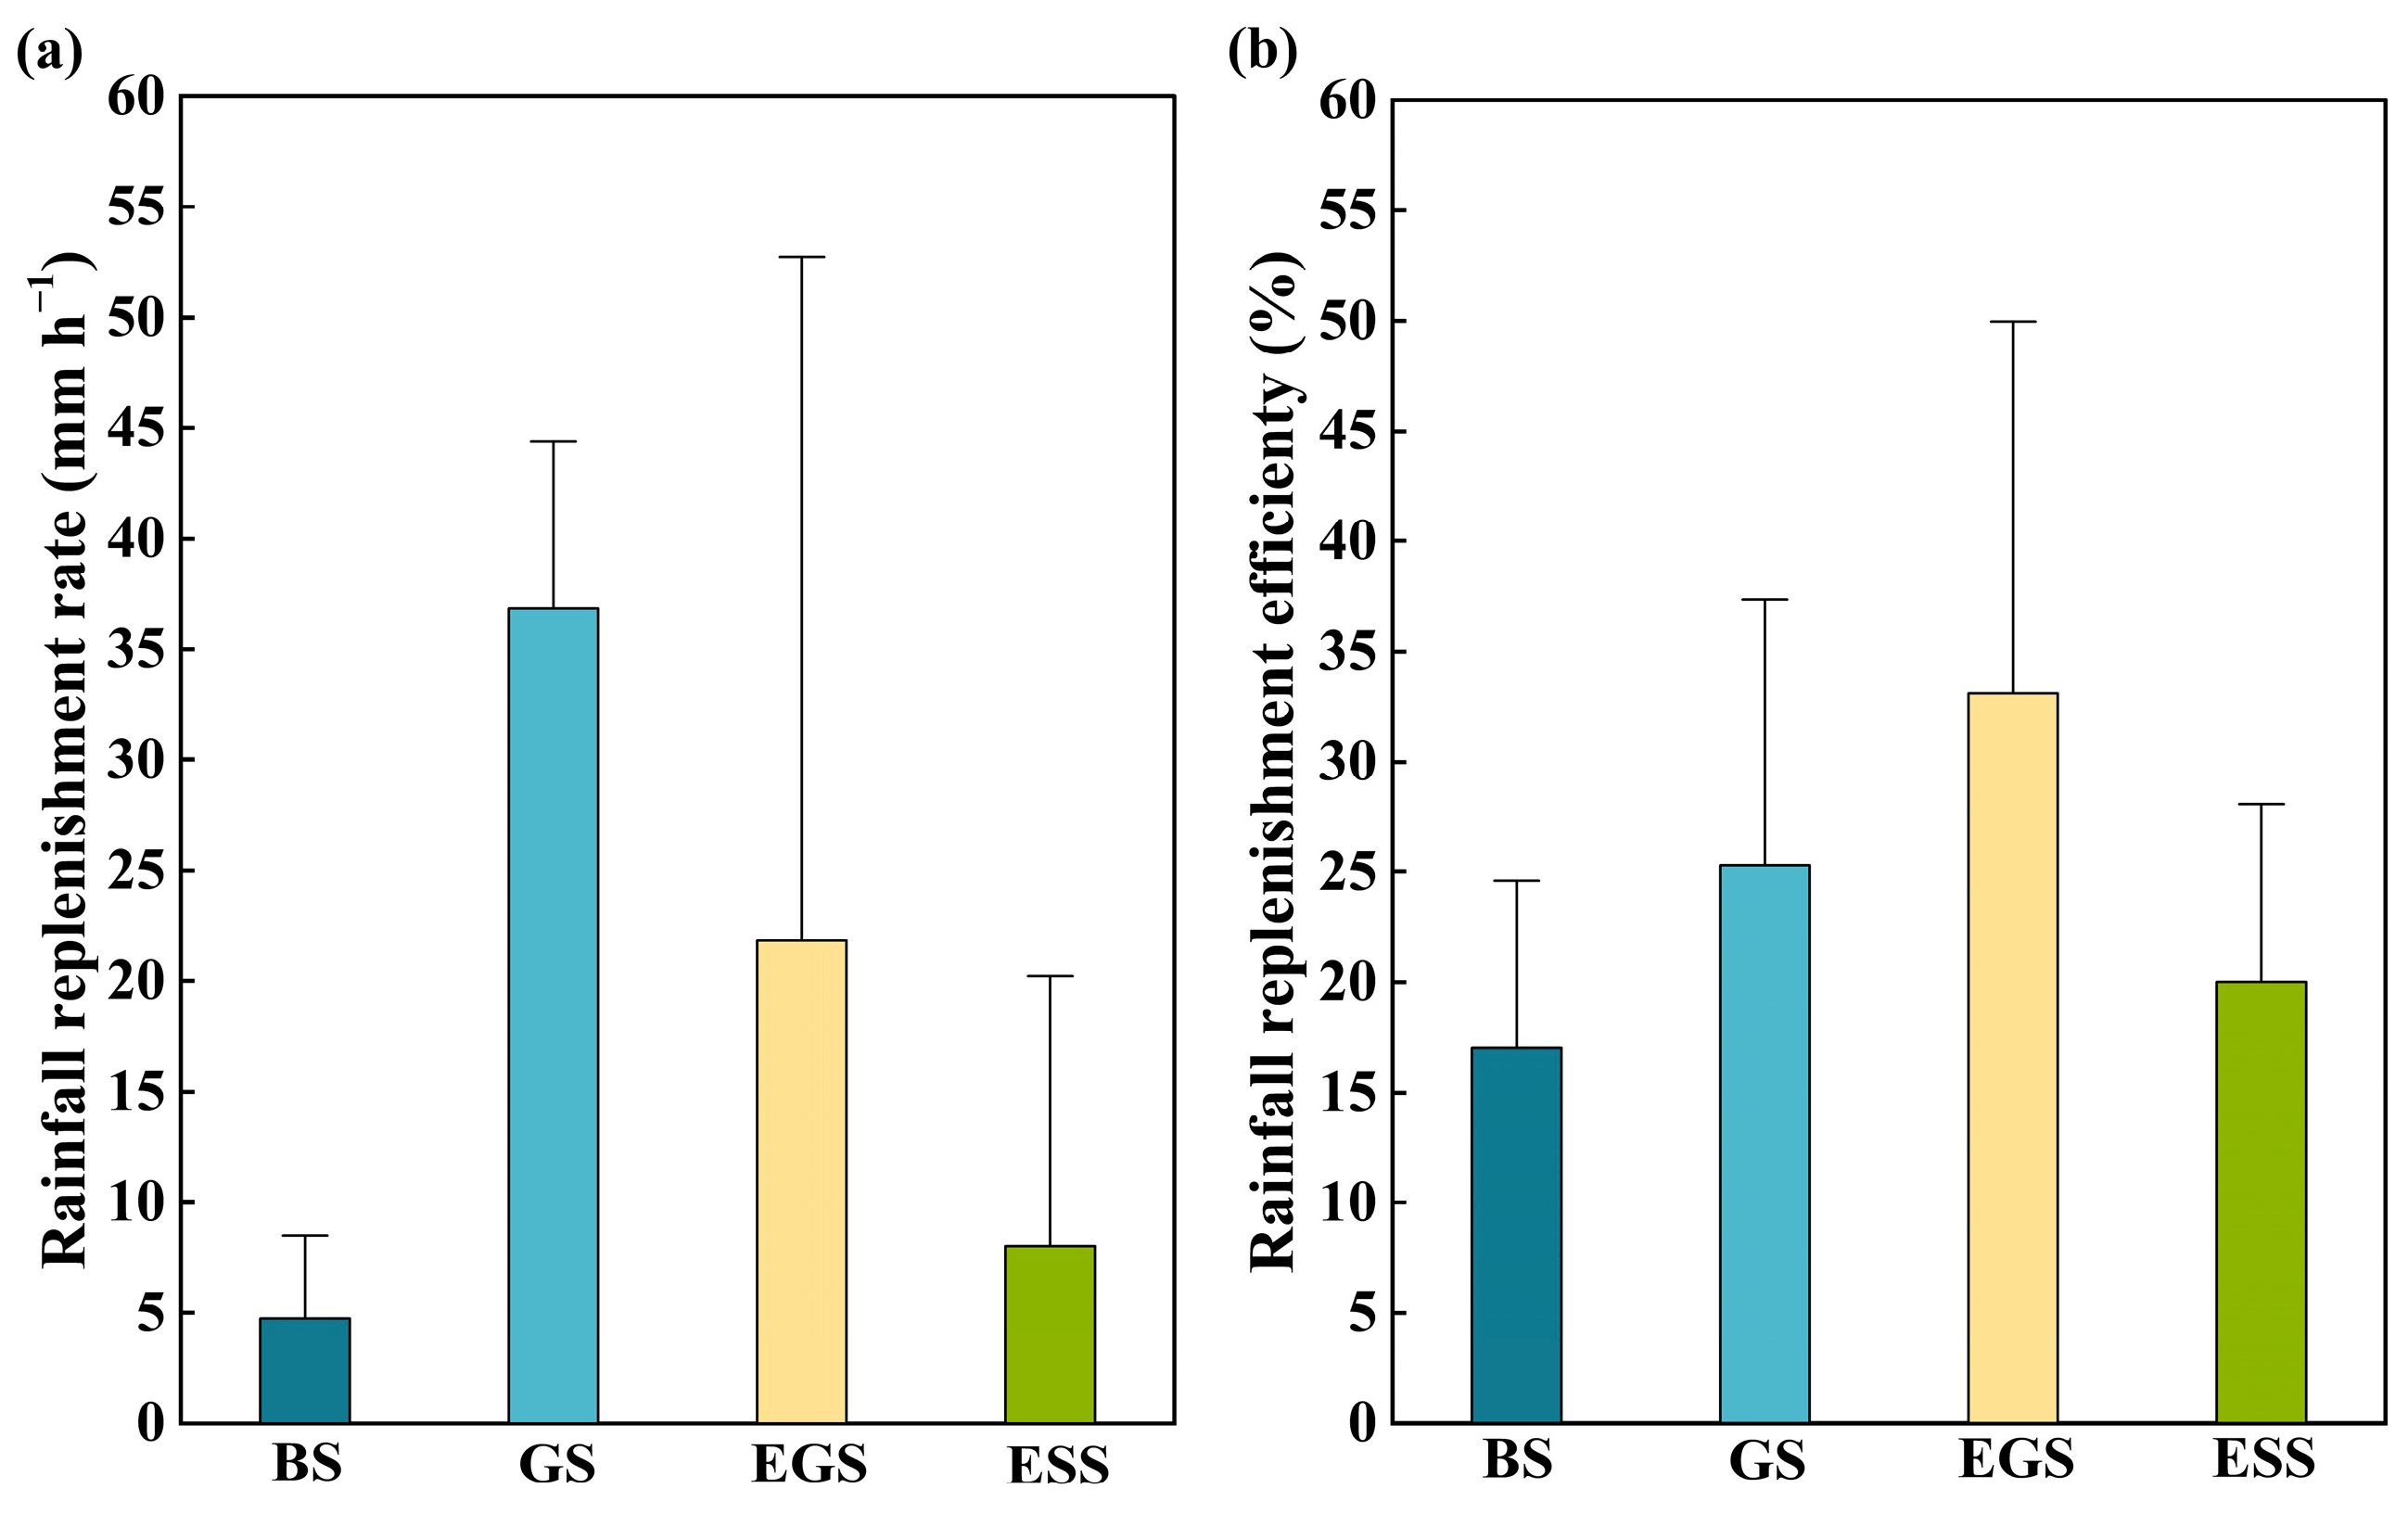
3.4.1. Rainfall Replenishment Efficiency of Rainfall Events

Figure 9 compared rainfall replenishment results associated with different slopes. The r of BS, GS, EGS, and ESS were 4.74 mm·h−1, 36.84 mm·h−1, 21.82 mm·h−1, and 8.02 mm·h−1, respectively (Figure 9a). Although gaining the shortest lag time (Figure 8), BS earned the lowest r. In contrast, GS had the highest r and the fastest infiltration rate, followed by EGS and ESS. This was related to the significant difference in ΔSW (Figure 7). Together, the e of BS, GS, EGS, and ESS were 17.01%, 25.28%, 33.08%, and 20%, respectively (Figure 9b). Compared with BS, the e of GS, EGS and ESS were increased by 8.27%, 16.07%, and 2.99%. As expected, EGS performed best in rainfall replenishment capacity.

3.4.2. Rainfall Threshold of Soil Water Recharge

Figure 10 shows the relationship between SWR and precipitation in each slope, along with the linear fitting equation. As validated by high R2, good linear relationships existed between them. The X-axis intercept of the fitting equation represents the rainfall replenishment threshold. The corresponding values were 1.67 mm for BS, 2.19 mm for GS, 1.71 mm for EGS, and 3.63 mm for ESS. BS had the smallest critical rainfall intensity for SWR, coinciding with the results in Figure 8. Comparably, the large thresholds of GS, EGS, and ESS indicated that vegetation restoration increased the difficulty of rainfall replenishment. The threshold of GS was higher than that of EGS, suggesting that vegetated concrete reduced the critical rainfall intensity for efficient SWR. ESS gained the largest threshold, implying that this is the required, densest rainfall to effectively recharge soil water.

4. Discussion

4.1. Effect of Rainfall on Soil Water Recharge

Rainfall was the main source of SWR in slopes. Due to the absence of vegetation cover, runoff loss was rapid, leading to less SWR in the deep soil layer [33]. As rainfall was less than 10 mm, SWR was relatively small [34]. In contrast, heavy rainfall events could effectively increase SWC [35]. In this study, light rainfall accounted for a higher proportion (Figure 4). The variation of SWC was slight under light individual rainfall events (16 November 2021, 24 December 2021, 3 March 2022, 6 March 2022, and 20 April 2022). This was consistent with the findings of Petrie et al. [36]. This was due to the small rainfall amount being insufficient to replenish soil water [32,33]. In contrast, SWR became gradually significant as rainfall intensity increased, namely, moderate rainfall, heavy rainfall, and rainstorm (Figure 7). It was because rainfalls above 10 mm offered sufficient water to penetrate deeper, thus replenishing soil water [33,37].
Notably, SWR was severely affected by ecological restoration. Before rainfall appeared, plants and vegetated concretes had significantly altered the spatiotemporal distribution of soil water (Figure 5 and Figure 6). Under a certain rainfall event, the response of soil water to individual rainfall events in BS was smaller than that of ESS, GS, and EGS (Figure 7). The plants and vegetated concretes considerably affected the response characteristics of soil water to different rainfall intensities. Meanwhile, SWR amounts under different restoration strategies also differed from each other. Under four rainfall levels, the response of soil water in ESS was lower than that of EGS (Figure 7), reflecting different governing effects of Cynodon dactylon and Magnolia multiflora. In this study, Cynodon dactylon was a shallow-rooted plant. The root length was densely distributed in the 0~20 cm layer, making large fluctuations of surface soil water. Magnolia multiflora was a deep-rooted plant. The root length was densely distributed from 0 to about 100 cm, which resulted in a smooth variation of SWC [16]. Consequently, the response of soil water in EGS was greater than ESS as rainwater entered.

4.2. Effect of Ecological Restoration on Soil Water Recharge

Plants govern the spatiotemporal distribution of soil water in slopes for a long time. Under rainless conditions, the physiological activities of plants dissipate soil water (Figure 5 and Table 4). The spatial distribution and movement characteristics of soil water were also significantly altered (Table 4 and Figure 6). These have led to significant differences in the initial soil water state across the four slopes prior to rainfall. Due to the absence of vegetation cover, rainwater rapidly penetrated the surface soil of BS as rainfall occurred. This also explains why BS earned the minimum lag time tl (Figure 8). Meanwhile, due to the high initial soil moisture content, the amount of SWR was relatively small due to the high initial SWC (Figure 7). As the surface soil reached saturation, most of the rainwater left in the form of runoffs. The deep soil was difficult to effectively replenished.
As for ecological slopes, the initial SWCs were lower than that of BS, requiring higher amounts of rainfall replenishment (Figure 7). In the early rainfall stage, SWR would be altered due to canopy interception. Canopy width, stems, roots, and litter were the main factors controlling water recharge [38,39]. Different vegetation covers corresponded to different recharge characteristics of soil water (Figure 5). As rainfall proceeded, the above effects gradually weakened. Soil bulk density, total porosity, and water retention capacity were the main driving factors [36,40]. In this study, the rainfall replenishment efficiency of ESS was lower than that of EGS (Figure 9b). This was attributed to Magnolia multiflora having a stronger canopy effect than Cynodon dactylon. Rainwater could not land on the slope surface quickly and only fell along the leaves. Partial raindrops were intercepted or segmented by the leaf vein [41]. Meanwhile, the potential energy, volume, and impact force of the raindrops were also reduced. The corresponding efficient recharge time was relatively lagged (Figure 8). This was partially consistent with the studies of Zhou et al. [3] and Fu et al. [42]. On the other hand, the light intensity, wind speed, and temperature, which affects soil evaporation and water movement, would be altered by canopy width [43]. Obviously, Magnolia multiflora had wider canopies than Cynodon dactylon. A wide canopy would better block out the sun and wind, reduce evaporation, and increase interception rainwater to alter water recharge [44,45,46].
Plant concrete can not only improve soil fertility [47], but also promote plant growth [48]. Plant concrete improves plant growth by improving soil structure and increasing root density [49,50]. These results are consistent with our experiments on EGS, where we found that GS containing plant concrete performed better in terms of sub-rainfall recharge efficiency. This indicates that the application of plant concrete may play an important role in improving soil water retention and plant growth in similar ecological protection slope areas. Thus, this study aligns with these previous findings and further validates the potential of plant-based concrete to improve the ecosystem function of slopes.

4.3. Influential Actors of Rainfall Threshold for Soil Water Recharge

The rainfall recharge threshold can reflect the difficulty of soil water utilization and the effectiveness of SWR. The thresholds of three ecological slopes were greater than BS (Figure 10). This indicates that BS can also receive replenishment water during light rainfalls, but ecological slopes require greater rainfall levels (Figure 7). Comparably, ESS earned the highest threshold, followed by GS and EGS (Figure 10). More intensive rainfall was desired to provide sufficient water for ESS. This was mainly related to vegetation leaves, plant litter, and vegetated concrete [50].
The leaves of the Magnolia multiflora are larger than those of the root of the Cynodon dactylon [19]. Large leaves increased rainfall interception [51], therefore affecting the threshold of rainfall replenishment. The impact of plant litter on soil water dynamics was complex [52]. Before runoff occurred, the litter of Magnolia multiflora and Cynodon dactylon roots reduced SWC by intercepting rainfall [53]. As runoff occurred, two plant litters increased surface roughness and improved soil structure [54]. Then, the SWC increased. In this study, the threshold of ESS was higher than that of EGS (Figure 8). This relied on Magnolia multiflora having a denser canopy structure than Cynodon dactylon. The rainfall interception effect was vitally significant, resulting in less infiltrating rainwater. The threshold was thereby expanded.
The rainfall recharge threshold was also influenced by soil structure and properties, which directly determines the speed and efficiency of rainfall replenishment [55]. The vegetated concrete can not only promote plant growth but also alter soil hydraulic properties [56]. Typically, cement could increase the soil strength of slopes, requiring greater precipitation to cause internal soil water dynamics [57,58]. However, the threshold of EGS was lower than that of GS, indicating that vegetated concrete reduced the rainfall replenishment threshold. Several factors may contribute to this: (1) PH regulators promoted root growth, which could provide more preferential channels for water infiltration [59,60]. (2) Organic matter increased soil porosity, water retention capacity, and soil water permeability coefficient [61]. (3) Cement caused water repellency in the soil aggregates [62].
In addition, the threshold was also related to rainfall process characteristics. In this study, only the effect of rainfall amount on the threshold was discussed. The changes in rainfall recharge thresholds under different rainfall processes have not been explored.

5. Conclusions

In this study, the complex effects of plant and vegetated concrete on soil water distribution and recharge characteristics were investigated under four slope types (bare slope, grass slope, ecological grass slope, and ecological shrub slope). Special attention was paid to the rainfall replenishment capacity of ecological slopes. Key findings from the study are summarized as follows:
(1) Rainfall is an important factor affecting soil water recharge, which gradually becomes significant as rainfall intensity rises. Plants and vegetated concretes significantly alter the dynamic response characteristics of soil water to individual rainfall events. Meanwhile, there are significant differences in soil water recharge under different ecological restoration strategies. Comparably, an ecological grass slope can provide an enhanced water recharge capacity. This provides an effective solution for areas in need of resupply.
(2) Plants in the long-term alter the spatiotemporal distribution of soil water across slope profiles and reduce soil water content. Under rainfall conditions, the lag time of rainfall replenishment extends, but the amount and efficiency are improved by ecological restoration. EGS has the highest rainfall replenishment efficiency, followed by GS and ESS. Magnolia multiflora outdoes Cynodon dactylon in canopy interception but is inferior in runoff reduction. Vegetated concrete enhances soil water recharge efficiency by altering soil properties. These results indicate that suitable vegetation and vegetated concrete can significantly improve the efficiency of soil recharge. This provides a practical approach for soil water management in degraded land.
(3) Ecological restoration raises the rainfall threshold for effective soil water recharge, especially ESS. ESS gains the highest rainfall threshold, followed by GS and EGS. Magnolia multiflora is superior to Cynodon dactylon in rainfall interception due to its denser canopy structure. Vegetated concrete can alter the organic matter content and permeability characteristics of surface soil, reducing the critical rainfall threshold for efficient SWR. Vegetated concrete also promotes plant root growth, providing preferential flow, and dynamically interacts with vegetation types to affect rainfall replenishment. Therefore, the use of specific plants and vegetated concretes can lower the rainfall threshold required for effective hydration, especially in areas with irregular rainfall patterns.
Soil water recharge is also influenced by the characteristics of rainfall processes, different densities of plants, and vegetated concrete components. Future research could focus on exploring the effects of different densities of plants and vegetated concrete components. Further investigation into how different rainfall processes affect recharge thresholds would also be beneficial in refining water management strategies for ecological restoration.

Author Contributions

X.Z.: writing—review and editing. F.X.: writing—original draft preparation. H.X. and Q.M.: project administration and data curation. L.Z., Y.S. and Z.L.: data curation. All authors have read and agreed to the published version of the manuscript.

Funding

This research was funded by the National Natural Science Foundation of Hubei Province (2025AFB475), the Key Research and Development Program of Hubei Province (2023BCB112); Open Project Funding of the Key Laboratory of Intelligent Health Perception and Ecological Restoration of Rivers and Lakes, the Ministry of Education, Hubei University of Technology (HGKFZP003); the Joint Funds of the National Nature Science Foundation of China (U22A20232); the Outstanding Young and Middle-Aged Science and Technology Innovation Team of colleges and universities in Hubei Province (T2022010); the Science Fund for Distinguished Young Scholars of Hubei Province (2022CFA043); and the Innovation Research Group Project of the Hubei Provincial Department of Science and Technology (2025AFA020).

Institutional Review Board Statement

Not applicable.

Informed Consent Statement

Not applicable.

Data Availability Statement

Data will be made available on request.

Conflicts of Interest

The authors declare that they have no known competing financial interests or personal relationships that could have appeared to influence the work reported in this paper.

References

  1. Chen, Q.; Shen, J.; Ku, M.; Wang, L. Numerical Investigation of Submarine Spreading Landslide Failures. Geotech. Geol. Eng. 2025, 43, 42. [Google Scholar] [CrossRef]
  2. Yuliana, Y.; Kamchoom, V.; Munirwan, R.P.; Gunawan, H. A Review of Herbaceous Vegetation Effect on Mechanical Properties of Soil for Enhancing Slope Stability; IOP Publishing Ltd.: Bristol, UK, 2024. [Google Scholar]
  3. Zhou, X.; Hu, K.; Xiao, H.; Yang, Y.; Chen, J.; Cheng, Y. Effects of vegetation on the spatiotemporal distribution of soil water content in re-vegetated slopes using temporal stability analysis. Catena 2024, 234, 12. [Google Scholar] [CrossRef]
  4. Zhang, Y.; Yang, R.; Sun, M.; Lu, Y.; Zhang, L.; Yin, Y.; Li, X. Identification of spatial protection and restoration priorities for ecological security pattern in a rapidly urbanized region: A case study in the Chengdu–Chongqing economic Circle, China. J. Environ. Manag. 2024, 366, 12. [Google Scholar] [CrossRef] [PubMed]
  5. Ma, J.; Han, J.; Zhang, Y.; Dong, Q.; Du, Y. Temporal stability of soil water content on slope during the rainy season in gully regulation watershed. Environ. Earth Sci. 2020, 79, 173. [Google Scholar] [CrossRef]
  6. Ma, T.; Deng, X.; Chen, L.; Xiang, W. The soil properties and their effects on plant diversity in different degrees of rocky desertification. Sci. Total Environ. 2020, 736, 139667. [Google Scholar] [CrossRef]
  7. Tao, G.; Cheng, Y.; Xiao, H.L.; Huang, S.; Zhou, X. Experimental Study on the Influence of Substrate Properties on Rainfall Infiltration and Runoff from Ecological Slopes. Appl. Sci. 2023, 13, 5557. [Google Scholar] [CrossRef]
  8. Zurweller, B.A.; Rowland, D.L.; Tillman, B.L.; Payton, P.; Erickson, J.; Racette, K.; Carter, E. Soil water depletion of peanut subspecies as influenced by water-use traits and soil water availability. J. Agron. Crop Sci. 2021, 208, 928–940. [Google Scholar] [CrossRef]
  9. Hess, L.J.T.; Hinckley, E.L.S.; Robertson, G.P.; Hamilton, S.K.; Matson, P.A. Rainfall Intensification Enhances Deep Percolation and Soil Water Content in Tilled and No-Till Cropping Systems of the US Midwest. Vadose Zone J. 2018, 17, 1–12. [Google Scholar] [CrossRef]
  10. Ng, C.W.W.; Ni, J.J.; Leung, A.K. Effects of plant growth and spacing on soil hydrological changes: A field study. Geotechnique 2020, 70, 15. [Google Scholar] [CrossRef]
  11. He, Z.; Xiao, P.; Jia, G.; Liu, Z.; Yu, X. Field studies on the influence of rainfall intensity, vegetation cover and slope length on soil moisture infiltration on typical watersheds of the Loess Plateau, China. Hydrol. Process. 2020, 34, 4904–4919. [Google Scholar] [CrossRef]
  12. Zhu, P.; Zhang, G.; Wang, H.; Xing, S. Soil infiltration properties affected by typical plant communities on steep gully slopes on the Loess Plateau of China. J. Hydrol. 2020, 590, 125535. [Google Scholar] [CrossRef]
  13. Yu, B.; Liu, G.; Liu, Q.; Wang, X.; Feng, J.; Huang, C. Soil moisture variations at different topographic domains and land use types in the semi-arid Loess Plateau, China. Catena 2018, 165, 125–132. [Google Scholar] [CrossRef]
  14. Qin, C.; Wang, R.; Chen, W.; Shi, Y.; Sun, H.; Tang, J.; Wang, L. Stability of Ficus virens-Reinforced Slopes Considering Mechanical and/or Hydrological Effects. Forests 2024, 15, 133. [Google Scholar] [CrossRef]
  15. Feng, H.G.; Xiao, H.; Jishuang, G. Bond strength between concrete substrate and repair mortar: Effect of fibre stiffness and substrate surface roughness. Cem. Concr. Compos. 2020, 114, 103746. [Google Scholar] [CrossRef]
  16. Ferreiro-Dominguez, N.; Palma, J.H.N.; Paulo, J.A.; Rigueiro-Rodriguez, A.; Mosquera-Losada, M.R. Assessment of soil carbon storage in three land use types of a semi-arid ecosystem in South Portugal. Catena Interdiscip. J. Soil Sci. Hydrol. Geomorphol. Focus. Geoecol. Landsc. Evol. 2022, 213, 106196. [Google Scholar] [CrossRef]
  17. Mertens, J.; Germer, J.; Filho, J.C.d.A.; Sauerborn, J. Effect of biochar, clay substrate and manure application on water availability and tree-seedling performance in a sandy soil. Arch. Agron. Soil Sci. 2017, 63, 969–983. [Google Scholar] [CrossRef]
  18. Hallett, P.D.; Young, I.M. Changes to water repellence of soil aggregates caused by substrate-induced microbial activity. Eur. J. Soil Sci. 1999, 50, 35–40. [Google Scholar] [CrossRef]
  19. Wu, H.; Li, Z.; Song, W.; Bai, S. Effects of Superabsorbent Polymers on Moisture Migration and Accumulation Behaviors in Soil. J. Clean. Prod. 2020, 279, 123841. [Google Scholar] [CrossRef]
  20. Yang, L.; Zhang, H.; Chen, L. Identification on threshold and efficiency of rainfall replenishment to soil water in semi-arid loess hilly areas. Sci. China 2018, 61, 10. [Google Scholar] [CrossRef]
  21. Xue, F.; Hu, Y.N. Diverse Responses of Vegetation Greenness and Productivity to Land Use and Climate Change: A Comparison of Three Urban Agglomerations in China. Sustainability 2024, 16, 5900. [Google Scholar] [CrossRef]
  22. Shang, R.; Sun, F.; Lu, H.; Han, P.; Fu, J.; Liu, W. Impact Mechanism of Vegetation Slope Surface on the Runoff and Sediment Producing Procedure of Jinyang Ancient City in Different Periods. Environ. Eng. Manag. J. EEMJ 2024, 23, 1083–1095. [Google Scholar] [CrossRef]
  23. Sarris, D.; Christodoulakis, D. Topographic and climatic effects on Pinus halepensis s.l. growth at its drought tolerance margins under climatic change. J. For. Res. 2024, 35, 102. [Google Scholar] [CrossRef]
  24. Maris, L.; Petrolli, R.; Selosse, M.-A.; Legland, T.; Pache, G.; Griveau, C.; Torre, F.; Lopez-Pinot, D.; Marciau, R.; Bonnet, V. Impact of the local environmental factors associated to plant-fungi communities on the conservation of Liparis loeselii (L.) Rich. In the French Rhne-Alpes region. Acta Oecologica 2023, 120, 15. [Google Scholar] [CrossRef]
  25. Jiao, T.; Chang, G.; Zhou, X.; Yang, H.; Hou, Y.; Miao, X.; Liu, R.; Pu, X. Study on relationship between soil enzyme and soil fertility of alpine meadow in different carrying capacities. Acta Prataculturae Sin. 2009, 18, 98–104. [Google Scholar]
  26. Bai, Y.; Liu, M.; Yi, J.; Zhang, H. Temporal stability analysis of soil moisture along a coniferous forest hillslope with subtropical monsoon climate in southwest China. J. Mt. Sci. 2021, 18, 15. [Google Scholar] [CrossRef]
  27. Bialkowski, R.; Buttle, J.M. Stemflow and throughfall contributions to soil water recharge under trees with differing branch architectures. Hydrol. Process. 2015, 29, 4068–4082. [Google Scholar] [CrossRef]
  28. Kerkides, P. Implications of Hysteresis on the Horizontal Soil Water Redistribution after Infiltration. Water 2021, 13, 2773. [Google Scholar] [CrossRef]
  29. Singh, N.K.; Emanuel, R.E.; Mcglynn, B.L.; Miniat, C.F. Soil moisture responses to rainfall: Implications for runoff generation. Water Resour. Res. 2021, 57, e2020WR028827. [Google Scholar] [CrossRef]
  30. Liu, Z.; She, R.; Xiong, K.; Li, Y.; Cai, L. Effect of Vegetation Restoration on Soil Hydrology in Karst Area of Southwest China: Inspiration from Barrel Planting Experiments. Water 2021, 13, 1719. [Google Scholar] [CrossRef]
  31. Chen, H.; Shao, M.; Li, Y. The characteristics of soil water cycle and water balance on steep grassland under natural and simulated rainfall conditions in the Loess Plateau of China. J. Hydrol. 2008, 360, 242–251. [Google Scholar] [CrossRef]
  32. Li, Y.; Liu, Z.; Liu, G.; Xiong, K.; Cai, L. Dynamic variations in soil moisture in an epikarst fissure in the karst rocky desertification area. J. Hydrol. 2020, 591, 125587. [Google Scholar] [CrossRef]
  33. Xiaona, Y.; Yongmei, H.; Engui, L.; Xiaoyan, L.; Weihua, G. Effects of vegetation types on soil water dynamics during vegetation restoration in the Mu Us Sandy Land, northwestern China. J. Arid Land 2017, 9, 12. [Google Scholar]
  34. Li, B.; Rodell, M. Spatial variability and its scale dependency of observed and modeled soil moisture over different climate regions. Hydrol. Earth Syst. Sci. 2013, 17, 1177–1188. [Google Scholar] [CrossRef]
  35. He, Z.; Zhao, W.; Liu, H.; Chang, X. The response of soil moisture to rainfall event size in subalpine grassland and meadows in a semi-arid mountain range: A case study in northwestern China’s Qilian Mountains. J. Hydrol. 2012, 420–421, 183–190. [Google Scholar] [CrossRef]
  36. Petrie, M.D.; Collins, S.L.; Litvak, M.E. The ecological role of small rainfall events in a desert grassland. Ecohydrology 2015, 8, 1614–1622. [Google Scholar] [CrossRef]
  37. Mei, X.; Ma, L. Effect of afforestation on soil water dynamics and water uptake under different rainfall types on the Loess hillslope. Catena 2022, 213, 106216. [Google Scholar] [CrossRef]
  38. Nyawade, S.O.; Karanja, N.N.; Gachene, C.K.K.; Elmar, S.G.; Monica, P. Effect of potato hilling on soil temperature, soil moisture distribution and sediment yield on a sloping terrain. Soil Tillage Res. 2018, 184, 24–36. [Google Scholar] [CrossRef]
  39. Panpan, L.I.; Bing, W.; Yanfen, Y.; Guobin, L. Effects of vegetation near-soil-surface factors on runoff and sediment reduction in typical grasslands on the Loess Plateau, China. J. Arid Land 2022, 14, 325–340. [Google Scholar]
  40. Sun, C.; Hou, H.; Chen, W. Effects of vegetation cover and slope on soil erosion in the Eastern Chinese Loess Plateau under different rainfall regimes. PeerJ 2021, 9, e11226. [Google Scholar] [CrossRef]
  41. Chen, S.; Xie, Q.; Su, S.; Wu, L.; Zhong, S.; Zhang, Z.; Ma, C.; Qi, Y.; Hu, W.; Deng, J.; et al. Source and formation process impact the chemodiversity of rainwater dissolved organic matter along the Yangtze River Basin in summer. Water Res. 2021, 211, 118024. [Google Scholar] [CrossRef]
  42. Fu, S.; Wu, J.; Zhang, Q.; Xie, B. Robust and efficient synchronization for structural health monitoring data with arbitrary time lags. Eng. Struct. 2025, 322 Pt B, 119183. [Google Scholar] [CrossRef]
  43. Stern, E.; Riva, F.; Nielsen, S. Effects of Narrow Linear Disturbances on Light and Wind Patterns in Fragmented Boreal Forests in Northeastern Alberta. Forests 2018, 9, 486. [Google Scholar] [CrossRef]
  44. Ziemińska, K.; Bibbo, S.; Farrar, S.; Thompson, J.; Uriarte, M.; Ziaco, E.; Zimmerman, J.K.; Muscarella, R. Shifts in wood anatomical traits after a major hurricane. Funct. Ecol. 2023, 37, 3000–3014. [Google Scholar] [CrossRef]
  45. Timlin, D.J.; Heathman, G.C.; Ahuja, L.R. Solute Leaching in Crop Row vs. Interrow Zones. Soil Sci. Soc. Am. J. 1992, 56, 384–392. [Google Scholar] [CrossRef]
  46. Cowie, B.E.; Porley, V.; Robertson, N. Solar Disinfection (SODIS) Provides a Much Underexploited Opportunity for Researchers in Photocatalytic Water Treatment (PWT). ACS Catal. 2020, 10, 11779–11782. [Google Scholar] [CrossRef]
  47. Hui, X.; Zheng, Y.; Yan, H. Water distributions of low-pressure sprinklers as affected by the maize canopy under a centre pivot irrigation system. Agric. Water Manag. 2021, 245, 106646. [Google Scholar] [CrossRef]
  48. Srivastava, A.; Saco, P.M.; Rodriguez, J.F.; Kumari, N.; Chun, K.P.; Yetemen, O. The Role of Landscape Morphology on Soil Moisture Variability in Semi-arid Ecosystems. Hydrol. Process. 2020, 35, 13990. [Google Scholar] [CrossRef]
  49. Hou, G.; Bi, H.; Wei, X.; Kong, L.; Wang, N.; Zhou, Q. Response of Soil Moisture to Single-Rainfall Events under Three Vegetation Types in the Gully Region of the Loess Plateau. Sustainability 2018, 10, 3793. [Google Scholar] [CrossRef]
  50. Sharma, R.K. Laboratory study on stabilization of clayey soil with cement kiln dust and fiber. Geotech. Geol. Eng. 2017, 35, 2291–2302. [Google Scholar] [CrossRef]
  51. Ji, Y.; Shi, Z.; Yang, S.; Tian, S.; Yang, Q.; Chen, Y.; Shan, L.; Chen, Y.; Liu, J.; Yu, K. Effect of spatial differentiation of Pinus massoniana canopy branches and leaves on rainfall interception—An example from Changting County. Hydrol. Sci. J. 2024, 69, 15. [Google Scholar] [CrossRef]
  52. Parré, F.M.; Loiola, P.P.; Ballarin, C.S.; Monquero, P.A. Impact of invasive plant management on soil activity and litter decomposition in a tropical forest restoration. Restor. Ecol. 2023, 31, 13906. [Google Scholar] [CrossRef]
  53. Zhu, P.; Zhang, G.; Zhang, B.J.; Wang, H. Variation in soil surface roughness under different land uses in a small watershed on the Loess Plateau, China. Catena 2020, 188, 104465. [Google Scholar] [CrossRef]
  54. Wu, G.L.; Jia, C.; Huang, Z.; Lopez-Vicente, M.; Liu, Y. Plant litter crust appear as a promising measure to combat desertification in sandy land ecosystem. Catena 2021, 206, 105573. [Google Scholar] [CrossRef]
  55. Yi, F.; Deng, Y.; Li, Y. Responses of plant sap flow rate to epikarst water availability under different karst water-bearing media. J. Hydrol. 2023, 626 Pt B, 130373. [Google Scholar] [CrossRef]
  56. Guo, H.; Zhang, Q.; Chen, Y.; Lu, H. Effects of biochar on plant growth and hydro-chemical properties of recycled concrete aggregate. Sci. Total Environ. 2023, 882, 163557. [Google Scholar] [CrossRef] [PubMed]
  57. Li, J. Modeling the Stormwater Benefits of Green Roofs in the City of Toronto. J. Water Manag. Model. 2008, 16, 283–294. [Google Scholar] [CrossRef]
  58. Killham, K.; Amato, M.; Ladd, J.N. Effect of substrate location in soil and soil pore-water regime on carbon turnover. Soil Biol. Biochem. 1993, 25, 57–62. [Google Scholar] [CrossRef]
  59. Li, J.; Wang, X.; Jia, H.; Liu, Y.; Zhao, Y.; Shi, C.; Zhang, F.; Wang, K. Assessing the soil moisture effects of planted vegetation on slope stability in shallow landslide-prone areas. J. Soils Sediments 2021, 21, 2551–2565. [Google Scholar] [CrossRef]
  60. Jiang, X.J.; Liu, W.J.; Chen, C.F.; Yuan, J.Q.; Jin, Z.Q. Effects of three morphometric features of roots on soil water flow behavior in three sites in China. Geoderma 2018, 320, 161–171. [Google Scholar] [CrossRef]
  61. Feifel, M.; Durner, W.; Hohenbrink, T.L.; Peters, A. Effects of improved water retention by increased soil organic matter on the water balance of arable soils: A numerical analysis. Vadose Zone J. 2024, 23, e20302. [Google Scholar] [CrossRef]
  62. Vogelmann, E.S.; Reichert, J.M.; Prevedello, J.; Awe, G.O.; Cerdà, A. Soil moisture influences sorptivity and water repellency of topsoil aggregates in native grasslands. Geofis. Int. 2017, 305, 374–381. [Google Scholar] [CrossRef]
Figure 1. Root scan picture: (a) Cynodon dactylon and (b) Magnolia multiflora.
Sustainability 17 04018 g001
Figure 2. Soil particle gradation.
Sustainability 17 04018 g002
Figure 3. Design of the model slopes.
Sustainability 17 04018 g003
Figure 4. Characteristics of rainfall events during the experiment period: (a) monthly rainfall and (b) frequency of each rainfall level.
Sustainability 17 04018 g004
Figure 5. Temporal variations of SWC in different slopes.
Sustainability 17 04018 g005
Figure 6. Spatial distribution of soil water during experimental period: (a) Mean SWC and (b) CV of SWC.
Sustainability 17 04018 g006
Figure 7. Comparison of SWR under different slopes.
Sustainability 17 04018 g007
Figure 8. Lag time of rainfall events in different slopes.
Sustainability 17 04018 g008
Figure 9. Comparison of rainfall replenishment capacity in different slopes: (a) r and (b) e.
Sustainability 17 04018 g009
Figure 10. Relationship between SWR and precipitation in different slopes.
Sustainability 17 04018 g010
Table 1. Basic physical properties of soil.
Soil ParametersValue
Initial volumetric water content (%)15.6
Optimal volumetric water content (%)20
Maximum dry density (g∙cm−3)1.750
Natural dry density (g∙cm−3)1.5
Plastic limit (%)23
Liquid limit (%)41
Soil PH value8.13
Soil porosity (%)47.6
Table 2. Design parameters of model slopes.
SlopeSlope RatioVegetated ConcretePlantSeeding DensityPlant Height
BS1:1.75----
GS1:1.75-Cynodon dactylon30 g/m213~20 cm
EGS1:1.753 cm, 3% cementCynodon dactylon30 g/m215~28 cm
ESS1:1.753 cm, 3% cementMagnolia multiflora30 g/m2100~180 cm
Table 3. Variation level of soil water classified by CV.
CV[0, 10%)[10%, 100%)[100%, +∞)
Variation levelWeak variationModerate variationStrong variation
Table 4. Descriptive statistics of SWC in four slopes.
SlopesSoil DepthMax/%Min/%Mean/%SDCV/%
BS0~20 cm36.0827.1932.081.500.05
20~40 cm35.7828.3231.05 1.400.05
40~60 cm40.5727.1333.44 4.830.14
60~100 cm39.7529.7934.14 3.380.10
GS0~20 cm37.3125.5631.303.240.10
20~40 cm37.7626.7930.772.620.09
40~60 cm34.5324.3930.091.670.05
60~100 cm37.9325.2634.402.490.07
EGS0~20 cm36.7221.6026.413.840.15
20~40 cm36.4627.0030.111.610.05
40~60 cm32.5226.1329.071.340.05
60~100 cm31.7917.7526.871.430.05
ESS0~20 cm37.2426.3331.782.660.08
20~40 cm31.7727.0029.340.870.03
40~60 cm34.8025.2029.473.420.12
60~100 cm40.6124.8932.366.810.21
Disclaimer/Publisher’s Note: The statements, opinions and data contained in all publications are solely those of the individual author(s) and contributor(s) and not of MDPI and/or the editor(s). MDPI and/or the editor(s) disclaim responsibility for any injury to people or property resulting from any ideas, methods, instructions or products referred to in the content.

