1. Introduction
Windblown sand accumulation along railway tracks is a significant concern, particularly in arid regions where environmental conditions favor such a deposition. The natural forces of wind can transport sand particles over considerable distances, leading to their accumulation on railway infrastructure. Windblown sand accumulation not only threatens the structural integrity of the tracks, but may also compromise the safety of train operations. Drawing on the findings from the study “
Seek Ways for Dealing with the Impacts of Sandstorms on the Railway Network in Saudi Arabia” [
1] the research highlights how the Hejaz Railway’s analysis of wind erosion control strategies enhances its adaptability to desert conditions, improving railway safety, durability, and economic viability through efficient sand management techniques. Sand accumulation poses a significant challenge for railway tracks in arid and desert regions. This accumulation not only threatens the structural stability of rail infrastructure but also jeopardizes the safety of train operations. Studies using methods like numerical simulations, probabilistic models, and field analyses emphasize the need to understand how wind and sand interact. Sand fences, erosion control techniques, and planned maintenance strategies aim to improve the safety, resilience, and cost efficiency of railway systems in sand-prone areas [
2] Etihad Rail, the UAE’s national railway network, was established in 2009 to enhance the country’s rail infrastructure. The railway passes through over 50 km of sensitive desert areas, with dunes reaching 150 m, which are characterized by challenging environmental conditions [
3,
4].
Similarly, a study on the Lanzhou-Xinjiang Railway in Xinjiang, spanning 539 km through the Yandun wind zone near the Tianshan Mountains, focuses on how high vertical-type sand fences influence windblown dunes. The research methodology used numerical simulations based on fluid dynamics coupled with a discrete element method; researchers examined wind sand flow fields and sand particle trajectories. The results revealed that wind speed impacts sand accumulation, with rates on the windward slope ranging from 20% to 30%, and on the leeward slope from 30% to 40%. These insights provide a scientific basis for implementing effective wind sand prevention measures along desert railways [
5].
Although various sand mitigation measures have been implemented, scientific research and design guidelines for a systematic and performance-based approach remain limited. The Windblown Sand Mitigation Along Railway Mega-projects study explores the effects of windblown sand on railways, examines mitigation strategies, and introduces a probabilistic approach to assess sand impacts and optimize maintenance planning. The study evaluates the performance of three different mitigation measures and provides a comparative analysis. In the results, the study demonstrates the applicability of a probabilistic approach to assess windblown sand effects and plan maintenance operations. It also evaluates and compares three sand mitigation strategies, providing insights into their effectiveness and potential for improving railway infrastructure resilience.
Recent advancements in artificial intelligence (AI) and machine learning offer promising solutions for improving sand mitigation strategies by enhancing the monitoring and analysis of sand accumulation patterns through AI-based image processing and encryption techniques. Incorporating AI-driven models enables real-time sand transport predictions and supports automated decision-making in mitigation efforts. Key studies demonstrating AI’s potential in sand management include Kh-Madhloom et al. (2020), who explore convolutional neural networks (CNNs) and fuzzy logic for image detection, offering potential applications in sand accumulation analysis and, Oday et al. (2025), who present quantum machine learning for video compression, showcasing how AI techniques can improve image analysis and monitoring in dynamic environmental conditions [
6,
7]. By integrating AI and GIS-based techniques, railway engineers can enhance risk identification, optimize sand fence placement, and improve long-term mitigation strategies, contributing to more effective, data-driven, and adaptive solutions for combating wind-driven sand accumulation along railway networks.
2. Method and Materials
2.1. Study Area
The majority of the railway is located in desert conditions; in this paper, the study area was between the Ruwais and Gaweifat Railway tracks, which run through the western region of the United Arab Emirates, with approximate coordinates for Ruwais at (24.0831° N, 52.7256° E) and Gaweifat at (24.0750° N, 51.3142° E). This section of the railway passes through desert terrain and plays a key role in connecting major industrial hubs in the region [
2]. Therefore, wind erosion, and the consequent transport and deposition of sand are problematic and also tends to compromise the safety of railway facilities and their functionality. The accumulation of sand can block the rail tracks, lead to an upsurge in expenditures on repairs, and create dangerous situations on the train tracks. as shown in (
Figure 1). This study covered geographical and environmental assessments in detail, considering the deposition of sand along the railway track. It also recommends the use of sand fence to mitigate the impacts of sand deposition. With the occasional formation of sand dunes, small and big, digital elevation models (DEMs) in the context of this paper were used to identify the terrain topography required to comprehend how wind influences sand accumulation on the terrain. High-built-up areas that contain steep gradients or high dunes result in the accumulation of sand on the railway track [
8]. As shows in
Figure 1, using the spatial software ArcGIS 10.7.1, topographic tests helped identify various portions of the track where the railway runs close to or right through sand dunes.
2.2. Windblown Sand Limit States
The effects of windblown sand on railways have spurred the development of an innovative framework designed to address its impact comprehensively. A key feature of the framework is the introduction of Sand Limit States (SLS). The SLS framework is divided into two main categories: first, Sand Ultimate Limit States (SULS) define critical conditions that can lead to complete service interruptions or create unsafe scenarios for passengers and freight; and second, the Sand Serviceability Limit States (SSLS) are the threshold relating to the conditions where the railway’s capacity is partially reduced, resulting in potential discomfort for passengers or slower service speeds. While less severe than SULS, SSLS still require proactive management to minimize their impact on operational efficiency [
9].
2.3. SMM Categorization: A New Proposal
This study introduces a new classification of Sand Management Measures (SMMs) specifically for railways, aimed at addressing the previously identified limitations. This leads to the development of an innovative Source–Path–Receiver (SPR) scheme, as shown in
Figure 2. Source SMMs are positioned directly over the source of the sand, such as dunes or loose sand sheets, regardless of the distance between the sand source and the infrastructure. Path SMMs are placed along the windblown sand path, extending from the source to the infrastructure, and their effectiveness depends on the overall geometry of the infrastructure. Receiver SMMs are located directly on the infrastructure itself, and their effectiveness is highly dependent on the type of infrastructure [
10].
2.4. Sand Fence Layer
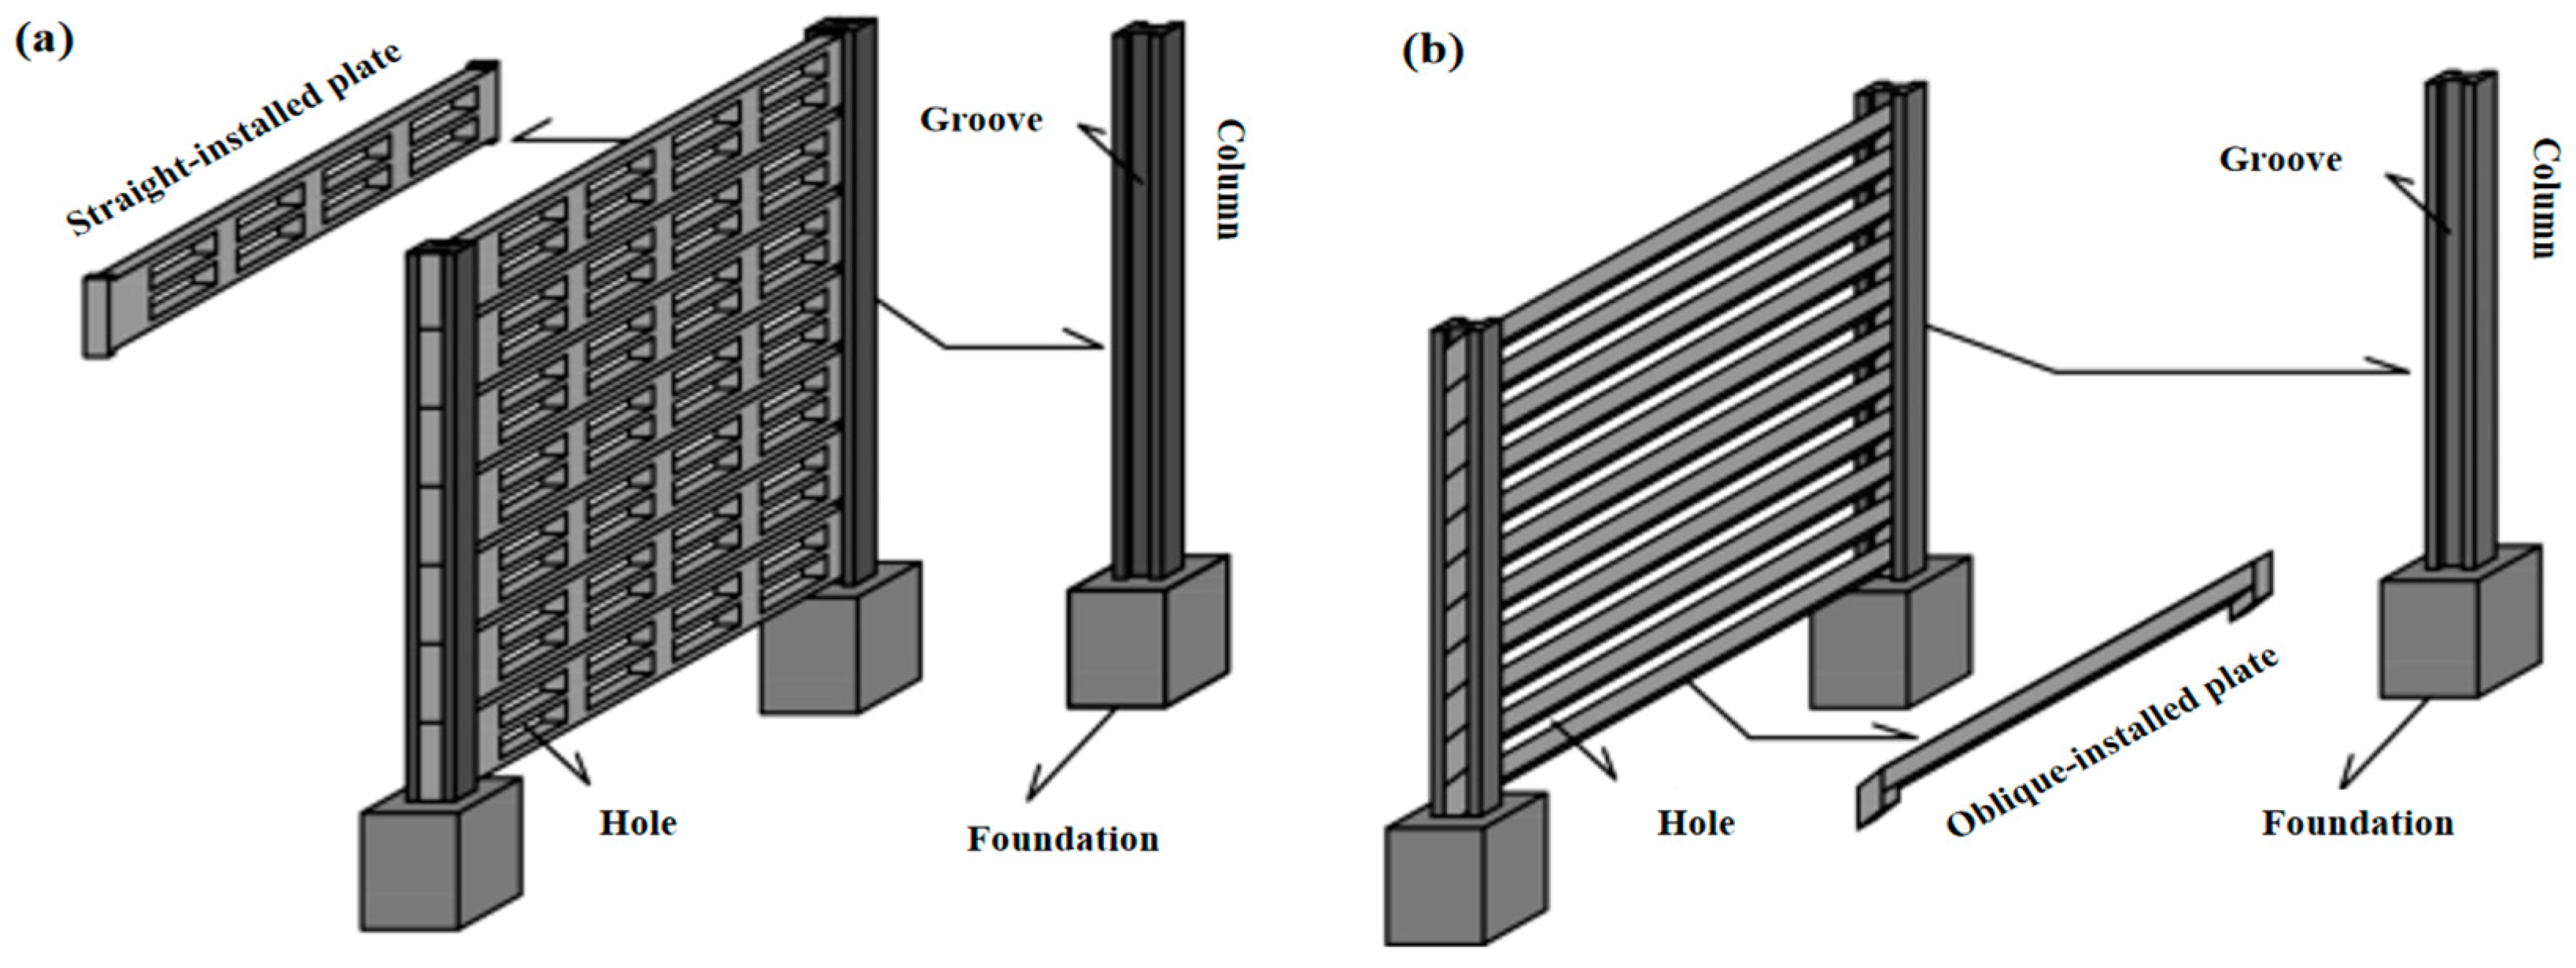
A vector layer was generated in ArcGIS to represent the locations and sizes of sand fences, which serve as barriers to reduce the wind’s ability to transport sand over railway tracks. As shown in
Figure 3 and
Figure 4, two designs are presented: (a) plates with perforations that allow for controlled airflow, reducing wind speed and effectively trapping sand; and (b) plates installed at an angle into vertical columns, which help deflect and capture sand carried by the wind [
10,
11].
2.5. Wind Data Analysis
Wind is the main driving force behind sand movement in desert environments. Wind direction, speed, and consistency determine the transport and deposition of sand along the railway.
Table 1 summarizes wind data for key locations [
12]; in Abu Dhabi, the average wind speed is 7.5 m/s, with winds predominantly coming from the northwest, according to data from the UAE National Center of Meteorology. Al Ain experiences a slightly lower average wind speed of 6.8 m/s, with winds primarily from the north. Liwa Oasis has the highest average wind speed at 8.2 m/s, with winds mainly originating from the southwest, as noted in the Global Wind Atlas. In contrast, Dubai records an average wind speed of 5.6 m/s, with primarily east winds, based on data from the UAE National Center of Meteorology.
2.6. Visualization of Sand Accumulation Changes
Maps were generated to visualize changes in sand accumulation risk before and after the implementation of sand fences. The visual representations included heat maps, with high-risk areas before the installation of sand fences highlighting warm colors in
Figure 5, indicating where significant sand deposition was expected. Following the installation, cooler colors represented reduced risks and lower flow accumulation values.
2.7. Pre-Fence Analysis
Data Input: The DEM was utilized to calculate flow accumulation, where each cell’s flow is based on the adjacent cells’ elevations. Wind direction data were integrated to simulate how wind would carry sand over various terrains. Using the Flow Accumulation Tool in ArcGIS, the study identified areas where wind-driven sand would likely accumulate without intervention. The high flow accumulation values indicated regions at high risk of sand deposition, emphasizing the need for protective measures.
Table 2 summarizes flow accumulation values in key sections along the railway prior to sand fence installation.
The GIS map in (
Figure 6) provides a spatial representation of flow accumulation patterns across a region in the UAE before the installation of sand-control fences. Yellow (1–4) represents areas with the lowest flow accumulation, indicating minimal sand movement or accumulation risks. Orange (4.00000001–8) represents moderate flow accumulation, suggesting a slightly elevated risk of sand transport. Blue (8.00000001–16) indicates higher levels of flow accumulation, showing regions with significant potential for sand movement. Green (16.00000001–12) highlights zones with the highest flow accumulation, marking areas most vulnerable to sand encroachment. The black lines on the map likely indicate key railway tracks, which are critical to understanding the interaction between flow accumulation and man-made structures. The central and eastern parts of the map show higher-risk zones (green and blue areas), while the western areas are predominantly low-risk (yellow and orange zones).
2.8. Post-Fence Analysis
Sand fence integration was used after modeling the pre-fence conditions, a vector layer representing the sand fences was introduced into the GIS environment. The same flow accumulation tool was applied post-fence installation, allowing for a comparative analysis of sand deposition risk. The sand fences were expected to disrupt wind flow, reducing the velocity of wind and its capacity to transport sand. The results of the flow accumulation analysis after sand fence installation showed the following change. The data in
Table 3 illustrate a significant reduction in flow accumulation, particularly in high-risk areas. Abu Dhabi scored 800 cells, while Liwa Ossis has 1200 cells.
The updated map marks high-risk areas such as Abu Dhabi and Liwa Ossis, with labels and bold boundary lines ensuring they stand out. The flow accumulation colors remain consistent: as shown in
Figure 7, blue (0–2) for low accumulation, yellow (2–9) for moderate, orange (9–20) for high, red (20–31) for very high, and dark red (31–88) for extreme accumulation, with high-risk areas highlighted in red or dark red zones to indicate significant sand accumulation.
2.9. Sand Deposition and Erosion Data Analysis
It has been noted that sand deposition data are important in determining where there is probability of accumulation of sand (
Table 4). Abrasion takes place when blowing wind picks up sand particles from the ground and disperses them before dropping them down as the wind becomes weaker or encounters structures like sand barriers, etc. The primary sources for sand deposition data, including available information on the rate of sand deposition at the site and areas which are most vulnerable to erosion, were obtained from local agencies and geological surveys. Where necessary data were unavailable, simple simulations employing the ArcGIS geographical information system were carried out. These simulations depicted the impact of winds on sand accumulation in this railway line.
2.10. Manual Design Calculations
2.10.1. Wind Speed Reduction by Sand Fence
The effectiveness of sand fences in controlling wind-driven sand deposition can be calculated using a combination of aerodynamic, sediment transport, and deposition rate models. To quantify the performance of sand fences along the Etihad Railway, we incorporated several key parameters, including wind speed, sand particle size, fence porosity, and the reduction in sand flux (the amount of sand transported by wind) before and after fence installation [
13]. The main objective of a sand fence was to reduce the wind speed near the surface to a level that no longer transports sand [
14]. The reduction in wind speed V fence caused by a sand fence can be approximated by the Equation (1):
where
= wind speed after the fence (m/s),
= wind speed before the fence (m/s),
P = porosity of the fence (fraction of open area to total area) given
= 10 m/s,
P = 0.4.
2.10.2. Threshold Velocity for Sand Transport
The threshold velocity
is the minimum wind speed required to move sand particles. It is calculated using
where
A = empirical coefficient (typically 0.1–0.15),
= acceleration due to gravity (9.81 m/s
2),
d = particle diameter (0.2 mm = 0.0002 m),
sand particle density (2650 kg/m
3),
= air density (1.225 kg/m
3) given
A = 0.1 A,
= 9.81 m/s
2, dd = 0.0002 m,
= 2650 kg/m
3,
= 1.225 kg/m
3.
Thus, the threshold velocity for sand transport is 0.206 m/s.
2.10.3. Sand Flux Before Fence Installation
The sand flux Q represents the volume of sand transported by the wind per unit width of the surface per unit time. It is usually calculated using the Bagnold equation for saltation (the dominant sand transport mode in deserts) [
15,
16].
where
Q = Sand flux (kg/m
2/s),
C = Empirical coefficient (typically 2.5–3.0),
= air density (1.225 kg/m
3),
= gravity (9.81 m/s
2),
= wind velocity before fence installation (10 m/s),
= threshold velocity for sand transport (0.206 m/s) given
,
.
Thus, before fence installation, the sand flux is 19.95 kg/m2/s.
2.10.4. Post-Fence Sand Flux
After fence installation, the wind velocity is reduced
to
, and this in turn reduces the sand flux [
15]. Using the reduced velocity after the fence
= 6 m/s.
Thus, the sand flux after fence installation is significantly reduced to 5.175 kg/m
2/s, compared to 19.95 kg/m
2/s before the fence. This represents a reduction of about 74% in sand transport. The sand trapped behind the fence can be estimated by the difference in sand flux before and after the fence installation [
17].
2.10.5. Sand Deposition Rate (SDR)
The amount of sand trapped behind the fence is calculated as
given
,
,
.
Thus, 7387.5 kg of sand per second is deposited behind a 500 m sand fence.
The results presented in
Table 1 demonstrate the effectiveness of sand fences in reducing wind speed and sand transport, ultimately protecting railway infrastructure from excessive sand accumulation. Implementing such mitigation measures significantly enhances the railway’s resilience, ensuring safer and more cost-effective operations.
2.11. Boundary Conditions
Fence length (L) = 500 m
Fence reduces wind speed by 40%.
Sand flux decreases by 74% post-installation.
3. Results and Discussion
The findings from this study on the effectiveness of sand fences reveal substantial benefits in mitigating wind-driven sand transport, which is important for the protection of the Etihad Railway. Following the installation of sand fences, wind speed in the area decreased by an impressive 40%, demonstrating their immediate impact on local wind conditions. Moreover, the threshold velocity for sand transport was calculated to be approximately 0.206 m/s, scoring the conditions under which sand movement occurs. Before installation, the sand flux was measured at 19.95 kg/m2/s, but this figure dropped dramatically to 5.175 kg/m2/s post-installation, reflecting a significant 74% reduction. In addition, the sand deposition behind the fences over a 500 m stretch reached approximately 7387.5 kg per second. These results collectively highlight the effectiveness of sand fences in minimizing sand accumulation, thereby enhancing the operational safety of the railway system.
3.1. Summary of the Key Results
Wind speed after fence installation is reduced by 40%. The threshold velocity for sand transport is approximately 0.206 m/s. Sand flux before fence installation is 19.95 kg/m2/s, and it reduces to 5.175 kg/m2/s after fence installation (a 74% reduction). Sand deposition behind the sand fence over a 500 m section is around 7387.5 kg/s. This demonstrates the significant role that sand fences play in reducing wind-driven sand transport, thus protecting the Etihad Railway from sand accumulation and maintaining operational safety. The design specifications for sand fences (both ventilated and non-ventilated) must account for factors that influence sand deposition morphology, including sand accumulation, wind conditions, surface types, and topography. Below are the specific considerations and guidelines for each type.
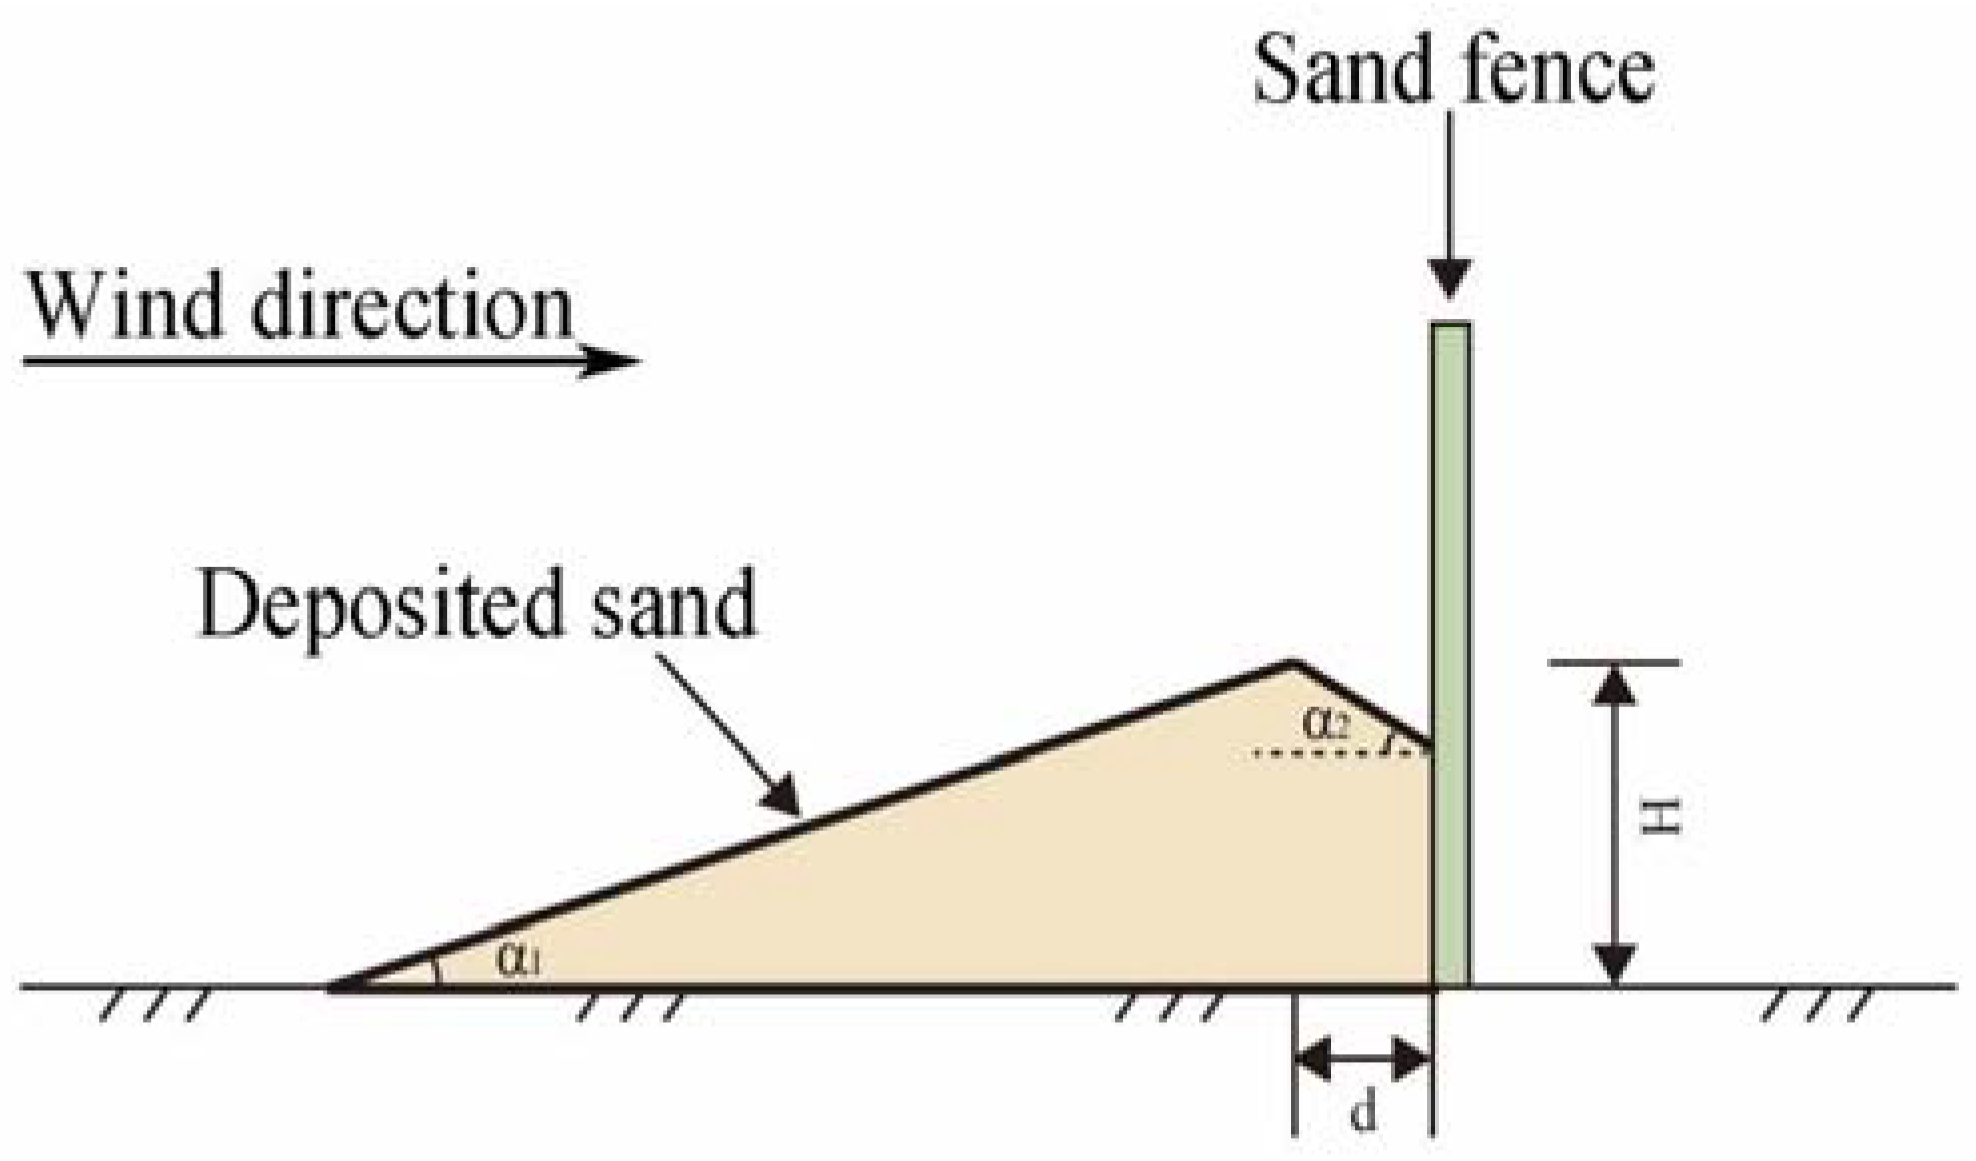
3.2. Ventilated Sand Fence Design
Ventilated sand fences allow sand to pass through and deposit on the downwind side, forming a triangular profile influenced by factors like fence porosity, wind conditions, surface type, and topography. Observations along the Tarim Desert Highway show that windward slopes are gentle (10–12°), leeward slopes are steep (up to the natural angle of repose), and ridge lines form 0.5–1.0 m downwind of the fence. In flat areas with strong winds and insufficient sand, erosion dominates, and sand deposition profiles differ slightly. Data from Inner Mongolia’s S315 Highway reveal shorter, steeper windward slopes (10–13°) and longer, gentler leeward slopes (7–10°), with similar ridge placement (
Figure 8).
Ventilated sand fence design data on sand deposition rates (measured in unspecified units) over a specific time frame in two different terrain types: mobile dunes and flat land between dunes, segmented by geographical orientation (north and south). The data highlight variations in sand accumulation across these terrains and directions. North-oriented mobile dunes experience higher sand deposition rates compared to the south, with a deposition value of 1.72 in the north versus 1.30 in the south. This indicates that wind patterns and dune mobility are more pronounced in the north-facing regions of mobile dunes. Flat land between dunes: similarly, in flat land between dunes, sand deposition is higher in the north, with a value of 0.59, compared to the south, which exhibits a lower rate of 0.51. The reduced values in flat lands compared to mobile dunes suggest that the flat terrain is less prone to sand transport and accumulation. Comparison of terrains: across both north and south orientations, mobile dunes consistently show higher deposition rates than flat lands, indicating greater susceptibility to wind-driven sand movement in mobile dune areas, as shown in
Figure 9 and
Figure 10.
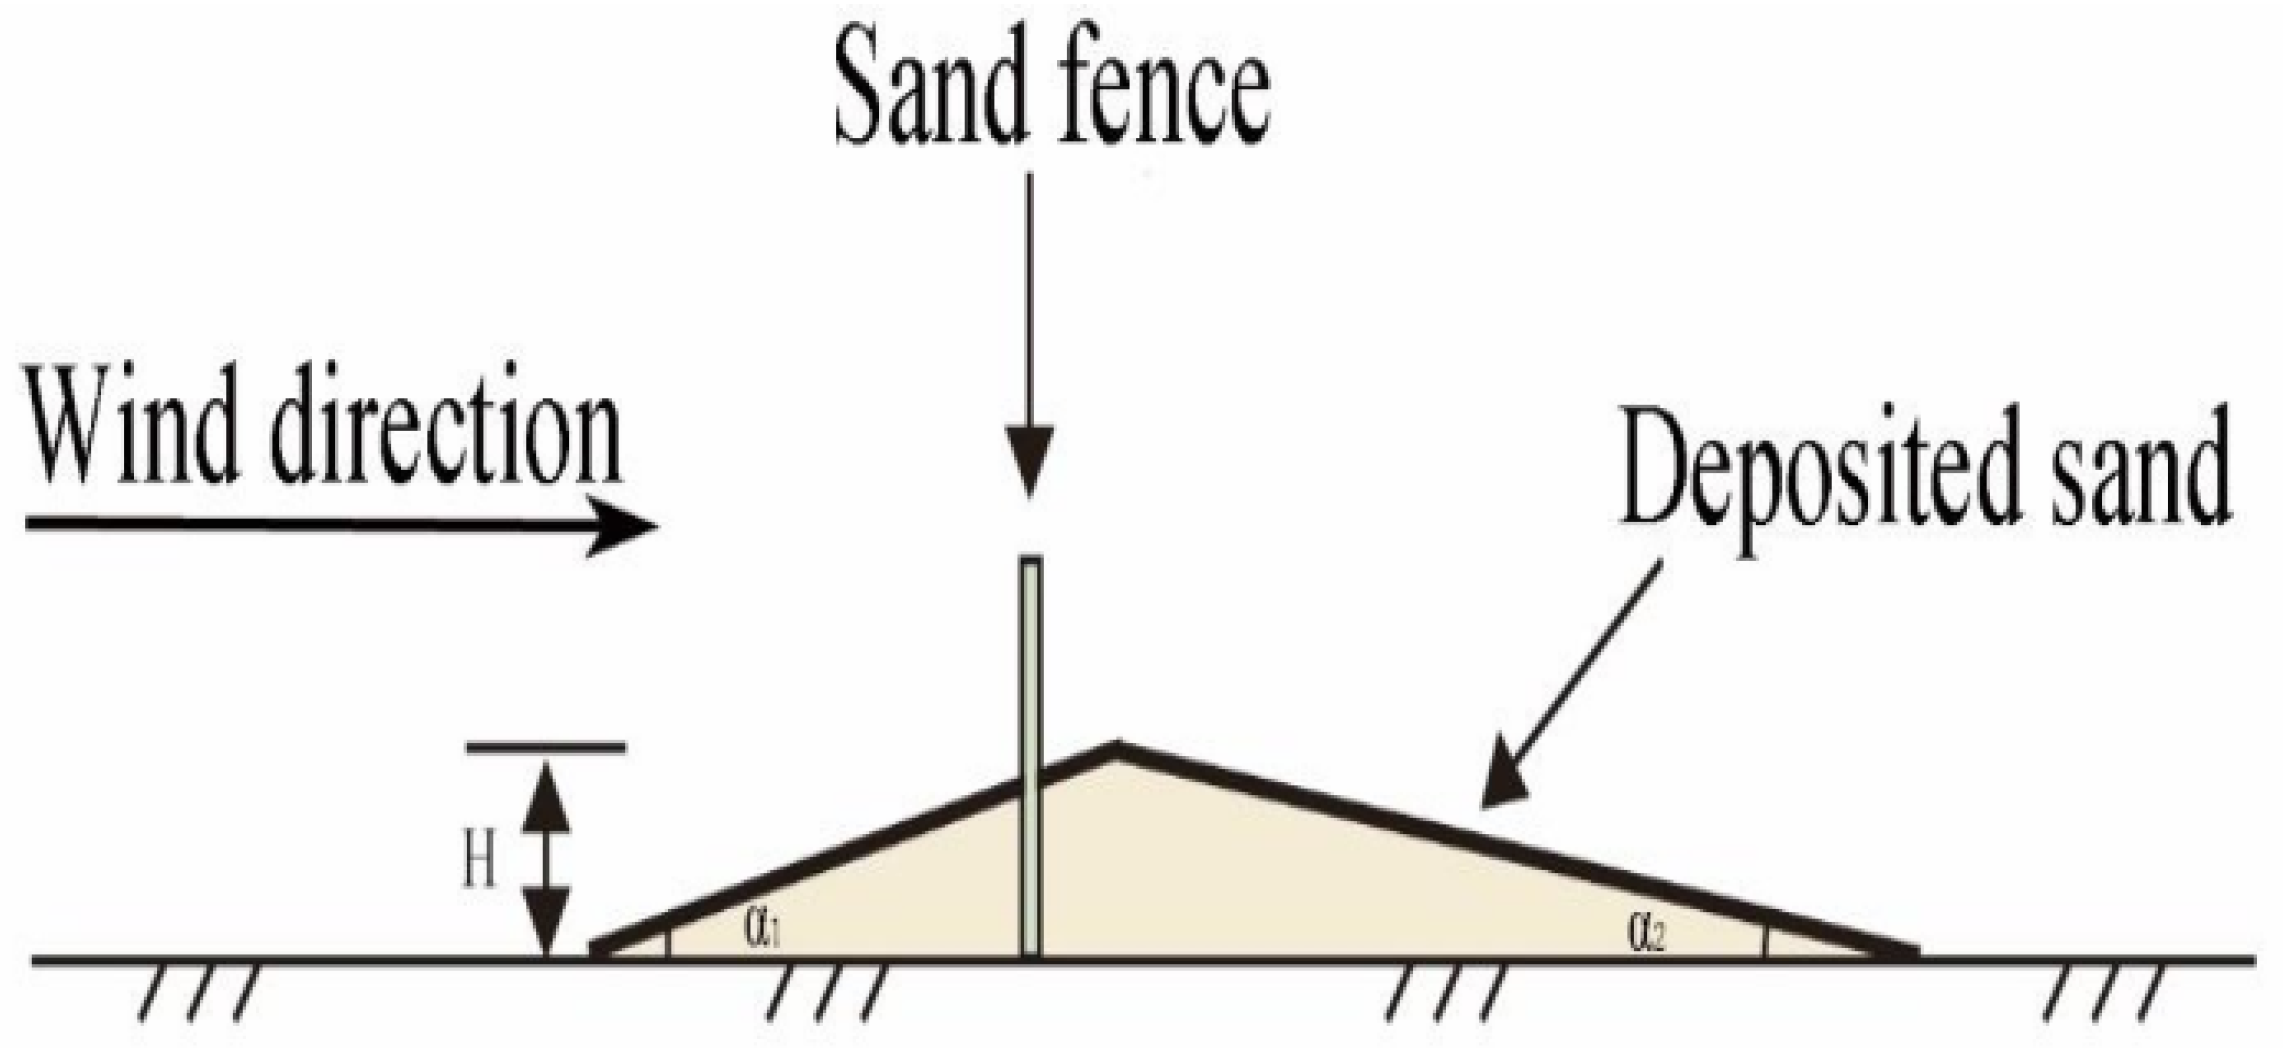
3.3. Non-Ventilated Sand Fence Design
When the sand fence is a non-ventilated sand fence (a sand fence without pores), the sand material cannot go through the fence and can only be deposited on the outside of the fence. The deposited sand body morphology is related to deposited sand amount, the wind condition, etc. According to the actual measurement of (Lanzhou-Xinjiang high speed railway in Xinjiang Yandun section, China) [
18], the deposited sand body profile is a partial of approximate triangle, as shown in
Figure 11. Its windward slope is gentle and 12–18°. The top of the slope has a reverse slope formed by reflective wind, and the reverse slope is steep, and can get to the natural angle of repose of the sand material. The ridge line formed by a deposited sand body is generally 1.0 m away windward side of the sand fence.
The formula for calculating H, the maximum deposited sand body height of the non-ventilated sand fence can be derived from Equation (6):
In Formula (6), H-maximum deposited sand body height (m/a);
Q—annual sand transport amount perpendicular to the sand fence (m
3/m/a);
—windward slope angle of deposited sand body (°);
—leeward slope angle of deposited sand body (°);
d—distance (m) between the ridge line formed by deposited sand and the sand fence. In the formula, the windward slope α
1 of deposited sand body varies with deposited sand amount, and its value has a great influence on the calculation of deposited sand amount, while the leeward slope
and the distance d value between the ridge line and the sand fence have a small influence on the calculation of deposited sand amount.
and d parameters were adopted by actually measured data of the largest deposited sand body in May 2016 (Lanzhou-Xinjiang high speed railway in Xinjiang Yandun section, China) [
17]. The value of
is 17°, and d is 1 m,
is 32° which is the natural angle of repose of sand material. The maximum height of the deposited sand body of the sand fence is shown in
Table 5.
3.4. Parameter Settings
The effectiveness of sand fences in reducing wind-driven sand transport along the Etihad Railway corridor was assessed using key aerodynamic and physical parameters, including initial and reduced wind speeds, fence porosity, air and sand particle densities, sand particle diameter, and gravitational acceleration. Empirical coefficients relevant to threshold velocity and sand flux were applied to compute the transport dynamics. The results show a significant decrease in sand flux from 19.95 kg/m
2/s before fence installation to 5.175 kg/m
2/s after, highlighting the fences’ efficiency in limiting sand movement. Additionally, the sand deposition rate (SDR) quantifies the extent of sand accumulation over the targeted area. These findings provide a robust basis for evaluating the performance of mitigation strategies in desert railway settings, as shown in
Table 6.
For mobile dunes, the deposited sand amount per unit width (Q) was higher in the north (7.92 m
3/m/a) than in the south (5.96 m
3/m/a), with corresponding maximum sand body heights (H) of 1.96 m and 1.68 m, respectively. On flat land between dunes, the deposited amounts were lower, with 1.72 m
3/m/a in the north and 1.30 m
3/m/a in the south, and the maximum sand body heights were 0.85 m and 0.73 m, respectively. These differences highlight the spatial variation in sand accumulation due to geographic and topographic influences, as shown in
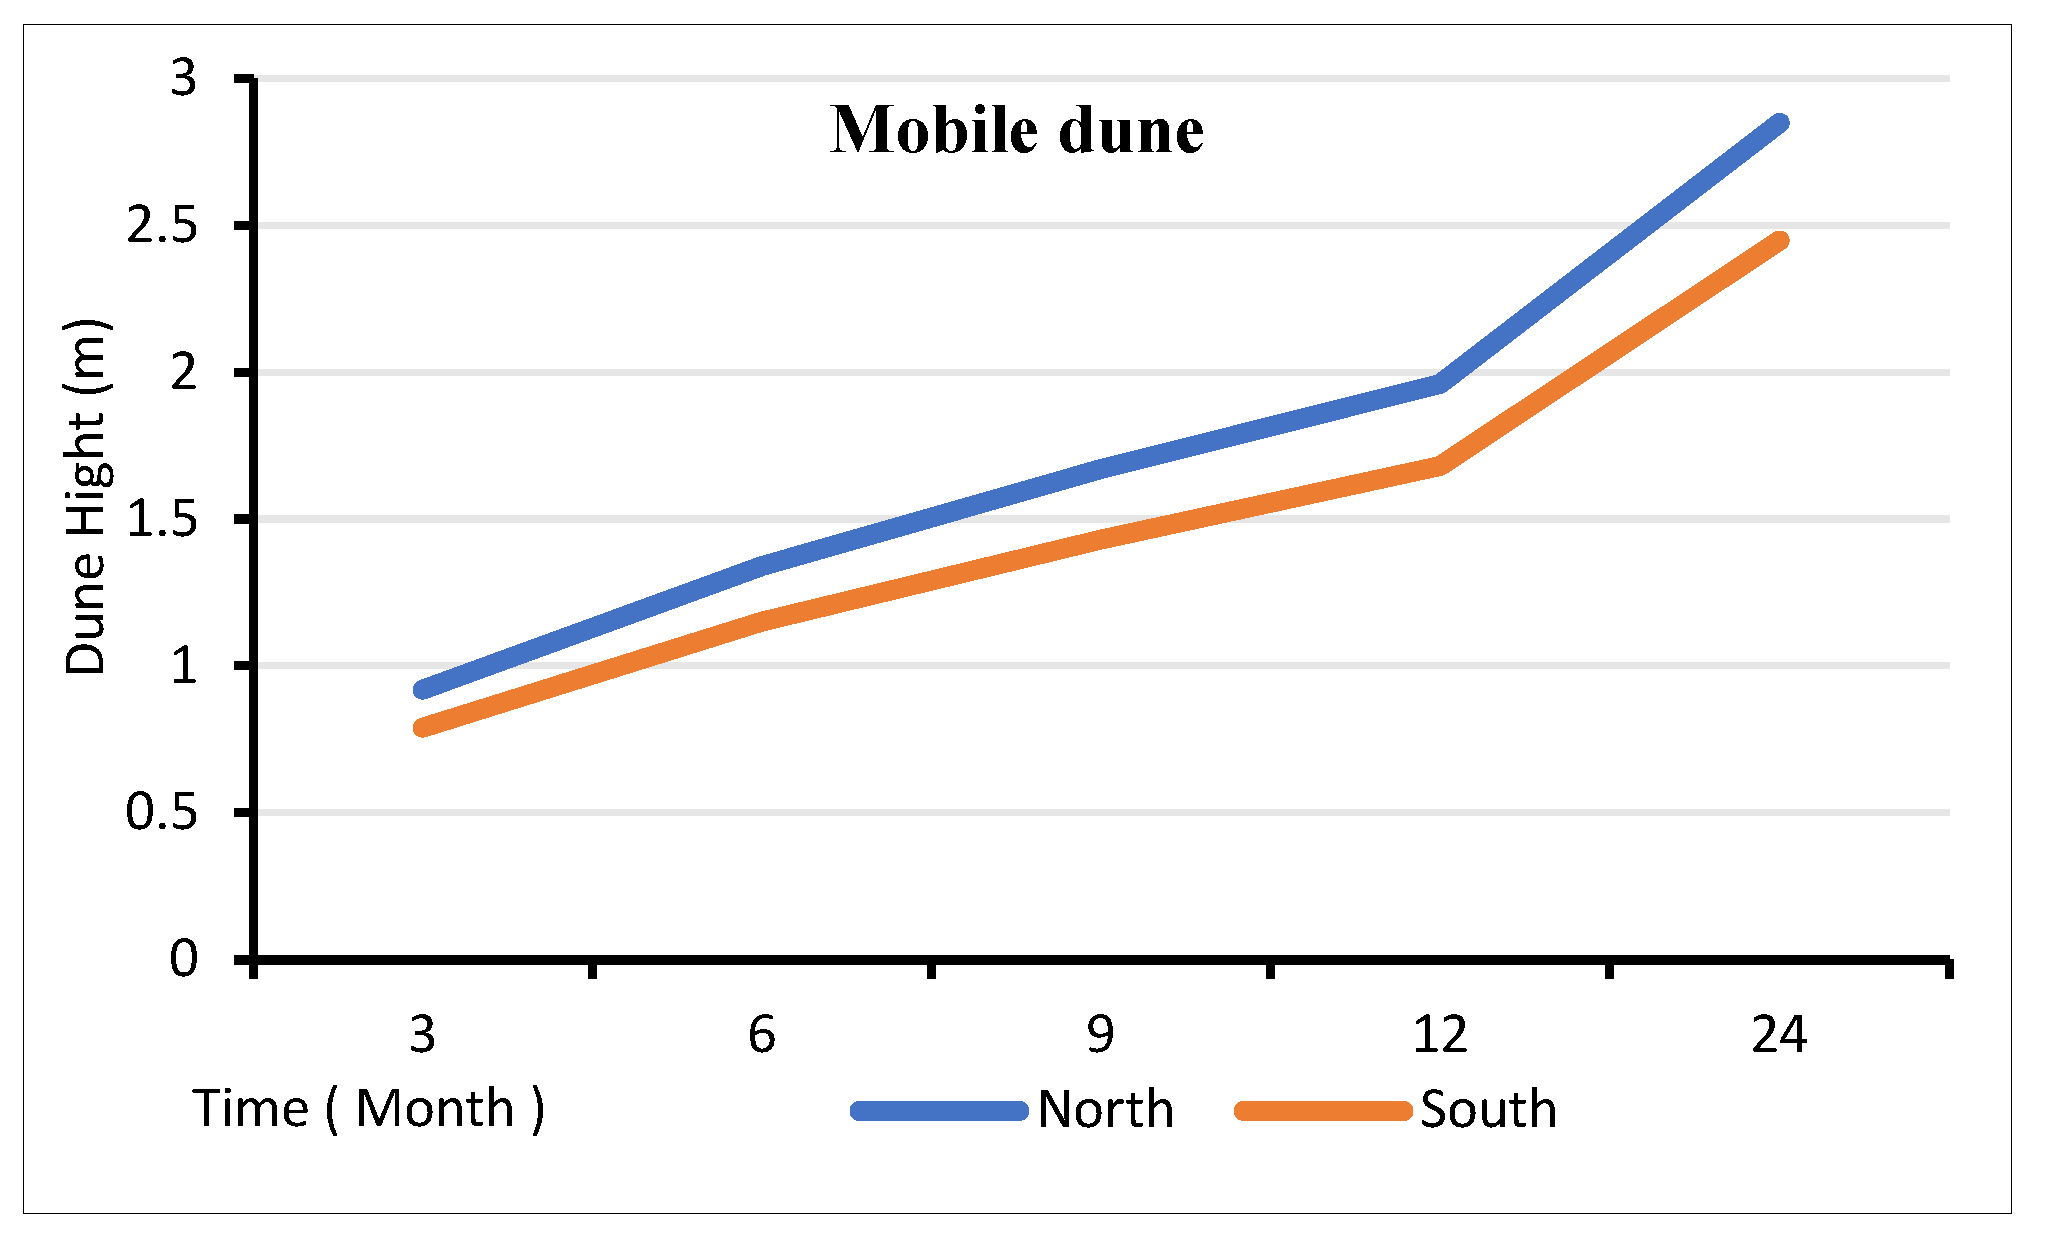
Table 7The data show that sand deposition is consistently higher in mobile dunes compared to flat land, with significant increases over time in both environments. For the mobile dunes, sand deposition on the north side increases steadily over time: starting at 0.92 m at 3 months, it rises to 1.34 m at 6 months, 1.67 m at 9 months, 1.96 m at 12 months, and finally reaches 2.85 m at 24 months. Similarly, on the south side of the mobile dunes, sand deposition begins at 0.79 m at 3 months, increasing to 1.15 m at 6 months, 1.43 m at 9 months, 1.68 m at 12 months, and 2.45 m at 24 months as shown in
Figure 12.
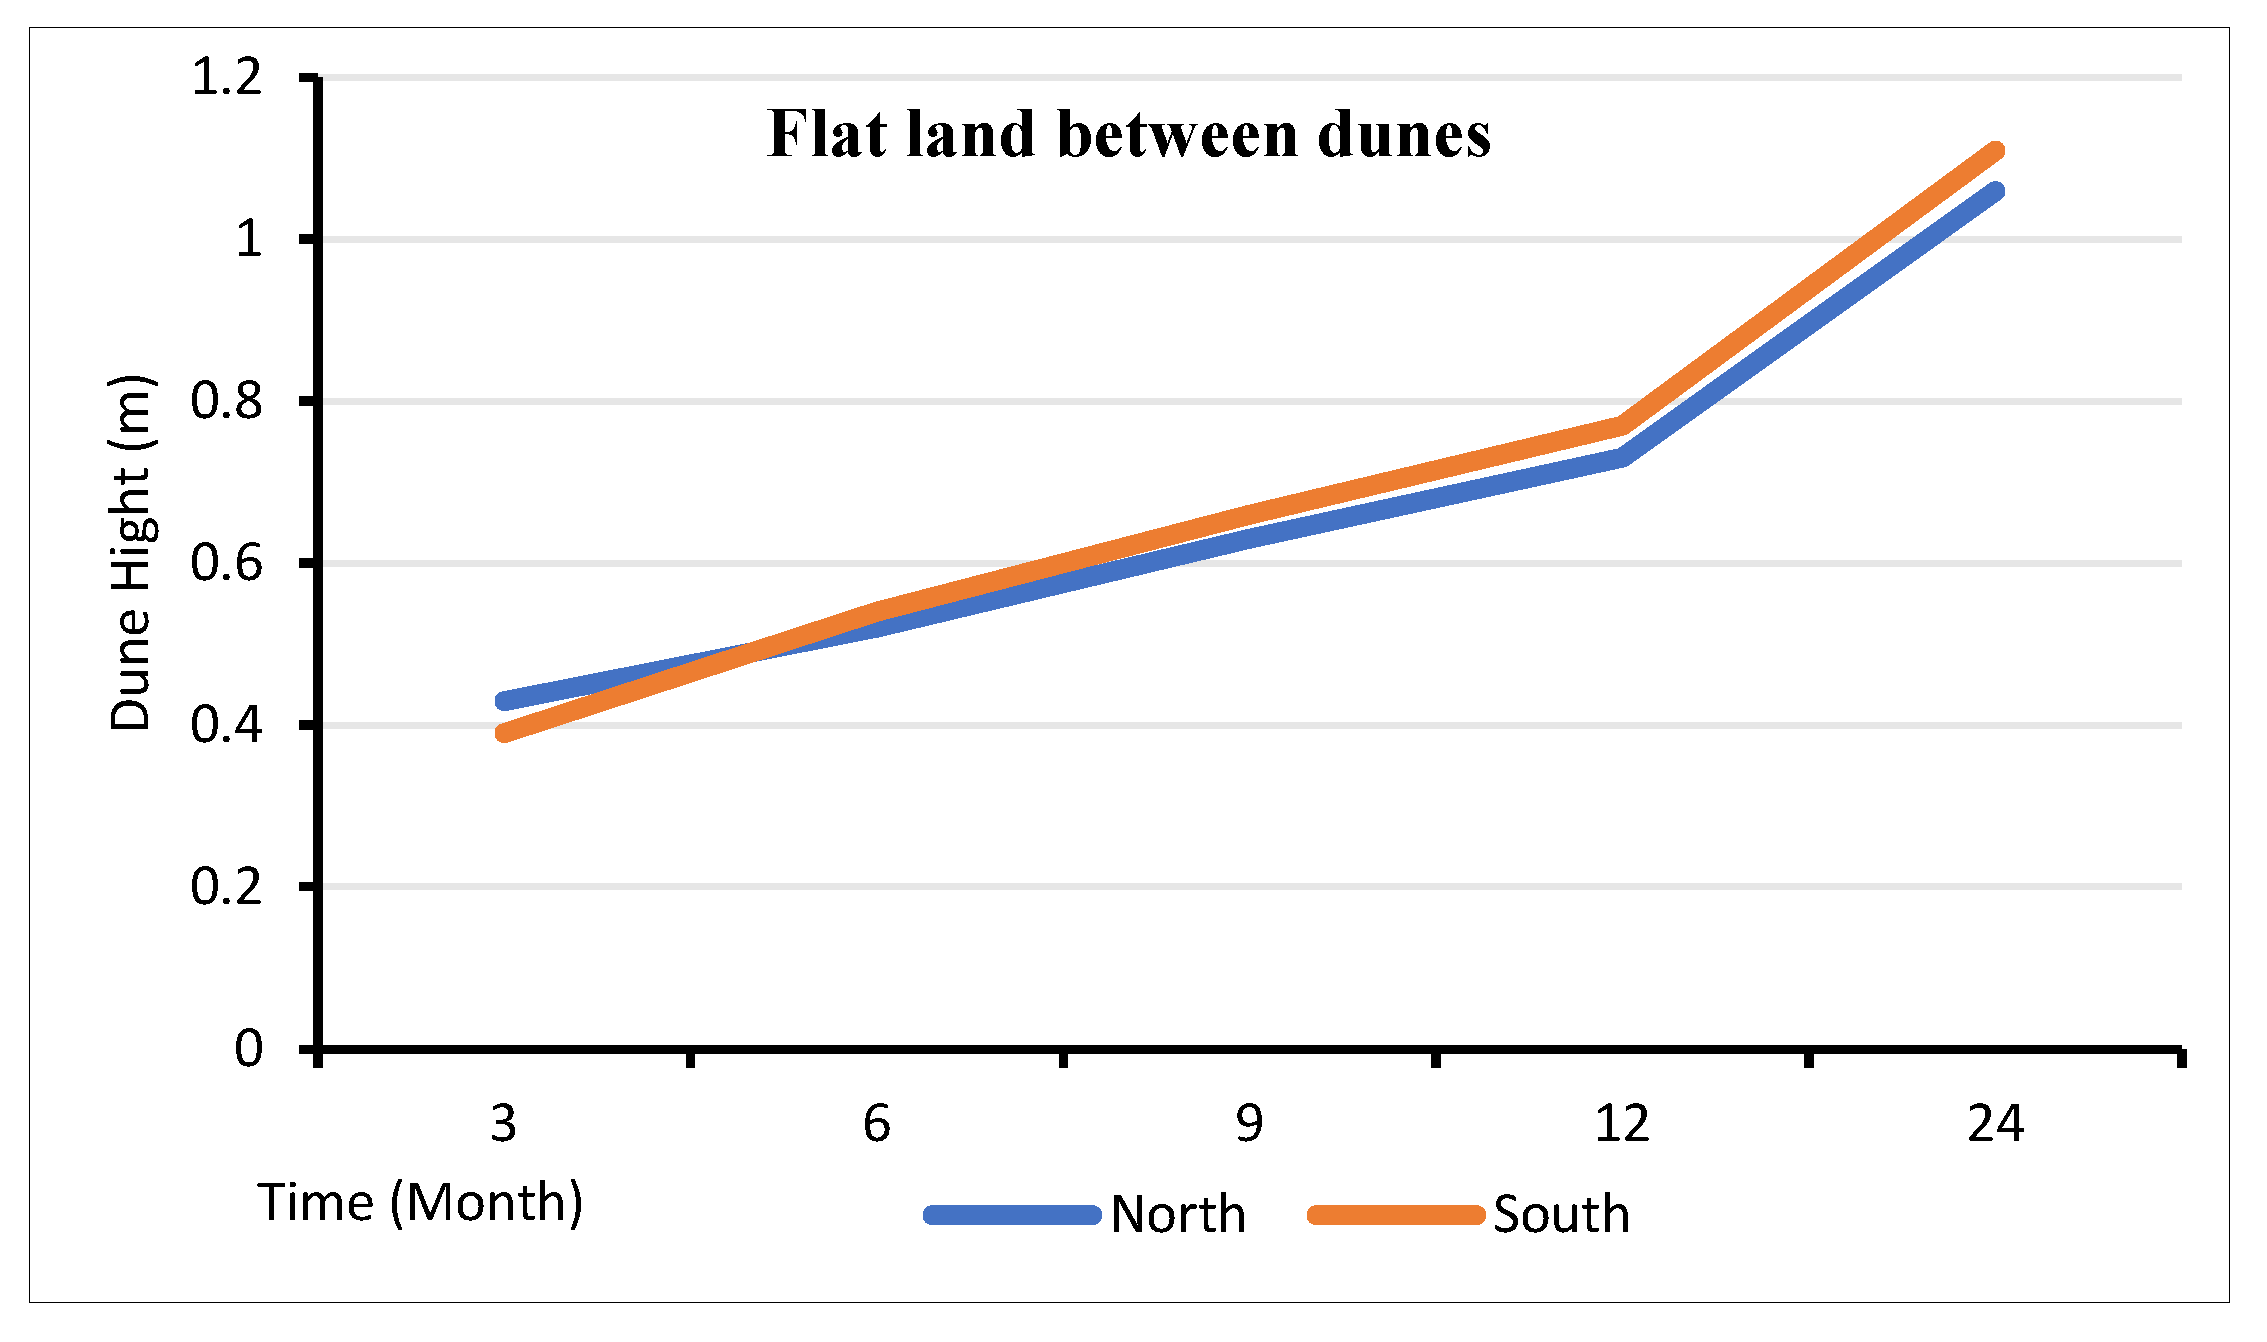
For the flat land between dunes, sand deposition is lower compared to the mobile dunes. On the north side, deposition starts at 0.43 m at 3 months, rising to 0.52 m at 6 months, 0.63 m at 9 months, 0.73 m at 12 months, and 1.06 m at 24 months. On the south side, deposition begins at 0.39 m at 3 months, increasing to 0.54 m at 6 months, 0.66 m at 9 months, 0.77 m at 12 months, and 1.11 m at 24 months, as shown in
Figure 13.
4. Conclusions
The study demonstrates the critical role of sand fences in mitigating sand transport and enhancing the operational safety of the Etihad Railway. By reducing wind speed and sand mobility, these structures contribute significantly to protecting railway infrastructure from disruptions caused by sand accumulation. Through the implementation of GIS techniques, the research identifies areas vulnerable to sand accumulation and validates the substantial benefits of sand fences.
Through revelations of the effectiveness of sand fences in altering wind flow dynamics and sand deposition behaviors. The installation of sand fences resulted in a remarkable reduction in wind speed by 40%, which decreases the energy available for sand transport. Before the installation, the sand flux was measured at 19.95 kg/m2/s, a figure that dropped to 5.175 kg/m2/s post-installation, showing an impressive 74% decrease. Recorded sand deposition behind the fences over a span of 500 m reached a notable 7387.5 kg per second.
The findings highlight the differences in deposition rates between mobile dunes and flat lands, providing insights for effective sand management strategies. The accumulation of sand behind the fence can stabilize the area immediately surrounding it, reducing the risk of sand drifting onto infrastructure and thereby contributing to operational safety. The findings show a remarkable 40% reduction in wind speed and a significant 74% decrease in sand flux post-installation, underscoring the effectiveness of these structures in disrupting sand mobility.
The study highlights how the design of ventilated and non-ventilated sand fences influences sand deposition behaviors, with implications for tailored design adaptations to various terrains. The findings also reveal marked differences in deposition rates between mobile dunes and flat lands, informing effective sand management strategies.
Building on the findings of this study, future work should explore the integration of advanced technologies to further optimize sand mitigation strategies. AI-powered techniques, such as quantum machine learning for video compression, can improve image analysis and environmental monitoring in dynamic conditions [
13,
19]. By leveraging AI and GIS-based methodologies, railway engineers can enhance risk identification, optimize sand fence placement, and refine long-term mitigation strategies. This data-driven and adaptive approach will contribute to more efficient and intelligent solutions for combating wind-driven sand accumulation along railway networks.
Author Contributions
Conceptualization, T.Q. and M.N.I.A.; methodology, M.N.I.A.; software, M.N.I.A. and T.Q. contributed to the conception and design of the study. M.N.I.A. conducted the primary data collection and initial analysis. T.Q. provided oversight, guidance, and reviewed all sections of the manuscript. M.R. contributed to the methodology development and performed advanced statistical analysis. P.H. assisted with data validation and contributed to the drafting and editing of the manuscript. T.Q. acted as the corresponding author and managed all correspondence with the journal and co-authors. All authors have read and agreed to the published version of the manuscript.
Funding
This research was funded by the National Natural Science Foundation of China, Project Number: 52478430.
Institutional Review Board Statement
Not applicable.
Informed Consent Statement
Not applicable.
Data Availability Statement
Some or all data, models, or code that support the findings of this study are available from the corresponding author upon reasonable request.
Conflicts of Interest
The authors declare no competing interests.
References
- Bruno, L.; Horvat, M.; Raffaele, L. Windblown sand along railway infrastructures: A review of challenges and mitigation measures. J. Wind. Eng. Ind. Aerodyn. 2018, 177, 340–365. [Google Scholar] [CrossRef]
- Almujibah, H.; Elamary, A.; Alwetaishi, M. Seeking Ways for Dealing with the Impacts of Sandstorms on the Railway Network in Saudi Arabia. Sustainability 2022, 14, 9436. [Google Scholar] [CrossRef]
- Etihad Rail. Etihad Rail: Connecting the UAE Through Sustainable Transport. Available online: https://www.etihadrail.ae (accessed on 13 January 2025).
- Saipem. The Construction of Etihad Rail in the UAE. Available online: https://www.saipem.com/en/saipem-worldwide-projects/etihad-railway-line (accessed on 13 January 2025).
- Xu, J.; Huang, N.; Zhang, J.; Zhang, X.; Li, X. Influence of terrain on windblown sand flow field characteristics around railway culverts. Sustainability 2024, 16, 8128. [Google Scholar] [CrossRef]
- Oday, O.; Majeed, H.L.; Hussein, M.A.; Darwish, S.M.; Al Al-Boridi, O.; Hassen, O.A. Quantum Machine Learning for Video Compression: An Optimal Video Frames Compression Model using Qutrits Quantum Genetic Algorithm for Video multicast over the Internet. J. Cybersecur. Inf. Manag. (JCIM) 2025, 15, 43–64. [Google Scholar] [CrossRef]
- Kh-Madhloom, J.; Diwan, S.A.; Zainab, A.A. Smile Detection using Convolutional Neural Network and Fuzzy Logic. J. Inf. Sci. Eng. 2020, 36, 269–278. [Google Scholar]
- Dong, H.; Zhang, J.; Luo, W. Numerical simulation and field study on predicting wind-blown sand accumulation along railway infrastructures. Front. Earth Sci. 2024, 12, 1443030. [Google Scholar] [CrossRef]
- Raffaele, L. Probabilistic Assessment of Windblown Sand Accumulation Around Railways. Politecnico di Torino. 2018. Available online: https://iris.polito.it/bitstream/11583/2709752/2/Raffaele_INVENTO2018_rev.pdf (accessed on 13 January 2025).
- Zhang, Y.; Wang, Z.; Li, X. Comparative evaluation of concrete sand-control fences used for mitigating windblown sand along railway lines. Urban Rail Transit. 2020, 6, 161–173. [Google Scholar] [CrossRef]
- Al Suwaidi, E.T. Granulated Sulphur; Design & Operation Optimizations. In Proceedings of the Abu Dhabi International Petroleum Exhibition & Conference, Abu Dhabi, United Arab Emirates, 15–18 November 2017. Paper No. SPE-188317-MS. [Google Scholar] [CrossRef]
- Alhammadi, M.S.; Anantrasirichai, N. Unveiling soil coherence patterns along Etihad Rail using Sentinel-1 and Sentinel-2 data and machine learning in arid region. Remote Sens. Appl. Soc. Environ. 2024, 36, 101374. [Google Scholar] [CrossRef]
- Wang, T.; Qu, J.; Niu, Q.; An, Z.; Gao, Y.; Wang, H.; Niu, B. Aerodynamic properties and shelter effects of a concrete plate-insert sand fence along the Lanzhou-Xinjiang high-speed railway in Gobi regions under strong winds. Front. Environ. Sci. 2022, 10, 861063. [Google Scholar] [CrossRef]
- Lima, I.A.; Parteli, E.J.R.; Shao, Y.; Andrade, J.S., Jr.; Herrmann, H.J.; Araújo, A.D. CFD simulation of the wind field over a terrain with sand fences: Critical spacing for the protected soil area. Sci. Rep. 2018, 8, 13435. [Google Scholar]
- Liu, J.; Wu, J.; Kimura, R. Evaluating the sand-trapping efficiency of sand fences using a combination of wind-blown sand measurements and UAV photogrammetry at Tottori Sand Dunes, Japan. Remote Sens. 2023, 15, 1098. [Google Scholar] [CrossRef]
- Dong, Z.; Luo, W.; Wang, H. Wind-sand flow structure behind three artificial sand fences. J. Arid. Environ. 2007, 70, 80–96. [Google Scholar] [CrossRef]
- Bagnold, R.A. The Physics of Blown Sand and Desert Dunes; Courier Corporation: Methuen, MA, USA, 1941. [Google Scholar]
- Lima, F.; Andrade, S.; Silva, F. Effects of sand fences on wind flow and sediment transport. J. Environ. Manag. 2017, 204, 344–352. [Google Scholar] [CrossRef]
- Fitzgerald, D.M.; Sutherland, M.A. Sand fence effects on wind erosion and sand deposition in coastal environments. Geomorphology 2016, 266, 171–182. [Google Scholar]
Figure 1.
The map is derived from ArcGIS with Google Maps; the ArcGIS Map shows the Etihad Railway Line throughout the UAE.
Figure 1.
The map is derived from ArcGIS with Google Maps; the ArcGIS Map shows the Etihad Railway Line throughout the UAE.
Figure 2.
Conceptual framework for classifying Sand Management Measures (SMMs) based on the Source–Path–Receiver categories.
Figure 2.
Conceptual framework for classifying Sand Management Measures (SMMs) based on the Source–Path–Receiver categories.
Figure 3.
Diagram shows the proposed design of the sand fence: (a) non-ventilated sand fence, and (b) ventilated sand fence.
Figure 3.
Diagram shows the proposed design of the sand fence: (a) non-ventilated sand fence, and (b) ventilated sand fence.
Figure 4.
Diagram illustrating the wind direction with sand fence direction from the collection box, which is the railway track location.
Figure 4.
Diagram illustrating the wind direction with sand fence direction from the collection box, which is the railway track location.
Figure 5.
Soil deposition map.
Figure 5.
Soil deposition map.
Figure 6.
Pre−fence sand accumulation map.
Figure 6.
Pre−fence sand accumulation map.
Figure 7.
Post−fence sand accumulation map.
Figure 7.
Post−fence sand accumulation map.
Figure 8.
Morphological of deposited sand body of the fence in flat land dunes.
Figure 8.
Morphological of deposited sand body of the fence in flat land dunes.
Figure 9.
The flowchart chart shows the mobile dune level for the ventilated sand fence.
Figure 9.
The flowchart chart shows the mobile dune level for the ventilated sand fence.
Figure 10.
The flowchart chart shows the flat land dune level for the ventilated sand fence.
Figure 10.
The flowchart chart shows the flat land dune level for the ventilated sand fence.
Figure 11.
Morphological of deposited sand body of the non-ventilated sand fence.
Figure 11.
Morphological of deposited sand body of the non-ventilated sand fence.
Figure 12.
The flowchart chart shows the deposited sand height (m).
Figure 12.
The flowchart chart shows the deposited sand height (m).
Figure 13.
The flowchart chart shows the deposited sand of the non-ventilated sand fence maximum with the time height (m) of the non-ventilated sand fence maximum with time.
Figure 13.
The flowchart chart shows the deposited sand of the non-ventilated sand fence maximum with the time height (m) of the non-ventilated sand fence maximum with time.
Table 1.
Wind data.
| Location | Average Wind Speed (m/s) | Dominant Wind Direction | Data Source |
|---|
| Abu Dhabi | 7.5 | NW | UAE National Center of Meteorology |
| Al Ain | 6.8 | N | UAE National Center of Meteorology |
| Liwa Oasis | 8.2 | SW | Global Wind Atlas |
| Dubai | 5.6 | E | UAE National Center of Meteorology |
Table 2.
Pre-fence flow accumulation data.
Table 2.
Pre-fence flow accumulation data.
| Location | Flow Accumulation (Cells) | Risk Level (Low/Medium/High) |
|---|
| Abu Dhabi | 1500 | High |
| Al Ain | 1000 | Medium |
| Liwa Oasis | 2000 | Hig |
| Dubai | 500 | Low |
Table 3.
Flow accumulation pre-fence.
Table 3.
Flow accumulation pre-fence.
| Location | Flow Accumulation (Cells) | Risk Level (Low/Medium/High) |
|---|
| Abu Dhabi | 800 | Medium |
| Al Ain | 600 | Low |
| Liwa Oasis | 1200 | Medium |
| Dubai | 200 | Low |
Table 4.
Annual deposition rate.
Table 4.
Annual deposition rate.
| Location | Annual Sand Deposition Rate (kg/m2) | Observational Method | Data Source |
|---|
| Abu Dhabi | 20 | Field Surveys | Local Geological Survey |
| Al Ain | 15 | Remote Sensing | Geological Studies |
| Liwa Oasis | 30 | Sed iment Sampling | UAE Geological Institute |
| Dubai | 10 | Ground Penetrating Radar | UAE National Center of Meteorology |
Table 5.
Sand transport and deposition analysis results.
Table 5.
Sand transport and deposition analysis results.
| Calculation | Formula | Result | Unit |
|---|
| Wind Speed Reduction | | 6 | m/s |
| Threshold Velocity for Sand Transport | | 0.206 | m/s |
| Sand Flux Before Fence Installation | | 19.95 | kg/m2/s |
| Post-Fence Sand Flux | | 5.175 | kg/m2/s |
| Sand Deposition Rate (SDR) | | 7387.5 | kg/s (per 500 m) |
Table 6.
Parameters and results for sand transport reduction.
Table 6.
Parameters and results for sand transport reduction.
| Parameter | Symbol | Value | Unit |
|---|
| Initial Wind Speed | | 10 | m/s |
| Reduced Wind Speed | V | 6 | m/s |
| Fence Porosity. | P | 0.4 | |
| Air Density | ρ | 1.225 | kg/m3 |
| Sand Particle Density | ρs | 2650 | kg/m3 |
| Gravity | | 9.81 | m/s2 |
| Sand Particle Diameter | d | 0.0002 | m |
| ESmpirical Coefficient (Threshold Velocity) | A | 0.1 | |
| Empirical Coefficient (Sand Flux) | C | 2.5 | |
| Threshold Velocity for Sand Transport | | 0.206 | m/s |
| Sand Flux Before Fence | | 19.95 | kg/m2/s |
| Sand Flux After Fence | | 5.175 | kg/m2/s |
| Sand Deposition Rate | SDR | 7387.5 | kg/s (per 500 m) |
Table 7.
Calculation results of the maximum height of deposited sand in non-ventilated sand fence.
Table 7.
Calculation results of the maximum height of deposited sand in non-ventilated sand fence.
| Sand Fence Location | Mobile dune | Flat land between dunes |
|---|
Deposited Sand
Amount of Unit
Width (Q)
(m3/m/a) | Maximum
Deposited Sand Body Height (H)
(m/a) | Deposited Sand Amount of Unit Width (Q)
(m3/m/a) | Maximum
Deposited Sand
Body Height (H) (m/a) |
|---|
| North | 7.92 | 1.96 | 1.72 | 0.85 |
| South | 5.96 | 1.68 | 1.30 | 0.73 |
| Disclaimer/Publisher’s Note: The statements, opinions and data contained in all publications are solely those of the individual author(s) and contributor(s) and not of MDPI and/or the editor(s). MDPI and/or the editor(s) disclaim responsibility for any injury to people or property resulting from any ideas, methods, instructions or products referred to in the content. |
© 2025 by the authors. Licensee MDPI, Basel, Switzerland. This article is an open access article distributed under the terms and conditions of the Creative Commons Attribution (CC BY) license (https://creativecommons.org/licenses/by/4.0/).


