Article

Sustainable Urban Landscape Quality: A User-Perception Framework for Public Space Assessment and Development

School of Civil Architecture and Environment, Hubei University of Technology, Wuhan 430068, China
*
Authors to whom correspondence should be addressed.
Sustainability 2025, 17(9), 3992; https://doi.org/10.3390/su17093992
Submission received: 27 February 2025 / Revised: 20 April 2025 / Accepted: 22 April 2025 / Published: 29 April 2025

Abstract

With rapid urbanization, enhancing the quality of public spaces is critical to residents’ well-being and sustainable urban development. However, user perceptions of these spaces remain insufficiently quantified. This study introduces a perception-based evaluation framework encompassing four dimensions: service, spatial, cultural, and aesthetic. A three-dimensional importance-performance analysis (3-D IPA) model is applied to assess two multifunctional public spaces in Wuhan—the Citizens’ Home (CH) and the Creative World Industrial Park (CWIP)—with the aim of identifying user-prioritized attributes that inform sustainable design interventions. The findings reveal the following: (1) At CH, spatial perception (importance = 3.93; performance = 4.02) received the highest ratings, particularly for openness and ecological pavement, highlighting areas for green infrastructure improvement. (2) At CWIP, cultural perception (importance = 3.75; performance = 3.73) dominated, with a need to enhance the signage systems and cultural integration for greater place identity. (3) Optimization priorities included energy-efficient lighting, entrance enhancements, and recreational layout improvements at CH, and thematic diversity and wayfinding systems at CWIP. (4) The 3-D IPA framework effectively identifies user-perceived priorities and supports experience-driven, resource-conscious spatial improvements. This study provides a user-centered, data-informed approach for evaluating and optimizing urban public spaces, offering practical strategies to align spatial quality with long-term sustainability goals.

1. Introduction

In the context of rapid urbanization, optimizing the landscape environment of urban public spaces has become crucial for improving the quality of life for urban residents. Landscape environments not only facilitate daily activities and promote physical and mental well-being but also contribute to the ecological and aesthetic value of cities [1]. However, in many cases, the landscape design of urban public spaces still fails to adequately address users’ diverse and evolving needs. Therefore, there is a growing recognition that a user-centered, bottom-up strategy is more effective than traditional top-down strategies in responding to these expectations [2,3]. In this context, understanding how users perceive public space environments—including their comfort, safety, attractiveness, and functionality—has become a critical foundation for scientific evaluation and design optimization.

1.1. Construction of Perception Evaluation System for Public Spaces

With the accelerating pace of urbanization, the landscape environment of public spaces has become increasingly crucial in enhancing the livability and sustainability of cities. In recent years, scholars have explored various dimensions of how to effectively assess the landscape quality of urban public spaces through user perception. Perceptual characteristics such as environmental comfort, restorative potential, safety, quietness, spatial openness, and opportunities for social interaction have been widely acknowledged as essential components that influence public experience and health outcomes [4,5]. The research has indicated that evaluation systems often encompass multiple dimensions, including ecology, health, quality of life, economy, aesthetics, and socio-culture aspects. These frameworks propose evaluation criteria that integrate biodiversity, historical and cultural value, and a sense of security to assess the quality of public green spaces [6,7]. Others have emphasized the psychological needs of users, such as naturalness, relaxation, and sociability [8]. Across these various approaches, there is a general consensus on the central role of user perception in the evaluation framework, especially in diverse and functionally complex urban public spaces.
Similarly, domestic studies have reflected this global trend. The recent research in China has not only considered the physical attributes of space but also incorporated user experience and cultural identity as essential perceptual factors. For instance, studies on urban parks and green spaces have proposed multidimensional frameworks that emphasize users’ perceptual experiences and behavioral responses, contributing to a better understanding of how landscape environments support physical and mental well-being [9,10]. Moreover, elements such as safety, microclimate regulation, and recreational function have emerged as critical indicators in landscape quality assessment [11,12]. These studies provide a valuable theoretical foundation for developing evaluation systems that are more responsive to the actual needs of urban public space users.
Despite the growing number of studies focusing on user perception in public spaces, much of the existing research has concentrated on green parks [13,14,15], linear pedestrian spaces [16,17], or commercial streets [18,19], often in isolation. These studies have yielded important insights into individual perceptual dimensions; they lack a comprehensive evaluation framework capable of addressing more complex spatial typologies—particularly outdoor public spaces adjacent to buildings, which often serve overlapping ecological, social, and recreational functions in high-density urban environments. Moreover, few studies have attempted to bridge the gap between perceptual theory and operational evaluation tools that are suitable for such multifunctional spaces.
To address this gap, it is essential to adopt a perceptual evaluation framework that is both multidimensional and adaptable to spatial complexity. While traditional evaluation tools, such as the IPA and KANO models, have proven effective in service and marketing contexts, their application in urban environmental assessment remains limited and predominantly two-dimensional. Consequently, our study aims to explore the potential of integrating an upgraded, 3-D IPA model to capture a more nuanced relationship between user perception and landscape quality in building-dominated public spaces.

1.2. Upgrading of Landscape Evaluation Models: 2-Dimensional IPA; 3-Dimensional IPA

Two-dimensional evaluation models, such as the IPA model [20,21] and the KANO model [22,23], are commonly used in the field of urban environmental evaluation. These models help urban planners and researchers gain a comprehensive understanding of user needs and satisfaction, providing a scientific foundation for improving urban environments.
The IPA model (see Figure 1a), which stands for importance-performance analysis, is widely utilized in marketing as a tool to assess customer satisfaction with services and prioritize service elements [24]. Its most intuitive representation is the Performance Analysis grid, which consists of four quadrants on two axes, as shown in Figure 1a. The vertical axis represents importance, while the horizontal axis represents performance. Each attribute’s importance and performance ratings are plotted as coordinates, with the average scores of both aspects serving as the origin. Elements are then marked on the coordinate axis to determine which areas require priority promotion.
The KANO model (see Figure 1b), also known as the three-factor theory, was proposed by Japanese scholar Noriaki Kano in 1984. This model, grounded in analyzing the contribution of user demand to satisfaction, classifies user needs into three categories: performance-based demands, basic demands, and attractive (B-type) demands [25], as illustrated in Figure 1b. Performance-based demand factors are those for which improvements in service quality lead to a significant increase in user satisfaction, while a decline in service quality leads to a notable decrease in satisfaction. Basic demand elements, on the other hand, do not significantly alter user satisfaction when optimized; however, their deterioration can greatly reduce satisfaction. Charismatic demand elements represent needs that users do not typically consider in their daily experiences. While a reduction in service quality for these factors does not noticeably affect user satisfaction, their optimization can lead to a significant boost in satisfaction.
Despite the importance of the IPA and KANO models in environmental contexts, their limitations have gradually become evident, particularly when addressing complex, multidimensional environmental issues, The 2-D models appear to be insufficient to comprehensively capture the complex relationship between user needs and environmental quality. As a result, scholars have increasingly turned to more sophisticated 3-D models to overcome the limitations inherent in the 2-D model. Lai and Hitchcock [26] developed a three-dimensional model (3-D IPA model) to enhance the accuracy and depth of service quality evaluation by extending the traditional 2-D importance and performance analysis into a three-dimensional space. A service quality study of a luxury hotel in Macau applied the model and provided guidance for specific service optimization measures. In addition, Chia combined the 3-D IPA model with the KANO model to conduct a three-dimensional spatial analysis of YouBike service attributes and proposed optimization strategies to better meet user needs [27]. Although the 3-D IPA model has been widely used in product and service evaluations, its application in urban environmental assessment remains relatively underexplored, especially in the comprehensive evaluation of multidimensional environmental factors, which is still in its early stages.
The introduction of 3-D models into the study of urban landscape environments offers several advantages. Not only does it allow for a more comprehensive capture of the diversity of user perceptions, but it also improves the precision and applicability of evaluations. By incorporating multidimensional perceptual factors such as physiological perception, psychological needs, and cultural identity, 3-D models can significantly enhance the design and optimization of urban landscapes.

1.3. Purpose of the Study

The primary objective of this study is to uncover the dynamic relationship between user needs and environmental factors across different types of public spaces. To achieve this, this study integrates a constructed perception evaluation index system with the 3-D IPA landscape environment quality measurement model, allowing for a comprehensive assessment of the landscape environment in outdoor public spaces within both centralized and decentralized buildings. Based on the assessment results, this study proposes specific 3-D IPA action strategies and optimization recommendations, the research framework see Figure 2.
In addition, this study highlights the central role of user perception in the design of public spaces, arguing that evaluation methods based on user participation can more accurately capture actual needs. This, in turn, provides a more targeted foundation for decision-making in the design and renovation of these spaces. Through this work, this study aims to offer new theoretical perspectives and methods for the landscape optimization of outdoor public spaces in buildings, while also promoting the advancement and application of landscape environmental quality evaluation systems.

2. Materials and Methods

2.1. Study Area

This study selects the Wuhan Citizens’ Home and the Creative World Industrial Park as representative examples for research on outdoor public spaces in Wuhan. These two cases exemplify two distinct types of urban architectural outdoor public spaces: one is a government-oriented, service-driven outdoor space, while the other is a creative industry-focused outdoor space characterized by cultural creativity and multifunctionality (see Figure 3 and Figure 4 and Table 1).
As a large-scale government service complex, the former serves as a key location for citizens to handle various government affairs. Its outdoor space must accommodate multiple needs, including efficient traffic flow, spatial organization, and areas for citizens to rest, wait, and communicate, while reflecting both human-centric design and public accessibility. In contrast, the Creative World Industrial Park integrates functions such as commerce, culture, and office spaces, serving as an important platform for daily activities and social interactions. Its outdoor space is marked by strong openness, communicative interaction, and a cultural atmosphere.
These two spaces differ significantly in terms of geographical location, target populations, spatial organization, and social functions, making them highly representative and complementary. A comparative study of these two spaces will facilitate a comprehensive understanding of the similarities and differences in landscape quality perception and space optimization across different types of urban outdoor public spaces, providing valuable insights for future design and planning practices.

2.2. Environmental Perception Factor Screening and Questionnaire Design

2.2.1. Environmental Perception Factor Screening

This study adopts a comprehensive approach, combining field observations, a literature review, expert interviews, and surveys to preliminarily select the indicators for evaluating the perception of the landscape environment in urban public building outdoor spaces [28,29].
To further optimize and establish the indicator system, expert judgments based on their practical experience were utilized to score the preliminary evaluation indicators, assessing their impact on landscape perception. A questionnaire (Table A1) was distributed to 30 individuals, including professors, senior engineers, and graduate students from the fields of architecture and landscape architecture at the Hubei University of Technology.
In the questionnaire design (Appendix B), five impact levels were defined for each evaluation indicator, ranging from 5 to 1 point, representing the degree from “Great Impact” to “Minor Impact”. The arithmetic mean of the scores provided by all experts for a specific indicator was used to represent its impact on the evaluation of the urban public-building outdoor-space landscape environment. The specific calculation methods are outlined in Formulas (1) and (2).
In Formula (1), S j represents the impact of the j-th indicator on the evaluation of the landscape environment of urban public buildings, X i j is the score given by the i-th expert for the j-th indicator, and n is the number of experts providing scores. Formula (1) is expressed as follows:
S j = i = 1 n X i j n
In Formula (2), variance is used to measure the dispersion of expert ratings, reflecting whether there are significant differences in expert opinions. The specific calculation formula is as follows:
R i = i = 1 n X i j S i j 2 n
where R j represents the variance in the ratings for the j-th indicator, indicating the consistency or dispersion of the expert scores.
As shown in Table A2, some indicators exhibit considerable variation in expert ratings. To ensure the uniformity of expert opinions, this study selected indicators with variance values of less than 1, ensuring greater consistency in expert opinions and enhancing the scientific basis of the selected indicators. Additionally, based on the impact value of each indicator, those with an impact value greater than 2 were selected as the main indicators for evaluating the perception of urban public-building outdoor-space landscape environments.
In conclusion, through these two screening methods, the evaluation indicator system for the urban public-building outdoor-space landscape environment was optimized. This process allowed for the selection of representative indicators and the construction of a scientifically ordered and non-redundant indicator system. Furthermore, semantically repetitive or functionally redundant indicators were merged. For instance, the “Ground Decoration” indicator was removed due to its low importance score, while “Entrance Layout” was integrated into the broader indicator “Entrance Attractiveness”.
Ultimately, this study developed an evaluation indicator system for the landscape environment perception of outdoor public spaces in urban buildings, encompassing the four dimensions of service perception, spatial perception, cultural perception, and aesthetic perception. From these four dimensions, 15 factors influencing the evaluation of the landscape environment of outdoor public spaces in urban buildings were identified, providing a user perception measurement scale (Table 2) for subsequent quantitative evaluation and analysis.

2.2.2. Questionnaire Design

The questionnaire (Appendix C and Appendix D) designed in this study is divided into two sections. The first section gathers basic information about the respondents and their use of the outdoor public spaces, including age, gender, occupation, and travel time, mode, and purpose. The second section focuses on the importance and satisfaction of the respondents with the public-space landscape environmental evaluation indicators. The measurement method used the Likert five-point scale to measure the importance of these perceived factors (1 = “very unimportant”, 5 = “very important”) and their satisfaction (1 = “very dissatisfied”, 5 = “very satisfied”). Demographic characteristics of respondents are presented in Appendix E.

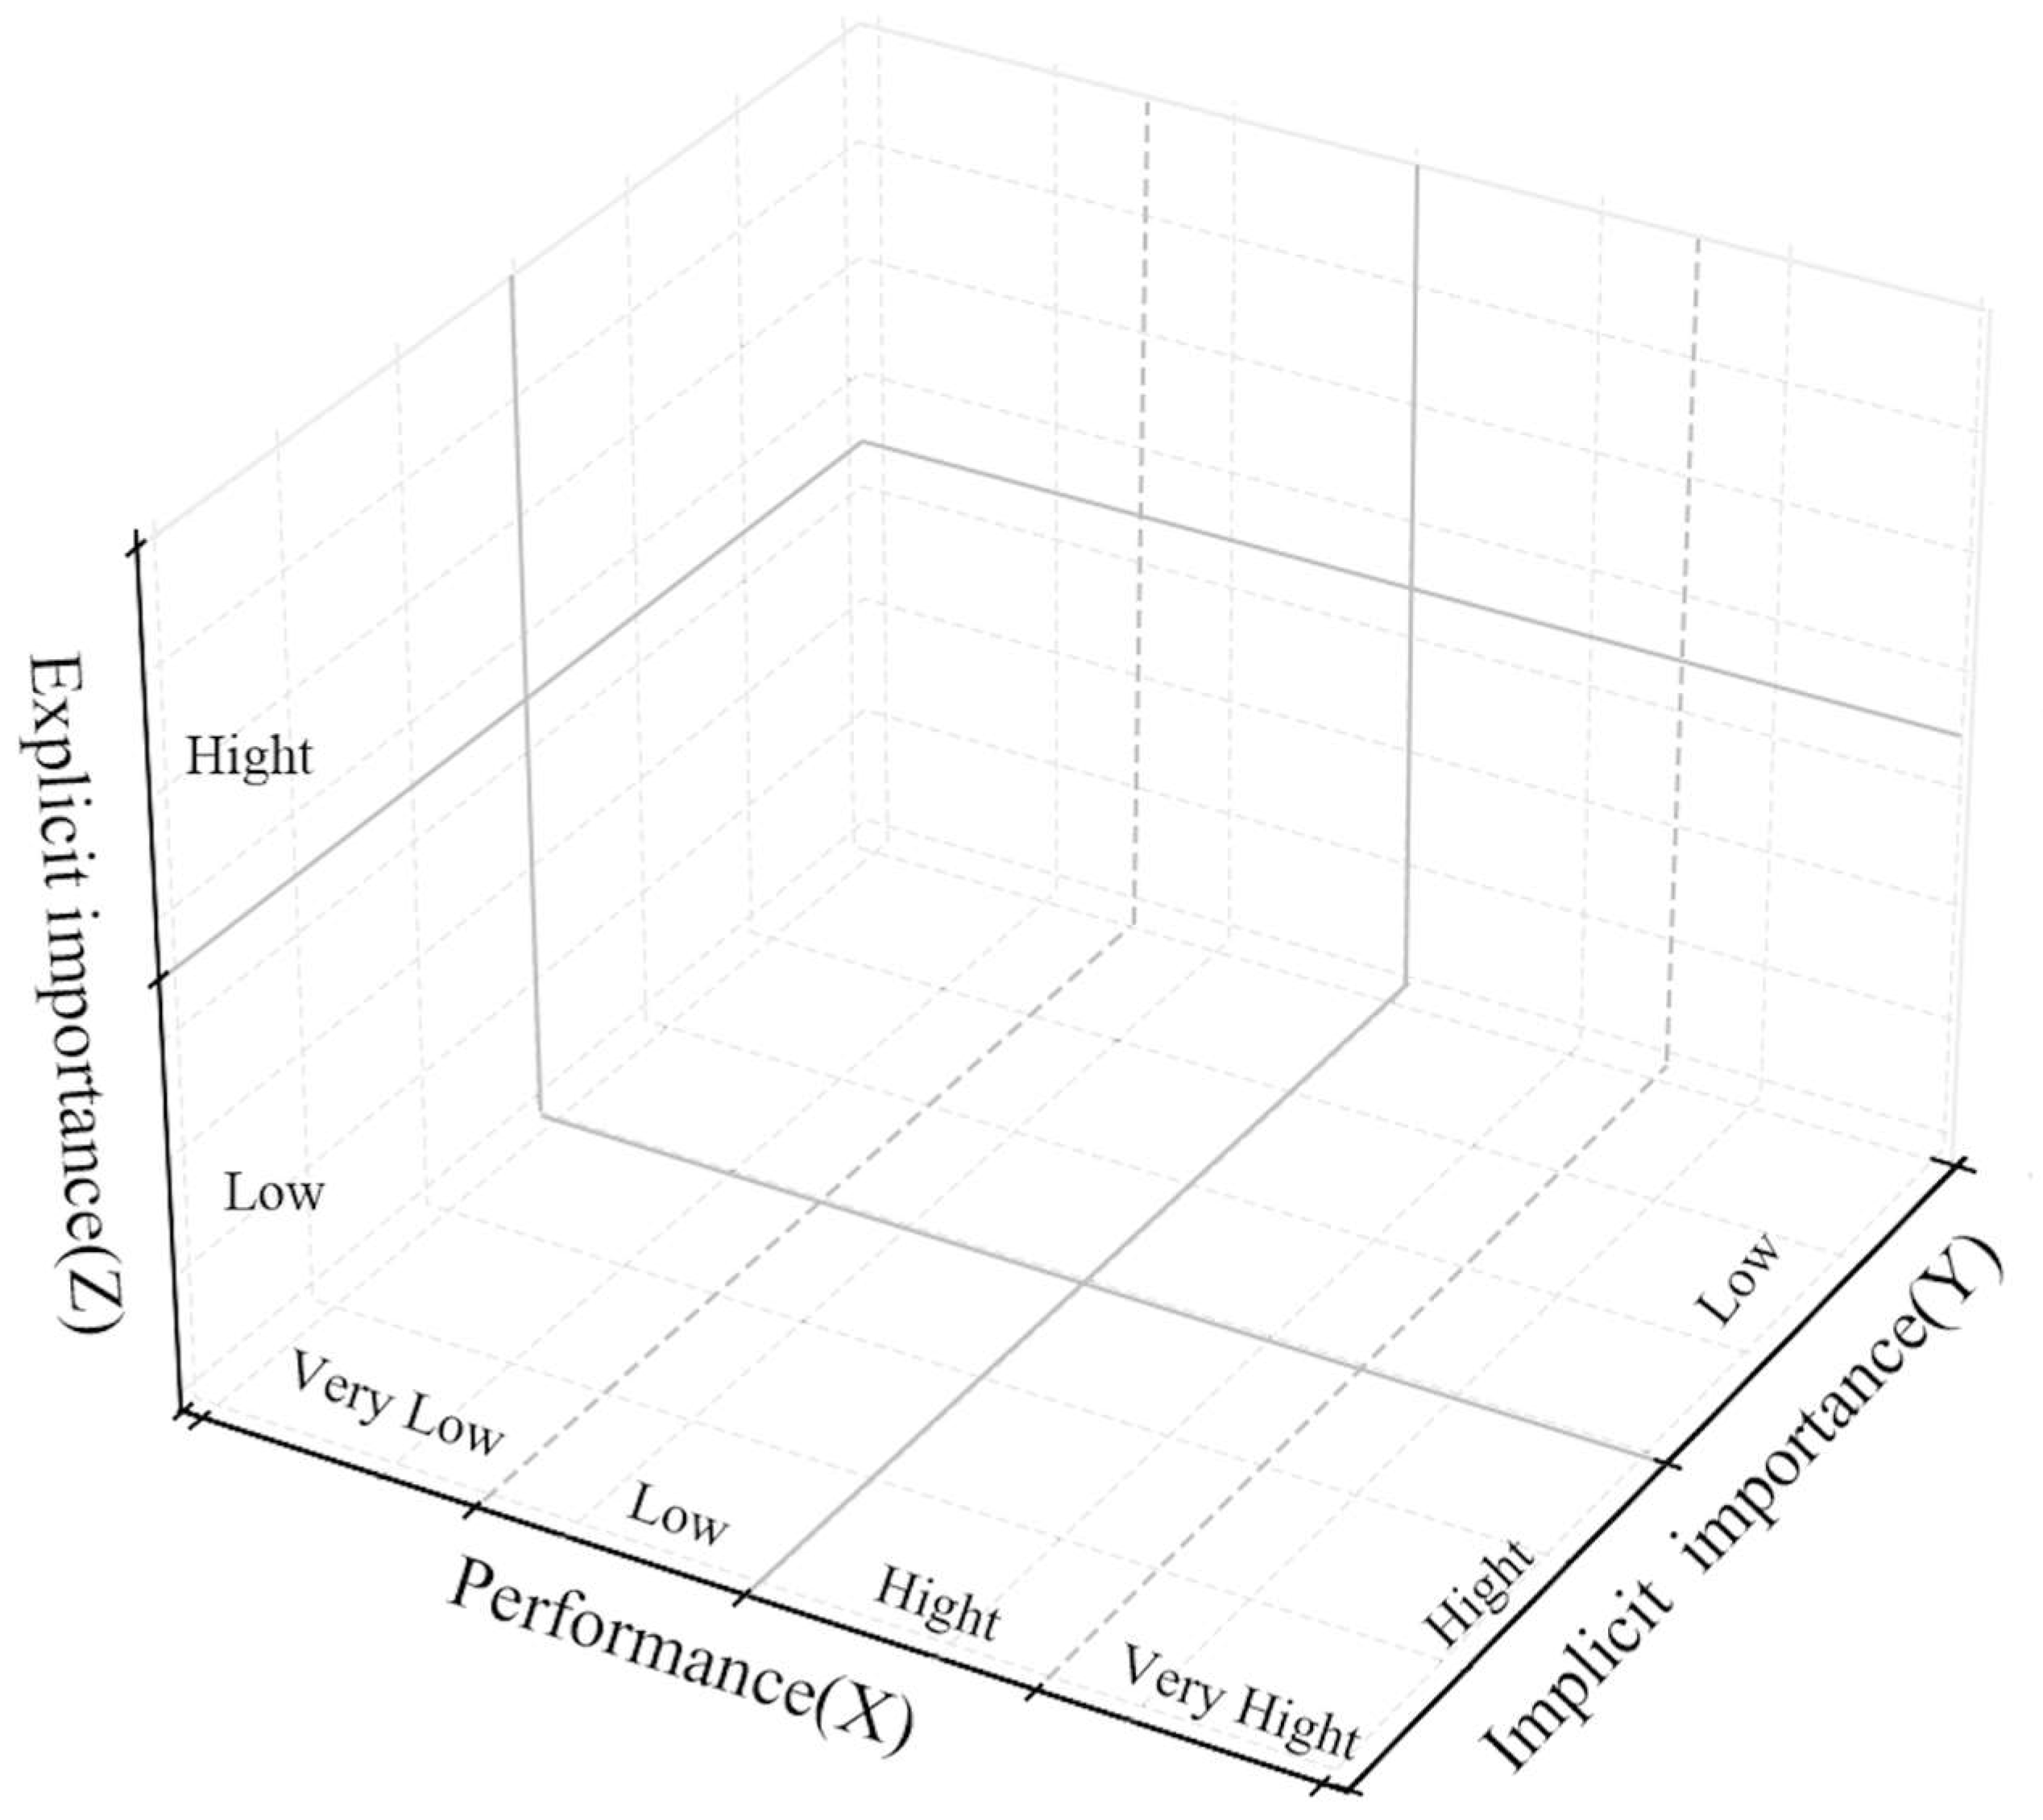
2.3. The 3-Dimensional IPA Methodology

In this study, the explicit and implicit importance matrices suggested by Vavra [30] are applied in urban planning, particularly to evaluate and improve designed landscapes (see Figure 5). Explicit importance refers to the needs and preferences explicitly expressed by users, while implicit importance pertains to factors that although not directly articulated by users, potentially affect their satisfaction. By employing both explicit and implicit importance matrices, this study offers a more comprehensive view of how landscape factors influence user satisfaction, providing a theoretical framework and practical recommendations for urban planning.
Based on the Vavra matrix, the 3D IPA method constructs a cube model consisting of 16 regions (see Figure 6). This model classifies the performance of each factor by calculating the weighted average of explicit importance, implicit importance, and actual performance at the intersections of the cube. The actual performance level is categorized as “very low”, “low”, “high”, or “very high”, as detailed in Table 3. Based on these analytical results, this study proposes corresponding 3-D IPA action strategies.
For performance-based factors, for those with high explicit and implicit importance, the current performance should be maintained and further optimized to enhance user satisfaction. For the basic factors—those with high explicit importance and low implicit importance—if their performance exceeds expectations, it is recommended to adjust to a reasonable average level to avoid over-optimization. Conversely, if performance is poor, priority should be given to meeting the basic needs of users. Excitatory factors—those with lower explicit importance but higher implicit importance—should be classified as “low priority” but the focus should be on improving performance, particularly if these factors have a high potential to enhance user satisfaction. In cases of limited resources, it is advised that planners prioritize improving the performance of performance-based factors while ensuring a reasonable allocation of resources and selectively investing in the optimization of excitatory factors.
In this study, explicit importance was measured through self-statements, while implicit importance was assessed using relative measures. Following the guidelines of Lai and Hitchcock, factor satisfaction was treated as the independent variable, and overall satisfaction as the dependent variable for analysis. Considering that multiple regression analysis may overemphasize the attributes with large coefficients and underestimate the implicit importance of other attributes, partial correlation analysis was used in this study. Partial correlation analysis can independently evaluate the direct relationship between each perceived factor and overall satisfaction, avoiding the bias that may be brought by multiple regression analysis, and can more accurately quantify the influence of independent variables on dependent variables when dealing with multiple attributes.

2.4. Data Collection

The data for this study were collected using the Questionnaire for Evaluation of Perception of Landscape Environment in Outdoor Public Space of Buildings in Wuhan City, which was surveyed in two time periods using online and offline methods. The first phase of the survey was conducted from May 7 to 27 2024, targeting users who visited or had visited the Wuhan Citizens’ Home (CH). A total of 175 questionnaires were distributed, and 165 valid responses were collected, yielding an effective recovery rate of 94.3%. The second phase of the survey took place from 12 to 22 July 2024, at the Creative World Industrial Park (CWIP). In this phase, 200 questionnaires were distributed, with 175 valid responses recovered, resulting in an effective recovery rate of 87.5%. Overall, this study collected a total of 340 valid questionnaires.

3. Results

3.1. Construct Reliability and Validity

The reliability (Table A3) and validity (Table A4) of the evaluation of the landscape environment’s perception in the outdoor public space of CH and CWIP were thoroughly examined and analyzed. The Cronbach’s α values for both the significance and satisfaction of the evaluation indicators exceeded 0.8, indicating that the data are highly reliable and stable. Additionally, the KMO values for both samples were above 0.8, demonstrating good sample validity. The results of Bartlett’s test revealed a significant correlation between the variables, with a significance of sig = 0.000 < 0.05. These findings provide strong support for the continued analysis of this dataset.

3.2. Actual Performance, Explicit Importance and Implicit Importance

This study quantified the “explicit importance” of 15 landscape factors, with values ranging from 3.69 to 4.02 and a mean of 3.79. The “implicit importance” was measured by examining the relationship between satisfaction with these factors and overall satisfaction, with values ranging from 0.372 to 0.508 and a mean of 0.377. Additionally, the “actual performance” values for these factors ranged from 3.58 to 4.09, with a mean of 3.88. These three mean values form the core intersections of the three-dimensional IPA cube. To further analyze the actual performance, the values were classified into the following four categories: “very high”, “high”, “low”, and “very low”, with distinction points set at 3.96, 3.84, and 3.71, respectively. Table 4 provides the values for explicit importance, implicit importance, and actual performance.

3.3. Analysis of Actual Performance, Explicit Importance Evaluation of Four Perceived Dimensions

Table 5 presents the 3-D IPA results for the four dimensions of user perception of the landscape environment in outdoor public spaces within buildings. In CH, the dimensions of “spatial perception”, “cultural perception”, and “aesthetic perception” are classified as basic factors, while the “service perception” dimension is categorized as a performance factor. For basic factors, it is recommended to either “maintain” or “reduce” existing measures. For the “service perception” dimension, a “low priority” action is recommended. In CWIP, all four dimensions are classified as excitatory factors. For these excitatory factors, the recommended action strategy is to either “keep” or “improve” their performance.
By comparing two types of outdoor public spaces, CH and CWIP, this study analyzes the results of the evaluation of the actual performance and apparent importance of each factor in the following four perceptual dimensions: service perception, spatial perception, cultural perception, and aesthetic perception (see Table 6 and Table 7).
In the service perception dimension, CH outperforms CWIP in the factors of “identification system guide”, “road guidance”, and “the convenience of travel and transportation options”. The factor “the convenience of travel and transportation options” obtained the highest explicit importance score (3.87), indicating that users really like how the outdoor public spaces are designed at CH. Conversely, the factor “identification system guide” obtained the lowest score (3.52), suggesting that users place less importance on this orientation service. In contrast, CWIP shows more evenly distributed scores across the service perception factors. Users consider “identification system guide” and “the convenience of travel and transportation options” to be highly important. However, the actual performance of the “identification system guide” is poor, indicating that the users’ experiences with this feature fall short of their expectations. In the spatial perception dimension, CH performs better overall, particularly in factors such as “attractiveness of entrances and exits”, “the richness of landscape space types”, “site safety and accessibility”, and “the use of permeable floor paving”, all of which are significant factors. Despite CWIP’s high score for the importance of “the richness of landscape space types”, its actual performance score is low (3.61), signaling that users still have high expectations for a diverse range of spaces and features that have not yet been fully met. In the cultural perception dimension, both CH and CWIP users agree on the importance of “the cultural nature of landscape decoration” in cultural landscape design. However, the actual performance of this factor is lacking, suggesting that users’ expectations for the cultural aspect of the landscape have not been fulfilled. Meanwhile, the performance of other related factors is better, and users’ satisfaction with these elements is generally higher, indicating that the cultural and activity-oriented aspects of the public space design are generally well received. In the aesthetic perception dimension, both CH and CWIP users gave high ratings to factors such as the art of public facilities, plant viewing, and landscape night lighting. This suggests that in terms of aesthetics, the design of public spaces is generally well-regarded. Particularly in the areas of landscape night lighting and plant viewing, users perceive significant aesthetic value, which enhances the overall attractiveness of the landscape.

3.4. The 3-D IPA Analysis of Four Perceptual Dimensions

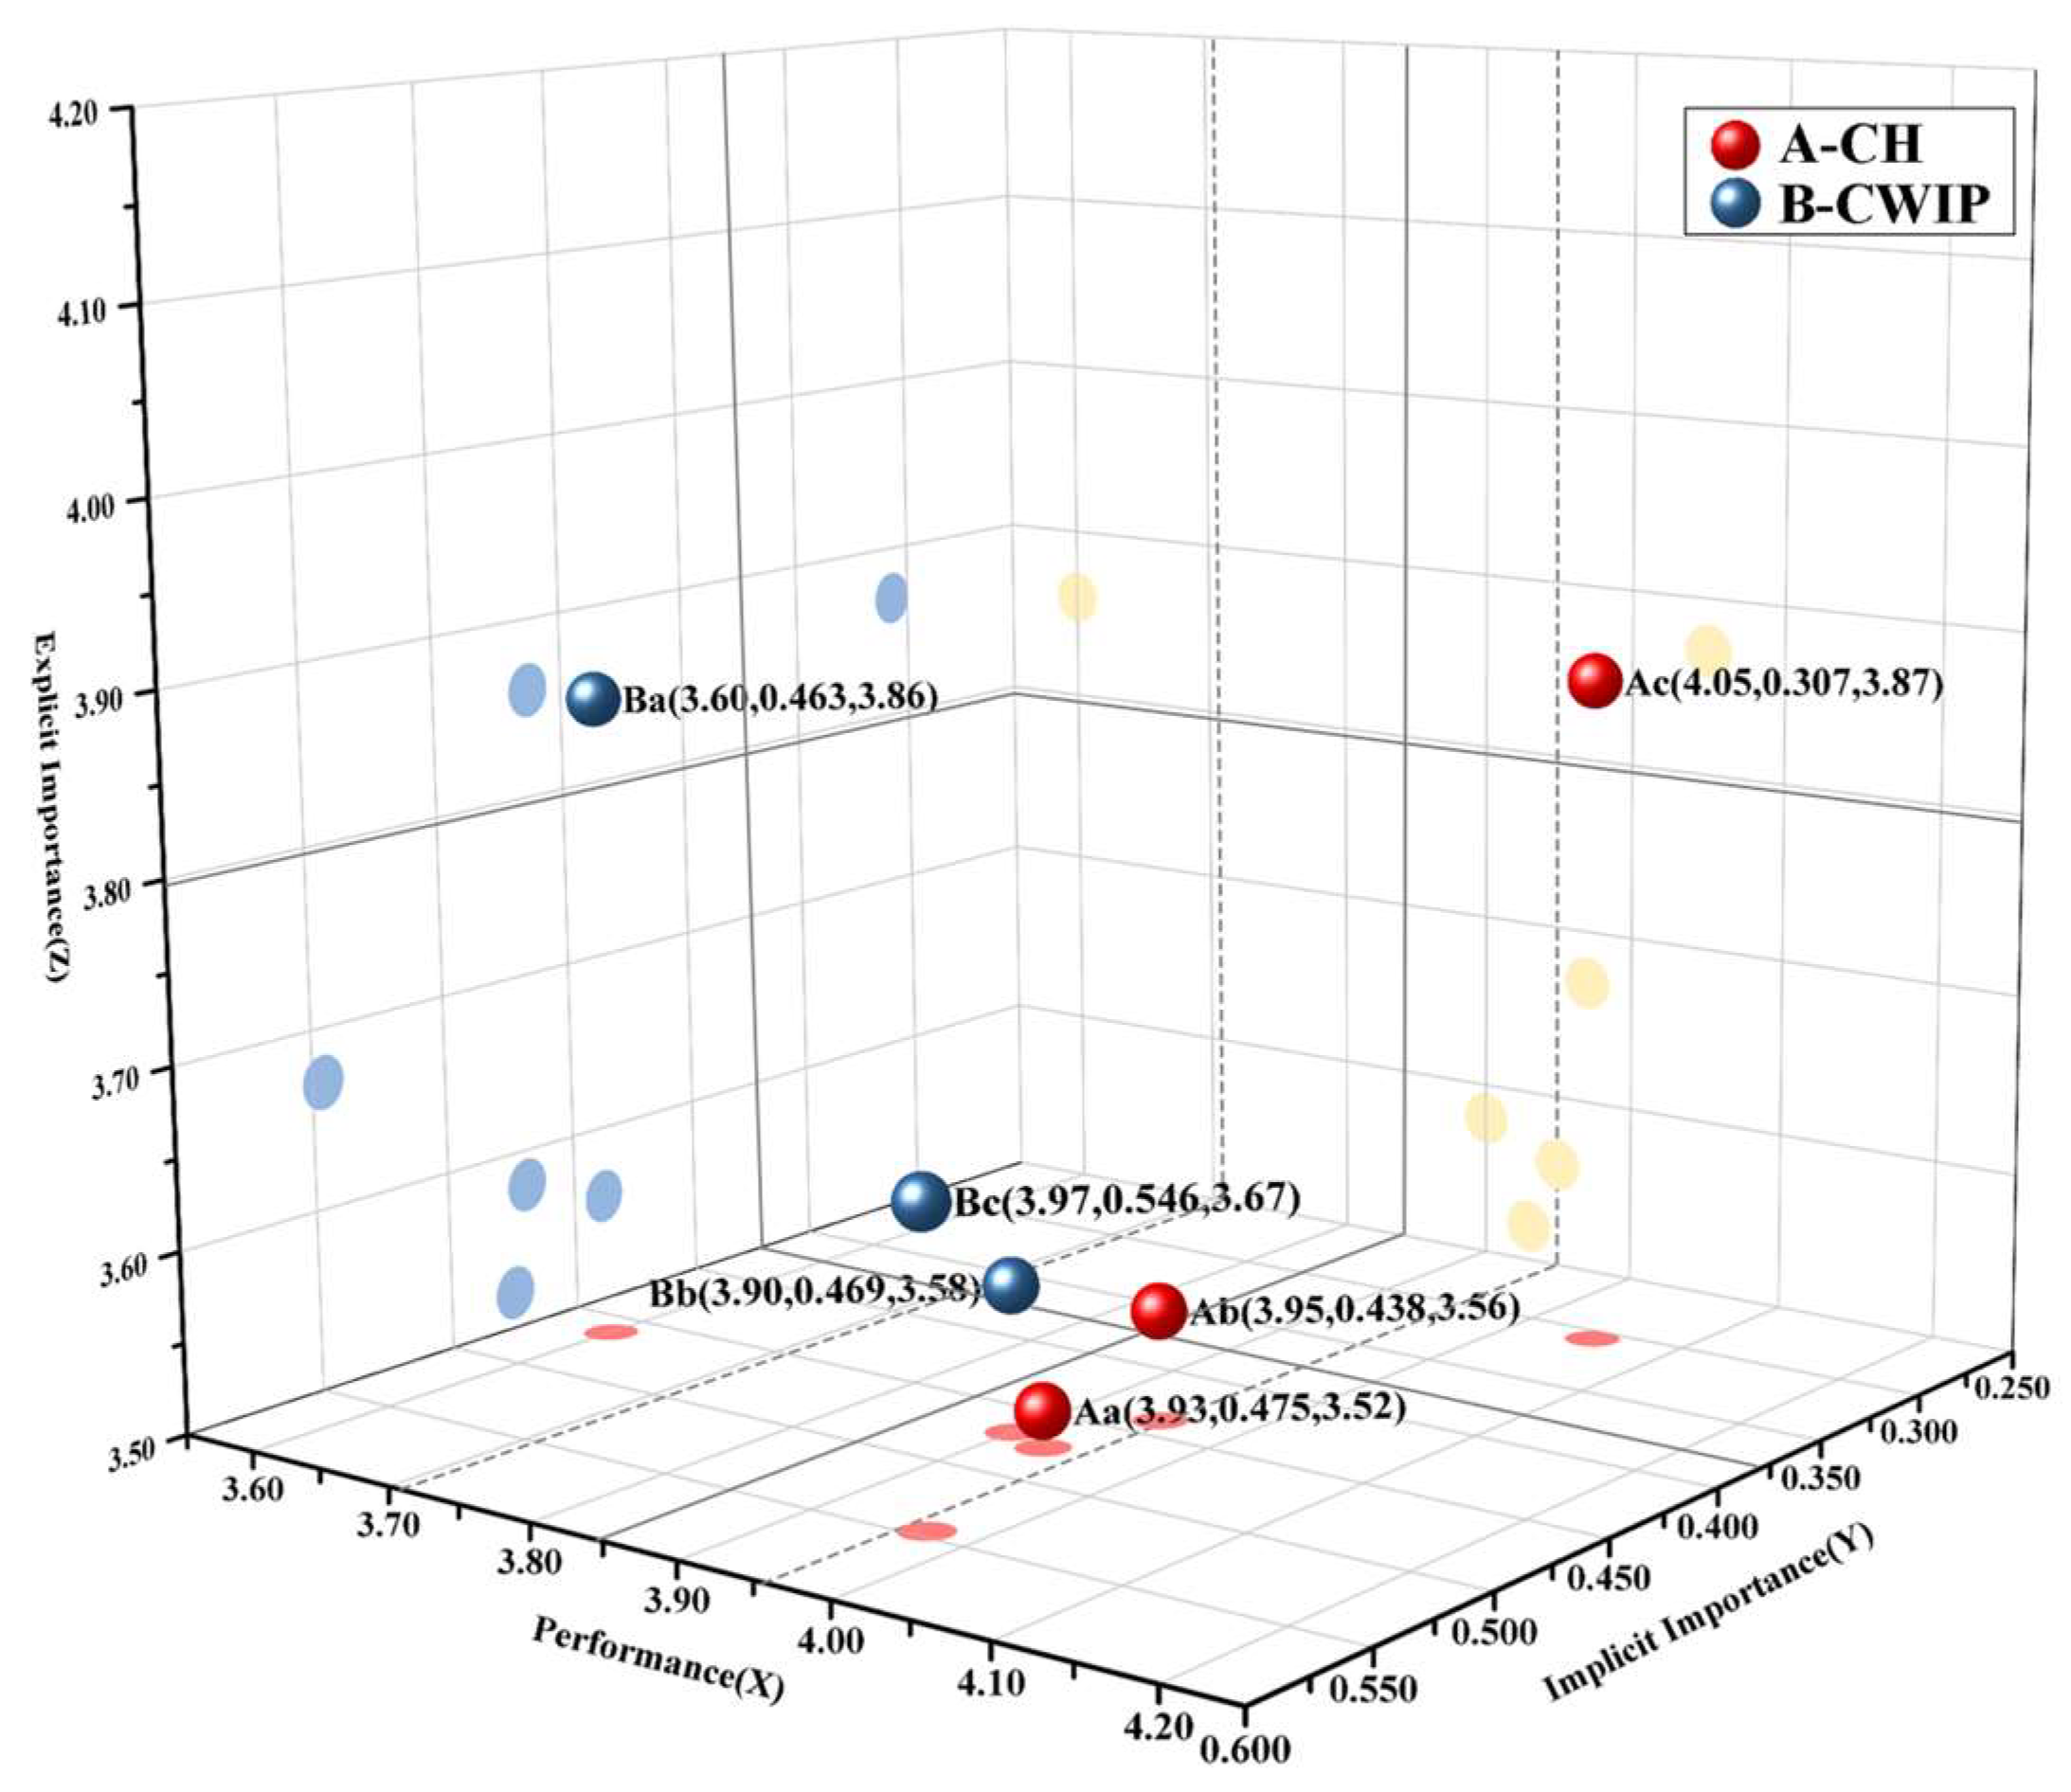
3.4.1. The 3-D IPA of Service Perception Dimensions

The 3-D IPA model analysis of the service perception dimension (see Figure 7) indicates that the optimal strategies for improving the landscape environment quality of the outdoor public space at CH are provision of an “identification system guide” and “road guidance”, which fall into the Low Priority quadrant, indicating that they require no immediate action. In contrast, “the convenience of travel and transportation options” is recommended to adopt a reduction strategy; while maintaining basic travel convenience for the public, it is advisable to minimize planning and design inputs in this dimension to enhance the overall cost-efficiency. Compared to the CH, the “identification system guide” of the CWIP needs to be “improved” to make the service functions better, like identification. Conversely, “road guidance” remains a low priority, while “the convenience of travel and transportation options” should remain unchanged.

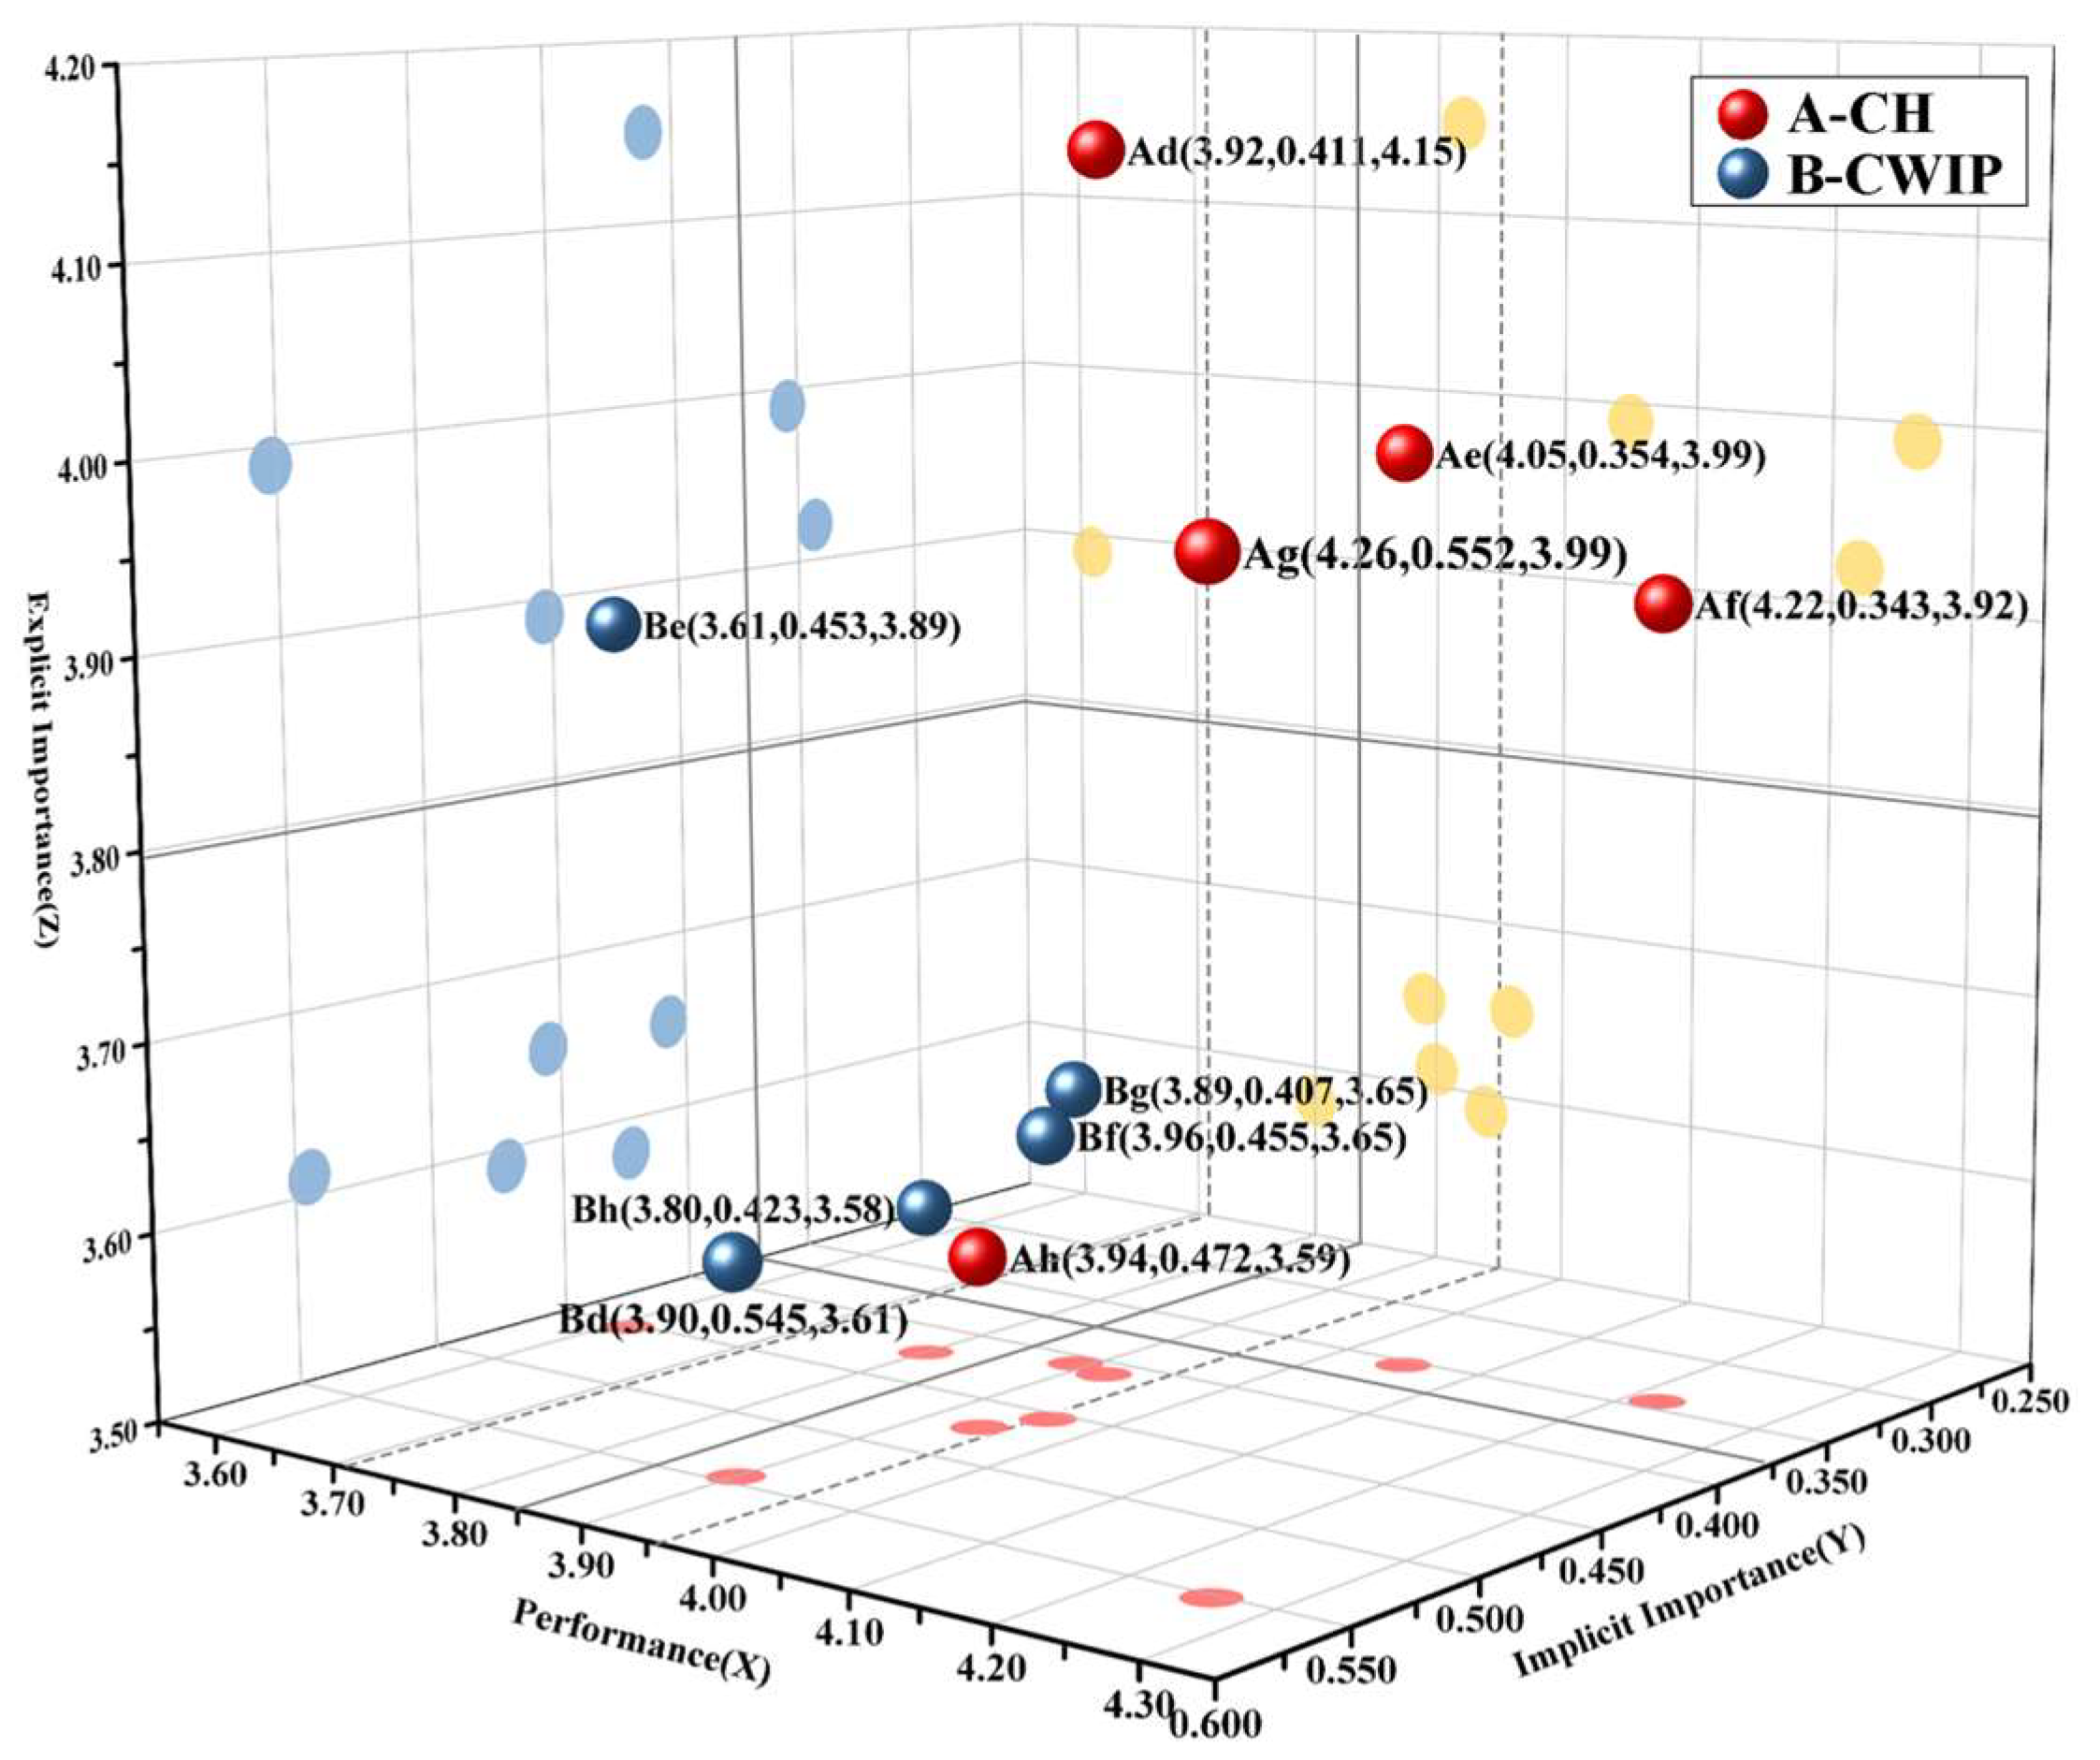
3.4.2. The 3-D IPA of Spatial Perception Dimensions

In the 3-D IPA model analysis of spatial perception dimensions (see Figure 8), the “attractiveness of entrances and exits” and “the use of permeable floor paving” should stay the same in the CH. “Road fluency” adopts a “low priority” action strategy; “the richness of landscape spatial types” and “site safety and accessibility” should be reduced to meet the needs of the public and maintain the quality of their landscape space. In contrast, in the CWIP, “the richness of landscape spatial types” and “road fluency” should be adopted as “improve” strategies. We regard the remaining three factors as “low priority” and recommend their moderate optimization.

3.4.3. The 3-D IPA of Cultural Perception Dimensions

For the CH in the 3-D IPA model analysis of cultural perception dimensions (see Figure 9), it is indicated that “the cultural nature of landscape decoration” needs to “improve”. It also indicates that “promotion of culture and history and science education”, and the “openness of venue” should be “kept” to meet the needs of the residents for cultural activities. At the same time, the “distribution and quantity of native plants” should be moderately “reduced”, so as to reduce the planning and design input in this area on the premise of satisfying the public’s regional cultural experience. In contrast, in the CWIP, “the distribution and quantity of native plants” and “the openness of the venue” are regarded as “low priority”. The “promotion of culture and history and science education” should be maintained at the current level; the same “improve” strategy should be adopted for “the cultural nature of landscape decoration” to further strengthen the cultural aspects of outdoor public spaces in decentralized buildings.

3.4.4. The 3-D IPA of Aesthetic Perception Dimensions

To make the landscape environment better, the 3-D IPA model looks at the aesthetic perception dimension (see Figure 10). It shows that the CH and CWIP use a “keep” strategy for “artistry of public facilities” and “landscape night lighting artistic”. This indicates that these two factors can meet the basic needs of users at the current level, and there is no need for substantial optimization. For “plant viewing”, CH uses the “Reduce” strategy, which means that this factor does somewhat affect users’ aesthetic needs, but the current performance is satisfactory enough that it does not need a lot of extra resources to be improved. In contrast, CWIP uses the “low priority” strategy, which means this factor does not affect users’ aesthetic needs as much and can be moderately optimized without using too many resources.

4. Discussion

This study builds on the previous research by looking into how to improve the quality of the landscape environment for the four main perception factors of service perception, spatial perception, cultural perception, and aesthetic perception in the outdoor public spaces of CH and CWIP (see in Table 8).

4.1. Service Perception Dimension Optimization Recommendations

The 3-D IPA analysis reveals that both in the CH and CWIP, “identification system guide” and “road guidance” are classified into the low-priority quadrants, indicating that users place less importance on these factors. This may be due to users’ familiarity with the space or the inherent clarity of the original spatial structure. In particular, at CWIP, being a creative industrial park, users are more inclined to navigate the space independently and rely less on formal guidance systems.
Nevertheless, it remains essential to improve inclusiveness and efficiency. A unified visual language, such as intuitive symbols, color coding, and digital guidance tools, is recommended. Additionally, considering the needs of the elderly and visually impaired, barrier-free guidance methods, including voice broadcasting and touch screens, should be incorporated. This strategy aligns with Stessens et al.’s [7] emphasis on spatial identifiability in green spaces and supports the urban system design principles proposed by Firmansyah et al. [8].

4.2. Spatial Perception Dimension Optimization Recommendations

The importance of “the richness of landscape space types” is rated as moderate in the CH but is considered highly important in CWIP. This suggests that user expectations vary based on the nature of the space: in the CH, which functions as a government building, users prefer simple, function-oriented spaces. In contrast, users of CWIP, a creative industrial park, place greater emphasis on the diversity and openness of spaces to accommodate creative work and social interaction. Therefore, CH should avoid overdesign and focus on simplifying the design, using durable, low-maintenance materials, clear path systems, and multifunctional spatial layouts [31]. On the other hand, CWIP can enhance the variability of space and artistic expression, creating attractive social spaces such as shaded rest areas or small event platforms. These strategies align with the view that “spatial clarity contributes to the efficiency of use”, as proposed by Gavrilidis et al. [1], and support the conclusion that “spatial stratified structure can meet diverse perceptual expectations”, as emphasized by Qi et al. [14].
Regarding the “attractiveness of entrances and exits” at CWIP, it is recommended that the design of these areas be further optimized to enhance their visual guidance and functionality. For example, entrances and exits can be made more prominent by incorporating characteristic landscape elements or cultural markers, transforming them into key visual nodes in the space and increasing their appeal to users. Additionally, multifunctional areas, such as small seating arrangements or information display walls, can be added around the entrances to further enhance their utility and capacity for gathering crowds. These improvements would contribute to the accessibility, mobility, interactivity, and overall attractiveness of the space.

4.3. Cultural Perception Dimension Optimization Recommendations

To optimize “the cultural nature of landscape decoration”, both CH and CWIP can adopt similar strategies to enhance the cultural connotation of their landscapes. It is recommended that landscape vignettes incorporate more cultural elements, such as the work of local artists, sculptures depicting the area’s history, or the use of local building materials and traditional crafts [32]. For instance, CH can reflect government culture through educational and public-oriented landscape sculptures and historical signage, while CWIP can integrate multicultural elements to create a more inclusive cultural expression space.
In terms of plant configuration, CH should simplify plant types to reduce maintenance complexity, whereas CWIP can adopt a layered planting structure to enhance both ecological and visual diversity. This strategy aligns with Gao et al. [9], who emphasized that “localized plant design facilitates ecological and cultural synergy”, and echoed Tzoulas et al. [33], who highlighted the role of green infrastructure in carrying both ecological and social significance. Furthermore, Zhao et al. [18] and Jiang and Liu [19] also underscored that embedding cultural narratives into spatial layouts can significantly enhance users’ cultural engagement and sense of belonging.
Regarding the optimization of “distribution and quantity of native plants”, CH should reduce overly complex flower plantings and prioritize species adapted to the local climate and soil conditions. This approach not only helps create a uniform and natural landscape effect but also reduces maintenance costs and complexity. In contrast, CWIP should follow the natural growth patterns of plants and avoid the over-concentration of any single species. By strategically configuring trees, shrubs, groundcovers, and other plants, CWIP can achieve a more natural and rich landscape effect [33]. For example, in walkway or plaza areas, a moderate density of low groundcover plants can be used, while areas requiring shade could feature sparse trees or large shrubs. This plant configuration enhances ecological diversity and better meets the functional needs of the space.
In terms of “promotion of culture, history, and science education”, as well as “the openness of the venue”, it is recommended to maintain the existing design principles. The enhancement of cultural and historical aspects can be achieved through the combination of spatial layout and landscape design [34], such as reinforcing the sense of history and cultural depth through cultural signs, historical sculptures, or display walls. The openness of the activity venue should focus on maintaining flexibility, allowing the space to be adjusted for various uses. The layout and arrangement of facilities should be planned to facilitate smooth functioning for a wide range of activities. This will make public spaces more interactive and functional.

4.4. Aesthetic Perception Dimension Optimization Recommendations

Regarding the design of the “artistry of public facilities” and “landscape night lighting artistry”, both CH and CWIP have achieved commendable design results. However, in terms of “plant viewing”, CH users tend to favor seasonal variation and structural aesthetics, while CWIP users prefer informal, multisensory experiences. To enhance the viewing experience, it is recommended to incorporate diverse plant forms, seasonal color contrasts, and perceptible landscaping elements (such as aromatic or touchable herbaceous plants), particularly around walkways and gathering areas. This approach aligns with the conclusion by Van Den Berg et al. [15] that “sensory-rich green spaces have greater restorative effects” and resonates with Pasha and Shepley’s [32] research on how “multi-sensory garden design promotes emotional connections”.

4.5. Study Limitations and Future Research Directions

While this study provides actionable strategies, several limitations should be acknowledged. First, the research is based on two representative sites in Wuhan, which may not fully reflect broader patterns across different urban regions. Although the CH and CWIP respectively, further case studies are needed for more comprehensive generalization. Second, while the questionnaire was carefully designed based on perception dimensions, the sample size and demographic scope were limited. Future research should aim to expand participant diversity and explore longitudinal changes in user perception. Third, this study did not explicitly analyze the impact of climatic factors on spatial perception, such as heat stress or rainfall. Future studies could investigate how environmental design (e.g., shading, paving, and ventilation) mitigates climate-related discomfort and influences space usage.

5. Conclusions

This study uses both the 3-D IPA model and an evaluation index system based on perception theory to obtain a full picture of how satisfied people are with the landscape environment in the public outdoor areas in CH and CWIP. The results of this study show that the 3-D IPA model can provide an effective evaluation method for users’ landscape preferences in outdoor public spaces, and at the same time, provide direct quantitative evaluation and empirical support for landscape perception theory and sustainable urban development practices. Based on the results, this study proposes specific optimization suggestions for each index that align with sustainability principles. The main conclusions and insights of this study are as follows:
(1)
Through a 3-D IPA analysis of the CH and CWIP, this study reveals the differences in user perceptions of these two architectural spaces. The CH sees its users particularly focused on the functional, accessible, and safe aspects of the space, with aesthetic perception being secondary, as users prioritize the artistic and visual effects of the landscape. In contrast, CWIP’s users place greater importance on cultural perception, especially regarding the cultural value of landscape elements and the openness of activity spaces. Space perception ranks second, with users emphasizing the diversity, rational layout, and accessibility of the landscape. Both service perception and aesthetic perception are relatively less significant. These findings provide valuable insights for developing more sustainable, user-centered urban spaces.
(2)
Based on the results of the 3-D IPA analysis, the CH should prioritize optimizing the convenience of transportation, particularly by improving the design of entrances and traffic guidance functions to promote sustainable mobility. In addition, landscape design should focus on enhancing the environmental benefits and aesthetic appeal of permeable paving, which contributes to urban water management and climate resilience, while avoiding excessive investment in identification systems and road guidance functions. For CWIP, the focus should be on improving the diversity of landscape spaces and the smoothness of roads, while optimizing the cultural expression of landscape elements to enhance social sustainability and community engagement.
(3)
In addition to the optimization recommendations for the CH and CWIP, this study also provides optimization references for the outdoor public spaces of other similar building types. First, the differences between spatial types and user needs should be fully understood. Second, the optimization plan should address multiple dimensions, not limited to functionality and accessibility, but also considering the improvement of aesthetics, cultural elements, and service facilities. Finally, designers should integrate the 3-D IPA model’s comprehensive evaluation method and based on the characteristics of different spatial types and user needs, flexibly adjust design elements to ensure that, while enhancing the functionality of the space, the diverse perceptual needs of users are also met.

Author Contributions

Conceptualization, L.Y. and Y.H.; methodology, L.Y.; software, L.Y.; validation, Y.H., Y.C. and L.Y.; formal analysis, Y.H.; investigation, Y.C. and L.Y.; resources, Y.H.; data curation, L.Y.; writing—original draft preparation, L.Y., Y.H. and Y.C.; writing—review and editing, L.Y. and Y.C.; visualization, L.Y.; supervision, Y.H. and Y.C.; project administration, Y.H.; funding acquisition, Y.H. All authors have read and agreed to the published version of the manuscript.

Funding

Research on landscape optimization and lowcarbon design of urban public space: G23-12-S.

Institutional Review Board Statement

The study was conducted in accordance with the Declaration of Helsinki, and approved by the Institutional Review Board of Hubei university of technology (protocol code HBUT20250010; date of approval 11 April 2024).

Informed Consent Statement

Informed consent was obtained from all subjects involved in the study.

Data Availability Statement

The original contributions presented in this study are included in the article; further inquiries can be directed to the corresponding authors.

Conflicts of Interest

The authors declare no conflicts of interest.

Appendix A

Table A1. The number of experts evaluating the impact degree of each index of landscape environment perception evaluation.
No.Evaluation FactorInfluence Degree
Great
Impact
Significant
Impact
Moderate ImpactMinor
Impact
No
Impact
1Identification system guide620220
2Road guidance618420
3The convenience of travel and transportation
options
120621
4Attractiveness of entrances and exits251364
5Seasonal variation in richness2161011
6The richness of landscape spatial types422400
7Site safety and accessibility315921
8The use of permeable floor paving4101312
9Road fluency713820
10The cultural nature of landscape decoration516441
11Promotion of culture and history and science
education
188220
12Cleanliness of the environment620166
13Distribution and quantity of native plants1114500
14The openness of the venue218532
15Artistry of public facilities1012800
16Overall style coordination520148
17Plant viewing719040
18Landscape night lighting artistic560109
19The completeness of interactive facilities270156
20Privacy of the space222330
Table A2. Evaluation factors and influence degree of perceived landscape environmental quality.
No.Evaluation FactorInfluence DegreeSample Variance
1Identification system guide4.000.552
2Road guidance3.930.616
3The convenience of travel and transportation options3.600.662
4Attractiveness of entrances and exits3.570.668
5Seasonal variation in richness3.451.254
6The richness of landscape spatial types4.000.276
7Site safety and accessibility3.570.806
8The use of permeable floor paving3.670.557
9Road fluency3.830.764
10The cultural nature of landscape decoration3.470.878
11Promotion of culture and history and science education4.400.800
12Cleanliness of the environment2.532.051
13Distribution and quantity of native plants4.200.510
14The openness of the venue3.800.629
15Artistry of public facilities3.510.573
16Overall style coordination2.971.275
17Plant viewing3.210.484
18Landscape night lighting artistic3.770.423
19The completeness of interactive facilities2.471.568
20Privacy of the space2.882.147
Table A3. Reliability test.
IndexCitizens’ Home
(CH)
Creative World Industrial Park
(CWIP)
Cronbach’s AlphaNumber of termsCronbach’s AlphaNumber of terms
Explicit importance0.887150.93015
Actual performance0.919150.94815
Table A4. Validity test.
KMO and Bartlett TestsCitizens’ Home
(CH)
Creative World Industrial Park
(CWIP)
Explicit
Importance
Actual
Performance
Explicit
Importance
Actual
Performance
KMO sample appropriateness measure0.9110.9440.9480.962
Bartlett
Sphericity
test
Approximate Chi-squared
value
793.9151076.5851313.3981673.434
Degree of freedom105105105105
Significance0.0000.0000.0000.000

Appendix B. Questionnaire to Establish Impact Indicators of Landscape Environment Perception Evaluation of Outdoor Public Space in Urban Buildings

  • Dear Expert,
  • Regards! The purpose of this study is to establish an evaluation model of perceived landscape environmental quality of outdoor public space in urban buildings. To this end, we identified several potential factors that could affect landscape environmental satisfaction. Please rate each factor based on its impact on overall satisfaction. The impact is divided into the following five levels:
  • 5: Great Impact
  • 4: Significant Impact
  • 3: Moderate Impact
  • 2: Minor Impact
  • 1: No Impact
  • Kindly indicate your rating for each factor based on your professional expertise.
No.Factor5: Great Impact4: Significant Impact3: Moderate Impact2: Minor Impact1: No Impact
1Identification system guide[ ][ ][ ][ ][ ]
2Road guidance[ ][ ][ ][ ][ ]
3The convenience of travel and transportation options[ ][ ][ ][ ][ ]
4Attractiveness of entrances and exits[ ][ ][ ][ ][ ]
5Seasonal variation in richness[ ][ ][ ][ ][ ]
6The richness of landscape spatial types[ ][ ][ ][ ][ ]
7Site safety and accessibility[ ][ ][ ][ ][ ]
8The use of permeable floor paving[ ][ ][ ][ ][ ]
9Road fluency[ ][ ][ ][ ][ ]
10The cultural nature of landscape decoration[ ][ ][ ][ ][ ]
11Promotion of culture and history and science education[ ][ ][ ][ ][ ]
12Cleanliness of the environment[ ][ ][ ][ ][ ]
13Distribution and quantity of native plants[ ][ ][ ][ ][ ]
14The openness of the venue
15Artistry of public facilities[ ][ ][ ][ ][ ]
16Overall style coordination[ ][ ][ ][ ][ ]
17Plant viewing[ ][ ][ ][ ][ ]
18Landscape night lighting artistic[ ][ ][ ][ ][ ]
19The completeness of interactive facilities[ ][ ][ ][ ][ ]
20Privacy of the space[ ][ ][ ][ ][ ]
  • Suggestions:
  • [Please provide any suggestions or comments you have regarding the landscape design of outdoor public spaces.]
  • We sincerely appreciate your cooperation and valuable input!

Appendix C. Evaluation Questionnaire for Outdoor Public Space Landscape Environment at Wuhan Citizens’ Home (CH)

  • Section I: Basic Information
  • Please select the appropriate option.
  • 1. You are: ○ Tourist ○ Local Resident ○ Office Worker
  • 2. Your age: ○ 16–29 ○ 30–49 ○ 50–65 ○ Over 65
  • 3. Your gender: ○ Male ○ Female
  • 4. Your trip purpose: ○ Public Affairs ○ Leisure ○ Work ○ Others
  • 5. Your travel time: ○ 07:00–10:00 ○ 10:00–13:00 ○ 13:00–17:00 ○ 17:00–20:00
  • ○ Other
  • 6. Your transportation mode: ○ Metro ○ Bus ○ Private Car ○ Cycling
  • ○ Walking
  • Section II: Importance and Satisfaction Ratings
  • Please rate the importance and satisfaction (performance) of each factor using a 5-point Likert scale:
  • 1 = Very Unimportant/Very Dissatisfied, 5 = Very Important/Very Satisfied
Evaluation Indicator FactorImportance (1–5)Satisfaction (1–5)
Identification system guidance□ 1 □ 2 □ 3 □ 4 □ 5□ 1 □ 2 □ 3 □ 4 □ 5
Road guidance□ 1 □ 2 □ 3 □ 4 □ 5□ 1 □ 2 □ 3 □ 4 □ 5
Convenience of travel and transport options□ 1 □ 2 □ 3 □ 4 □ 5□ 1 □ 2 □ 3 □ 4 □ 5
Attractiveness of entrances and exits□ 1 □ 2 □ 3 □ 4 □ 5□ 1 □ 2 □ 3 □ 4 □ 5
Richness of landscape spatial types□ 1 □ 2 □ 3 □ 4 □ 5□ 1 □ 2 □ 3 □ 4 □ 5
Site safety and accessibility□ 1 □ 2 □ 3 □ 4 □ 5□ 1 □ 2 □ 3 □ 4 □ 5
Use of permeable floor paving□ 1 □ 2 □ 3 □ 4 □ 5□ 1 □ 2 □ 3 □ 4 □ 5
Road fluency□ 1 □ 2 □ 3 □ 4 □ 5□ 1 □ 2 □ 3 □ 4 □ 5
Cultural nature of landscape decoration□ 1 □ 2 □ 3 □ 4 □ 5□ 1 □ 2 □ 3 □ 4 □ 5
Promotion of culture, history, and science education□ 1 □ 2 □ 3 □ 4 □ 5□ 1 □ 2 □ 3 □ 4 □ 5
Distribution and quantity of native plants□ 1 □ 2 □ 3 □ 4 □ 5□ 1 □ 2 □ 3 □ 4 □ 5
Openness of the venue□ 1 □ 2 □ 3 □ 4 □ 5□ 1 □ 2 □ 3 □ 4 □ 5
Artistry of public facilities□ 1 □ 2 □ 3 □ 4 □ 5□ 1 □ 2 □ 3 □ 4 □ 5
Plant viewing□ 1 □ 2 □ 3 □ 4 □ 5□ 1 □ 2 □ 3 □ 4 □ 5
Landscape night lighting artistic□ 1 □ 2 □ 3 □ 4 □ 5□ 1 □ 2 □ 3 □ 4 □ 5
  • Section III: Overall Evaluation
  • How satisfied are you with the current design of the outdoor public space landscape at Wuhan Citizens’ Home?
  • ○ Very Dissatisfied ○ Dissatisfied ○ Neutral ○ Satisfied ○ Very Satisfied
  • Thank you very much for your participation and cooperation!

Appendix D. Evaluation Questionnaire for Outdoor Public Space Landscape Environment at Wuhan Creative World Industrial Park (CWIP)

  • Section I: Basic Information
  • Please select the appropriate option.
  • 1. You are: ○ Tourist ○ Local Resident○ Shop Owner
  • 2. Your age: ○ 16–29 ○ 30–49 ○ 50–65 ○ Over 65
  • 3. Your gender: ○ Male ○ Female
  • 4. Your trip purpose: ○ Public Affairs ○ Leisure ○ Work ○ Others
  • 5. Your travel time: ○ 07:00–10:00 ○ 10:00–13:00 ○ 13:00–17:00 ○ 17:00–20:00 ○ Other
  • 6. Your transportation mode: ○ Metro ○ Bus ○ Private Car ○ Cycling ○ Walking
  • Section II: Importance and Satisfaction Ratings
  • Please rate the importance and satisfaction (performance) of each factor using a 5-point Likert scale:
  • 1 = Very Unimportant/Very Dissatisfied, 5 = Very Important/Very Satisfied
Evaluation Indicator FactorImportance (1–5)Satisfaction (1–5)
Identification system guidance□ 1 □ 2 □ 3 □ 4 □ 5□ 1 □ 2 □ 3 □ 4 □ 5
Road guidance□ 1 □ 2 □ 3 □ 4 □ 5□ 1 □ 2 □ 3 □ 4 □ 5
Convenience of travel and transport options□ 1 □ 2 □ 3 □ 4 □ 5□ 1 □ 2 □ 3 □ 4 □ 5
Attractiveness of entrances and exits□ 1 □ 2 □ 3 □ 4 □ 5□ 1 □ 2 □ 3 □ 4 □ 5
Richness of landscape spatial types□ 1 □ 2 □ 3 □ 4 □ 5□ 1 □ 2 □ 3 □ 4 □ 5
Site safety and accessibility□ 1 □ 2 □ 3 □ 4 □ 5□ 1 □ 2 □ 3 □ 4 □ 5
Use of permeable floor paving□ 1 □ 2 □ 3 □ 4 □ 5□ 1 □ 2 □ 3 □ 4 □ 5
Road fluency□ 1 □ 2 □ 3 □ 4 □ 5□ 1 □ 2 □ 3 □ 4 □ 5
Cultural nature of landscape decoration□ 1 □ 2 □ 3 □ 4 □ 5□ 1 □ 2 □ 3 □ 4 □ 5
Promotion of culture, history, and science education□ 1 □ 2 □ 3 □ 4 □ 5□ 1 □ 2 □ 3 □ 4 □ 5
Distribution and quantity of native plants□ 1 □ 2 □ 3 □ 4 □ 5□ 1 □ 2 □ 3 □ 4 □ 5
Openness of the venue□ 1 □ 2 □ 3 □ 4 □ 5□ 1 □ 2 □ 3 □ 4 □ 5
Artistry of public facilities□ 1 □ 2 □ 3 □ 4 □ 5□ 1 □ 2 □ 3 □ 4 □ 5
Plant viewing□ 1 □ 2 □ 3 □ 4 □ 5□ 1 □ 2 □ 3 □ 4 □ 5
Landscape night lighting artistic□ 1 □ 2 □ 3 □ 4 □ 5□ 1 □ 2 □ 3 □ 4 □ 5
  • Section III: Overall Evaluation
  • How satisfied are you with the current design of the outdoor public space landscape at Wuhan Creative World Industrial Park?
  • ○ Very Dissatisfied ○ Dissatisfied ○ Neutral ○ Satisfied ○ Very Satisfied
  • Thank you very much for your participation and cooperation!

Appendix E. Demographic Characteristics of Respondents

Analysis of the demographic characteristics of the respondents (Table A5) revealed that of the 375 participants, 45.0% and 55.0% were male and female, respectively. The analysis of the identity composition of the respondents revealed that the neighborhood residents of the city were the main group of visitors, accounting for 32.9%. Other major groups include office workers, businessmen, and tourists, with a combined percentage of 67.1%, of which 35.8% are visitors to CH, while 18.3% are businessmen in CWIP. Regarding the peak visiting hours, CH has the highest footfall between 07.00 and 10.00, accounting for 32.7%, while the CWIP has the highest footfall between 17.00 and 20.00, accounting for 37.6%. The analysis of transportation modes shows that the subway is the most popular means of transportation, followed by buses and private cars, reflecting the accessibility of the two areas. On the other hand, the analysis of age distribution reveals that the majority of respondents belong to the age groups of youth, middle-aged, and elderly.
Table A5. Demographic characteristics of the sample.
AttributeFeaturesCHCWIPTotal
Number
of People
Proportion
(%)
Number
of People
Proportion
(%)
Number
of People
Proportion
(%)
GenderMan8249.77140.615345.0
Women8350.310459.418755.0
IdentityBusiness/Tourist5935.83218.39126.8
Nearby resident5835.25430.311232.9
Worker2816.96537.19327.4
Other2012.12414.34412.9
AgeYouth 16–295030.35028.610029.4
Middle-aged 30–495835.27844.613640.0
Middle-aged and elderly 50–653923.62916.66820.0
Aged 65 years or older1810.91810.23610.6
Purpose of tripPlay around6237.67945.114141.5
Go to work5533.34224.09728.5
Shopping/Errands3722.43520.07221.2
Others116.701910.9308.8
Time of trip07.00–10.005432.72614.98023.5
10.00–13.002515.23620.66117.9
13.00 to 17.002012.13318.95315.6
17.00 to 20.004225.56637.610831.8
Other time period2414.5148.03811.2
Mode of tripSubway4627.95028.69628.2
Public transport3219.43218.36418.8
Self-driving3018.2169.14613.5
Cycling2112.73117.75215.3
On foot3621.84626.38224.2

References

  1. Gavrilidis, A.A.; Ciocănea, C.M.; Niţă, M.R.; Onose, D.A.; Năstase, I.I. Urban Landscape Quality Index–Planning Tool for Evaluating Urban Landscapes and Improving the Quality of Life. Procedia Environ. Sci. 2016, 32, 155–167. [Google Scholar] [CrossRef]
  2. Zhang, X.; Du, S.; Wang, Q. Integrating Bottom-up Classification and Top-down Feedback for Improving Urban Land-Cover and Functional-Zone Mapping. Remote Sens. Environ. 2018, 212, 231–248. [Google Scholar] [CrossRef]
  3. Hartter, J.; Ryan, S.J. Top-down or Bottom-Up? Land Use Policy 2010, 27, 815–826. [Google Scholar] [CrossRef]
  4. Bao, Y.; Gao, M.; Zhao, C.; Zhou, X. White Spaces Unveiled: Investigating the Restorative Potential of Environmentally Perceived Characteristics in Urban Parks during Winter. Forests 2023, 14, 2329. [Google Scholar] [CrossRef]
  5. Zhu, X.; Gao, M.; Cheng, X.; Zhao, W. Sleep–the Guarantee of Health! Does the Environmental Perception Characteristics of Urban Residential Areas Affect Residents’ Sleep Quality? Front. Public Health 2023, 10, 1017790. [Google Scholar] [CrossRef] [PubMed]
  6. Yuslim, S.; Indrawati, E. Performance Evaluation of City Parks Based on Sustainable Landscape Design in Jakarta. J. Pembang. Wil. Dan Kota. 2022, 18, 150–163. [Google Scholar] [CrossRef]
  7. Stessens, P.; Canters, F.; Huysmans, M.; Khan, A.Z. Urban Green Space Qualities: An Integrated Approach towards GIS-Based Assessment Reflecting User Perception. Land Use Policy 2020, 91, 104319. [Google Scholar] [CrossRef]
  8. Firmansyah; Soeriaatmadja, A.R.; Wulanningsih, R. A Set of Sustainable Urban Landscape Indicators and Parameters to Evaluate Urban Green Open Space in Bandung City. IOP Conf. Ser. Earth Environ. Sci. 2018, 179, 012016. [Google Scholar] [CrossRef]
  9. Gao, M.; Fang, C. Do Urban Park Spatial Features Influence Public Emotional Responses during Jogging? Evidence from Social Media Data. J. Outdoor Recreat. Tour. 2025, 50, 100862. [Google Scholar] [CrossRef]
  10. Zhang, J.; Liu, J.; Yang, H.; Quan, J.; Wang, L.; He, Q.; Li, F. Satisfaction Evaluation for Underpass Green Spaces in Mountainous Cities under the Perspective of Environmental Perception. Buildings 2023, 13, 1489. [Google Scholar] [CrossRef]
  11. Gao, M.; Zhu, X.; Cheng, X. Safety–Premise for Play: Exploring How Characteristics of Outdoor Play Spaces in Urban Residential Areas Influence Children’s Perceived Safety. Cities 2024, 152, 105236. [Google Scholar] [CrossRef]
  12. Xiao, X.; Ye, Q.; Dong, X. Using Importance–Performance Analysis to Reveal Priorities for Multifunctional Landscape Optimization in Urban Parks. Land 2024, 13, 564. [Google Scholar] [CrossRef]
  13. Lee, K.-C.; Son, Y.-H. Exploring Landscape Perceptions of Bukhansan National Park According to the Degree of Visitors’ Experience. Sustainability 2017, 9, 1306. [Google Scholar] [CrossRef]
  14. Qi, T.; Zhang, G.; Wang, Y.; Liu, C.; Li, X. Research on Landscape Quality of Country Parks in Beijing as Based on Visual and Audible Senses. Urban For. Urban Green. 2017, 26, 124–138. [Google Scholar] [CrossRef]
  15. Van Den Berg, A.E.; Jorgensen, A.; Wilson, E.R. Evaluating Restoration in Urban Green Spaces: Does Setting Type Make a Difference? Landsc. Urban Plan. 2014, 127, 173–181. [Google Scholar] [CrossRef]
  16. Ma, X.; Ma, C.; Wu, C.; Xi, Y.; Yang, R.; Peng, N.; Zhang, C.; Ren, F. Measuring Human Perceptions of Streetscapes to Better Inform Urban Renewal: A Perspective of Scene Semantic Parsing. Cities 2021, 110, 103086. [Google Scholar] [CrossRef]
  17. Ogawa, Y.; Oki, T.; Zhao, C.; Sekimoto, Y.; Shimizu, C. Evaluating the Subjective Perceptions of Streetscapes Using Street-View Images. Landsc. Urban Plan. 2024, 247, 105073. [Google Scholar] [CrossRef]
  18. Zhao, Y.; Liu, J.; Zheng, Y. Preservation and Renewal: A Study on Visual Evaluation of Urban Historical and Cultural Street Landscape in Quanzhou. Sustainability 2022, 14, 8775. [Google Scholar] [CrossRef]
  19. Jiang, S.; Liu, J. Comparative Study of Cultural Landscape Perception in Historic Districts from the Perspectives of Tourists and Residents. Land 2024, 13, 353. [Google Scholar] [CrossRef]
  20. Das, A.; Basu, T. Assessment of Peri-Urban Wetland Ecological Degradation through Importance-Performance Analysis (IPA): A Study on Chatra Wetland, India. Ecol. Indic. 2020, 114, 106274. [Google Scholar] [CrossRef]
  21. Keith, S.J.; Boley, B.B. Importance-Performance Analysis of Local Resident Greenway Users: Findings from Three Atlanta BeltLine Neighborhoods. Urban For. Urban Green. 2019, 44, 126426. [Google Scholar] [CrossRef]
  22. Li, J.; Wang, Q.; Xuan, Y.; Zhou, H. User Demands Analysis of Eco-City Based on the Kano Model—An Application to China Case Study. PLoS ONE 2021, 16, e0248187. [Google Scholar] [CrossRef] [PubMed]
  23. Hu, L.; Fan, J.; Li, C.; Luo, S. Evaluation of Community Commercial Space Design Experience and Optimization Strategy Based on KANO Model. Buildings 2023, 13, 1760. [Google Scholar] [CrossRef]
  24. Martilla, J.A.; James, J.C. Importance-Performance Analysis. J. Mark. 1977, 41, 77–79. [Google Scholar] [CrossRef]
  25. Kano, N.; Seraku, N.; Takahashi, F.; Tsuji, S. Attractive Quality and Must-Be Quality. J. Jpn. Soc. Qual. Control. 1984, 41, 39–48. [Google Scholar]
  26. Lai, I.K.W.; Hitchcock, M. A Comparison of Service Quality Attributes for Stand-Alone and Resort-Based Luxury Hotels in Macau: 3-Dimensional Importance-Performance Analysis. Tour. Manag. 2016, 55, 139–159. [Google Scholar] [CrossRef]
  27. Gobster, P.H.; Ribe, R.G.; Palmer, J.F. Themes and Trends in Visual Assessment Research: Introduction to the Landscape and Urban Planning Special Collection on the Visual Assessment of Landscapes. Landsc. Urban Plan. 2019, 191, 103635. [Google Scholar] [CrossRef]
  28. Xiang, L.; Tian, Y.; Pan, Y. Study on Landscape Evaluation and Optimization Strategy of Central Park in Qingkou Town. Sci. Rep. 2022, 12, 1978. [Google Scholar] [CrossRef]
  29. Niu, Y.; Mi, X.; Wang, Z. Vitality Evaluation of the Waterfront Space in the Ancient City of Suzhou. Front. Archit. Res. 2021, 10, 729–740. [Google Scholar] [CrossRef]
  30. Vavra, T.G. Improving Your Measurement of Customer Satisfaction: A Guide to Creating, Conducting, Analyzing and Reporting Customer Satisfaction Measurement Programs; ASQ Quality Press: Milwaukee, WI, USA, 1997. [Google Scholar]
  31. Imam, K.Z.E.A. Role of Urban Greenway Systems in Planning Residential Communities: A Case Study from Egypt. Landsc. Urban Plan. 2006, 76, 192–209. [Google Scholar] [CrossRef]
  32. Gaspari, J.; Fabbri, K.; Lucchi, M. The Use of Outdoor Microclimate Analysis to Support Decision Making Process: Case Study of Bufalini Square in Cesena. Sustain. Cities Soc. 2018, 42, 206–215. [Google Scholar] [CrossRef]
  33. Tzoulas, K.; Korpela, K.; Venn, S.; Yli-Pelkonen, V.; Kaźmierczak, A.; Niemela, J.; James, P. Promoting Ecosystem and Human Health in Urban Areas Using Green Infrastructure: A Literature Review. Landsc. Urban Plan. 2007, 81, 167–178. [Google Scholar] [CrossRef]
  34. Pasha, S.; Shepley, M.M. Research Note: Physical Activity in Pediatric Healing Gardens. Landsc. Urban Plan. 2013, 118, 53–58. [Google Scholar] [CrossRef]
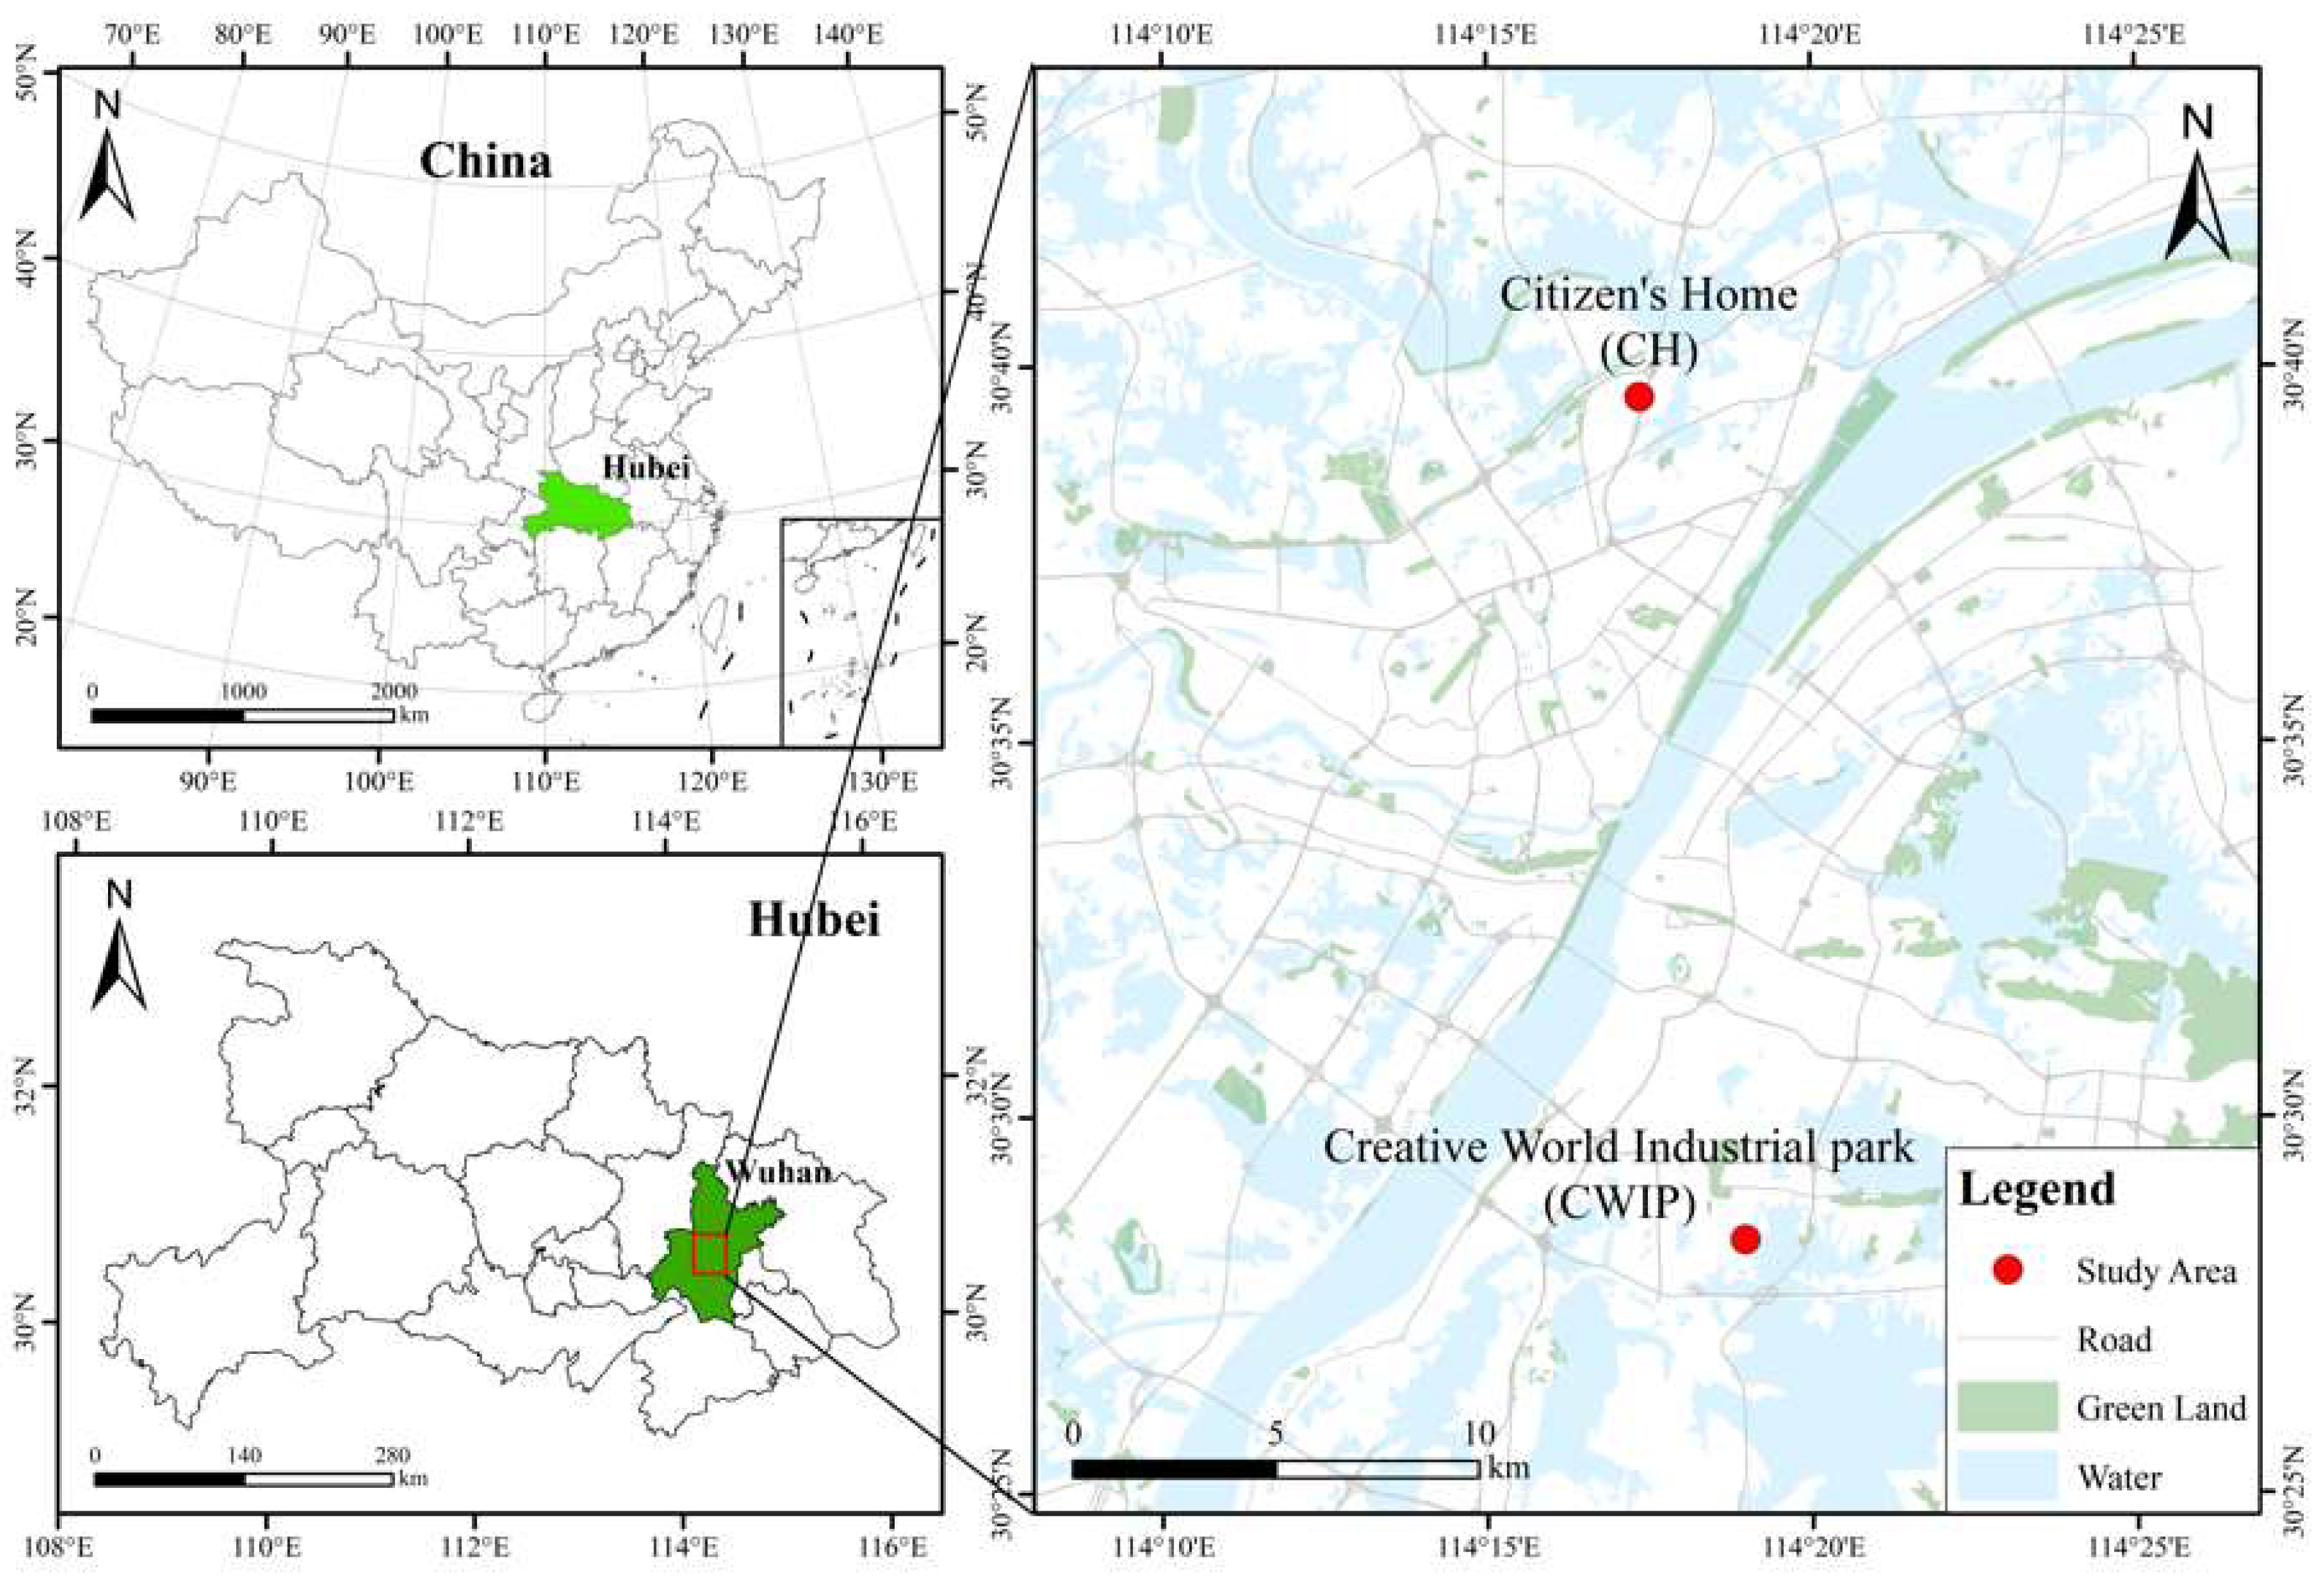
Figure 1. A 2-dimensional measurement model. (a) IPA model (source: self-drawn by the author); (b) KANO model (source: self-drawn by the author).
Sustainability 17 03992 g001
Figure 2. Research framework (source: self-drawn by the author).
Sustainability 17 03992 g002
Figure 3. Research location of CH and CWIP (source: self-drawn by the author).
Sustainability 17 03992 g003
Figure 4. Aerial view. (a) Citizens’ Home; (b) Creative World Industrial Park (source: photo taken by the author).
Sustainability 17 03992 g004
Figure 5. Importance grid (source: self-drawn by the author).
Sustainability 17 03992 g005
Figure 6. The 3-D IPA approach (source: self-drawn by the author).
Sustainability 17 03992 g006
Figure 7. The distribution of each factor of the service perception dimension in the 3-D IPA model.
Sustainability 17 03992 g007
Figure 8. The distribution of each factor of the spatial perception dimension in the 3-D IPA model.
Sustainability 17 03992 g008
Figure 9. The distribution of each factor of the cultural perception dimension in the 3-D IPA model.
Sustainability 17 03992 g009
Figure 10. The distribution of each factor of the aesthetic perception dimension in the 3-D IPA model.
Sustainability 17 03992 g010
Table 1. Two categories of public space profiles.
Research ObjectLandscape Environment TypeLand AreaPublic Space Area
(×103 m2)
Building
Footprint
(×103 m2)
Proportion of
Public Space (%)
Citizens’ Home
(CH)
Green Space
Sculpture
Flower Pond
Pool
6.7015.4151.28680.80
Creative World Industrial Park
(CWIP)
6.4204.9731.47577.46
Table 2. Urban-building outdoor public-space landscape environment user perception scale.
DimensionalityEnvironmental
Perception
Dimension
Serial
Number
Environmental
Perception Factor
Perceived qualityService perceptionaIdentification system guide
bRoad guidance
cThe convenience of travel and transportation options
Spatial perceptiondAttractiveness of entrances and exits
eThe richness of landscape spatial types
fSite safety and accessibility
gThe use of permeable floor paving
hRoad fluency
Cultural perceptioniThe cultural nature of landscape decoration
jPromotion of culture and history and science education
kDistribution and quantity of native plants
lThe openness of the venue
Aesthetic perceptionmArtistry of public facilities
nPlant viewing
oLandscape night lighting artistic
Table 3. The 3-D IPA resource allocation.
Actual
Performance (X)
Implicit
Importance (Y)
Explicit
Importance (Z)
Three-Factor
Theory
Original IPA
Approach
Resource
Allocation
Very highHighHighPerformanceKeepKeep
Very highLowHighBasicKeepReduce
Very highHighLowExcitementReduceKeep
Very highLowLowPerformanceReduceReduce
HighHighHighPerformanceKeepKeep
HighLowHighBasicKeepSlightly reduce
HighHighLowExcitementReduceLow Priority
HighLowLowPerformanceReduceReduce
LowHighHighPerformanceImproveImprove
LowLowHighBasicImproveLow Priority
LowHighLowExcitementLow PriorityKeep/Improve
LowLowLowPerformanceLow PriorityLow Priority
Very lowHighHighPerformanceImproveImprove
Very lowLowHighBasicImproveImprove
Very lowHighLowExcitementLow PriorityKeep/Significantly improve *
Very lowLowLowPerformanceLow PriorityLow Priority
Note: * depends on the availability of the resources.
Table 4. The 3-D IPA results for all outdoor public spaces in buildings (n = 340).
Actual
Performance (X)
Implicit
Importance (Y)
Explicit
Importance (Z)
Three-Factor
Theory
IPA
Strategy
Resource
Allocation
MeanS.D.LevelCoefficientLevelMeanS.D.Level
SEPa3.761.134L0.372L3.691.244LPerformanceLow
Priority
Low
Priority
b3.921.087H0.288L3.571.358LPerformanceReduceReduce
c4.011.010VH0.382H3.771.197LExcitementReduceKeep
SPPd3.761.273L0.448H4.021.074HPerformanceImproveImprove
e3.681.330VL0.402H3.940.994HPerformanceImproveImprove
f4.091.003VH0.397H3.781.248LExcitementReduceKeep
g4.071.084VH0.344L3.811.149HBasicReduceReduce
h3.871.128H0.261L3.591.364LPerformanceReduceReduce
CUPi3.581.345VL0.345L3.910.981HBasicImproveImprove
j3.691.338VL0.504H4.011.039HPerformanceImproveImprove
k3.911.068H0.370L3.601.352LPerformanceReduceReduce
l4.001.085VH0.298L3.701.268LPerformanceReduceReduce
AEPm3.981.052VH0.417H3.751.253LExcitementReduceKeep
n3.821.275L0.508H3.881.097HPerformanceImproveImprove
o4.070.991VH0.320L3.841.272HBasicKeepReduce
Large mean3.88 0.377 3.79
Remark: SEP—service perception; SPP—spatial perception; CUP—cultural perception; AEP—aesthetic perception.
Table 5. The 3-D IPA results in four dimensions.
Actual
Performance (X)
Implicit
Importance (Y)
Explicit
Importance (Z)
Three-Factor
Theory
IPA
Strategy
Resource
Allocation
MeanLevelMeanLevelMeanLevel
CH
SEP3.98VL0.407L3.65LPerformanceReduceLow priority
SPP4.02VH0.426L3.93HBasicKeepReduce
CUP3.87H0.391L3.87HBasicImproveKeep
AEP4.05VH0.434L3.90HBasicKeepReduce
CWIP
SEP3.82L0.492H3.70LExcitementLow priorityKeep/Improve
SPP3.77L0.458H3.73LExcitementLow priorityKeep/Improve
CUP3.73L0.528H3.75LExcitementLow priorityKeep/Improve
AEP3.97VH0.474H3.65LExcitementReduceKeep
Remark: SEP—service perception; SPP—spatial perception; CUP—cultural perception; AEP—aesthetic perception.
Table 6. The 3-D IPA results of CH (n = 165).
Actual
Performance (X)
Implicit
Importance (Y)
Explicit
Importance (Z)
Three-Factor
Theory
IPA
Strategy
Resource
Allocation
MeanS.D.LevelCoefficientLevelMeanS.D.Level
SEPAa3.931.009H0.475H3.52 1.391LExcitementReduceLow Priority
Ab3.951.002H0.438H3.561.394LExcitementReduceReduce
Ac4.050.939VH0.307L3.871.149HBasicKeepKeep
SPPAd3.921.220H0.411H4.151.049HPerformanceKeepImprove
Ae4.051.066VH0.354L3.990.934HBasicKeepImprove
Af4.220.906VH0.343L3.921.142HBasicKeepKeep
Ag4.260.840VH0.552H3.991.099HPerformanceKeepReduce
Ah3.941.010H0.472H3.591.370LExcitementReduceReduce
CUPAi3.671.313VL0.314L3.960.910HBasicImproveImprove
Aj4.151.287H0.406H4.061.080HPerformanceKeepImprove
Ak3.871.089H0.365L3.551.386LPerformanceLow PriorityReduce
Al3.901.198H0.477H4.130.951HPerformanceKeepReduce
AEPAm3.961.067H0.487H3.861.136HPerformanceKeepKeep
An4.051.181VH0.317L3.841.081HBasicKeepImprove
Ao4.150.960VH0.497H3.991.140HPerformanceKeepReduce
Remark: SEP—service perception; SPP—spatial perception; CUP—cultural perception; AEP—aesthetic perception. A—Citizens’ Home (CH).
Table 7. The 3-D IPA results of CWIP (n = 175).
Actual
Performance (X)
Implicit
Importance (Y)
Explicit
Importance (Z)
Three-Factor
Theory
IPA
Strategy
Resource
Allocation
MeanS.D.LevelCoefficientLevelMeanS.D.Level
SEPBa3.601.222VL0.463H3.861.138HPerformanceImproveImprove
Bb3.901.165H0.469H3.581.328LExcitementReduceLow priority
Bc3.971.074VH0.546H3.671.237LExcitementReduceKeep
SPPBd3.901.086H0.545H3.611.308LExcitementReduceLow priority
Be3.611.355VL0.453H3.891.048HPerformanceImproveImprove
Bf3.961.074H0.455H3.651.330LExcitementReduceLow priority
Bg3.891.248H0.407H3.651.174LExcitementReduceLow priority
Bh3.801.227L0.423H3.581.362LExcitementLowKeep/Improve
CUPBi3.501.372VL0.512H3.871.045HPerformance PriorityImprove
Bj3.970.999VH0.543H3.581.379LExcitementImproveKeep
Bk3.951.049H0.590H3.651.322LExcitementReduceLow priority
Bl3.871.187H0.468H3.511.308LExcitementReduceLow priority
AEPBm4.001.039VH0.491H3.641.348LExcitementLowKeep
Bn3.921.014H0.443H3.601.402LExcitement PriorityLow priority
Bo4.001.017VH0.498H3.701.374LExcitementReduceKeep
Remark: SEP—service perception; SPP—spatial perception; CUP—cultural perception; AEP—aesthetic perception; B—Creative World Industrial Park (CWIP).
Table 8. Optimization recommendations for the outdoor public space landscape environments of CH and CWIP.
DimensionalityEnvironmental
Perception
Factor
3-D IPA
Resource Allocation
Landscape Quality
Improvement Suggestions
CHCWIPCHCWIP
Service perceptionIdentification
system guide
Low
priority
Improve(1) Establish a uniform and clear signage system
(2) Increase auxiliary facilities such as voice guidance and touch-screen guides
Road guidanceLow
priority
Low priority(1) Use of green belts, ground material changes, and ground markings
(2) Constructing an online network service cloud platform applet
The convenience of travel and transportation optionsReduceKeepMaintaining easy access to transportation modes for travel
Spatial
perception
Attractiveness of entrances and exitsKeepLow priorityKeeping entrances and exits attractive(1) Adding distinctive lands-cape elements or cultural markers
(2) Installation of small sitting areas or information display walls
The richness of landscape spatial typesReduceImproveReduced complexity of entrance space design(1) Increase the division of multi-functional areas, such as recreational areas, play areas, garden areas, etc.
(2) Introduce abundant vegetation
Site safety and
accessibility
ReduceLow priorityMaintenance of existing site accessibility design and regular inspection and maintenanceIncrease the installation of accessible ramps, accessible parking lots
The use of permeable floor pavingKeepLow priorityMaintaining the utilization of permeable paving on the ground(1) Adopt permeable paving materials
(2) Adding pervious paving type landscaping
Road fluencyLow
priority
Keep/
Improve
(1) Simplify road layout
(2) Add intelligent guidance
Cultural perceptionThe cultural nature of landscape
decoration
ImproveImprove(1) Adding sculptures and other works by local artists
(2) Shaping landscape vignettes using regional materials and traditional crafts
Promotion of culture and history and science educationKeepKeepMaintaining the cultural atmosphere and character of the premises
Distribution and quantity of native plantsReduceLow priorityReduce the planting of overly complex flower types and plant more varieties that are suited to the local climate and soilFollow the natural growth pattern and use different levels of plant configuration
The openness of the venueKeepLow priorityKeeping event venues open and flexible
Aesthetic perceptionArtistry of public facilitiesKeepKeepMaintain artistic design of public facilities
Plant viewingReduceLow priorityCapitalize on the ornamental value of ornamental garden plants(1) Select multi-seasonal plant species
(2) Create interactive plant viewing experiences
Landscape night lighting artisticKeepKeepMaintain the artistic and visual appeal of the landscape nightscape
Disclaimer/Publisher’s Note: The statements, opinions and data contained in all publications are solely those of the individual author(s) and contributor(s) and not of MDPI and/or the editor(s). MDPI and/or the editor(s) disclaim responsibility for any injury to people or property resulting from any ideas, methods, instructions or products referred to in the content.

