Article

Efficiency of National Governance in Managing Long-Term Greenhouse Gas Emission Reduction in the Agricultural Sector Towards the Thailand 5.0 Goal

by
Pruethsan Sutthichaimethee
1,2,3,
Phayom Saraphirom
1,2 and
Chaiyan Junsiri
1,2,3,*
1
Department of Agricultural Engineering, Faculty of Engineering, Khon Kaen University, Khon Kaen 40002, Thailand
2
Agricultural Machinery and Postharvest Technology Center, Khon Kaen University, Khon Kaen 40002, Thailand
3
Postharvest Technology Innovation Center, Science, Research and Innovation Promotion and Utilization Division, Office of the Ministry of Higher Education, Science, Research and Innovation, Bangkok 10400, Thailand
*
Author to whom correspondence should be addressed.
Sustainability 2025, 17(9), 3959; https://doi.org/10.3390/su17093959
Submission received: 16 February 2025 / Revised: 24 April 2025 / Accepted: 25 April 2025 / Published: 28 April 2025

Abstract

:
This study aimed to develop a strategic management model for the agricultural sector to effectively reduce greenhouse gas emissions in the future, primarily focusing on increasing agricultural waste. This study was built upon a model known as the Path Analysis with Simultaneous Equation System based on Full Information Maximum-Likelihood (Path-SFIML) Model, which has been thoroughly validated for its validity, measurement of model fit, and absence of spurious results. The findings revealed that the environmental sector is with the has low capacity to readjust to equilibrium, requiring thousands of years to recover. Therefore, this study proposes a new policy scenario for urgent national management through scenario planning. Based on the research results, the key indicators identified for scenario planning include clean technology, waste biomass, organic waste treatments, and renewable energy. These indicators must be prioritized to effectively manage the increase in agricultural waste. This study demonstrates that implementing these measures would reduce the growth rate of agricultural waste to 30.38% (2037/2018) and decrease the growth rate of greenhouse gas emissions to 36.20% (2037/2018). These rates remain within the national safety threshold, which is set at 1302 Gg CO2e. This study also derived strategic guidelines from stakeholders to enhance the dissemination of research findings and address gaps in quantitative research, enabling more appropriate strategy formulation. It was found that the key approach to defining the new scenario policy in this research is suitable but requires improvements in criminal law, administrative law, and environmental law to ensure they are relevant and enforceable in the present context. Hence, the 20 Year National Strategy must urgently adopt this critical tool for decision-making to achieve sustainable green environmental goals.

1. Introduction

Global warming is a major issue of global concern due to its widespread impacts, affecting all sectors and causing continuous environmental changes. At the second major conference in 1992, known as the Earth Summit, 179 countries worldwide participated and signed international agreements [1]. This marked a significant milestone in global cooperation for change, defining 27 targets, which all participating countries committed to strictly adhere to. Following the summit, nations worldwide became proactive in striving to meet these established goals, particularly focusing on reducing greenhouse gas emissions across all production sectors [2]. Key areas of focus included energy and electricity, transportation, and agriculture. Developed countries, such as Canada, Japan, and the Netherlands, have successfully implemented efficient strategies with well-defined, strict national management plans, combining proactive and reactive measures. These nations have demonstrated continuous improvement in addressing the challenges of global warming [3].
For Thailand, following the 1992 Earth Summit, the government has continuously implemented measures to address climate change. These efforts are embedded in national strategy designed to achieve sustainable development, with a focus on advancing economic, social, and environmental growth simultaneously. Furthermore, there is another key initiative complementing the strategy, and that is the long-term 20 Year National Strategy (2018–2037) [1,2]. This strategy was outlined in the 2017 Thai Constitution, Section 6, Article 65, which states: “The State shall formulate a National Strategy as a framework for sustainable national development based on good governance principles. This strategy shall guide the formulation of various plans to ensure coherence and integration, driving collective efforts toward achieving shared goals [3]. The preparation, goal setting, timeframe for achieving the goals, and the content of the National Strategy shall follow the criteria and procedures prescribed by law. The law must also include provisions for inclusive public participation and consultation across all sectors” [1,2,4].
This particular National Strategy places a primary focus on achieving a green environment and is structured around six core strategic areas [2,5,6]:
  • Security Strategy—Enhancing national security and stability.
  • Competitiveness Strategy—Building competitive capabilities.
  • Human Development Strategy—Fostering human potential and skills development.
  • Social Equality Strategy—Promoting social equality and equity.
  • Environmental Quality Growth Strategy—Advancing growth in harmony with environmental sustainability.
  • Public Sector Management Strategy—Balancing and improving the efficiency of public administration.
Over the past seven years (2018–2024), Thailand has demonstrated consistent progress in implementing Strategies 1–4 under its National Strategy. The country has made continuous economic and social advancements in line with the plan, with particular improvements in competitiveness. Thailand has steadily increased its market share, especially in agricultural products, where the country has a significant competitive advantage. Key exports, such as rice, durian, and palm oil, remain highly demanded by international markets [7]. Despite facing strong competition from major players like China and Vietnam, Thailand has successfully maintained and expanded its market share, resulting in increased national revenue. Additionally, the country has seen 56% growth in agro-industrial activities over the past seven years, a remarkable increase. This sector has been crucial in boosting agricultural production for both domestic consumption and export. Given that agriculture remains Thailand’s most critical and primary industry, much of the nation’s economic activities and export revenue depend on it [3,8]. The agricultural sector consistently contributes to GDP growth, with an annual growth rate of approximately 2%. This growth underscores the significant income generated by the sector. Thailand has also attracted investors to its agricultural industries, leading to greater integration of agricultural products into the economy. This has created more jobs and improved income levels for citizens, enabling many to lift themselves and their families out of poverty [1]. By 2024, most Thai citizens engaged in agriculture reported better living standards and a steady reduction in poverty. Moreover, Thailand has ensured universal access to basic education, providing its population with opportunities to gain stable employment and contribute to national stability. While Thailand’s achievements in Strategies 1–4 reflect successful governance and socioeconomic development, the same cannot be said for Strategies 5–6. The country has struggled to meet its green environmental goals, failing to make meaningful progress toward sustainable environmental practices [2,3,9].
Moreover, despite Thailand’s current implementation of the BCG (Bio-Circular-Green) Model, a holistic economic development policy aimed at advancing the economy in three dimensions simultaneously, challenges remain. The three key economies under this model include: Bio Economy, focusing on the efficient utilization of biological resources; Circular Economy, emphasizing the maximization of resource reuse and recycling; and Green Economy, addressing pollution to sustainably mitigate environmental impacts. Even with these initiatives, greenhouse gas emissions continue to rise steadily. The growth rate remains well beyond the carrying capacity, failing to align with sustainable environmental goals [1,10,11].
In terms of environmental performance during the past seven years, the agricultural sector has been identified as the highest contributor to greenhouse gas emissions (2024). This is largely due to the consistently high levels of agricultural waste, which have led to a continuous increase in carbon dioxide, methane, and nitrous oxide emissions. These gases are major drivers of escalating greenhouse gas emissions, making the agricultural sector the most significant contributor to climate change. The adoption of these policies, while aiming for economic growth, has inadvertently exacerbated environmental degradation, posing a substantial challenge to Thailand’s sustainability goals. In 2024, the agricultural sector, including both basic agriculture and agro-industry, accounted for a significant (50.05%) increase in greenhouse gas emissions, amounting to 255,345.09 GgCO2eq. These emissions stemmed from energy consumption (20.05%), transportation (19.15%), and basic agriculture, including crop cultivation (44.57%), livestock farming (13.01%), biomass burning from agricultural waste (2.02%), and urea fertilizer application (1.2%). The energy and industrial transportation sectors followed with a 48.02% increase in emissions, while other sources contributed 2.03% [1,2,12,13].
However, the Thai government has been striving to address environmental issues in the agricultural sector. Over the past seven years, various strategies have been introduced, such as the Zero Waste Agriculture strategy, a key agricultural policy aimed at achieving a green environment. This includes plans to reduce energy consumption in line with green environmental goals. The government has designated this strategy as a national priority, with the aim of achieving success within the framework before 2044 [14]. Additionally, Thailand has implemented multiple management strategies concurrently, based on the belief that simultaneous actions across various dimensions would effectively reduce agricultural waste. However, during the past seven years, outcomes have fallen short of targets [15,16]. Agricultural waste and greenhouse gas emissions have continued to grow exponentially, with growth rates exceeding the carrying capacity set by Thailand. This indicates that the country’s ecosystems are progressively deteriorating, and if this trend persists, the damage may eventually become irreversible [17].
Challenges arising from technical limitations, policy inefficiencies, and budget constraints have led to ineffective government strategies, indicating that Thailand’s environmental governance has not aligned with its plans, making long-term climate change consequences even more severe [18,19]. A major obstacle in national administration efficiency is the lack of essential decision-making tools to determine the proper course of action and prioritize urgent measures. Additionally, past governance has not followed a sustainability policy framework, but has instead managed and analyzed sectors separately, allocating excessive budgets toward economic and social growth while neglecting environmental sustainability. If this trend continues, irreversible ecological damage will occur, affecting all environmental aspects: soil, water, air, and beyond. This study recognizes these critical issues and the gaps in previous studies, as no existing study has developed tools for strategic policy formulation. Past modeling efforts have been rudimentary, lacking validation and robustness, leading to high forecasting errors and misdirected policy decisions, particularly in studies requiring high-performance models. Incorrect policies have resulted in severe implementation failures, further deteriorating the ecosystem. Moreover, Thailand has adopted greenhouse gas reduction tools without thorough analysis, leading to adverse ecological consequences, such as the flawed application of the polluter-pays principle, which, in practice, fails to measure damages accurately and cannot be consistently enforced due to contextual differences between Thailand and other countries. Past policy approaches have focused on isolated aspects, testing one policy at a time and replacing it when it is found to be unsuitable, a process that the ecosystem can no longer afford. Therefore, the Path-SFIML Model, a mixed-method research model, integrates quantitative findings with qualitative research to address weaknesses, ensuring its practical applicability. This model aims to develop the best possible model with high validity and white noise properties, avoiding issues like heteroscedasticity, multicollinearity, and autocorrelation. Compared to previous models, the Path-SFIML Model demonstrates the highest performance, ensuring accurate policy implementation with minimal error. Consequently, long-term national governance must adopt the Path-SFIML Model as a crucial tool to achieve sustainable development in Thailand.

2. Literature Review

Agricultural waste management plays a critical role in achieving sustainable development and promoting environmental conservation. Various approaches have been proposed and implemented to transform agricultural waste into valuable resources, aligning with the principles of circular economy and resource optimization. This literature review section provides a comprehensive overview of innovative waste management techniques that address environmental challenges while enhancing agricultural productivity. One notable approach involves composting agricultural waste to create eco-friendly soil amendments. Lau [20] demonstrated the potential benefits of optimizing composting conditions for palm oil waste, which significantly improved soil quality and plant growth in oil palm nurseries. By incorporating circular economy principles, this method not only mitigates environmental impacts but also enhances agricultural productivity through increased nutrient assimilation. Similarly, Oueld Lhaj [21] investigated the co-composting of sheep manure and green waste, highlighting its effectiveness in producing stable and mature compost with high macronutrient content and low phytotoxic effects, making it suitable for sustainable agricultural practices.
Bogusz [22] explored the use of suspension fertilizers derived from phosphorus waste in polyol production, demonstrating their effectiveness in maintaining macronutrient levels in maize grown for green fodder. This approach addresses the issue of phosphorus scarcity by closing the phosphorus cycle and reducing dependency on mined phosphate ores. Precision agriculture also plays a pivotal role in minimizing agricultural waste and optimizing resource use. Roma [23] developed a GIS-based methodology to manage fertilization variability in olive groves, ensuring the precise application of nitrogen fertilizers tailored to individual plant needs. This method reduces waste, enhances resource efficiency, and aligns with the goals of sustainable agricultural practices. Innovative technologies such as nanotechnology further expand the potential for agricultural waste utilization. Nath [24] reviewed the bio-generation of nanomaterials from agro-waste, emphasizing their applications in water purification, antibacterial agents, and environmental remediation. This approach underscores the potential of agricultural waste as a renewable and sustainable resource for advanced technological applications. Other studies have highlighted the importance of integrated management systems for optimizing resource allocation in agricultural regions. Qin [25] evaluated the coordination of water, energy, and food systems in the Ili River Valley, emphasizing the need for integrated planning to achieve sustainable resource management. Additionally, Kerry [26] proposed spatially variable irrigation management systems for urban turfgrass, demonstrating the potential to reduce water wastage and enhance irrigation efficiency.
Similarly, approaches to agricultural waste management vary widely, incorporating innovative technologies, traditional practices, and sustainable methodologies. Chen [27] highlighted the use of biogas power generation and environmental enzyme technology in China to recycle agricultural waste, emphasizing their role in achieving carbon neutrality and fostering green energy transitions. Similarly, composting has emerged as a pivotal strategy for valorizing waste, with Oueld Lhaj [28] advocating for its environmental, economic, and agricultural benefits in enhancing soil fertility, especially in Morocco. Mechanized composting processes, as demonstrated by Hashim [29], significantly improve the efficiency and quality of compost, highlighting the benefits of using windrow turner machines for uniform decomposition and nutrient enrichment. Vermicomposting, as discussed by Gabur [30], transforms winemaking by-products into high-value organic fertilizers, promoting sustainable viticulture practices aligned with circular economy principles. Beyond composting, Nicastro [31] explored the valorization of agri-food residues into bio-based products like bioenergy, though regulatory barriers in Europe impede widespread adoption. Innovative predictive models proposed by Al-Shoffe [32] aimed to minimize postharvest food loss, enhancing resource efficiency and supporting food security. Addressing wastewater challenges in arid regions, Alresheedi [33] introduced a decentralized wastewater treatment system that is cost-effective and environmentally sustainable, garnering community acceptance for resource conservation. Furthermore, Munoz-Quezada [34] explored the bioethical issues of environmental conflicts in Chile’s pig industry, focusing on rural communities in the Maule Region. Through an analysis of over 790 documents, including reports and community testimonies, the study revealed severe environmental harm, including pollution from pig farm waste, which led to health problems such as respiratory issues and psychological stress. The study also highlighted socio-economic impacts, including unsustainable water use and negative effects on local agriculture.
Mitigating greenhouse gas (GHG) emissions in the agricultural sector requires a combination of various strategies. In rice cultivation, practices such as selecting high-yield, low-emission varieties and applying water management techniques like Alternate Wetting and Drying (AWD) can significantly reduce methane emissions (Zhang) [35]. Optimizing nitrogen management is another key strategy, with practices like efficient fertilizer use and controlled irrigation helping to reduce nitrous oxide emissions (Bu) [36]. Integrating biochar into soil management has also proven effective in improving soil properties, enhancing carbon sequestration, and reducing GHG emissions (Wang) [37]. Additionally, incorporating organic materials like maize straw into soil can mitigate nitrous oxide emissions and improve carbon and nitrogen balance (Wang) [38]. Water and nitrogen management practices in integrated systems like rice-crab co-culture have also shown promise in reducing GHG emissions while enhancing yields (Xu) [39]. Furthermore, optimizing soil moisture and improving composting processes, such as adding ferrous sulfate to compost, can lower methane and nitrous oxide emissions (Geng) [40]; (Zhang) [41]. Additionally, livestock production, especially enteric fermentation, is a significant source of GHG emissions, with studies highlighting the environmental impact of enteric fermentation in both the EU and the Least Developed Countries (LDCs). In these regions, livestock systems evolve rapidly, and stronger economic incentives may be necessary to improve eco-efficiency and policy effectiveness (Zafeiriou) [42]. Similarly, methods like covering livestock slurry storage ponds with straw have proven effective in reducing GHG emissions from livestock production (Turbí) [43].
In addition to crop and soil management, strategies for livestock and land management also play a significant role in reducing emissions. The use of emerging technologies for real-time monitoring of methane emissions from livestock can help inform more sustainable farming practices (O’Connor) [44]. Livestock farming efficiency can be improved through better feeding practices and farm management, as seen in dairy sheep farms in Greece (Sintori) [45]. Additionally, changes in land management practices, such as avoiding residue burning in rice production and transitioning to more sustainable crop systems, can help reduce carbon emissions (Arunrat) [46]; (Shanmugam) [47]. Meanwhile, the adoption of nitrogen threshold boundaries in nitrogen management has demonstrated potential in reducing both nitrogen surplus and GHG emissions without compromising crop yields (Li) [48]. Effective water and nitrogen management is also crucial for reducing GHG emissions. Studies have shown that optimized water-nitrogen co-regulation in soybean-maize systems can enhance yields and mitigate emissions (Yang) [49]. The environmental efficiency of agricultural systems can be improved by optimizing practices across all levels, from soil and crop management to livestock and land use, thereby contributing to the global effort of mitigating climate change while ensuring sustainable agricultural productivity (Genstwa) [50]; (Hatano) [51].
In a nutshell, the literature highlights a wide range of innovative and sustainable agricultural waste management strategies that align with the principles of the circular economy. These approaches, including composting, bio-based product valorization, precision agriculture, and the integration of emerging technologies such as nanotechnology, play a critical role in enhancing resource efficiency, reducing environmental impacts, and promoting agricultural productivity. Moreover, mitigating greenhouse gas emissions through optimized water, nitrogen, and livestock management practices further contributes to sustainable agricultural development. Overall, these methods demonstrate the potential for transforming agricultural waste into valuable resources, fostering environmental conservation, and supporting long-term agricultural sustainability.
Upon completing a review of existing research, we developed the Path Analysis with Simultaneous Equation System based on Full Information Maximum-Likelihood (PA-SES-FIML) Model. This model explains the causal influences and relationships among latent variables within the framework of sustainability policy. The model estimates relationships using the Full Information Maximum-Likelihood (FIML) method, which is a robust statistical technique. In this model, four latent variables are defined: economic, social, civil politics, and environmental. Each latent variable is associated with a set of indicators, which are observed variables. These indicators are critical for capturing the various dimensions of each latent variable and contribute to understanding the complex relationships and interdependencies within the sustainability framework. A total of 25 indicators are used, including urbanization rate ( U r e ) , industrial structure ( U r t ) , export–import ( E x m ) , investment ( P i m ) , government expenditure ( P g e ) , foreign tourism rate ( F t r ) , employment rate ( E r r ) , health and illness rate ( H e r ) , education rate ( E d r ) , finance rate ( F i r ) , human resource rate ( H i r ) , income distribution rate ( D i m ) , clean technology ( G t r ) , biomass energy ( B i e ) , renewable energy rate ( E i r ) , green material rate ( C m r ) , waste biomass ( W b t ) , organic waste treatment ( O w t ) , taxonomy rate ( T x r ) , biofertilizer rate ( B i f ) , total energy consumption ( T e r ) , energy intensity rate ( T i r ) , carbon dioxide emissions ( C O 2 ) , methane ( C H 4 ) , and nitrous oxide ( N 2 O ) . We found that past studies lacked an appropriate model for formulating urgent new scenario policies. Moreover, there is no model with sufficient performance to guide Thailand’s long-term strategic planning effectively. To address this gap, in this study we developed a model that emphasizes meticulous attention to detail, identifying and incorporating critical aspects that other models have overlooked or deemed insignificant. These shortcomings in existing models have led to inaccuracies in research outcomes and their practical applications, resulting in strategic mismanagement at the macroeconomic level in Thailand. This study introduces a model called the Path-SFIML Model, designed to serve as the most effective framework for addressing these challenges, particularly in developing long-term national strategic management plans. A mixed-method research approach was employed, utilizing quantitative research findings to identify weaknesses and gaps, which were then refined with input from stakeholders. The research methodology involved the steps described below (Figure 1) [52,53,54]:
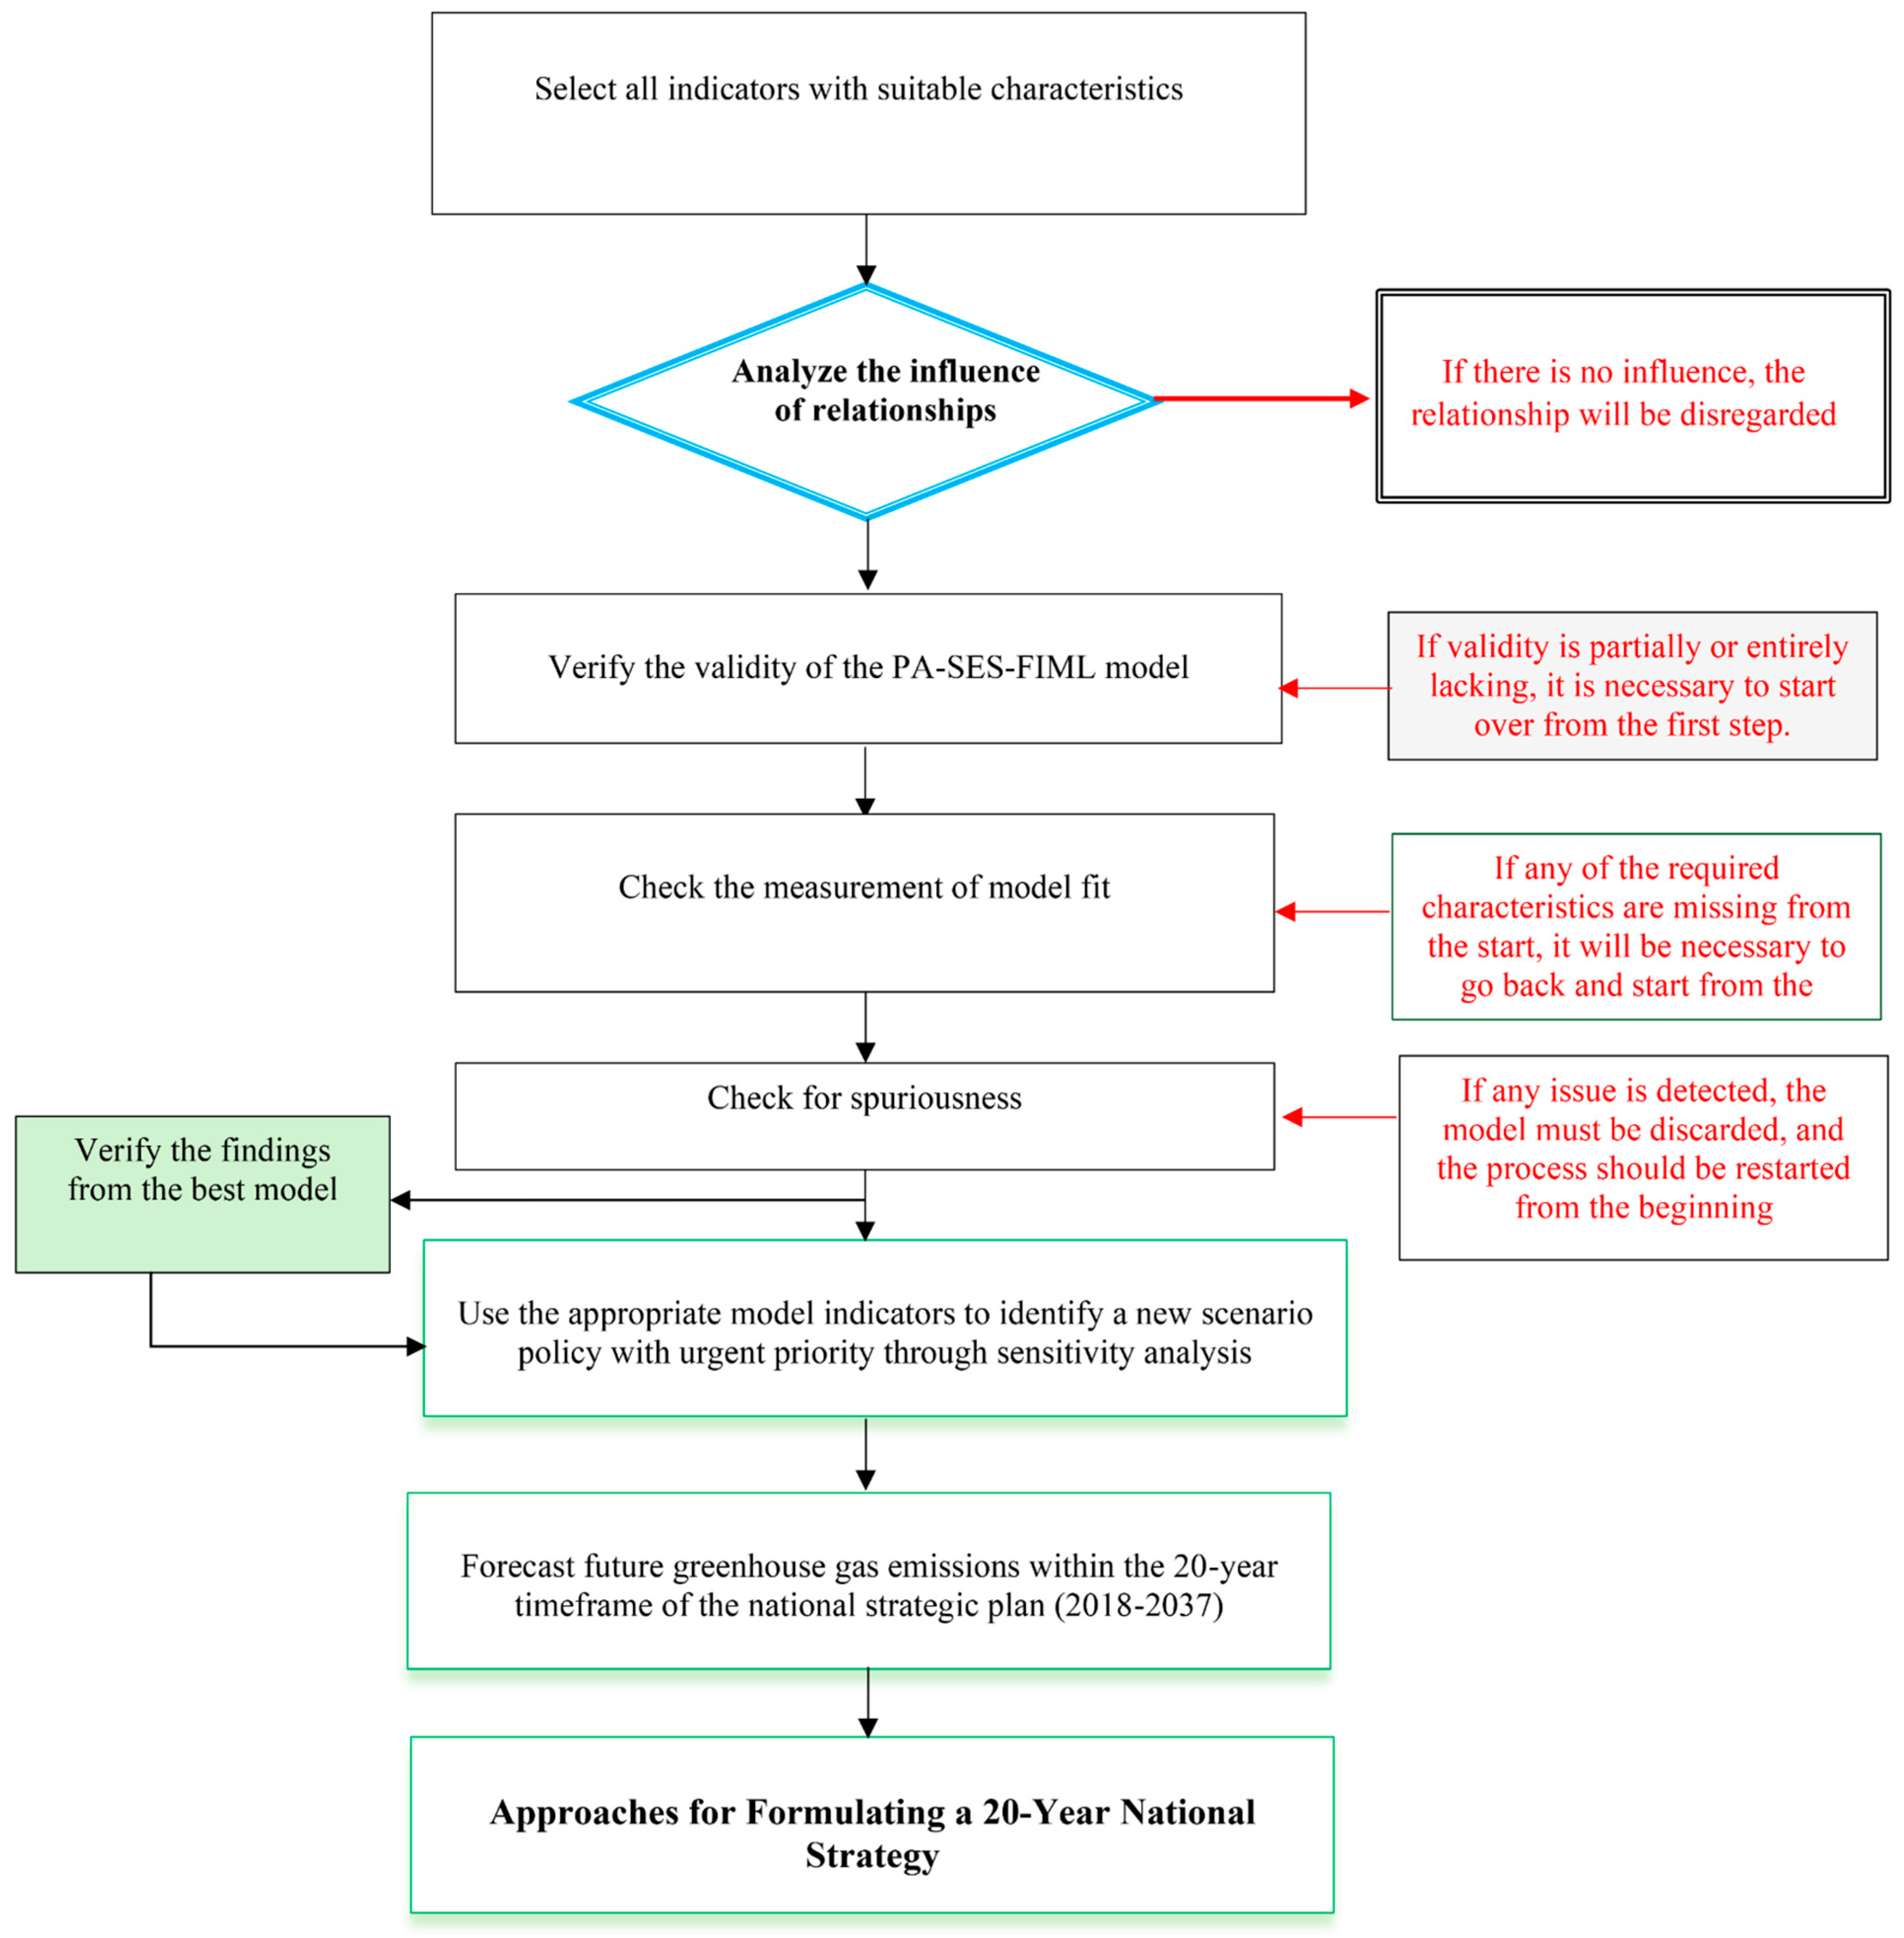
  • Selection of Indicators: The indicators in this research were selected based on the Augmented Dickey–Fuller approach. Secondary data from relevant agencies responsible for information management between 1992 and 2024 were utilized, ensuring consistency and suitability for this analysis. Indicators were categorized into four latent variables: economic, social, civil politics, and environmental. Each latent variable comprises 25 observed indicators, structured according to Thailand’s policy-driven index formulation in each domain. These indicators align with national policymaking and correspond to the research questions for each of the four latent variables, influencing the analysis as causal factors. For this study, secondary data were chosen, which consist of information from key sources responsible for greenhouse gas emissions in Thailand, including the Department of Alternative Energy Development and Efficiency, the Office of the National Economic and Social Development Council (NESDC), the Thailand Greenhouse Gas Management Organization (Public Organization), and the Ministry of Agriculture and Cooperatives.
  • Analysis of Relationships: The influence of relationships was analyzed using the Path-SFIML Model. Any indicator that failed to meet the criteria was excluded from the model. Specifically, indicators that were not stationary at level I(0) or level I(1) were immediately removed, as their inclusion would disrupt the model’s ability to maintain white noise characteristics, ultimately affecting the accuracy of the analysis.
  • Validation Check: The validity of the Path-SFIML Model was checked. If there was a lack of validity in some or all components, the process was restarted from step 1.
  • Measurement of Model Fit: The model’s fit was assessed. If any criterion was not met, the model was revised, and the process was restarted from the beginning.
  • Spuriousness Check: The study ensured that issues related to estimation results, such as heteroscedasticity, multicollinearity, and autocorrelation, did not occur. If any of these issues were detected, the model was revised and restarted immediately.
  • Final Model: Once the best model was identified, the selected indicators were used to identify new urgent scenario policies through sensitivity analysis.
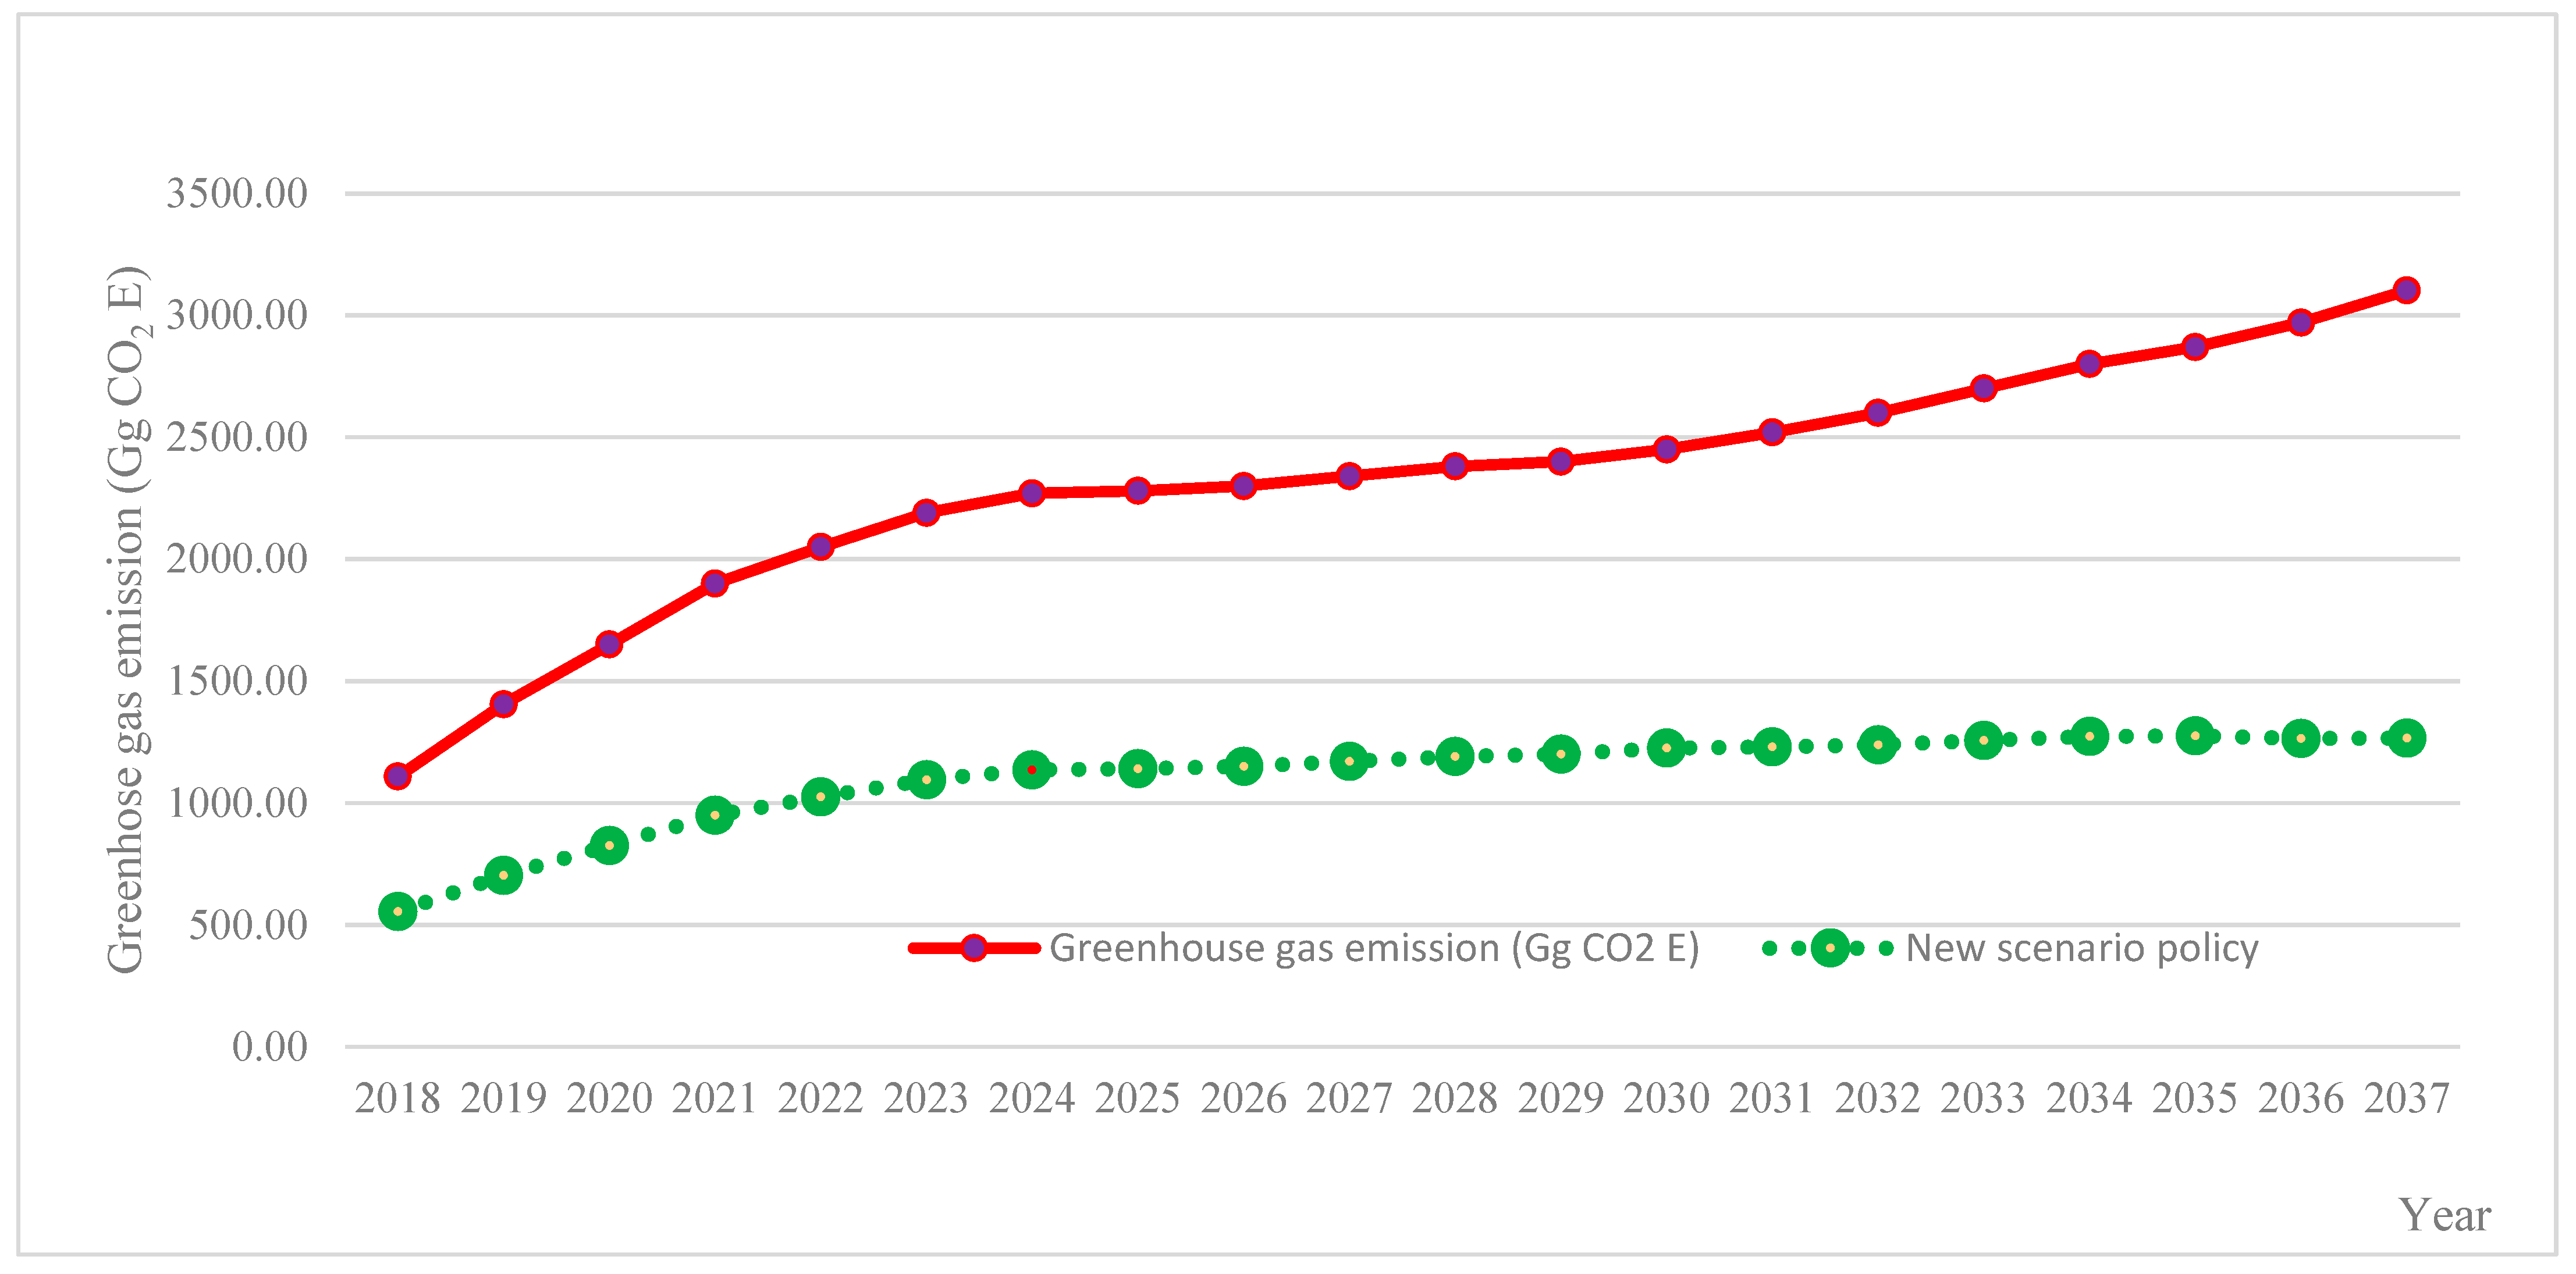
  • Forecasting Greenhouse Gas Emissions: The study forecasted future greenhouse gas emissions within the framework of the country’s 20 Year National Strategy (2018–2037).
  • Qualitative research was conducted by organizing focus groups with stakeholders to gather approaches for formulating long-term national strategies.

3. Material and Methods

This study developed a new model by adapting existing concepts and theories to the present to serve as an essential tool for effective government management. We created a model called the Path analysis with Simultaneous Equation System based on Full Information Maximum-Likelihood (Path-SFIML) Model. This model analyzes the causal relationships of latent variables by using observed variables to explain each sector’s latent variable. We generated the model using a different method than past models, which used the ordinary least square method. In contrast, this study used the Full Information Maximum-Likelihood method, which results in better accuracy and leads to higher white noise compared to past models. The model is described in detail below.

3.1. Structure (Specification) of the Path-SFIML Model

The Path-SFIML Model consists of three parts (Figure 2), as follows [52,53]:
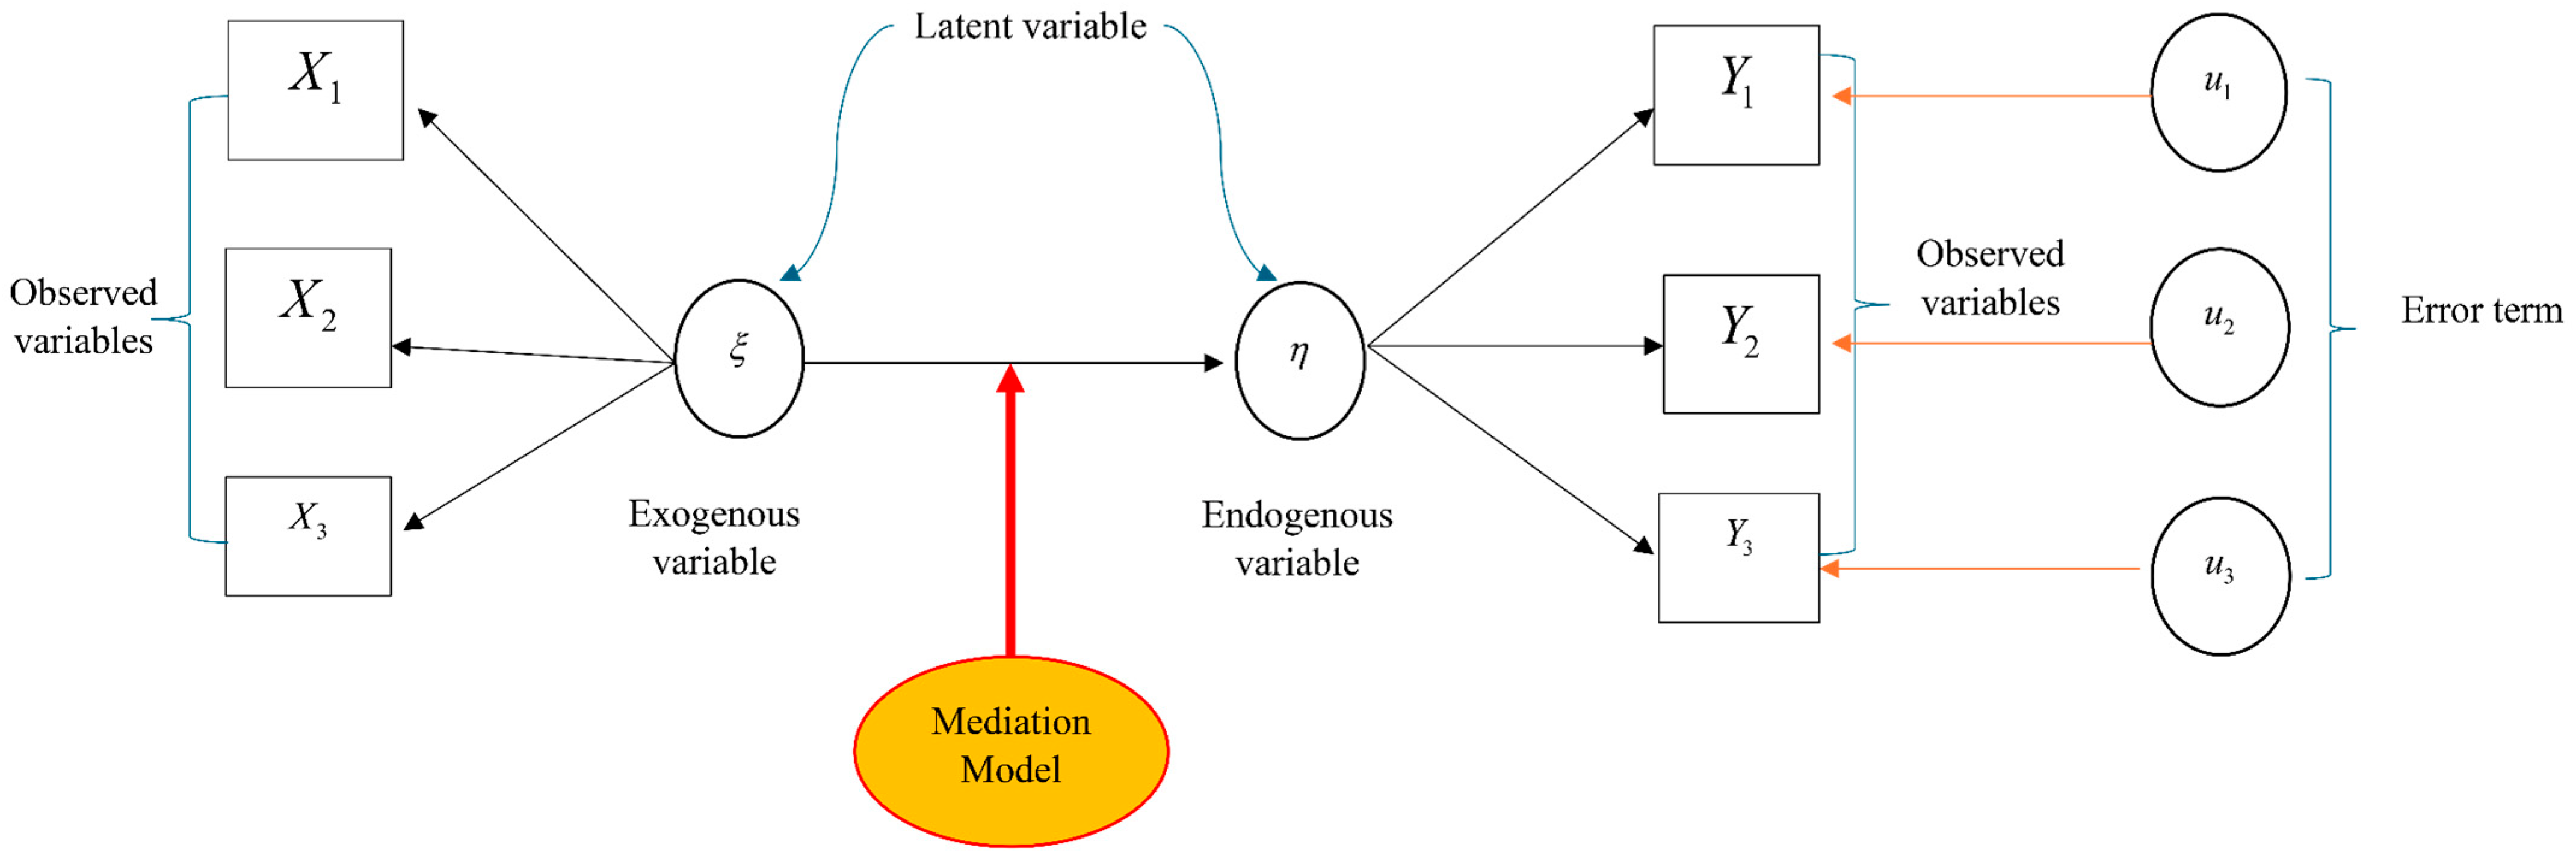
  • Measurement Model: This model specifies the linear relationships between latent variables and observed variables, consisting of: (1) a measurement model for the external latent variables, or a measurement model for the independent variables; and (2) a measurement model for the internal latent variables, or a measurement model for the dependent variables. The analysis process in the measurement model is similar to Confirmatory Factor Analysis (CFA) [52]. The analysis begins with component analysis of the set of observed variables for each latent variable only. In factor analysis, all observed variables have a factor loading in every component. However, in the measurement model, each observed variable has a loading only in the specific latent variable it measures.
  • Structural Model: This model specifies the relationship between exogenous latent variables (independent variables) and endogenous latent variables (dependent variables). The specification of the structural model must be based on sound theory, because the analysis of this model is essentially a validation process, confirming whether the relationships observed from empirical data align with the constructed model.
    Moderated Mediation Model: The mediation model helps explain and expand upon how well the influence of the independent variable is transmitted to the dependent variable. The mediation model enhances the effectiveness of the relationship by increasing its explanatory power and ensuring the influence of the relationship is more realistic.
For this study, the structural relations of the equations were defined, and the equation for i at time t can be written as follows [54]:
β i 1 y 1 t + β i 2 y 2 t + + β g 1 y g t + γ i 1 x 1 t + + γ k 1 x k t = u 1 t t = 1 , 2 n
In Equation (1), y is the endogenous variable, and x is the exogenous variable, or the lagged value of the variable in the system (endogenous variable). This model represents the theory that explains the specification of jointly dependent variables y i t   ( i = 1 , 2 , 3 , , g ; t = 1 , 2 n ) , in terms of predetermined variables x i t   ( i = 1 , 2 , 3 , , k ; t = 1 , 2 n ) and disturbances u i t ( i = 1 , 2 , 3 , , g ; t = 1 , 2 n ) .
Equation (1) can be rewritten for easier understanding as follows [55]:
B y t + Γ x t = u i
Equation (2) can be written in matrix form as follows:
y t = y 1 t y 2 t y g t , x t = x 1 t x 2 t x k t , u t = u 1 t u 2 t u g t
Equation (3) can be written in reduced form as follows:
y t = Π x t + v t
In Equation (4), Π = g . k represents the reduced form coefficients, which are equal to Π = B 1 Γ , and v t = g . 1 represents the reduced form, which is equal to v t = B 1 u t . When Equation (2) is transposed, we get [56,57]:
B y t + x t Γ = u i
From Equation (5), we can write every equation for each sample with n time periods as follows:
y B + x Γ = u
From Equation (6), the absence of correlation in the limit between the predetermined variables and the disturbances can be expressed as follows:
p lim 1 n t = 1 n x i t u i t = 0
Equation (7) shows that the exogenous variable, endogenous variable (which is the lagged endogenous variable), and disturbances are not serially uncorrelated. Therefore, ( 1 / n ) ( x ) must be multiplied with Equation (6), and the probability limit must be applied in conjunction with Equation (7), as follows [58]:
p lim 1 n t = 1 n x y B + p lim 1 n t = 1 n x x Γ = 0
Both sides of Equation (8) can be multiplied by ( 1 / n ) ( x x ) 1 on the front and by ( B ) 1 on the back, as follows:
p lim 1 n t = 1 n x x 1 p lim 1 n t = 1 n x y + p lim 1 n t = 1 n x x 1 p lim 1 n t = 1 n x x y Γ ( B ) 1 = 0
Therefore, the Full Information Maximum-Likelihood (FIML) Model is considered the most perfect estimation method. This method can be applied to both linear and nonlinear equations. From Equation (2), it is known that:
E ( u t ) = 0 , E ( u t u t ) = ,   t = 1 , 2 , 3 , , n
From Equation (10), is a positive matrix, and the error term is assumed to be normally distributed, as follows:
f ( u t ) = 1 ( 2 π ) g / 2 ( det ) 1 / 2 . exp 1 2 u t 1 u t
From Equation (11), if the vector u is specified to be serially uncorrelated, the likelihood for n vectors u 1 , u 2 , u n can be expressed as follows:
p ( u 1 , u 1 , u n ) = ( 2 π ) n g / 2 ( det ) n / 2 1 . exp 1 2 t = 1 n u t 1 u t
Therefore, from Equation (12), the likelihood for y 1 , y 2 , y n can be expressed as follows:
p ( y 1 , y 1 , y n ) = ( 2 π ) n g / 2 det B n ( det ) n / 2 . exp 1 2 t = 1 n ( B y t + Γ x t ) t = 1 n ( B y t + Γ x t )
Therefore, when taking the logarithm of the likelihood in Equation (13), it becomes:
L ( A , ) = α + n log det B n 2 log ( det ) n / 2 . t r 1 A M A

3.2. Testing the White Noise Property

After verifying that u 1 , u 2 , u 3 , u t is a sequence of independent and identically distributed (iid) random variables with constant mean and variance, the time series u t   ( t = 1 , 2 , 3 T ) is called “yeswhite noise”. If it is found that the time series u t has a normal distribution with a mean of 0 and variance σ 2 , we refer to u t as “Gaussian white noise”. If u t is white noise, then the TAC values for all time periods will be equal to zero, meaning the hypothesis test H 0 : ρ 0 = ρ 1 = ρ 2 = = ρ m = 0 should have no statistical significance. Additionally, when examining the TRAC values for all previous time periods, they should also be equal to zero, meaning the hypothesis test H 0 : ϕ k k = 0 , k 0 should have no statistical significance as well. Therefore, we can conclude that the time series being used as a disturbance has no memory, as the values of u in the previous time periods do not affect the value of u in the current period [52,58,59].
After verifying the properties of u t , if it is found that u t does not exhibit the white noise property, we must go back and start from the first step again and recheck the model’s suitability. If it is found that u t still does not exhibit the white noise property, we must return to the first step again. This process continues until u t in the final estimated model exhibits the white noise property, at which point the model can be further analyzed.

3.3. Validity Testing of the Path-SFIML Model

For this study, the validity of the Path-SFIML Model was tested as follows [52,53,58,59]:
  • Discriminant Validity: This refers to H T M T i j < 1 , which is the value derived from the Average Heterotrait–Heteromethod/Geometric Mean of the Average Monotrait–Heteromethod Correlation of construct N and the Average Monotrait–Heteromethod Correlation of construct ξ j .
  • Convergent Validity: In this model, convergent validity must meet the criteria, which include:
    A V E q = 1 p q λ ξ q x p q 2 0.5 , Cronbach’s alpha α q = p p p q c o r r ( x p q , x p / q ) p q + p p p q c o r r ( x p q , x p / q ) . p q p q 1 0.7 , composite reliability (CR) p q = p = 1 p q λ p q 2 p = 1 p q λ p q 2 + p = 1 p q ( 1 λ p q ) 0.06 , and the absence of multicollinearity in the indicators, which can be measured by the variance inflation factor (VIF) V I F = 1 1 R 2 5 , which are the additional criteria used to assess the convergent validity.

3.4. Measurement of Model Fit

For the Path-SFIML Model, the measurement of model fit must be thoroughly examined, and the values obtained from the checks must meet the following criteria [52,53]:
  • The Chi-square statistics must meet the criterion: 2 < χ 2 / d f 3 .
  • The Root Mean Squared Residual must meet the criterion: 0.05 < R M R 0.08 .
  • The Root Mean Square Residual Error of Approximation must meet the criterion: 0.05 < R M S E A 0.08 .
  • The Standard Root Mean Square Residual must meet the criterion: 0 < S R M R 0.05 .
  • The Normal Fit Index must meet the criterion: 0.90 < N F I 0.95 .
  • The Non-Normed Fit Index must meet the criterion: 0.95 < N N F I 0.97 .
  • The Comparative Fit Index must meet the criterion: 0.95 < C F I 0.97 .
  • The Goodness of Fit Index must meet the criterion: 0.90 < G F I 0.95 .
  • The Adjusted Goodness of Fit Index must meet the criterion: 0.85 < A G F I 0.90

3.5. Performance Evaluation of the Path-SFIML Model

For this study, the performance of the Path-SFIML Model was examined by comparing it with past models to verify whether it is suitable for future forecasting. Comparison was made with various models from the past, including the regression model (MRM model), the Artificial Neural Network (ANN model), the Anisotropy Factor (ANIF model), Grey Models GM (1,1), Bayesian network BG (1,1), the Neural Network Model (NN model), and the Convolutional Neural Network. This was demonstrated using statistical method called the root mean squared error (RMSE) and the mean absolute percentage error (MAPE), which are both metrics used to assess the accuracy of forecasting models, as follows [58,59]:
R M S E = 1 n i = 1 n ( Y i Y ^ i ) 2
M A P E = 100 n i = 1 n Y i Y ^ i Y i

4. Empirical Analysis

4.1. Selection of Indicators in Each Sector

In this study, we developed the Path-SFIML Model with four latent variables: economic, social, civil politics, and environmental. Each latent variable is associated with a set of indicators, which are defined as observed variables. A total of 25 indicators were used, including urbanization rate ( U r e ) , industrial structure ( U r t ) , export–import ( E x m ) , investment ( P i m ) , government expenditure ( P g e ) , foreign tourism rate ( F t r ) , employment rate ( E r r ) , health and illness rate ( H e r ) , education rate ( E d r ) , finance rate ( F i r ) , human resource rate ( H i r ) , income distribution rate ( D i m ) , clean technology ( G t r ) , biomass energy ( B i e ) , renewable energy rate ( E i r ) , green material rate ( C m r ) , waste biomass ( W b t ) , organic waste treatment ( O w t ) , taxonomy rate ( T x r ) , biofertilizer rate ( B i f ) , total energy consumption ( T e r ) , energy intensity rate ( T i r ) , carbon dioxide emissions ( C O 2 ) , methane ( C H 4 ) , and nitrous oxide ( N 2 O ) . The selection of indicators in this study was based on those already used by Thailand in the country’s administration. However, some indicators were excluded from the model due to not meeting the necessary criteria, specifically being non-stationary at the first difference level. As a result, this study utilized 25 indicators. The details of the properties of each indicator are shown in the table below.
Table 1 shows the results of the stationarity test using the Augmented Dickey–Fuller method [54]. All indicators were stationary at first difference, with statistical significance at a 99% confidence interval. Therefore, we were able to use all indicators that met the necessary criteria to construct the Path-SFIML Model.

4.2. Analysis of Adaptability to Equilibrium Based on the Path-SFIML Model

We tested the ability of the indicators to reach equilibrium by analyzing their long-term adjustment to equilibrium, using all indicators that were stationary at the first-difference level. The results are presented in the table below.
From Table 2, it is evident that, if any shock occurs, all indicators have the ability to adjust to long-term equilibrium appropriately, with statistical values from the tests exceeding the MacKinnon critical value at a significance level of α = 0.01. This indicates that, in the long term, the indicators can return to equilibrium. As a result of this test, we found that, in the short term, the civil politics sector is the quickest to adjust to equilibrium, at a rate of 88%, followed by the economic sector at 62%, the social sector at 36%, and the environmental sector at a slow rate of 0.2%. From these findings, we concluded that, if the government allows each sector to adjust to equilibrium based on its individual capabilities, the environmental sector will not be able to reach to equilibrium on its own or will take an incredibly long time, maybe thousands of years. In such a case, any change that impacts the system will cause the ecosystem to be unable to cope. Thus, based on this ability to adjust, the government can prioritize which indicator to regulate and control to ensure that it can appropriately reach equilibrium, achieving sustainability both in the short term and in the long term.

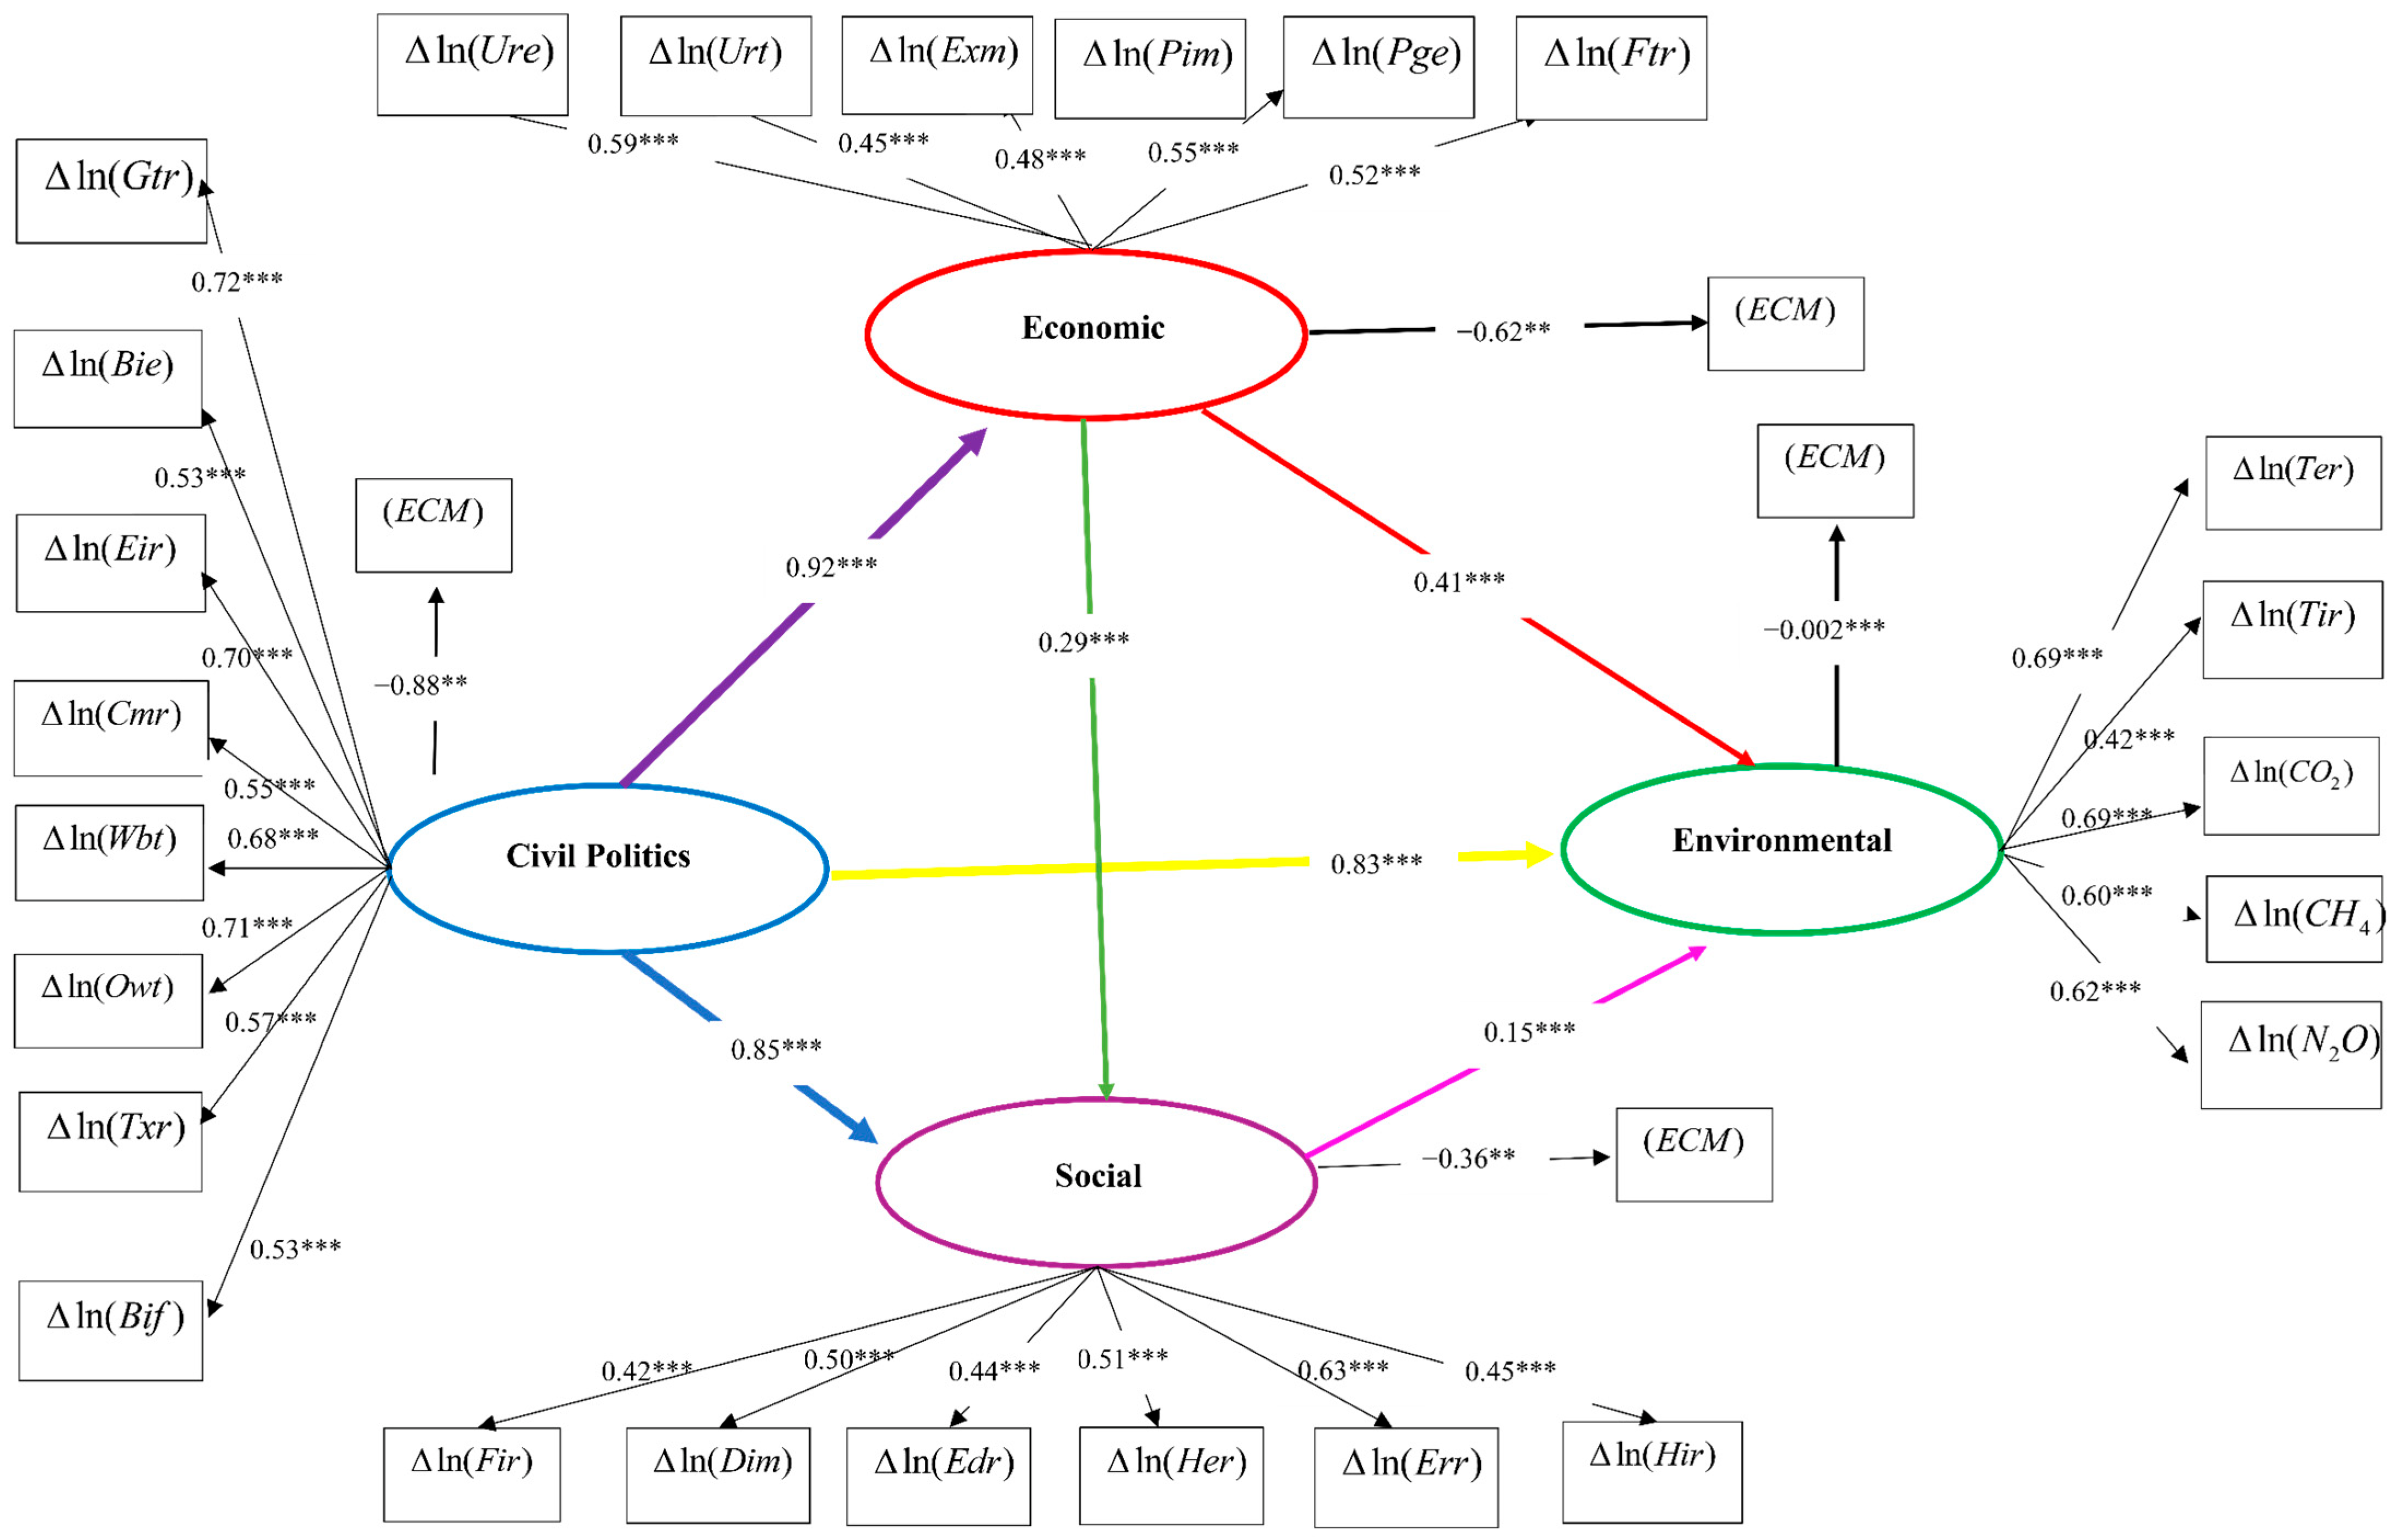
4.3. Analysis of Relationship Influences Using the Path-SFIML Model

The analysis of the causal relationship influence in this research consists of four factors: economic, social sector, civil politics, and environmental, as shown below:
From Table 3, the researcher has assessed the validity of the Path-SFIML Model, with the details as follows:
  • Validity of the Path-SFIML Model: The validity checks revealed that H T M T i j = 0.75 , A V E q = 0.82 , Cronbach’s alpha, α q = 0.91 , and Composite Reliability (CR), p q = 0.08 . Based on the validity check results, the model meets the validity criteria and passes all checks.
  • Measurement of Model Fit: The details are as follows:
    1. Chi-Square Statistics, χ 2 / d f = 2.02
    2. Root Mean Squared Residual, R M R = 0.07
    3. Root Mean Square Residual Error of Approximation, R M S E A = 0.07
    4. Standard Root of Mean Square Residual, S R M R = 0.03
    5. Normal Fit Index, N F I = 0.95
    6. Non-Normed Fit Index, N N F I = 0.97
    7. Comparative Fit Index, C F I = 0.96
    8. Good of Fit Index, G F I = 0.91
    9. Adjusted Goodness of Fit Index, A G F I = 0.86
  • Spuriousness Check: The analysis revealed no issues with heteroscedasticity ( L M t e s t < L M v a l u e ), multicollinearity ( V I F = 2 ), or autocorrelation (Durbin Watson: D.W. = 2.01).
Based on the results of the validity checks for the Path-SFIML Model, it can be concluded that the model meets all the criteria set; thus, the Path-SFIML Model passes all the tests. Therefore, the Path-SFIML Model can be used to analyze the influence of relationships and the resulting impact of changes in these influences, as described below.
As shown in Table 3, when we defined the Path-SFIML Model to include both exogenous and endogenous latent variables, the results of the analysis on the magnitude of the relationship’s influence at a statistical significance level of α = 0.01 were as follows: the civil politics sector had the largest direct effect on the economic sector, with a magnitude of 0.89%; the civil politics sector had a direct effect on the social sector, with an influence magnitude of 0.84%; the civil politics sector had a direct effect on the environmental sector, with an influence magnitude of 0.81%; the economic sector had a direct effect on the environmental sector, with a magnitude of 0.54%; the economic sector had a direct effect on the social sector, with an influence magnitude of 0.36%; and the social sector had a direct effect on the environmental sector, with an influence magnitude of 0.25%. Furthermore, when analyzing the indirect effects, the civil politics sector had indirect effects on the social and environmental sectors, with magnitudes of 0.12% and 0.19%, respectively, at a statistical significance level of α = 0.01 .
Based on these results, it can be concluded that any changes in the civil politics sector will lead to changes in all sectors, as reflected by the magnitude of influence of the changes. Therefore, based on the analysis of influence magnitude from the Path-SFIML Model, which was verified for its validity and suitability as the best model, we made improvements to the model to make it more practical for application. The revised model demonstrated that the environmental sector is an endogenous latent variable, the economic sector is an exogenous latent variable, and the civil politics sector serves as a moderator or conditional variable. The results of the analysis are described below.
As shown in Figure 3, which displays the results of the analysis with the Path-SFIML Model, when a moderator variable was included, the influence of the relationship between latent variables changed. The civil politics sector had the largest direct effect on the economic sector, with an influence magnitude of 0.92% (increased influence) at a statistical significance level of α = 0.01 . Next, the civil politics sector had a direct effect on the social sector, with an influence magnitude of 0.85% (increased influence), at a statistical significance level of α = 0.01 . The civil politics sector also had a direct effect on the environmental sector, with an influence magnitude of 0.83% (increased influence), at a statistical significance level of α = 0.01 . Additionally, it was found that the economic sector had a direct effect on the environmental sector, with an influence magnitude of 0.41% (reduced influence), at a statistical significance level of α = 0.01 . The economic sector also had a direct effect on the social sector, with an influence magnitude of 0.29% (reduced influence), at a statistical significance level of α = 0.01 . Furthermore, the social sector had a direct effect on the environmental sector, with an influence magnitude of 0.15% (reduced influence), at a statistical significance level of α = 0.01 . When analyzing the indirect effects, it was found that the civil politics sector had indirect effects on the social and environmental sectors, with influence magnitudes of 0.10% and 0.15%, respectively (reduced influence), at a statistical significance level of α = 0.01 .
These results indicate that changes in the civil politics sector, which acts as a moderator, will result in changes in all sectors, with reduced influence in both direct and indirect effects. Therefore, the government can set policies effectively and implement them, leading to changes in all sectors. The sensitivity in policy formulation depends on the type of indicator used for each sector. In this study, indicators were measured and used to define a new policy scenario through sensitivity analysis. Sensitivity analysis showed that the indicators with the highest potential for use in new scenario policies are green technology, waste biomass, organic waste treatments, and renewable energy. Indicators that are more suitable for the short term include biomass energy, clean material, employment, and foreign investment. Therefore, the selection of a new scenario policy for urgent indicators and national strategies should prioritize those that can support long-term policy formulation. In this context, indicators such as green technology, waste biomass, organic waste treatment, and renewable energy are crucial for scenario planning. However, in setting national policies, it is essential to incorporate indicators with appropriate characteristics to analyze future plans, ensuring long-term sustainability.

4.4. Waste and Greenhouse Gas Emission Forecasting Model Using the Path-SFIML Model

This study assessed the performance of the Path-SFIML Model before using it for forecasting by comparing it with historical models, including regression models (MRM model), an Artificial Neural Network (ANN model), Anisotropy Factor (ANIF model), Grey Models GM (1,1), Bayesian Network BG (1,1), the Neural Network Model (NN model), and a Convolutional Neural Network. The statistical metrics used for evaluation in this research were MAPE (Mean Absolute Percentage Error) and RMSE (Root Mean Square Error). The analysis results are described below.
The performance analysis of the Path-SFIML Model, as shown in Table 4, showed that this model demonstrated the highest performance, with the lowest statistical values for MAPE and RMSE, at 1.11% and 1.23%, respectively. The model with the next best performance was the Convolutional Neural Network, with MAPE and RMSE values of 2.5% and 2.71%, respectively. The other models were ranked as follows: Neural Network Model (NN model) with MAPE and RMSE values of 2.69% and 2.92%, respectively, Bayesian Network BG (1,1) with MAPE and RMSE values of 2.99%, and 3.09%, respectively, Grey Models GM (1,1) with MAPE and RMSE values of 5.05% and 5.44%, respectively, the Anisotropy Factor (ANIF model) with MAPE and RMSE values of 5.49% and 7.05%, respectively, the Artificial Neural Network (ANN model) with MAPE and RMSE values of 5.52% and 7.11%, respectively, and the Regression Model (MRM model) with MAPE and RMSE values of 16.55% and 17.65%, respectively. Therefore, the Path-SFIML Model is the most suitable for use as a decision-making tool for future policy planning in Thailand. Based on this, we used the Path-SFIML Model to forecast agricultural waste and greenhouse gas emissions for 2018–2037, in alignment with Thailand’s 20 Year National Strategy framework.
The analysis results indicated that the Path-SFIML Model is suitable for long-term forecasting (2018–2037). Therefore, we applied the Path-SFIML Model to indicators that were stationary at the first difference level at a statistical significance level of α = 0.01 . The influence magnitude and direction of relationships were appropriately analyzed. These indicators were then used to establish a new scenario policy, including green technology, waste biomass, organic waste treatments, and renewable energy, aligned with Thailand’s strategic framework, which mandates at least 50% implementation. This analysis provides empirical data to highlight the true benefits of prioritizing urgent actions through scenario planning. The findings are described below.
Figure 4 shows that the volume of agricultural waste in the next 20 years, from 2018 to 2037, in Thailand, under the national management framework according to the sustainability policy, is projected to continuously increase. The growth rate is estimated at 220.10% (2037/2018), equivalent to 5979.04 thousand tons by 2037, which exceeds the carrying capacity limit of 3500 thousand tons (2037). This increase will have a detrimental effect on the environment and significantly impact the agricultural sector and other sectors. For this study, we applied a new scenario policy and found that the volume of agricultural waste is projected to grow by 30.38% (2037/2018), equivalent to 2577.16 thousand tons, by 2037, which is lower than the carrying capacity. Therefore, the results show that the growth rate of agricultural waste, with and without implementation of the new scenario policy, has significantly different environmental impacts. Additionally, it will have a severe impact on greenhouse gas emissions, as described below.
From the findings in Figure 5, it is observed that the growth rate of greenhouse gas emissions increases by 179.71% (2037/2018). However, when the new scenario policy was applied, the growth rate of greenhouse gas emissions decreases significantly, with a growth rate of only 36.20% (2037/2018), equivalent to 1206.10 Gg CO2e. This growth rate is also lower than the defined carrying capacity of 1450 Gg CO2e (from 2018–2037). The results demonstrate that the implementation of a new scenario policy must be urgently carried out as scenario planning in order to ensure that Thailand can meet its green environmental goals and achieve long-term sustainability in line with the 20 Year National Strategy.
However, the analysis performed in this study reveals that past agricultural sector management in Thailand has been entirely ineffective. Agricultural waste and greenhouse gas emissions have continued to rise despite various policies implemented to curb emissions, including both domestic policies and those adapted from international frameworks. These measures have failed to achieve any reduction in greenhouse gas emissions and have instead led to their continuous increase. This study found that introducing a new scenario policy based on the Path-SFIML Model will result in a steady decline in greenhouse gas emissions. Such an approach will enable Thailand to progress toward its long-term national management goals, ultimately achieving net-zero greenhouse gas emissions by 2065.

4.5. Focus Group Meeting with Stakeholders

For this study, after completing the quantitative analysis, we organized a focus group of stakeholders to bridge gaps and enhance the practical application of the findings. The focus group consisted of 20 participants, including individuals directly involved with agriculture waste and greenhouse gas emissions in Thailand. The participants included: five representatives from the Department of Alternative Energy Development and Efficiency; five representatives from the Office of the National Economic and Social Development Council (NESDC); five representatives from the Thailand Greenhouse Gas Management Organization (Public Organization); and five representatives from the Ministry of Agriculture and Cooperatives. The individuals involved hold direct responsibilities for formulating policies and national management plans to achieve net-zero greenhouse gas emissions in Thailand’s agricultural sector by 2065. Each group is accountable for economic, social, and environmental aspects within the sector, consisting of experts with extensive knowledge and specialization in these fields. This focus group discussion aimed to extend the quantitative analysis from this study with additional qualitative insights, addressing gaps in policy formulation for reducing greenhouse gas emissions in the agricultural sector. The findings from this study will contribute to long-term national management planning, ensuring Thailand’s sustainable development and preventing past inefficiencies caused by the absence of appropriate tools. The results of the focus group are summarized below.
In formulating a new scenario policy appropriate to Thailand’s context, which is a crucial indicator for environmental protection and for reducing agricultural waste and greenhouse gas emissions, the following key elements were identified: clean technology, waste biomass, organic waste treatments, renewable energy, electric agricultural equipment, bio-economy, and circular economy. Thus, to ensure the success of the sustainability policy, actions for holistic environmental protection must be urgently implemented alongside the use of the new scenario policy. These actions include:
  • Support mechanisms for biodiversity conservation, which include tree banks, green bonds, pilot measures for payment for ecosystem services (PES), environmental funds, and tax incentives for community forest projects that reduce global warming. Tax reductions should be provided to businesses involved in research, knowledge development, or activities promoting sustainable biodiversity conservation and utilization. Laws should be amended, and new laws enacted, to encourage participation in biodiversity management, such as the Promotion of Marine and Coastal Resources Management Act, B.E. 2558, Forest Plantation Act (Amendment No. 2), B.E. 2558, National Reserved Forest Act (Amendment No. 4), B.E. 2559, Fisheries Act (Amendment No. 2), B.E. 2560, National Environmental Quality Promotion and Protection Act (Amendment No. 2), B.E. 2561, Wildlife Preservation and Protection Act, B.E. 2562, National Parks Act, B.E. 2562, Community Forest Act, B.E. 2562, and Forest Act (Amendment No. 8), B.E. 2562. Additionally, a draft Biodiversity Act, B.E. ……… should be prepared, incorporating mechanisms for collaboration at various levels.
  • In the agricultural sector, actions should include advancing sustainable agricultural systems in land reform areas, establishing mechanisms for provincial wetland management, appointing committees for integrated strategic planning of wetland areas, and ensuring community participation in wetland management under relevant legal frameworks.
  • The government must establish primary agencies under the Ministry of Natural Resources and Environment, Ministry of Public Health, and Ministry of Agriculture and Cooperatives to oversee access to and benefit-sharing of genetic resources. Mechanisms and regulations must be developed or improved for granting permissions and ensuring benefit-sharing from the use of genetic resources and local knowledge. Regulations should include the Fisheries Act (Amendment No. 2), B.E. 2560, and National Parks Act, B.E. 2562. Subcommittees for technical expertise in biodiversity access and benefit-sharing should be appointed. Projects should be implemented to create processes and develop tools and mechanisms for accessing and sharing benefits from biological resources. Preparations should be made for pilot communities regarding regulations and mechanisms for accessing and sharing benefits from genetic resources. Mechanisms and regulations related to benefit-sharing in research communities should also be established. Economic measures and mechanisms should ensure that the financial returns from bio-based products are reinvested into the source ecosystems to support sustainable biodiversity conservation and utilization, such as developing a 20 year bio-economy development strategy.
  • Establishing Guidelines for Climate Change Management and International Trade and Investment Law: International trade and investment law plays a crucial role in climate change issues. Global economic activities, which are supported and facilitated by international trade and investment systems, are significant sources of greenhouse gas emissions. Addressing climate change requires new trade measures. Several environmental measures aimed at tackling climate change impact international trade and, therefore, become issues under international trade law. These measures include not only direct trade-related measures, such as border carbon adjustments implemented by states to reduce potential competitive disadvantages for domestic industries subject to high-cost climate policies, but also broader environmental policies. These include carbon taxes, emissions trading schemes, energy efficiency standards, and subsidies for renewable energy, such as feed-in tariffs. Therefore, to promote the shared benefits of free trade among states, the World Trade Organization (WTO) system imposes several restrictions on states’ freedom to develop national policy measures, including those related to climate change. WTO rules include provisions regarding environmental protection, particularly under the General Agreement on Tariffs and Trade (GATT). A state may justify the use of climate-related trade-restrictive measures under one of the exceptions recognized in Article XX of GATT. This requires a two-step analysis: first, determining whether the measure falls under one of the specified exceptions; and second, assessing whether the measure is applied in compliance with the “chapeau” of Article XX. Under these provisions, a measure that violates GATT rules may still be upheld if it is justified for the protection of human, animal, or plant life or health (Article XX(b)) or if it relates to the conservation of exhaustible natural resources. If such measures are enforced alongside domestic production or consumption restrictions (Article XX(g)), the WTO Appellate Body in the Shrimp/Turtle case observed that the phrase “exhaustible natural resources” in Article XX(g) must be interpreted in light of contemporary environmental concerns. It seems reasonable to argue that the global climate itself constitutes an “exhaustible natural resource”, which would bring climate mitigation policies within the scope of Article XX(g), as such policies are related to the conservation of these resources. Beyond the WTO exceptions, ongoing negotiations aim to establish an Environmental Goods Agreement (EGA) to eliminate tariffs on a wide range of goods that positively impact the climate. This effort seeks to align climate protection measures with trade regulations. In any case, since the climate regime has left the resolution of tensions between trade and climate policy considerations to trade law, the role of trade law in setting standards and resolving disputes becomes crucial. Given that the Paris Agreement lacks provisions for a binding dispute resolution system, trade law’s mechanisms for standard-setting and dispute resolution will play a key role in shaping climate action strategies.
  • The process of raising public awareness in resource management can be carried out in six steps: establishing public understanding, stimulating and creating motivation, persuading for acceptance, guiding for practical implementation, reinforcing continuity, and recognizing and disseminating achievements. This process fosters knowledge, understanding, and realization of responsible and efficient resource utilization, ensuring maximum benefit and sustainability in the future. Effective implementation must be carried out under a participatory approach, beginning with information awareness, followed by collaborative support, feedback collection, decision-making involvement, and citizen empowerment. The public prioritizes transparent and clear information that is free from distortion or bias, complete, factual, and trustworthy, as this influences their ability to make informed decisions. To strengthen participation in policy discussions, forums for open dialogue should be established where all stakeholders can express their views in an atmosphere of unity and mutual trust. Participants should share perspectives based on goodwill, cooperation, and fairness, ensuring discussions remain transparent and free from hidden agendas. Decision-makers should have adequate knowledge and a deep understanding of rational justifications to ensure timely and appropriate decisions. Raising awareness about natural resource and environmental conservation involves both theoretical knowledge and practical policy implementation, educating the public, especially farmers and local communities, about the significance of ecosystems, factors contributing to environmental degradation, and policies that encourage public participation and ownership of natural resources. By integrating education, participation, and policy implementation, sustainable resource management can be achieved, ensuring long-term environmental conservation and collective responsibility for future generations.
  • The government must take urgent action to enhance the absorption of greenhouse gas emissions [60]. According to the carbon cycle, carbon dioxide (CO2) is stored or absorbed in three main sinks: oceans (Blue Carbon), forests (Green Carbon), and the atmosphere. However, the atmospheric carbon sink is problematic since it stores carbon in the form of CO2, a greenhouse gas that contributes to global warming. Therefore, to improve the efficiency of carbon storage and absorption, priority must be given to two main sinks: oceans (Blue Carbon) and forests (Green Carbon), which are detailed as follows:
    • Blue Carbon: Blue Carbon refers to atmospheric carbon in the form of CO2 that is absorbed by marine ecosystems, particularly through key coastal and marine habitats such as mangrove forests, salt marshes, tidal wetlands, seagrasses, and large seaweeds. Among these, mangrove ecosystems play a crucial role in sequestering CO2 and storing it in underwater soil or coastal sediments. The significance of Blue Carbon includes:
      1.1
      The ocean is the world’s largest carbon sink, known as the “Oceanic Carbon Sink”, which absorbs and stores more than a quarter of human-generated CO2 emissions.
      1.2
      Although the biomass of marine plants is relatively small compared to terrestrial plants that store Green Carbon, marine vegetation has a higher carbon sequestration capacity and can store carbon for thousands of years.
      1.3
      Some governments have prioritized addressing marine pollution, recognizing that an effective solution to greenhouse gas emissions should start with tackling ocean pollution on a global scale.
    • Green Carbon: Green Carbon refers to atmospheric CO2 that is absorbed and stored by trees, forests, and land covered with vegetation through photosynthesis. This type of carbon sink is widely recognized as it stores excess CO2 in terrestrial ecosystems, earning it the name “Terrestrial Carbon Sink”. The significance of Green Carbon includes:
      2.1
      Trees and forests serve as highly efficient Green Carbon absorbers due to their long lifespan. In particular, accumulated leaf litter and wood debris in forests store CO2 for centuries.
      2.2
      Forests can rapidly sequester large amounts of CO2. Therefore, afforestation and reforestation efforts are effective means of enhancing carbon storage and absorption.
The world’s natural carbon sinks, including marine ecosystems such as mangrove forests, underwater vegetation, and terrestrial ecosystems such as forests and trees, play a vital role in preventing excess CO2 from entering the atmosphere, thus mitigating the greenhouse effect and global warming. Consequently, conservation, development, and expansion of these ecosystems are critical strategies in combating climate change. In Thailand, both Green Carbon and Blue Carbon must be prioritized. However, the country’s coastal areas are under threat, leading to a decline in available habitats. Restoring and expanding coastal ecosystems is a crucial approach to increasing the capacity of marine vegetation to sequester and store CO2. Furthermore, growing interest from both government and private sectors in marine and coastal conservation reflects the expectation that Blue Carbon could become a key solution for Thailand to achieve a sustainable net-zero greenhouse gas emissions future.
However, findings from the focus group in this research reveal that, in addition to the lack of decision-making tools, Thailand also faces outdated environmental legislation. According to data and recommendations from the Department of Alternative Energy Development and Efficiency, Thailand has continued to enforce the Environmental Protection and Conservation Act of 1992, which is now outdated and ineffective in addressing current environmental challenges. Furthermore, the country’s strong emphasis on economic growth has led to the neglect of necessary legal reforms and the formulation of policies and plans that ensure long-term sustainability. This conclusion aligns closely with the findings of this study, reinforcing the need for strategic measures to enhance governance in the agricultural sector, ensuring efficiency and sustainability in the long run.

5. Discussion

For this study, the Path-SFIML Model was developed as a white noise model that possesses comprehensive qualities in all aspects, including validity, measurement of model fit, and the avoidance of spuriousness. This demonstrates that the Path-SFIML Model is suitable for use as a decision-making tool in national governance to achieve green environmental goals in line with the sustainability policy. This model was designed to address the weaknesses of previous models and to provide the government with a tool that can be applied to support Thailand’s development toward sustainability in both the short and long term. The research findings indicate that the Path-SFIML Model is well-suited for analyzing groups of variables categorized as endogenous latent variables and exogenous latent variables. The model effectively demonstrates the magnitude and direction of relationships, including both direct and indirect effects, which are consistent with the research hypotheses. These findings highlight how changes in one factor can impact another factor, both in terms of extent and direction, making the model highly beneficial for planning and implementing policy changes appropriately. Moreover, the study showed that the Path-SFIML Model can incorporate a moderator variable, allowing for sectoral transformations. Specifically, civil politics can exert influence through both direct and indirect effects, thereby triggering changes across all sectors. This suggests that, when the government adjusts a single indicator, it can induce changes in other sectors, depending on the strength of the relationships. If a shock occurs, the environmental sector was found to have the slowest adaptability in returning to equilibrium, both in the short and long term. It may take a significant amount of time to recover, or might not recover at all, due to the continuous and excessive increase in greenhouse gas emissions, which exceed Thailand’s carrying capacity. Consequently, the impacts of climate change will intensify dramatically. The agricultural sector is expected to be the most severely affected, as it is fundamentally interconnected with all other sectors in Thailand. In addition, the agricultural sector itself is the largest contributor to greenhouse gas emissions in Thailand. Therefore, the 20 Year National Strategic Plan for long-term governance of the country is unlikely to succeed, primarily due to the past lack of critical decision-making tools for policy formulation. Policymakers often assumed that all foreign policies would be equally effective in the Thai context. However, this research clearly demonstrates that, in order to manage the agricultural sector toward achieving green environmental goals aligned with the sustainability policy, it is essential for national leaders to select new scenario policies and rapidly develop them into scenario planning frameworks. This study identified that indicators suitable for long-term national strategic planning include green technology, waste biomass, organic waste treatments, and renewable energy. For short-term planning, appropriate indicators include biomass energy, clean materials, employment, and foreign investment. Once the government understands which indicators should be prioritized, it will be able to set accurate directions that lead to long-term efficiency and effectiveness. This approach will help ensure that administrative focus is placed on the most critical areas, unlike in the past, where the lack of decision-making tools led to repeated governance patterns from one administration to another, often adopting foreign models that did not align with Thailand’s specific context. This study provides a significant pathway for governing the country within the framework of Thailand’s 20 Year National Strategy. This study was conducted under this strategic framework and found strong alignment with several previous studies, including those by Junsiri [16], Arunrat and Pumijumnong [46], Franco et al. [61], and Wattana and Wattana [62].
The quantitative research findings identified suitable indicators for long-term national strategy formulation, including green technology, waste biomass, organic waste treatments, and renewable energy. These align with qualitative research involving directly responsible stakeholders. Additionally, some crucial indicators were identified to further reduce agricultural waste and greenhouse gas emissions, such as electric agricultural equipment, bioeconomy, and circular economy. The findings serve as a vital tool for environmental protection. Therefore, the government must adopt both proactive and reactive measures and systematically adjust policies to achieve green environmental goals. The necessary measures include: (1) support mechanisms for biodiversity by establishing tree banks, green bonds, and piloting Payments for Ecosystem Services (PES), creating environmental funds, tax measures for community forest conservation, and tax incentives for businesses engaged in research and sustainable biodiversity initiatives, and amending and enacting laws to promote biodiversity management participation; (2) agricultural sector development by driving agricultural systems in land reform zones, establishing mechanisms for wetland management at the provincial level, appointing wetland management committees, and creating integrated wetland management strategies, and promoting community-led wetland management under Thai laws; and (3) establishing responsible authorities by forming dedicated agencies with relevant regulations to ensure equitable benefit-sharing and monitoring the use of genetic resources. Appropriate environmental protection indicators must be carefully designed and urgently implemented across all dimensions. High-quality tools enhance decision-making for strategic national planning. Thus, long-term strategy formulation requires integrating both quantitative and qualitative research methodologies to ensure comprehensive application and long-lasting benefits for the country.
In terms of key findings of this study, they differ significantly from previous research. Earlier studies typically separated quantitative and qualitative analyses without integrating them, resulting in fragmented conclusions. Furthermore, prior research did not incorporate causal factor analysis using Path Analysis, which limited their ability to formulate long-term national governance strategies. In contrast, this study introduces a novel analytical approach that integrates both quantitative and qualitative methods, achieving the highest analytical performance. The Path-SFIML Model developed in this study is the first of its kind, specifically designed to optimize forecasting accuracy. This innovation not only advances research methodologies but also provides a strategic framework for future applications. Additionally, this study marks a breakthrough in agricultural sector research by introducing a decision-making tool that can guide policy implementation toward sustainable development. The findings contribute to the expansion of knowledge in agricultural research, offering a roadmap for effective governance and long-term success.
This study suggests that the creation of the Path-SFIML Model as an essential tool for decision-making in helping Thailand achieve green environmental goals under the sustainability policy. Those who implement this research must understand the key principles and precautions in building the model. It is important to be meticulous in constructing and analyzing the results, as forecasting research requires minimizing errors. Moreover, if the predictions can be compared with actual data, this will significantly help researchers evaluate the model’s suitability and performance. This study aimed to demonstrate that past actual data and future forecasting models should align with each other. Furthermore, obtaining the appropriate indicators for scenario planning is critical and should be prioritized to ensure the governance and control of the process are carried out as effectively as possible.
When it comes to suggestions for future research, in future studies, the Path-SFIML Model should be applied across various sectors to encompass all areas of the country’s development. Additionally, comparative analysis with data from other countries should be conducted to identify strengths, weaknesses, crises, and opportunities for Thailand. This comparative approach would provide a broader perspective and enhance the applicability of the model to different national contexts. It is also essential to adopt a mixed-methods research approach to ensure a more comprehensive understanding of the relationships between variables. This approach will help to reduce research gaps and provide a more holistic view of the issues being studied, enhancing the robustness and accuracy of the findings. Furthermore, researchers should be particularly cautious about validity and the potential for spurious relationships when applying the model. The indicators chosen for the model should be thoroughly tested for their relevance and suitability. Any inappropriate indicators can significantly affect the accuracy of future forecasts and undermine the model’s predictive power. In model development and application, researchers must also be mindful of potential issues such as heteroscedasticity, multicollinearity, and autocorrelation. These statistical problems, if left unaddressed, can lead to significant errors in the model’s output and affect the reliability of future projections. Proper testing and correction of these issues are crucial for the model’s long-term effectiveness.
In terms of limitations of the study, achieving Thailand’s green environmental goals is an extremely challenging task, particularly within the framework of the 20- Year National Strategic Plan. Long-term plans are inherently vulnerable to numerous external factors that can hinder their success. One of the most uncontrollable challenges is cross-border greenhouse gas (GHG) emissions from neighboring countries, especially from the agricultural sector. This external pollution significantly burdens Thailand’s environmental management efforts, making it difficult to control emissions effectively. Moreover, international climate change agreements are based on voluntary commitments rather than legally binding regulations, which limits enforcement and accountability. Another major limitation lies in the distortion of agricultural sector data by governmental agencies. Thailand’s policies are often based on inaccurate or misleading data, falsely presenting a continuous reduction in GHG emissions to serve specific interests. This self-deception leads to misguided policies and ineffective environmental strategies. Furthermore, past research and national policy formulation have historically misconceived the influence of the environmental sector within economic and social frameworks. Earlier hypotheses incorrectly assumed that the environmental sector lacked short-term influence on other sectors, when, in fact, its long-term effects are profoundly negative. Such flawed assumptions have contributed to modeling errors, ultimately affecting policy efficiency and strategic decision-making.

Author Contributions

Conceptualization, P.S. (Pruethsan Sutthichaimethee), P.S. (Phayom Saraphirom) and C.J.; methodology, P.S. (Pruethsan Sutthichaimethee), P.S. (Phayom Saraphirom) and C.J.; software, P.S. (Pruethsan Sutthichaimethee), P.S. (Phayom Saraphirom), and C.J.; validation, P.S. (Pruethsan Sutthichaimethee), P.S. (Phayom Saraphirom) and C.J.; formal analysis, P.S. (Pruethsan Sutthichaimethee), P.S. (Phayom Saraphirom) and C.J.; investigation, P.S. (Pruethsan Sutthichaimethee), P.S. (Phayom Saraphirom) and C.J.; resources, P.S. (Pruethsan Sutthichaimethee), P.S. (Phayom Saraphirom) and C.J.; data curation, P.S. (Pruethsan Sutthichaimethee), P.S. (Phayom Saraphirom) and C.J.; writing—original draft preparation, P.S. (Pruethsan Sutthichaimethee), P.S. (Phayom Saraphirom) and C.J.; writing—review and editing, P.S. (Pruethsan Sutthichaimethee), P.S. (Phayom Saraphirom) and C.J.; visualization, P.S. (Pruethsan Sutthichaimethee), P.S. (Phayom Saraphirom) and C.J.; supervision, C.J. and P.S. (Phayom Saraphirom); project administration, C.J. and P.S. (Pruethsan Sutthichaimethee) All authors have read and agreed to the published version of the manuscript.

Funding

This research work was supported by the Research Fund of the Faculty of Engineering, Khon Kaen University under the Research Scholarship for Ph.D. Student projects under Contract Nos. Ph.D-004/2567.

Institutional Review Board Statement

Not applicable.

Informed Consent Statement

Not applicable.

Data Availability Statement

Data are contained within the article.

Acknowledgments

This work was supported by the Research Fund of the Faculty of Engineering, Khon Kaen University under the Research Scholarship for Ph.D. Student projects under Contract No. Ph.D-004/2567. This work was supported by the Postharvest Technology Innovation Center, Science, Research and Innovation Promotion and Utilization Division, Office of the Ministry of Higher Education, Science, Research and Innovation, Thailand, and Agricultural Machinery and Postharvest Technology Center, Khon Kaen University, Thailand.

Conflicts of Interest

The authors declare no conflicts of interest.

References

  1. The World Bank: Energy Use (Kg of Oil Equivalent Per Capita) Home Page. Available online: https://data.worldbank.org/indicator/EG.USE.PCAP.KG.OE (accessed on 5 January 2025).
  2. Office of the National Economic and Social Development Council (NESDC). Available online: https://www.nesdc.go.th/nesdb_en/main.php?filename=index (accessed on 2 January 2025).
  3. Ministry of Digital Economy and Society. Announcement of the Subcommittee on Smart City Promotion and Management on the Award of the Smart City Certification; No. 1; Ministry of Digital Economy and Society: Bangkok, Thailand, 2021. [Google Scholar]
  4. DEPA Thailand. Available online: https://www.depa.or.th/en/digitalservice/smartcity/smart%20city%20manaul (accessed on 7 January 2025).
  5. Thailand Greenhouse Gas Management Organization (Public Organization). Net Zero GHG Emissions. Available online: https://thaicarbonlabel.tgo.or.th/tools/files.php?mod=YjNKbllXNXBlbUYwYVc5dVgyUnZkMjVzYjJGaw&type=WDBaSlRFVlQ&files=TkRrPQ (accessed on 5 January 2025).
  6. Department of Alternative Energy Development and Efficiency. Available online: https://www.dede.go.th/ (accessed on 14 December 2024).
  7. National Statistical Office Ministry of Information and Communication Technology. Available online: https://dl.parliament.go.th/handle/20.500.13072/425815 (accessed on 30 December 2024).
  8. OECD. Historical Crude Oil Import Prices (Indicator), Organization for Economic Co-Operation and Development. Available online: https://data.oecd.org/energy/crude-oil-import-prices.htm (accessed on 10 December 2024).
  9. ONEP. Thailand’s Fourth Biennial Update Report, Office of Natural Resources and Environmental Policy and Planning. Available online: https://www.onep.go.th (accessed on 10 December 2024).
  10. Sutthichaimethee, P. A Framework on Setting Strategies for Enhancing the Efficiency of State Power use in Thailand’s Pursuit of a Green Economy. Int. J. Energy Econ. Policy 2024, 14, 108–120. [Google Scholar] [CrossRef]
  11. United Nations Framework Convention on Climate Change (UNFCCC, Bonn, Germany). The Paris Agreement: An Early Assessment. Environ. Policy Law 2014, 44, 485–488. [Google Scholar]
  12. United Nations Framework Convention on Climate Change (UNFCCC, Bonn, Germany). Global Progress in Environmental Law. Environ. Policy Law 2016, 46, 23–27. [Google Scholar]
  13. Sutthichaimethee, P.; Mentel, G.; Voloshyn, V.; Mishchuk, H.; Bilan, Y. Modeling the Efficiency of Resource Consumption Management in Construction Under Sustainability Policy: Enriching the DSEM-ARIMA Model. Sustainability 2024, 16, 10945. [Google Scholar] [CrossRef]
  14. Pollution Control Department Ministry of Natural Resources and Environment. Enhancement and Conservation of National Environmental Quality Act, B.E. 2535. Available online: https://www.pcd.go.th/laws/5406/ (accessed on 21 December 2024).
  15. Thailand Development Research Institute. Carbon Capture Utilization, Carbon Capture Utilization and Storage. Available online: https://thaicarbonlabel.tgo.or.th/tools/files.php?mod=YjNKbllXNXBlbUYwYVc5dVgyUnZkMjVzYjJGaw&type=WDBaSlRFVlQ&files=TkRrPQ (accessed on 1 December 2024).
  16. Pollution Control Department Ministry of Natural Resources and Environment. Principle 4: In Order to Achieve Sustainable Development, Environmental Protection Shall Constitute an Integral Part of the Development Process and Cannot Be Considered in Isolation from It. Available online: https://www.pcd.go.th/laws/ (accessed on 11 December 2024).
  17. Wattana, B.; Wattana, S.; Sa-Ngiamvibool, W.; Thanarak, P.; Luo, J. Electric vehicles penetration in Thailand: Rationale, challenges and strategies. J. Infrastruct. Policy Dev. 2024, 8, 6829. [Google Scholar] [CrossRef]
  18. Sutthichaimethee, P.; Sa-Ngiamvibool, W.; Thanarak, P.; Luo, J.; Wattana, S. A Long-Term CO2 Emission Forecasting Under Sustainability Policy Using an Advanced Model Complementing the PAARIMAX Framework. Agriculture 2024, 14, 2342. [Google Scholar] [CrossRef]
  19. Sutthichaimethee, P.; Saraphirom, P.; Junsiri, C. An Advanced Model for Greenhouse Gas Emission Reduction in the Agricultural Sector to Achieve Sustainability for Thailand’s Future. Appl. Sci. 2025, 15, 1485. [Google Scholar] [CrossRef]
  20. Lau, G.W.; King, P.J.H.; Chubo, J.K.; King, I.C.; Ong, K.H.; Ismail, Z.; Robin, T.; Shamsi, I.H. The Potential Benefits of Palm Oil Waste-Derived Compost in Embracing the Circular Economy. Agronomy 2024, 14, 2517. [Google Scholar] [CrossRef]
  21. Oueld Lhaj, M.; Moussadek, R.; Mouhir, L.; Mdarhri Alaoui, M.; Sanad, H.; Iben Halima, O.; Zouahri, A. Assessing the Evolution of Stability and Maturity in Co-Composting Sheep Manure with GreenWaste Using Physico-Chemical and Biological Properties and Statistical Analyses: A Case Study of Botanique Garden in Rabat, Morocco. Agronomy 2024, 14, 1573. [Google Scholar] [CrossRef]
  22. Bogusz, P.; Brodowska, M.S.; Muszyński, P. The Impact of Suspension Fertilizers Based on Waste Phosphorus Salts from Polyol Production on the Content of Macronutrients in Maize Grown for Green Fodder. Agronomy 2024, 14, 2079. [Google Scholar] [CrossRef]
  23. Roma, E.; Laudicina, V.A.; Vallone, M.; Catania, P. Application of Precision Agriculture for the Sustainable Management of Fertilization in Olive Groves. Agronomy 2023, 13, 324. [Google Scholar] [CrossRef]
  24. Nath, P.C.; Ojha, A.; Debnath, S.; Sharma, M.; Sridhar, K.; Nayak, P.K.; Inbaraj, B.S. Bio generation of Valuable Nanomaterials from Agro-Wastes: A Comprehensive Review. Agronomy 2023, 13, 561. [Google Scholar] [CrossRef]
  25. Qin, G.; Liu, J.; Lin, H.; Javed, T.; Gao, X.; Tang, Y.; Mu, X.; Guo, M.; Wang, Z. Assessing the Coordination and Spatial Equilibrium of Water, Energy, and Food Systems for Regional Socio-Economic Growth in the Ili River Valley, China. Agronomy 2024, 14, 2037. [Google Scholar] [CrossRef]
  26. Kerry, R.; Ingram, B.; Hammond, K.; Shumate, S.R.; Gunther, D.; Jensen, R.R.; Schill, S.; Hansen, N.C.; Hopkins, B.G. Spatial Analysis of Soil Moisture and Turfgrass Health to Determine Zones for Spatially Variable Irrigation Management. Agronomy 2023, 13, 1267. [Google Scholar] [CrossRef]
  27. Chen, S.C.-i.; Dang, X.; Xu, Q.-q.; Own, C.-M. Transforming Waste into Value: Sustainable Recycling of Agricultural Resources Under the ‘Carbon Peak and Carbon Neutrality’ Vision. Sustainability 2025, 17, 55. [Google Scholar] [CrossRef]
  28. Oueld Lhaj, M.; Moussadek, R.; Zouahri, A.; Sanad, H.; Saafadi, L.; Mdarhri Alaoui, M.; Mouhir, L. Sustainable Agriculture Through Agricultural Waste Management: A Comprehensive Review of Composting’s Impact on Soil Health in Moroccan Agricultural Ecosystems. Agriculture 2024, 14, 2356. [Google Scholar] [CrossRef]
  29. Hashim, S.; Bashir, R.; Khan, A.A.; Mirani, A.A.; Shoaib, M.; Razzaq, A.; Ehsan, F.; Munir, F. Performance Evaluation of Compost of Windrow Turner Machine Using Agriculture Waste Materials. Sustainability 2024, 16, 7779. [Google Scholar] [CrossRef]
  30. Gabur, G.-D.; Teodosiu, C.; Fighir, D.; Cotea, V.V.; Gabur, I. From Waste to Value in Circular Economy: Valorizing Grape Pomace Waste through Vermicomposting. Agriculture 2024, 14, 1529. [Google Scholar] [CrossRef]
  31. Nicastro, R.; Papale, M.; Fusco, G.M.; Capone, A.; Morrone, B.; Carillo, P. Legal Barriers in Sustainable Agriculture: Valorization of Agri-Food Waste and Pesticide Use Reduction. Sustainability 2024, 16, 8677. [Google Scholar] [CrossRef]
  32. Al Shoffe, Y.; Johnson, L.K. Opportunities for Prediction Models to Reduce Food Loss and Waste in the Postharvest Chain of Horticultural Crops. Sustainability 2024, 16, 7803. [Google Scholar] [CrossRef]
  33. Alresheedi, M.T.; Haider, H.; Albuaymi, A.M.; AlSaleem, S.S.; Shafiquzzaman, M.; Alharbi, A.; Ahsan, A. Sustainability of a Low-Cost Decentralized Treatment System for Wastewater Reuse:Resident Perception-Based Evaluation for Arid Regions. Water 2023, 15, 3458. [Google Scholar] [CrossRef]
  34. Munoz-Quezada, M.T.; Pasten, P.; Landeros, N.; Valdés, C.; Zúniga-Venegas, L.; Castillo, B.; Lucero, B.; Castillo, A.; Buralli, R.J. Bioethical Analysis of the Socio-Environmental Conflicts of a Pig Industry on a Chilean Rural Community. Sustainability 2024, 16, 5457. [Google Scholar] [CrossRef]
  35. Zhang, W.; Du, B.; Duan, X.; Liang, Z.; Tang, Y.; Li, J.; Yao, X. Effects of Different Rice Varieties and Water Management Practices on Greenhouse Gas (CH4 and N2O) Emissions in the Ratoon Rice System in the Upper Yangtze River Region, China. Agriculture 2024, 14, 2251. [Google Scholar] [CrossRef]
  36. Bu, M.; Xi, W.; Wang, Y.; Wang, G. Scenario-Based Modeling of Agricultural Nitrous Oxide Emissions in China. Agriculture 2024, 14, 2074. [Google Scholar] [CrossRef]
  37. Wang, H.; Dong, W.; Shao, D.; Liu, L.; Liao, B.; Gu, W.; Tang, C.; Liu, J.; Hu, W.; Feng, J.; et al. Biochar Enhances Paddy Productivity, Carbon Sequestration, and Reduces Greenhouse Gas Emissions in the Middle Yangtze River Region. Agronomy 2024, 14, 3067. [Google Scholar] [CrossRef]
  38. Wang, Z.; Shang, J.; Wang, X.; Ye, R.; Zhao, D.; Li, X.; Yang, Y.; Zhang, H.; Gong, X.; Jiang, Y.; et al. Soil Greenhouse Gas Emissions and Nitrogen Dynamics: Effects of Maize Straw Incorporation Under Contrasting Nitrogen Fertilization Levels. Agronomy 2024, 14, 2996. [Google Scholar] [CrossRef]
  39. Xu, Y.; Li, H.; Wang, H.; Du, X.; Bashir, M.A.; Zhang, X.; Sun, W.; An, M.; Liu, H. Optimizing Nitrogen Fertilizer Application for Synergistic Enhancement of Economic and Ecological Benefits in Rice–Crab Co-Culture Systems. Agronomy 2024, 14, 2219. [Google Scholar] [CrossRef]
  40. Geng, Y.; Bashir, M.A.; Wang, H.; Li, J.; Raza, Q.-U.-A.; Kan, W.; Tian, S.; Rehim, A.; Yang, L.; Liu, H. Introducing Ferrous Sulfate to Cattle Manure and Corn Straw Composting Reduces Greenhouse Gas Emissions and Ammonia Volatilization. Agronomy 2024, 14, 2867. [Google Scholar] [CrossRef]
  41. Zhang, F.; Qu, Z.; Zhao, Q.; Xi, Z.; Liu, Z. Mechanisms ofN2O Emission in Drip-Irrigated Saline Soils: Unraveling the Role of Soil Moisture Variation in Nitrification and Denitrification. Agronomy 2025, 15, 10. [Google Scholar] [CrossRef]
  42. Zafeiriou, E.; Galatsidas, S.; Moulogianni, C.; Sofios, S.; Arabatzis, G. Evaluating Enteric Fermentation- Driven Environmental Kuznets Curve Dynamics: A Bayesian Vector Autoregression Comparative Study of the EU and Least Developed Countries. Agriculture 2024, 14, 2036. [Google Scholar] [CrossRef]
  43. Terrero Turbí, M.A.; Gómez-Garrido, M.; El bied, O.; Cuevas Bencosme, J.G.; Cano, Á.F. Preliminary Results on the Use of Straw Cover and Effective Microorganisms for Mitigating GHG and Ammonia Emissions in Pig Slurry Storage Systems. Agriculture 2024, 14, 1788. [Google Scholar] [CrossRef]
  44. O’Connor, S.; Noonan, F.; Savage, D.; Walsh, J. Advancements in Real-Time Monitoring of Enteric Methane Emissions from Ruminants. Agriculture 2024, 14, 1096. [Google Scholar] [CrossRef]
  45. Sintori, A.; Liontakis, A.; Tzouramani, I. Assessing the Environmental Efficiency of Greek Dairy Sheep Farms: GHG Emissions and Mitigation Potential. Agriculture 2019, 9, 28. [Google Scholar] [CrossRef]
  46. Arunrat, N.; Pumijumnong, N. Practices for Reducing Greenhouse Gas Emissions from Rice Production in Northeast Thailand. Agriculture 2017, 7, 4. [Google Scholar] [CrossRef]
  47. Shanmugam, S.; Dalal, R.C.; Joosten, H.; Raison, R.J.; Joo, J.K. SOC Stock Changes and Greenhouse Gas Emissions Following Tropical Land Use Conversions to Plantation Crops on Mineral Soils, with a Special Focus on Oil Palm and Rubber Plantations. Agriculture 2018, 8, 133. [Google Scholar] [CrossRef]
  48. Li, J.; Wang, M.; Shi, W.; Shi, X. Halving Environmental Impacts of Diverse Crop Production in Fujian, China through Optimized Nitrogen Management. Agriculture 2024, 14, 1639. [Google Scholar] [CrossRef]
  49. Yang, A.; Luo, S.; Xu, Y.; Zhang, P.; Sun, Z.; Hu, K.; Li, M. Optimization of Irrigation and Fertilization in Maize–Soybean System Based on Coupled Water–Carbon–Nitrogen Interactions. Agronomy 2025, 15, 41. [Google Scholar] [CrossRef]
  50. Genstwa, N.; Zmyślona, J. Greenhouse Gas Emissions Efficiency in Polish Agriculture. Agriculture 2024, 14, 56. [Google Scholar] [CrossRef]
  51. Hatano, R.; Mukumbuta, I.; Shimizu, M. Soil Health Intensification through Strengthening Soil Structure Improves Soil Carbon Sequestration. Agriculture 2024, 14, 1290. [Google Scholar] [CrossRef]
  52. Bollen, K. Structural Equations with Latent Variables; John Wiley & Sons: New York, NY, USA, 1989. [Google Scholar]
  53. Pearl, J. Causality: Models, Reasoning, and Inference; Cambridge University Press: New York, NY, USA, 2000. [Google Scholar]
  54. Dickey, D.A.; Fuller, W.A. Likelihood ratio statistics for autoregressive time series with a unit root. Econometrica 1981, 49, 1057–1072. [Google Scholar] [CrossRef]
  55. MacKinnon, J. Critical Values for Cointegration Test in Long-Run Economic Relationships; Engle, R., Granger, C., Eds.; Oxford University Press: Oxford, UK, 1991. [Google Scholar]
  56. Johansen, S. Likelihood-Based Inference in Cointegrated Vector Autoregressive Models; Oxford University Press: New York, NY, USA, 1995. [Google Scholar]
  57. Johansen, S.; Juselius, K. Maximum likelihood estimation and inference on cointegration with applications to the demand for money. Oxf. Bull. Econ. Stat. 1990, 52, 169–210. [Google Scholar] [CrossRef]
  58. Enders, W. Applied Econometrics Time Series; Wiley Series in Probability and Statistics; University of Alabama: Tuscaloosa, AL, USA, 2010. [Google Scholar]
  59. Harvey, A.C. Forecasting, Structural Time Series Models and the Kalman Filter; Cambridge University Press: Cambridge, UK, 1980. [Google Scholar]
  60. Jia, L.; Cheng, P.; Yu, Y.; Chen, S.-H.; Wang, C.-X.; He, L.; Nie, H.-T.; Wang, J.-C.; Zhang, J.-C.; Fan, B.-J.; et al. Regeneration mechanism of a novel high-performance biochar mercury adsorbent directionally modified by multimetal multilayer loading. J. Environ. Manag. 2023, 326 Pt B, 116790. [Google Scholar] [CrossRef]
  61. Franco, D.; Silva, L.F.O.; Martinello, K.D.B.; Diel, J.C.; Georgin, J.; Netto, M.S.; Pereira, H.A.; Lima, E.C.; Dotto, G.L. Transforming agricultural waste into adsorbent: Application of Fagopyrum esculentum wheat husks treated with H2SO4 to adsorption of the 2,4-D herbicide. J. Environ. Chem. Eng. 2021, 9, 106872. [Google Scholar] [CrossRef]
  62. Wattana, B.; Wattana, S. Implications of electric vehicle promotion policy on the road transport and electricity sectors for Thailand. Energy Strategy Rev. 2022, 42, 100901. [Google Scholar] [CrossRef]
Figure 1. Summary of the research process.
Sustainability 17 03959 g001
Figure 2. Relationship structure of the Path-SFIML Model.
Sustainability 17 03959 g002
Figure 3. Analysis of the impact of change in relationship influence magnitude with moderation from the Path-SFIML Model. *** denotes significance at α = 0.01 and ** denotes significance at α = 0.05.
Sustainability 17 03959 g003
Figure 4. Forecasted agricultural waste from 2018 to 2037 in Thailand.
Sustainability 17 03959 g004
Figure 5. The growth of greenhouse gas emissions over the next 20 years (2018–2037).
Sustainability 17 03959 g005
Table 1. Results of indicator properties based on unit root test at the first-difference level.
Tau Test Augment   Dickey Fuller   ( sig .   α = 0.01 )
VariableFirst Difference I(1) Value
Δ ln ( U r e ) −4.05 *** p < α = 0.01
Δ ln ( U r t ) −4.50 *** p < α = 0.01
Δ ln ( E x m ) −4.24 *** p < α = 0.01
Δ ln ( P i m ) −4.59 *** p < α = 0.01
Δ ln ( P g e ) −4.65 *** p < α = 0.01
Δ ln ( F t r ) −4.72 *** p < α = 0.01
Δ ln ( E r r ) −4.49 *** p < α = 0.01
Δ ln ( H e r ) −4.59 *** p < α = 0.01
Δ ln ( E d r ) −5.41 *** p < α = 0.01
Δ ln ( F i r ) −4.30 *** p < α = 0.01
Δ ln ( H i r ) −4.45 *** p < α = 0.01
Δ ln ( D i m ) −4.25 *** p < α = 0.01
Δ ln ( G t r ) −4.55 *** p < α = 0.01
Δ ln ( B i e ) −5.19 *** p < α = 0.01
Δ ln ( E i r ) −4.55 *** p < α = 0.01
Δ ln ( C m r ) −4.25 *** p < α = 0.01
Δ ln ( W b t ) −4.79 *** p < α = 0.01
Δ ln ( O w t ) −4.95 *** p < α = 0.01
Δ ln ( T x r ) −5.01 *** p < α = 0.01
Δ ln ( B i f ) −4.75 *** p < α = 0.01
Δ ln ( T e r ) −5.11 *** p < α = 0.01
Δ ln ( T i r ) −4.77 *** p < α = 0.01
Δ ln ( C O 2 ) −5.05 *** p < α = 0.01
Δ ln ( C H 4 ) −4.95 *** p < α = 0.01
Δ ln ( N 2 O ) −4.90 *** p < α = 0.01
Note: U r e is the urbanization rate, U r t is the industrial structure, E x m is the export–import, P i m is the investment, P g e is the government expenditure, F t r is the foreign tourism rate, E r r is the employment rate, H e r is the health and illness rate, E d r is the education rate, F i r is the finance rate, H i r is the human resource rate, D i m is the income distribution rate, G t r is the clean technology, B i e is the biomass energy, E i r is the renewable energy rate, C m r is the green material rate, W b t is the waste biomass, O w t is the organic waste treatment, T x r is the taxonomy rate, B i f is the biofertilizer rate, T e r is the total energy consumption, T i r is the energy intensity rate, C O 2 is the carbon dioxide emissions, C H 4 is the methane, N 2 O is the nitrous oxide, and *** denotes significance at α = 0.01.
Table 2. Testing the ability to reach long-term equilibrium.
VariablesTrace Statistic TestMax—Eigen Statistic Test Error   Correction   Mechanism ( E c m ) MacKinnon Critical Value (p-Value)
Δ ln ( U r e ) 162.15 ***215.02 ***−0.62 ***p < 0.01
Δ ln ( U r t )
Δ ln ( E x m )
Δ ln ( P i m )
Δ ln ( P g e )
Δ ln ( F t r )
Δ ln ( E r r )
Δ ln ( F i r )
Δ ln ( H i r )
Δ ln ( H e r ) −0.36 ***
Δ ln ( E d r )
Δ ln ( D i m )
Δ ln ( G t r )
Δ ln ( B i e ) −0.88 ***
Δ ln ( E i r )
Δ ln ( C m r )
Δ ln ( W b t )
Δ ln ( O w t )
Δ ln ( T x r )
Δ ln ( B i f )
Δ ln ( T e r )
Δ ln ( T i r ) −0.002 ***
Δ ln ( C O 2 )
Δ ln ( C H 4 )
Δ ln ( N 2 O )
*** denotes significance α = 0.01.
Table 3. Results of the direct and indirect effects analysis using the Path-SFIML Model.
Dependent VariablesType of EffectIndependent Variables
Economic SocialEnvironmental Civil Politics
Economic DE---0.89 ***
IE----
SocialDE0.36 ***--0.85 ***
IE---0.12 ***
Environmental DE0.54 ***0.25 ***-0.81 ***
IE0.09 ***--0.19 ***
Civil politics DE----
IE----
Note: *** denotes significance at α = 0.01, DE is direct effect, and IE is indirect effect.
Table 4. Performance analysis results of the Path-SFIML Model.
Forecasting ModelMAPE (%)RMSE (%)
MRM model16.5517.65
ANN model5.527.11
ANIF model5.497.05
GM (1,1)5.055.44
BG (1,1)2.993.09
NN model2.692.92
Convolutional Neural Network2.502.71
Path-GMM-Nearest-neighbor model1.111.23
Disclaimer/Publisher’s Note: The statements, opinions and data contained in all publications are solely those of the individual author(s) and contributor(s) and not of MDPI and/or the editor(s). MDPI and/or the editor(s) disclaim responsibility for any injury to people or property resulting from any ideas, methods, instructions or products referred to in the content.

