Article

Runoff Changes and Their Impact on Regional Water Resources in Qinling Mountains from 1970 to 2020

1
School of Civil Engineering, Hubei Engineering University, No. 272 Jiaotong Avenue, Xiaogan 432000, China
2
State Key Laboratory of Loess Science, Institute of Earth Environment, Chinese Academy of Sciences, No. 97 Yanxiang Road Yanta District, Xi’an 710061, China
3
School of Geography and Tourism, Shaanxi Normal University, No. 620 West Chang’an Street, Xi’an 710061, China
*
Author to whom correspondence should be addressed.
These authors contributed equally to this work.
Sustainability 2025, 17(9), 3948; https://doi.org/10.3390/su17093948
Submission received: 20 March 2025 / Revised: 16 April 2025 / Accepted: 23 April 2025 / Published: 28 April 2025

Abstract

The Qinling Mountains serve as the main water source for the Weihe River and Hanjiang River. However, the lack of sufficient observational data limits a deeper understanding and the utilization of its water resources. In this study, the Variable Infiltration Capacity (VIC) hydrological model is used to quantitatively analyze runoff changes and their impacts on these rivers, based on meteorological, land use, and elevation data. By using the hydrological parameter transplantation method, a parameterized system was established to simulate runoff variations from 1970 to 2020. Results showed that the total runoff of the Qinling Mountains in Shaanxi Province ranged between 13.26 and 44.47 billion m3/year, with an average perennial runoff of 25.05 billion m3/year. Over the past 51 years, the runoff volume has exhibited a slightly decreasing trend. The average runoff at the northern foothills is 3.56 billion m3/year, which accounts for 62.4% of the natural average runoff of the Weihe River (Huaxian Station). In contrast, the average runoff at the southern foothills is 21.49 billion m3/year, which accounts for 68.1% of the natural average runoff of the Hanjiang River (Huangjiagang Station). The significant variation in water vapor transport from the western equatorial Pacific to the region via the South China Sea has been identified as the primary reason for the changes in runoff. This quantitative study of runoff changes in the Qinling Mountains clarifies their influence on the Weihe River and the Hanjiang River and will provide a basis for the rational usage of ecological water.

Graphical Abstract

1. Introduction

The Qinling Mountains form an extensive east–west mountain range in central China. This mountain range is 1600 km in length from east to west, 200 km in width, and occupies a total area of approximately 120,000 km2. In a narrower definition, the Qinling Mountains refer specifically to the region situated between the Weihe River and Hanjiang River in southern Shaanxi (Figure 1). Geographically positioned at the geometric center of China, this high mountain range acts as a transitional ecological zone and an area that is sensitive to area climate change. The northern foothills of the Qinling Mountains are the primary water source area for the Weihe River and provide approximately 51% of its total runoff (Upstream of Huaxian station) [1]. However, water shortages in the region have become a critical constraint on its development [2,3]. Historically, the northern foothills were characterized by dense river networks and abundant water resources. Since the 1970s, 80% of the rivers have become intermittent streams [4]. Meanwhile, the southern foothills of the Qinling Mountains, which supply water to the Jialing River, Hanjiang River, and Danjiang River (Tributaries of the Yangtze River), contribute an estimated 53% of the inflow runoff to the Danjiangkou Reservoir. Therefore, the Qinling Mountains are often referred to as the ‘National Central Water Tower’. From 2015 to 2021, 43 billion m3/year of water was transferred from the Danjiangkou Reservoir to the Beijing–Tianjin region via the Middle Route of the South–to–North Water Diversion Project. To further alleviate water shortages in the Guanzhong region, a water diversion project from the upper Hanjiang River to the Weihe Basin has been initiated. Once completed, this project is expected to transport 1.5 billion m3/year of water annually. Therefore, the availability of water resources in the Qinling Mountains is crucial not only for ensuring sustainable water utilization in the Guanzhong region but also for maintaining the long–term feasibility of water diversion to Beijing and Tianjin via the Middle Route of the South–to–North Water Diversion Project.
So far, most studies on runoff changes in the Qinling Mountains have focused on the trends, mechanisms, and climate responses within specific sub-watersheds [5,6,7,8,9,10,11,12,13,14], but these sub-watersheds account for only a small fraction of the entire Qinling Mountains. Hydrological analogy methods can be used to estimate the runoff of adjacent basins through the isohyetal lines of the runoff. However, in the Qinling Mountains, especially in the northern foothills, the observational data are scarce. The area of observed basins covers only 34% of the total region. The differences in area, elevation, and vegetation among basins inevitably lead to differences in the contour lines of the runoff. Therefore, using the hydrological analogy method would increase the error of simulation results [15,16]. Fundamental questions remain, such as the following: How much runoff is generated in the Qinling Mountains? What volume of water can the mountains supply to the Hanjiang River and Weihe River? How does the runoff in the Qinling Mountains change? Addressing these questions is essential for the rational management of water resources in the Qinling Mountains.
In response to these gaps, this study divides the Qinling Mountains within Shaanxi Province into northern and southern foothill basins and further divides into 58 model–resolved sub–basins by using the Variable Infiltration Capacity (VIC) distributed hydrological model (Figure 1c). The VIC hydrological model can effectively characterize the heterogeneity of sub–grid surface vegetation, soil moisture storage capacity, and nonlinear recession of subsurface soil water, and it also considers the differences in orographic precipitation and temperature lapse rates, with higher accuracy in the simulation of mountainous hydrological processes. Using the hydrological parameter similarity transplantation method, the study reconstructs and analyzes runoff changes and their mechanisms across the northern and southern slopes of the Qinling Mountains between 1970 and 2020. The objective is to accurately simulate the patterns and characteristics of water resource changes in the Qinling Mountains, thereby providing reliable data for the rational planning of inter–basin water transfer volumes in the Qinling Mountains and supporting the estimation of available water resources for urban agglomerations in the Guanzhong region.

2. Data and Research Methods

2.1. Data Sources

Meteorological data for this study included daily precipitation, maximum and minimum daily temperatures, and average daily wind speeds from 58 meteorological stations for the period 1970–2020 (http://data.cma.cn/) (accessed on 10 February 2025). NCEP monthly reanalysis data (resolution: 2.5° × 2.5°), including geopotential height, wind speed, relative humidity, and surface pressure, for the period 1948–2020 were also utilized (https://nomads.ncep.noaa.gov/) (accessed on 10 February 2025).
Elevation data (DEM) were obtained from the ASTER GDEM V2 terrain product (http://www.gscloud.cn/) (accessed on 10 February 2025) with a resolution of 30 × 30 m. These high-accuracy elevation data were used in the hydrological model [7,17]. Soil data, including soil texture, soil type, and soil physical and chemical properties, were sourced from the World Soil Database (HWSD) (https://www.fao.org/soils-portal/data-hub/soil-maps-and-databases/harmonized-world-soil-database-v12/en/) (accessed on 10 February 2025), with a resolution of 1:1 million.
Land use data were derived from the Global Land Cover dataset (https://glad.umd.edu/dataset) (accessed on 10 February 2025). To minimize the influence of land use changes on model simulations, Landsat satellite imagery was analyzed for the period 1980–2015, revealing that areas in which land-use changes had occurred in the Qinling Mountains accounted for less than 3% of the total area over the past 36 years. Consequently, the 2010 dataset was used to represent the long-term average land-use conditions [18].
Hydrological data were obtained from the National Earth System Science Data Center (http://www.geodata.cn) (accessed on 10 February 2025), consisting of monthly runoff data (1970–1986) from 18 hydrological stations, including Laoyukou, Heiyukou, Shengxian Village, and Xiangjiaping, located on the northern and southern slopes of the Qinling Mountains.

2.2. Research Methodology

2.2.1. Spatial Interpolation Using Thin Disk Smooth Spline Function

Comparing the simulation accuracy of Kriging, Inverse Distance Weighting, and Thin Plate Spline methods, we found that the spline interpolation method can more accurately depict the variation of annual precipitation with topography in the central Qinling Mountains [16]. Therefore, this study employs the spatial interpolation method of Thin Plate Smoothing Spline in Anuspline software (version 4.3) as the approach for processing the driving data of the hydrological model. This method incorporates altitude as a variable into the standard thin disk smooth spline function to enhance the accuracy of the spatial interpolation of meteorological data. This method has demonstrated high accuracy in the Qinling area [19]. The interpolation formula is as follows:
Z i = f ( x i ) + b T y i + e i ( i = 1 , , N )
Here, Z i is the dependent variable at the i-th point in the interpolation space, x i is a d-dimensional vector with respect to spline independent variables, f is an unknown smooth function with respect to x i , and y i is a p-dimensional vector with respect to independent covariates. b is the p-dimensional coefficient of y i , and e i is the random error of the independent variable with an expected value of 0.

2.2.2. VIC Hydrological Model

The VIC hydrological model used in this study is a distributed hydrological model with a physical mechanism that simultaneously considers both energy and water balances. Runoff is calculated independently for each grid cell using over–infiltration and full–storage mechanisms to simulate runoff generation. The model has demonstrated high simulation accuracy in the Weihe River and Hanjiang River basins [20,21]. To calibrate the model, the study used the monthly runoff data from 1975 to 1978 as the target data. Hydrological parameters were adjusted stepwise via the uniform design variable method. The model’s capability was assessed using the Nash–Sutcliffe efficiency coefficient. These hydrological parameters corresponding to the maximum Nash–Sutcliffe efficiency coefficient were ultimately selected as the hydrological parameters for the observed basin. Then, optimized parameters were used to simulate the runoff changes from 1982 to 1985. Nash–Sutcliffe coefficient, correlation coefficient, and relative error were compared to analyze the suitability of the parameters for the observation basin. The VIC used in this study is version 4.1.2. Unlike previous versions, this version employs a three-layer soil thickness, and the download link is https://vic.readthedocs.io/en/master/ (accessed on 10 February 2025).

2.2.3. Similarity Transplantation Method of Hydrological Parameters

Due to the limited availability of hydrological data in the Qinling area, particularly along the northern foothills, only about 10% of the area has measured data; it is impossible to calibrate the parameters for the entire basin [22]. The principle of hydrological similarity can be used to transplant parameters from observed basins with maximum hydrological similarity to basins without data. This principle was used to establish the hydrological parameterization system for the Qinling Mountains. Based on previous hydrological similarity indexes in Qinling Basin, this study used five indices, namely, average precipitation, average altitude, topographic index, land type, and soil type, as the evaluation system of hydrological similarity indices [23]. The weights of these indices were determined using the analytic hierarchy process and the entropy method. The formula is as follows:
S = i = 1 n δ i q ( c i )
where S is the hydrological similarity, q ( c i ) is used to express the hydrological similarity element of index i; and δi is the index weight of item i. The hydrological similarity of individual elements was calculated using the following:
The hydrological similarity element, q ( c i ) , was calculated as follows:
q ( c i ) = 1 | y a y b | y a
where ya and yb are the values of the hydrological indexes in watersheds A and B, respectively.
(1)
Precipitation–based hydrological similarity index
S p = 1 | P B P A | P A
where S p is the Precipitation-based hydrological similarity index. P A and P B are the values of mean annual precipitation in watersheds A and B, respectively.
(2)
Elevation–based hydrological similarity index
S h = 1 | H B H A | H A
where S h is the elevation-based hydrological similarity index. H A and H B are the values of average altitude in watersheds A and B, respectively.
(3)
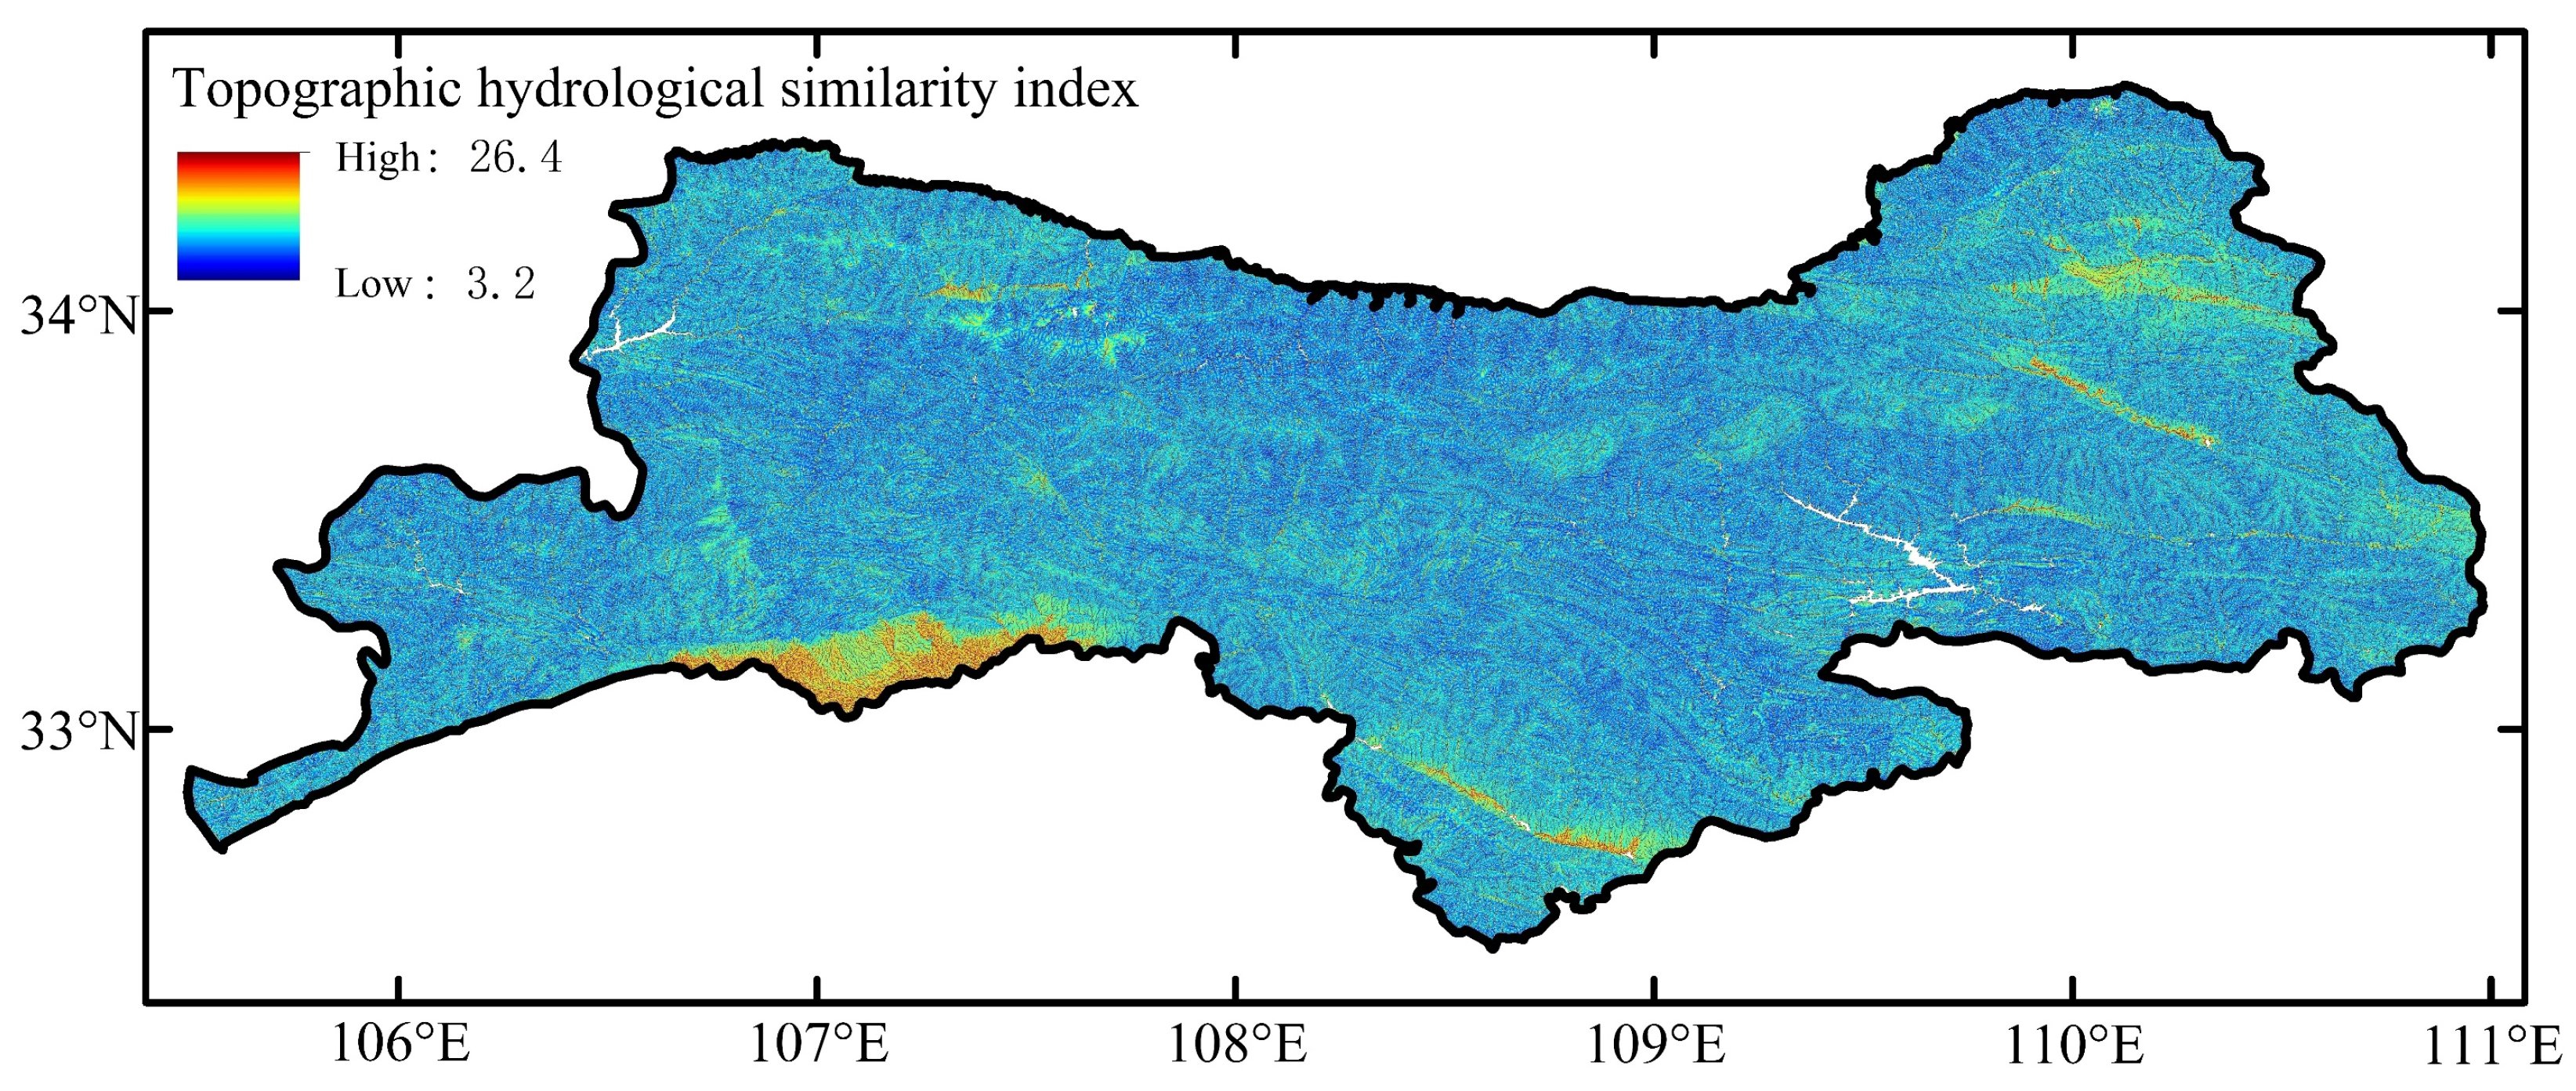
Topographic hydrological similarity index
Due to the large numerical range of the topographic index within the watershed, the study adopts the segmented area comparison method to calculate the topographic hydrological similarity index.
S t e = 1 i = 1 ( A i , B A i , A ) 2 / i = 1 ( A i , A A i , A ¯ ) 2
where S t e is the topographic hydrological similarity index. A i , A and A i , B represent the percentage of the i-th segment area of watershed A and watershed B, respectively. A i , A ¯ represents the average value of all items for watershed A.
(4)
Land type hydrological similarity index
S L = 1 i = 1 ( L i , B L i , A ) 2 / i = 1 ( L i , A L i , A ¯ ) 2
where S L is the Land type hydrological similarity index. L i , A , L i , B represent the percentage of the i-th land type area of watershed A and watershed B, respectively. L i , A ¯ represents the average value of all items for watershed A.
(5)
Soil texture hydrological similarity index
S s = 1 i = 1 ( S i , B S i , A ) 2 / i = 1 ( S i , A S i , A ¯ ) 2
where S s is the Soil texture hydrological similarity index. S i , A , S i , B represent the percentage of the i-th soil texture area of watershed A and watershed B, respectively. S i , A ¯ represents the average value of all items for watershed A.
(6)
Weight calculation
The entropy weight method is employed to objectively assign weights to each indicator, and the analytic hierarchy process (AHP) is utilized to calculate the subjective weights of each indicator in the SPSS software (version 19).
1)
Analytic hierarchy process
When applying AHP for subjective indicator weight analysis, construct a pairwise comparison matrix A based on element importance, then score using the matrix’s scoring table. By combining the judgment matrix A, the maximum eigenvalue λ m a x of the judgment matrix and the corresponding normalized eigenvector W are calculated. The corresponding calculation formulas are as follows:
A W = λ m a x W
where W = ( w 1 , w 2 , , w n ) , w j ( j = 1 , 2 , , n ) are the corresponding weights of each index. To conduct a consistency check test on the judgment matrix, the value of the consistency index ε e r is determined. The formula is as follows:
ε e r = ε c ε r
ε c = λ m a x n n 1
where ε c is the consistency index of the judgment matrix; ε r is a random consistency index.
2)
Entropy weight method
Entropy is a state function of a system and a tool to measure the degree of disorder of the system. The multi–objective decision matrix X = ( X i j ) ( m × n ) normalized by the sum method forms a new judgment matrix B = ( b i j ) ( m × n ) . The entropy value of the j-th evaluation criterion is defined as H j , and it follows that
H j = 1 ln m [ j = 1 n ( f i j ln f i j ) ]
where f i j = ( 1 + b i j ) / i = 1 m ( 1 + b i j ) , i = 1, 2, ……, m, j = 1, 2, ……, n. Assuming that the entropy weight of the j-th evaluation index is β j , the objective weight vector β = ( β 1 , β 2 , ……, β n ). It follows that
β j = 1 H j j = 1 n ( 1 H j )

2.2.4. Mann–Kendall Trend Test

Mann–Kendall (M–K) is a non-parametric test method. This method does not require the sample to follow a certain distribution and is not interfered with by a few outliers. The calculation is widely used in the study of hydrological factors such as precipitation, temperature, and runoff because of the lack of measurement, missed measurement, and abnormal data in climate observation data, and the M–K method can be free from its influence.
Let a time series be X = ( x 1 , x 2 , …, x n ), and define the statistic S as follows:
S = i = 1 n 1 j = i + 1 n sgn ( x j x i )
sgn ( x j x i ) = 1 if x j x i > 0 , 0 if x j x i = 0 , 1 if x j x i < 0 .
The variance of the statistic S is as follows:
V A R ( S ) = 1 18 [ n ( n 1 ) ( 2 n + 5 ) p = 1 g t p ( t p 1 ) ( 2 t p + 5 ) ]
where g represents the number of ‘tied groups’ in the data series (Selecting repeated items from the data series and grouping each type of repeated items into a single group, referred to as a ‘tied group’), and t p represents the number of items in the p-th ‘tied group’. The standardized normal statistic Z, which is used to determine whether there is a significant monotonic trend in time series, is calculated as follows:
Z = S 1 V A R ( S ) if S > 0 , 0 if S = 0 , S + 1 V A R ( S ) if S < 0 .
We set a significance level value α and compare the value of | Z | with the cumulative distribution function of the standard normal distribution ϕ ( 1 α / 2 ) . When | Z | is bigger than ϕ ( 1 α / 2 ) , it indicates that the time series X has a significant trend at this level. On this basis, if Z > 0, the time series has a significant upward trend; if Z < 0, the time series has a significant downward trend. Conversely, when | Z | is less than ϕ ( 1 α / 2 ) , it indicates the time series has no significant trend at this level. The α in this paper is 0.05, and the corresponding value of ϕ ( 1 α / 2 ) is 1.96.

3. Results

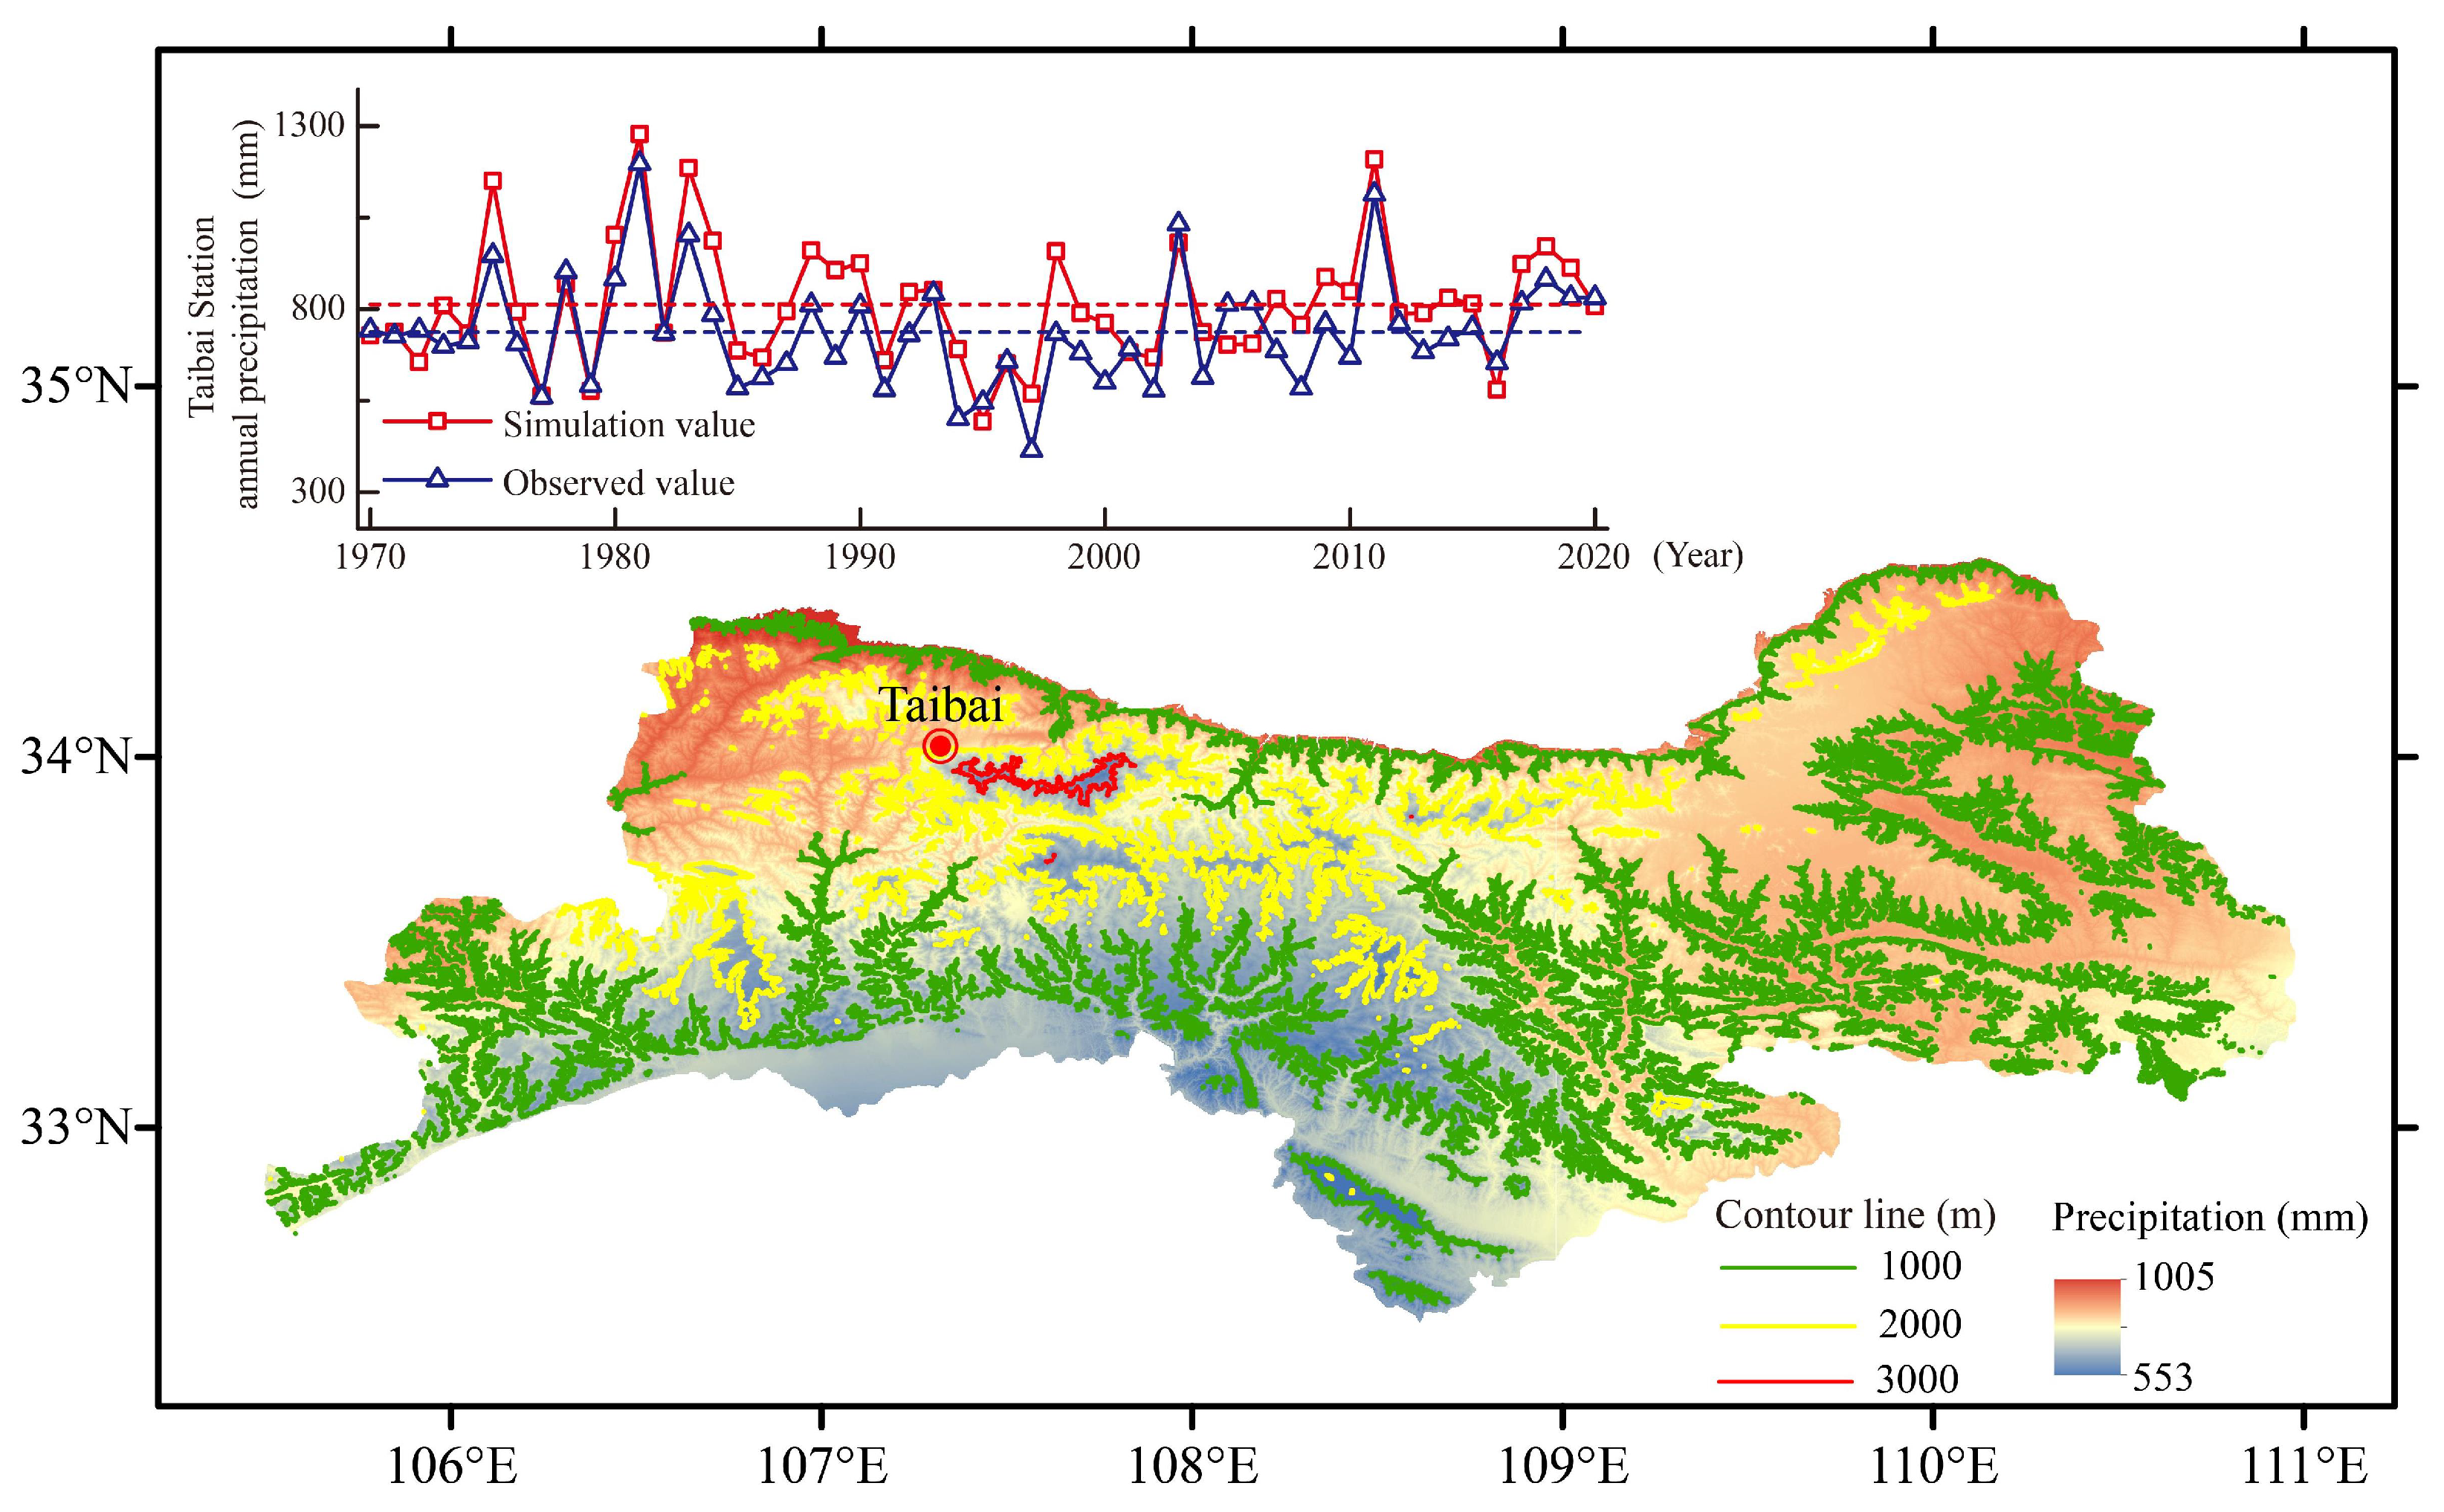
3.1. Interpolation Validation of Meteorological Variables

The lack of observational data in high-altitude areas is one of the important factors affecting the simulation accuracy of the VIC model. To address this issue, this study employs the thin–plate smoothing spline method to interpolate regional meteorological data in order to reduce errors. Using observational data from 58 meteorological stations, daily spatial variations in meteorological parameters (temperature, precipitation, and wind speed) in the study area from 1970 to 2020 (51 years) were interpolated using a thin–disk smooth spline function with a spatial resolution of 30 × 30 m. Precipitation, the meteorological factor with the greatest spatial variability, was identified as the most important factor affecting mountain runoff.
The study utilized observational data from 57 stations in the Qinling Mountains (excluding Taibai Station, 1543.6 m) to conduct thin–plate spline interpolation. The interpolated data at Taibai Station were compared with the observed data, and the results were evaluated using correlation coefficients and absolute error. The correlation coefficient between the interpolated and observed values was 0.85. The simulated average precipitation at Taibai Station over 51 years was 812.2 mm/year, while the observed value was 737.9 mm/year, with an absolute error of only 74.3 mm/year (Figure 2). The results indicate that using Anuspline can obtain an interpolated dataset that meets the simulation requirements of the VIC model.

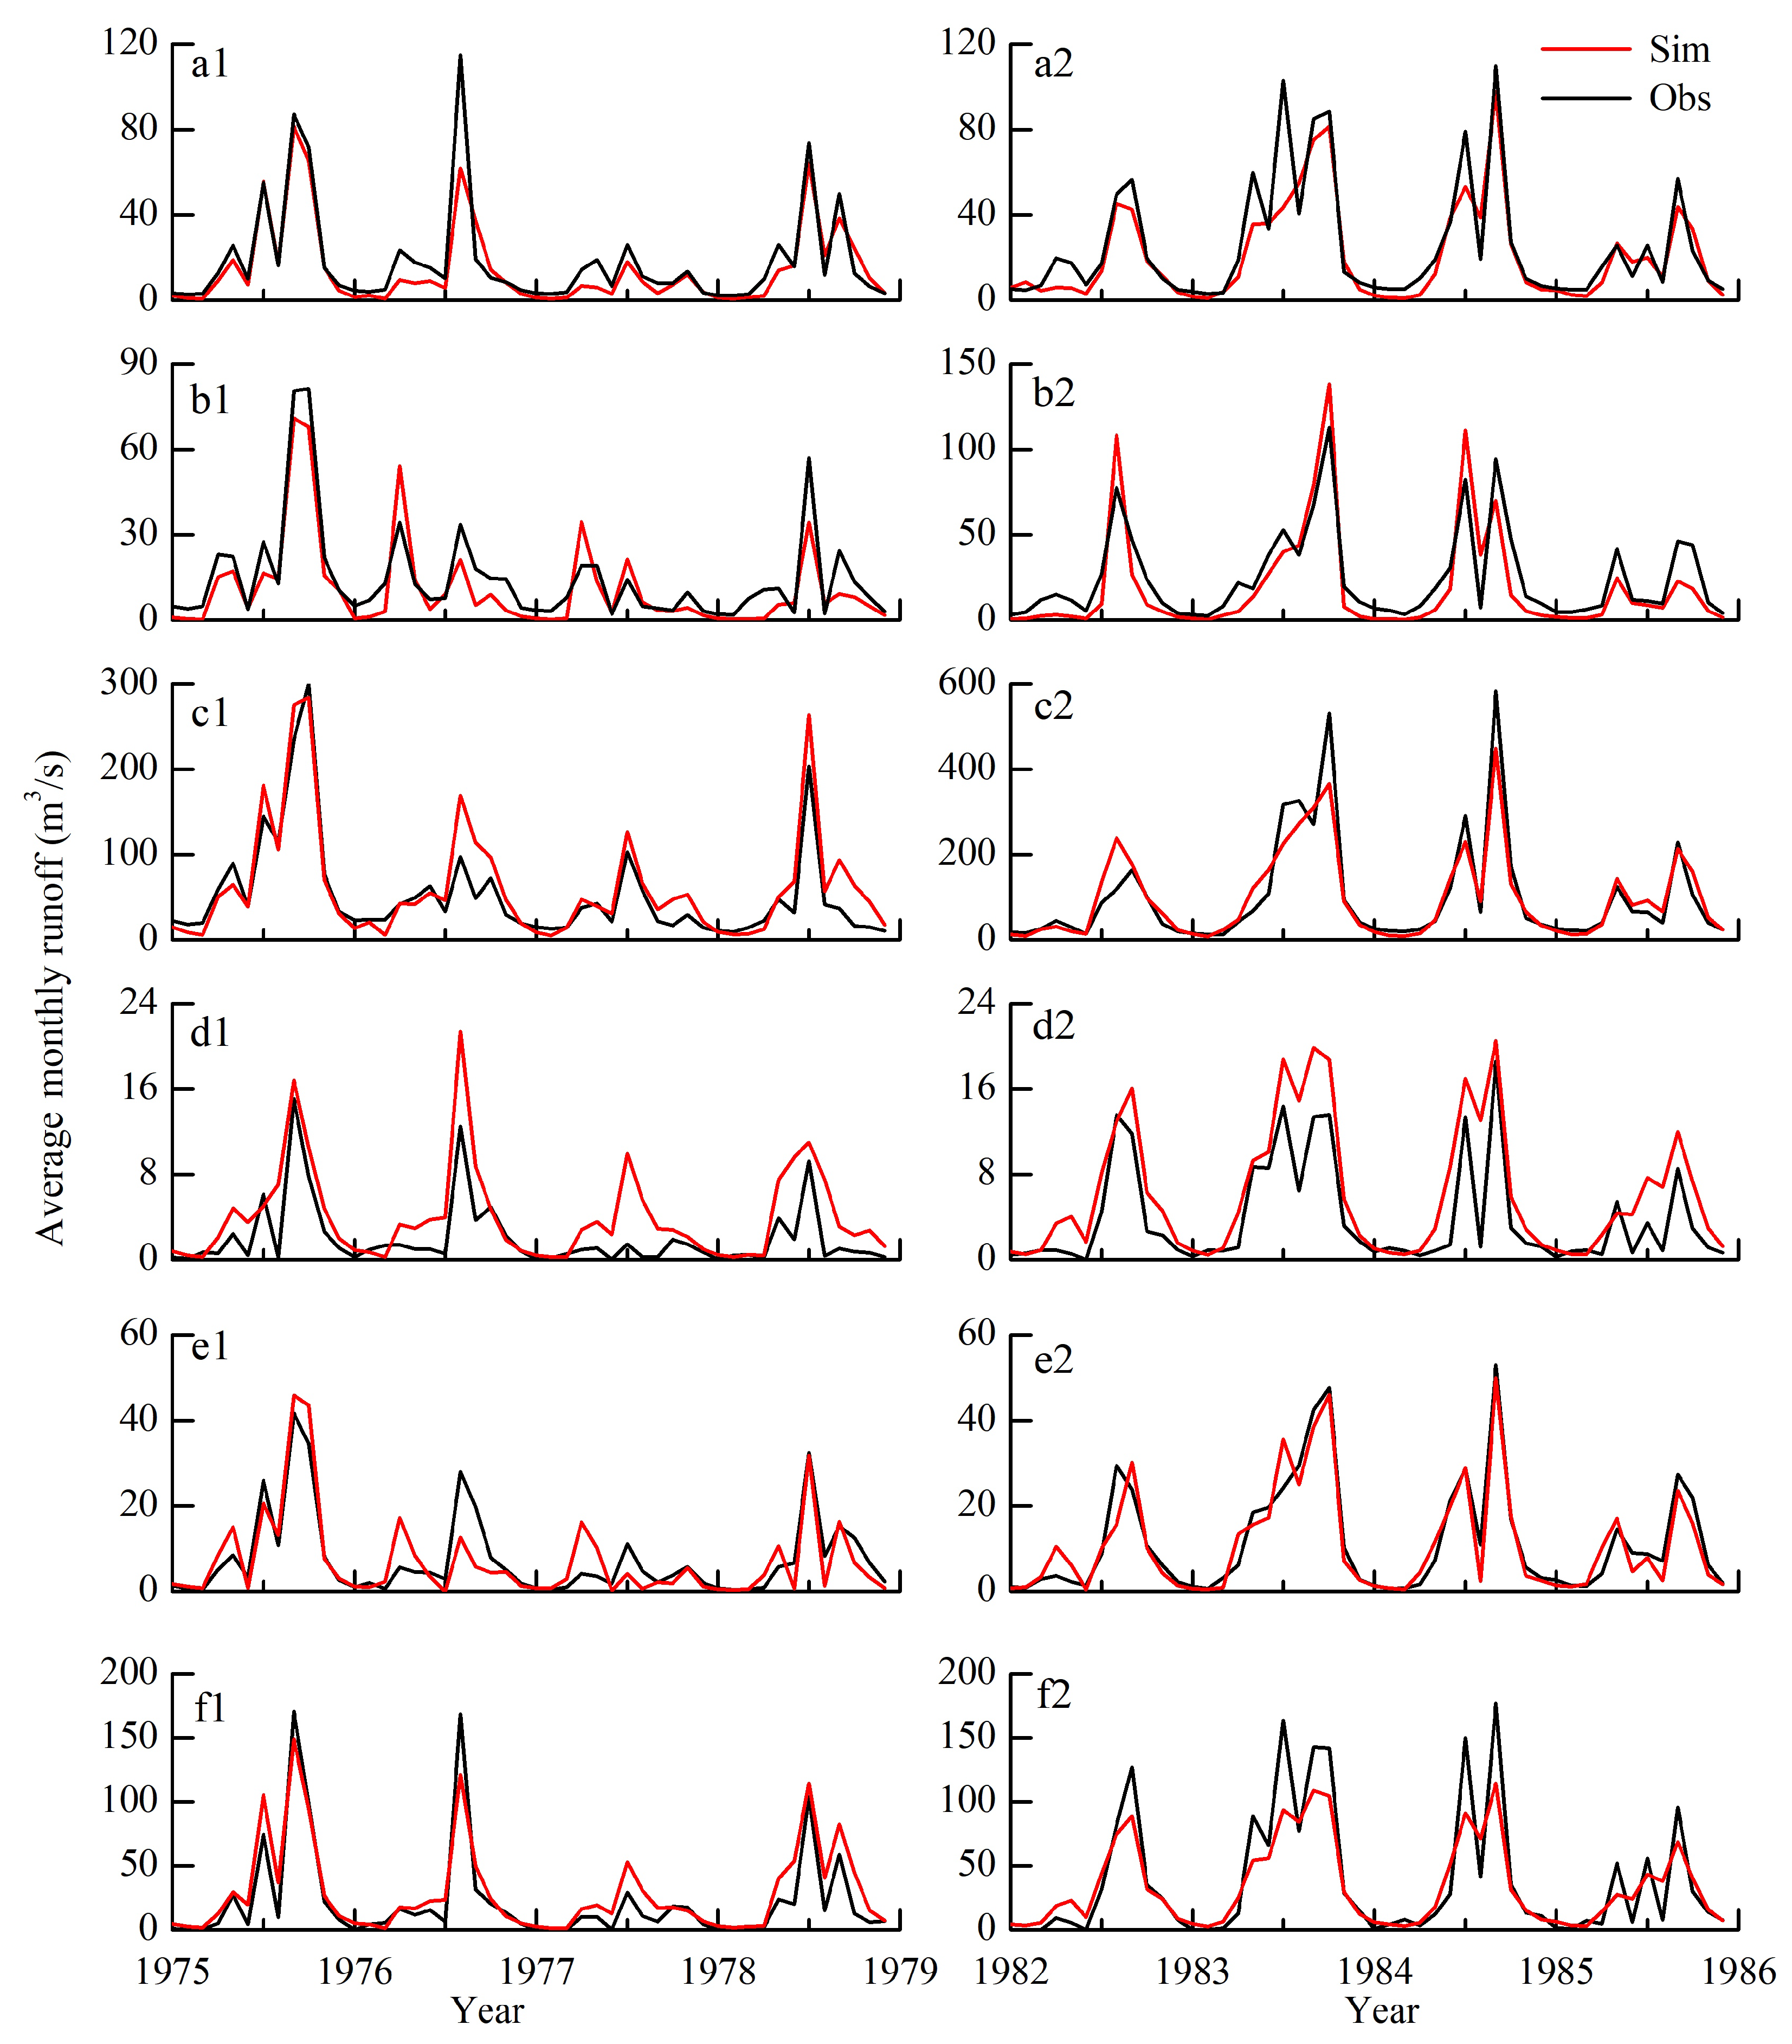
3.2. Evaluation of Runoff Simulation Results

Since the 1980s, a portion of the runoff has been utilized as urban water resources for industrial and agricultural development. This utilization has led to a reduction in runoff in the Qinling Mountains, particularly in the northern foothills [8]. To ensure the accuracy of the simulation, it was determined that the reduction in runoff caused by human activities remains within a controllable range. Therefore, the period from 1975 to 1978, which is characterized by minimal human interference, was selected for model calibration, while the period from 1982 to 1985 was used for validation. Simulation accuracy was assessed using the Nash–Sutcliffe efficiency coefficient ( N S ), correlation coefficient ( R 2 ), and relative error (RE) between simulated and observed runoff values.
Table 1 summarizes the calibration and validation results for the sub-basins where the 18 hydrological stations are located. The N S coefficients ranged from 0.61 to 0.88, R 2 values exceeded 0.84, and RE values remained within 25% for both the calibration and validation periods. For example, Heiyukou Station (Largest drainage basin) and Maduwang Station (Smallest drainage basin) in the northern foothills and Xiangjiaping Station (Largest drainage basin) and Changtancun Station (Smallest drainage basin) in the southern foothills demonstrated strong agreement between simulated and observed runoff changes (Figure 3a–d), It is generally considered that results are acceptable when the N S is greater than 0.6, the coefficient of R 2 is greater than 0.8, and the R E is within ±30%.
Among the fifty eight model–resolved sub–basins in the Qinling Mountains, five sub–basins with no data in the southern foothills account for 7.7% of the total southern foothill area, while there were only four sub–basins with data in the northern foothills, and the sub–basins with no data accounted for 66.1% of the total northern foothill area. Therefore, to estimate the hydrological parameters of the sub–basins with no data, this study employed the hydrological similarity method to transplant hydrological parameters from the basins with data to ones without data (Table 2). Average altitude (Figure 1), rainfall (Figure 2), topographic index (Figure A1), land type (Figure A2), and soil type (Figure A3) were used as the five indices to determine the hydrological similarity (Table A1).
The reliability of parameter transplantation was verified using measured data from Qindu Town (Northern foothills) and Shengxian Village (Southern foothills) (Figure 3e,f), and hydrological parameters were transplanted from the Laoyukou (Northern foothills) and Madao (Southern foothills) stations, which demonstrated the highest hydrological similarity, and the differences between the transplanted parameters and the calibrated parameters were compared. The N S , R 2 , and RE values for Qinduzhen Station were 0.75, 0.87, and 3.9, respectively, in the calibration period, and 0.81, 0.94, and 4.6, respectively, in the validation period. The N S , R 2 , and RE values for Shengxiancun station were 0.85, 0.94, and 23.1, respectively, in the calibration period, and 0.8, 0.94, and −10.8, respectively, in the validation period. Although the simulation accuracy was slightly lower than that of the calibration results based on the measured data, the three evaluation indicators are all within the acceptable range, indicating that the parameter transplantation method based on hydrological similarity is suitable for estimating runoff in basins with no observation data.

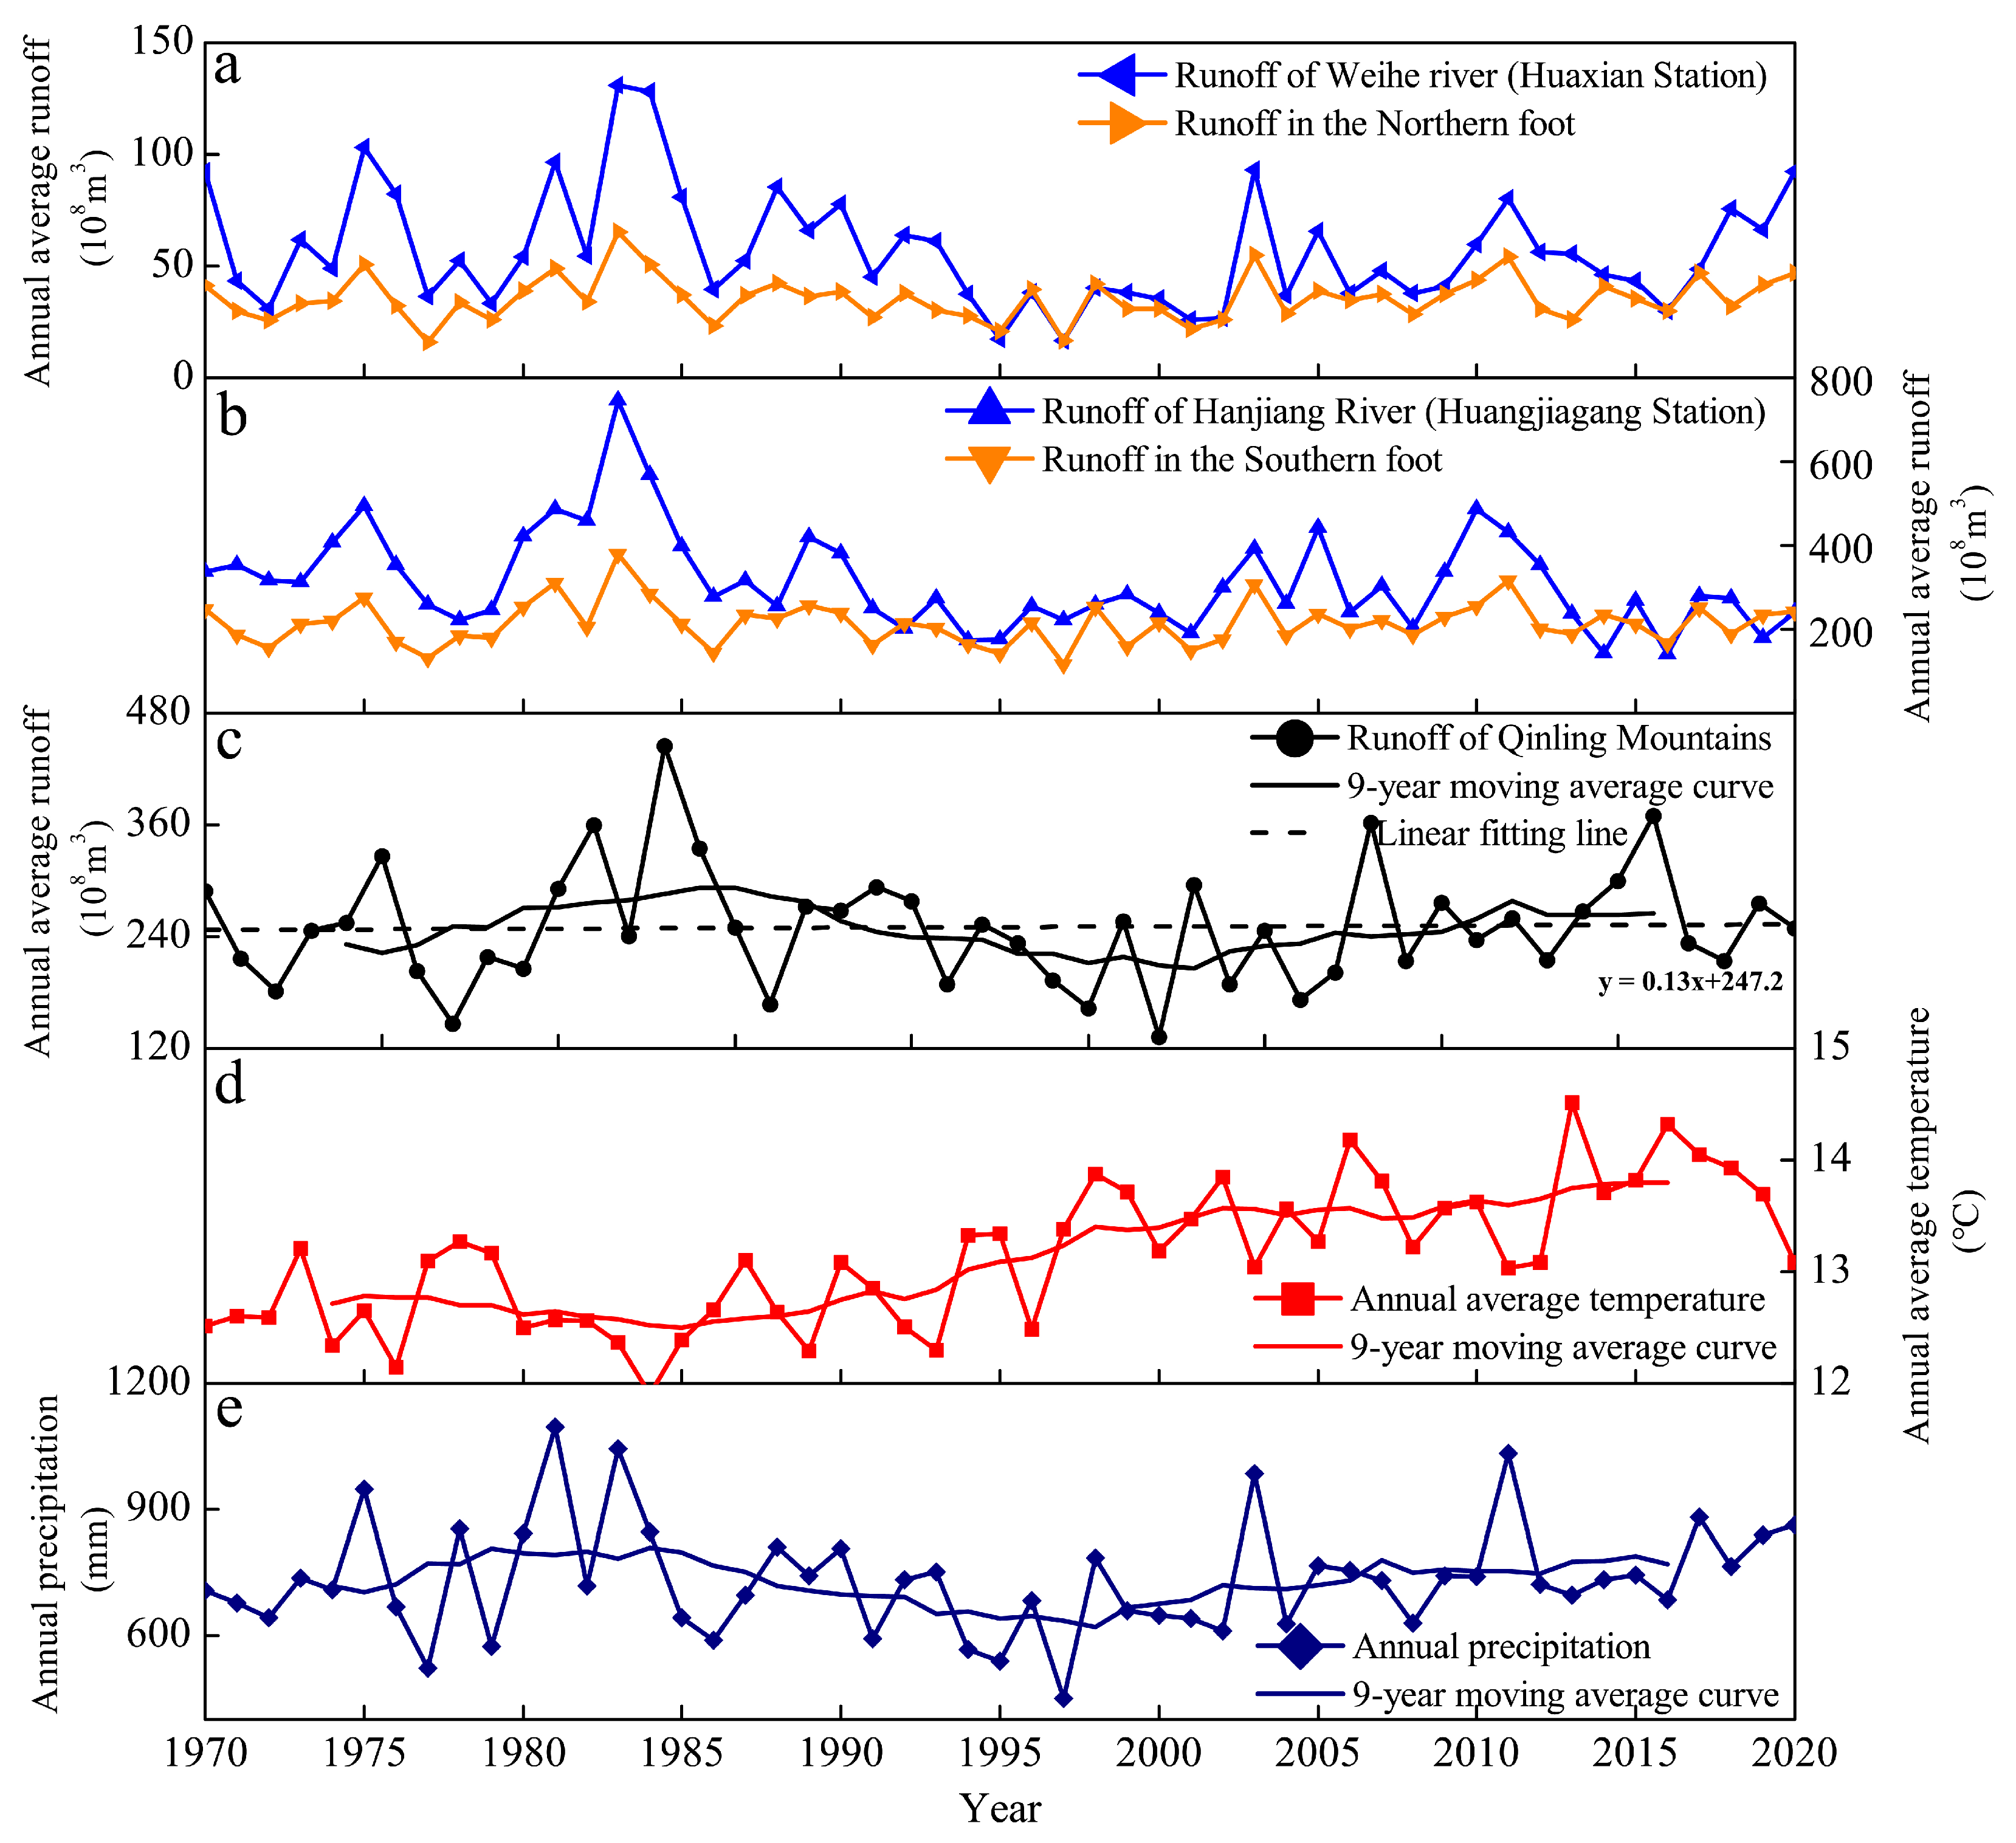
3.3. Runoff Changes in Qinling Mountains from 1970 to 2020

Using parameter calibration and hydrological similarity analysis, the annual average runoff of 58 sub–basins in the northern and southern foothills of the Qinling Mountains from 1970 to 2020 was calculated (Table 2). Distinct differences in the water production processes between the northern and southern foothills of the Qinling Mountains were observed. The 19 sub–basins in the northern foothills are predominantly small to medium sized, with annual average runoff ranging from 19 to 595 million m3/year. Sub–basins with annual runoff below 100 million m3/year account for 77% of the northern foothills. In contrast, the annual runoff of sub–basins in the southern foothills ranges from 0.18 to 2.78 billion m3/year, with the runoff of small and medium–sized basins accounting for only 10.2% of the total runoff.
Figure 4a,b illustrate the variation in annual runoff with time for the northern and southern foothills of the Qinling Mountains from 1970 to 2020. In the northern foothills, annual runoff ranges from 1.6 to 6.5 billion m3/year, with a multi-year average of 3.56 billion m3/year. In contrast, the southern foothills exhibit an annual runoff between 11.6 and 37.9 billion m3/year, with a multi-year average of 21.49 billion m3/year. Over the 51-year period, the total annual runoff fluctuates between 13.26 and 44.47 billion m3/year (Figure 4c), with a linear trend of 0.013 billion m3/year. The interannual fluctuation is substantial, with the highest annual runoff (in 1983) being 3.35 times the lowest annual runoff (in 1997). The multi-year average runoff is 25.05 billion m3/year, with the contribution from the northern foothills being only 14% of the total runoff, while the contribution from the southern foothills is 86%, which is 6.1 times that from the northern foothills. These differences are attributable to the larger basin area and higher precipitation levels in the southern foothills as compared to those in the northern foothills of the Qinling Mountains. From 1970 to 2020, the total runoff in the Qinling Mountains showed a significant increasing trend. The Z-value (Mann–Kendall) exceeded the significance level of 0.05, with the runoff mutation occurring in 1985 (Figure A4).

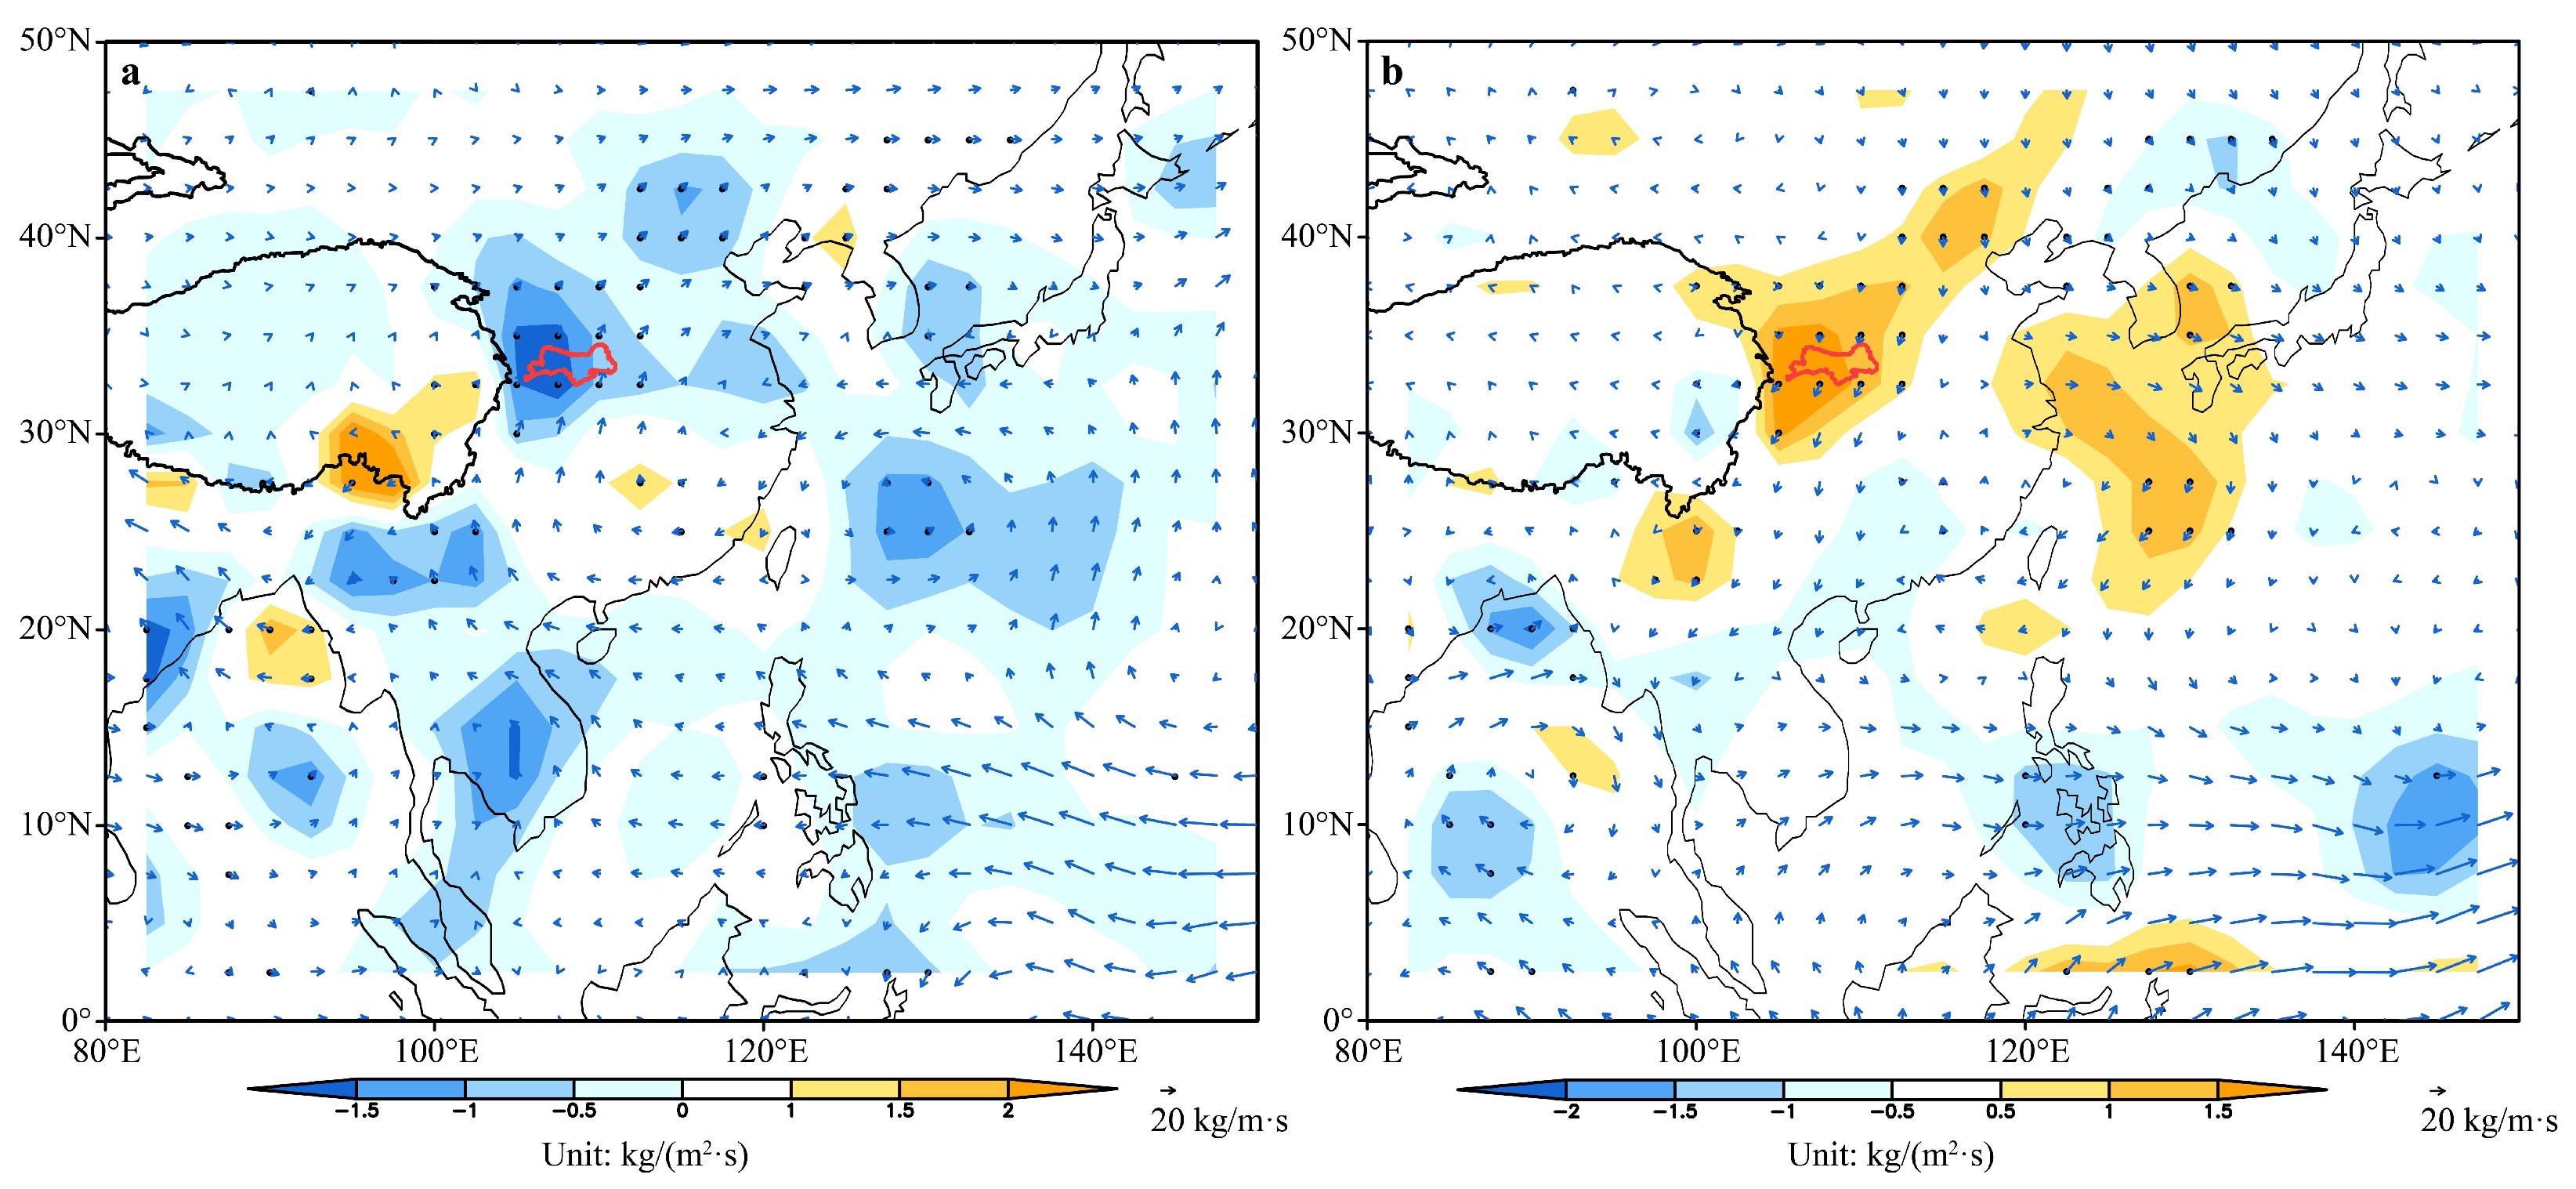
3.4. Relationship Between Runoff Changes and Climate Change in Qinling Mountains

The high elevation of the Qinling Mountains results in the absence of surface or groundwater recharge, except for precipitation. Consequently, temperature and precipitation are the primary natural factors influencing runoff variation (Figure 4d,e). A correlation analysis conducted using SPSS software revealed that from 1970 to 2020, the correlation coefficient between Qinling runoff and precipitation was 0.98, whereas it was −0.3 for temperature. This suggests a strong similarity between the variations in runoff and precipitation, consistent with Hu et al.’s findings in their study of the Ba River basin [24], which indicates that the variation of runoff is influenced by precipitation.
To further explore the relationship between runoff and atmospheric circulation in the Qinling Mountains during wet and dry years, flood season (May–September) precipitation in the study area was standardized. Years with precipitation above or below one standard deviation were categorized as wet or dry years, respectively. Between 1970 and 2020, wet years include 1975, 1978, 1981, 1983, 2003, and 2011, while dry years include 1977, 1979, 1986, 1991, 1994, 1995, and 1997. Using monthly reanalysis data from NECP, the differences in water vapor flux and divergence and multi-year average during flood seasons for wet and dry years were calculated to analyze the corresponding atmospheric circulation. In wet years, enhanced water vapor transport from the equatorial western Pacific to the Qinling Mountains via the South China Sea significantly increased precipitation in the Qinling Mountains (Figure 5a). In the Qinling Mountains, the atmospheric divergence was stronger, atmospheric convergence was strengthened, and convective activity was strong, resulting in abnormally high precipitation in the Qinling Mountains. Conversely, during dry years, these processes were notably weakened (Figure 5b).

4. Discussion

4.1. Impact of Runoff on Regional Water Resources

As the main water source for the Weihe River and Hanjiang River, quantitatively understanding the general runoff changes in the Qinling Mountains is essential for effective water resource management in the basin. The main key questions addressed in this study are as follows: How much runoff is generated in the Qinling Mountains? How much runoff is contributed to the Weihe and Hanjiang Rivers? This has only been estimated once previously [25].
The Weihe Basin (Upstream of Huaxian station) spans 106,000 km2 [26], and the annual runoff was 5.71 billion m3/year from 1970 to 2020. The northern foothills of Qinling Mountains in the Shaanxi section, which make up only 6.6% of the basin area, contributed 3.56 billion m3/year of runoff during the same period, which accounted for 62.4% to Weihe River (Figure 4a). In 51 years, the contribution of runoff from the northern foothills ranged from 57% to 94.4%, indicating that the northern foothills were dominant in the Weihe Basin. It should be noted that the model simulates runoff under natural conditions, whereas observed runoff data are influenced by human activities and natural runoff changes. Therefore, in individual years (such as 1995), the simulated runoff of the northern foothills exceeded that of the observed runoff in the Weihe River. By comparing the natural runoff of the Weihe River in 1995 (6.27 billion m3/year) and the simulated runoff of the northern foothills (2.07 billion m3/year), it can be observed that the simulation results are in line with actual observations. Since 2000, total water consumption in the Guanzhong area of the northern foothills has increased at an annual rate of 50 million m3/year [27]. Comparing the 51-year average runoff of 3.56 billion m3/year, water resources in the northern foothills of the Qinling Mountains can only meet the regional water demand until the 2040s.
The Hanjiang River Basin (Upstream of Huangjiagang Station) spans an area of 95,000 km2 [28], the average annual runoff was 31.53 billion m3/year from 1970 to 2020. The southern foothills of the Qinling Mountains, which accounted for approximately 53% of the basin area, contributed 21.49 billion m3/year of runoff during the same period, which accounted for 68.1% of total runoff in the Hanjiang River (Figure 4b). In 51 years, the southern foothills contributed between 64.4% and 84.6% of the basin’s runoff, indicating that they serve as the primary catchment area. Based on historical changes in runoff in the southern foothills, we conclude that, after fulfilling the ecological and domestic water demands of 8.88 billion m3/year downstream of the Danjiangkou Reservoir [29], the remaining water can provide stable water supplies of 12.61 billion m3/year annually to regions such as Guanzhong, Beijing–Tianjin–Hebei, and Henan through water conservation projects like the Hanjiang River to Weihe River and South–to–North Water Diversion.
Runoff from mountainous areas provides water resources for a large portion of the world’s population, especially in arid and semi-arid regions, where it accounts for 50–90% of the total runoff [30]. The Tianshan Mountains cover only 15% of the area of Xinjiang province in northwest China but provide 54% of the region’s runoff [31]. The Qinling Mountains, which supply over 60% of the runoff for the Weihe River and the Hanjiang River, reflect the crucial role in regional runoff changes.

4.2. Uncertainty Analysis

Hydrological parameters are the main sources of uncertainty in distributed hydrological models. These parameters affect the simulation results by altering the initial conditions, runoff generation, and flow concentration processes. The hydrological parameters of the VIC model include six parameters: the shape parameter B of the saturated capacity curve, the maximum baseflow velocity D m , the proportionality coefficient D s of the maximum base flow velocity when the base flow increases nonlinearly, the ratio W s of the soil moisture content to the maximum soil moisture content during nonlinear baseflow generation, the thickness d 2 of the second soil layer, and the thickness d 3 of the third soil layer. The study draws on the research results of Zhu et al. using the VIC model in the Wei River Basin [32]. In their study, the range of parameter B is between 0.5 and 6, the range of parameter D s is between 0.032 and 0.05, the range of parameter D m is between 2.1 and 30, the range of parameter W s is between 0.8 and 0.845, the range of parameter d 2 is between 0.05 and 4.5, and the range of parameter d 3 is between 0.4 and 1.75. The hydrological parameters of the basin are determined using the uniform design method.
Due to the limitations of the temporal simulation scale of the model, the model lacks a detailed depiction of floods caused by extreme precipitation and is unable to describe the runoff process with high precision. Therefore, this study describes the runoff changes in the Qinling Mountains from a long–term perspective (Annual scale). To overcome the deficiencies of the VIC model in short–term (Hourly) depiction, future research should improve the resolution of meteorological data or utilize specialized flood hydrological models, such as MIKE, to simulate the impact of extreme events on runoff. This study does not discuss future regional runoff changes. The next step in the research is to use climate model projection data (Coupled Model Intercomparison Project Phase 6, CMIP6) in combination with the VIC model to explore the response of mountainous area runoff to climate change in the 2050s.

5. Conclusions

The study used the VIC model to reconstruct the runoff time series in the Qinling Mountains from 1970 to 2020, analyzed its variation trend and impact on the regional environment, and explored its driving mechanisms. The variation of runoff ranged from 13.26 to 44.47 billion m3/year over the past 51 years, with an average value of 25.05 billion m3/year and a linear trend of 0.013 billion m3/year; the overall change is stable while the interannual fluctuation is substantial. Of this, 86% originated from the southern foothills, while 14% came from the northern foothills. The average annual runoffs from the southern and northern foothills are 21.49 and 3.56 billion m3/year, which account for 68.1% and 62.4%, respectively, for the Hanjiang River and Weihe River. They play a leading role in the runoff changes in their basins. Runoff changes are closely linked to precipitation, with the enhancement (weakening) of water vapor transport from the equatorial western Pacific being an important cause of the increased (decreased) runoff volume. The quantitative assessment of runoff changes in the Qinling Mountains can provide data for both the ecological water consumption of the Guanzhong area in the northern foothills and the ecological water allocation of the ‘South–to–North Water Diversion Project’ in the southern foothills.

Author Contributions

Conceptualization, Z.Z. and K.D.; methodology, T.W.; software, Z.Z. and Z.X.; validation, C.Z.; formal analysis, T.W.; investigation, Z.Z. and T.W.; resources, K.D.; data curation, Z.Z.; writing—original draft preparation, Z.Z. and T.W.; writing—review and editing, Z.Z. and T.W.; visualization, C.Z.; supervision, Z.X.; project administration, C.W.; funding acquisition, Z.Z. and T.W. All authors have read and agreed to the published version of the manuscript.

Funding

This research was funded by the Scientific Research Project of the Education Department of Hubei Province (No. B2023152), the open fund of State Key Laboratory of Loess and Quaternary Geology, IEECAS (No. SKLLQG2337), and the Xiaogan Natural Science Program (No. XGKJ2023010065, No. XGKJ2024020001).

Institutional Review Board Statement

Not applicable.

Informed Consent Statement

Not applicable.

Data Availability Statement

The meteorological data for this study come from the China Meteorological Network (http://data.cma.cn/) (accessed on 10 February 2025), circulation data from the NECP website (https://nomads.ncep.noaa.gov/) (accessed on 10 February 2025), elevation data from the Geospatial Data Cloud website (http://www.gscloud.cn/) (accessed on 10 February 2025), soil data from the World Soil Database website (https://www.fao.org/soils-portal/data-hub/soil-maps-and-databases/harmonized-world-soil-database-v12/en/) (accessed on 10 February 2025), land use data from the University of Maryland and the Geospatial Data Cloud website (https://glad.umd.edu/dataset) (accessed on 10 February 2025), and hydrological data from the National Earth System Science Data Center (http://www.geodata.cn) (accessed on 10 February 2025).

Conflicts of Interest

The funders had no role in the design of the study, in the collection, analyses, or interpretation of data, in the writing of the manuscript, or in the decision to publish the results.

Appendix A

Figure A1. The topographic index of the Qinling Mountains.
Sustainability 17 03948 g0a1
Figure A2. The land use of the Qinling Mountains in 2010.
Sustainability 17 03948 g0a2
Figure A3. The soil classification of the Qinling Mountains.
Sustainability 17 03948 g0a3
Table A1. Values of hydrological similarity of subwatersheds in Qinling Mountain.
RiverPrec
(mm)
Elev
(m)
TopoLand-Use
(%)
Soil
(%)
RiverPrec
(mm)
Elev
(m)
TopoLand-Use
(%)
Soil
(%)
Northern foothillsYao Yu59115626.6132.937.5Gan76816336.2944.540.4
Qing Jiang59714376.5630.163.2Lao76816136.2831.365.1
Qing Shui58214016.7338.838.3Tai Ping76916186.2458.939.1
Ma Wei59113376.6556.651.5Gao Guan76116216.3350.545.5
Pan Xi59211606.8434.639.5Feng76116206.3734.636.5
Fa Yu66611996.861.934.6Gao76016046.4935.665.3
Mai Li63610246.7147.737.6Da Yu75815986.5230.961.4
Shi Tou64310346.6754.336Ku Yu75615876.426.750.6
Ba Wang63010136.5939.941.4Chan75416336.5724.954.2
Xi Sha62516606.6433.839.4Wang Yu75016136.3727.355.2
Tang Yu64013586.6943.144.4Ling75015676.4237.740.4
Dong Sha62913846.839.852.5You74915576.3831.760.9
Ni Yu73812226.7955.325.9Chi Shui74815426.6220.880.1
Zhu Yu71911546.6841.524.9Shi Ti74815836.5635.524.1
Che Yu70212206.5132.932.9Luo Wen74715696.6433.334.7
Sha69410676.430.142.2Fang Shan Yu74715696.7429.231.6
Hei78218436.5446.361.9Luo Fu74615686.722.234.1
Jiu Yu77316376.4130.952.1Chang Jian74515656.7125.832.6
Tian Yu77214386.432.953.6Tong74615596.6527.570
Geng Yu77113446.2826.741.7total71014556.56
Southern foothillsJia Ling71315806.9934.518.8Chi80715006.5421.334.5
Heihe75215807.3142.629.3Zi Yang81215206.6530.838.1
Yan75416126.8429.650.2Yue78410746.6135.130.3
Bao75515436.6123.525.5Xun75412086.6142.634.3
Xu Shui77415166.6135.940.1Jin Qian72112436.6231.945.4
Yi Shui77115706.8223.741.2Dan7009696.7322.818.9
Dang Shui77215686.6725.639.6Luo68411316.8824.437.6
You Shui77516506.8423.932.7Shu75111927.1416.816.6
Jin Shui77717406.934.445.2You Jiang72112356.622146.2
Zi Wu81015316.9233.444.5total75714196.78
Total 72614426.62
‘Prec’ represents precipitation, ‘Elev’ represents elevation, ‘Topo’ represents topographic index, ‘Land-use’ represents proportion of main land-use, ‘Soil’ represents proportion of main soil type.
Figure A4. Results of Mann–Kendall analysis of runoff in Qinling Mountains.
Sustainability 17 03948 g0a4

References

  1. Jin, N. Research on the Current Status of Water Resources Development and Utilization in the Northern Foothills of the Qinling Mountains in Shaanxi and a Proposal for Collaborative Allocation. Shaanxi Water Resour. 2024, 10, 47–50. [Google Scholar]
  2. Li, S.W. Analysis on ecosystem protection and restoration at the northern foot of Qinling Mountains. Shaanxi Water Resour. 2019, 2, 103–107. [Google Scholar]
  3. Dang, H.; Liu, G.; Ma, Q.R.; Cao, L. Present situation of water resources development and utilization and analysis of water saving potential in Guanzhong area of Shaanxi Province. Shaanxi Water Resour. 2019, 6, 75–77. [Google Scholar]
  4. Xiao, Z.T. Study on Adaptive Protection Mode and Planning Strategy of Northern Foot of Qinling Mountains (Xi’an Section) from the Perspective of Landscape City. Ph.D. Thesis, Xi’an University of Architecture and Technology, Xi’an, China, 2013. [Google Scholar]
  5. He, S.N.; Hao, C.Y. Analysis on spatial-temporal variation characteristics of climate in Qinling-Huaihe demarcation zone since 1961. Ecol. Indic. 2024, 158, 111345. [Google Scholar] [CrossRef]
  6. Ma, R.T.; Huang, L.M.; Sheng, B. Catastrophe analysis of annual runoff series in typical basins at the northern foot of Qinling Mountains. J. Water Resour. Water Eng. 2016, 2, 76–79. [Google Scholar]
  7. He, Y.; Qiu, H.; Song, J.; Zhao, Y.; Zhang, L.; Hu, S.; Hu, Y. Quantitative contribution of climate change and human activities to runoff changes in the Bahe River watershed of the Qinling Mountains, China. Sustain. Cities Soc. 2019, 51, 101729. [Google Scholar] [CrossRef]
  8. Ke, X.Y.; Wang, N. Comparative study on runoff change law of typical watersheds in north and south of Qinling Mountains. J. Xi’an Univ. Technol. 2019, 4, 452–458. [Google Scholar]
  9. Hao, C.Y.; He, S.N. The Spatiotemporal Dynamics of Temperature Variability Across Mts. Qinling: A Comparative Study from 1971 to 2022. Sustainability 2024, 16, 9327. [Google Scholar] [CrossRef]
  10. Wang, Z.P.; Shen, B.; Lu, J.Q. Effects of climate change and human activities on runoff in the headwater area of Bahe River. J. Water Resour. Water Eng. 2012, 6, 99–101. [Google Scholar]
  11. Li, Y.Y.; Bai, J.F.; Zhou, W.B.; Song, Y. Influence of climatic factors on water and sediment change in Bahe River basin. Water Conserv. 2017, 5, 98–105. [Google Scholar]
  12. Bai, H.Y.; Hou, Q.L.; Ma, X.P.; Zhang, J.; Yuan, B. Hydrological characteristics and its response to precipitation changes in Qianqian River basin of Qinling Mountains in the past 50 years. Geogr. Sci. 2012, 32, 1230–1235. [Google Scholar]
  13. Hu, S.; Qiu, H.J.; Yang, D.D.; Cao, M.; Song, J.; Wu, J.; Huang, C.; Gao, Y. Evaluation of the application of climate forecast system reanalysis weather data for hydrologic simulation: A case study in the Bahe River Base of the Qinling Mountains, China. J. Geogr. Sci. 2017, 27, 546–564. [Google Scholar] [CrossRef]
  14. Zhang, X.Y.; He, Y. Impact of Climate Change and Human Activities to Runoff in the Du River Basin of the Qinling-Daba Mountains, China. Remote Sens. 2023, 15, 5178. [Google Scholar] [CrossRef]
  15. Wang, J.; Zhou, Q.H. Carrying capacity of tourism water resources in the northern foot of Qinling Mountains in Xi’an. J. Northwest Univ. (Nat. Sci. Ed.) 2015, 45, 997–1000. [Google Scholar]
  16. Li, D.W.; Duan, K.Q.; Li, S.S.; Shang, W.; Zhang, Z. Vertical variation of precipitation in the central Qinling Mountains. Acta Geogr. Sin. 2022, 7, 1762–1773. [Google Scholar]
  17. Hu, S.; Cao, M.M.; Qiu, H.J.; Song, J.; Wu, J.; Gao, Y.; Li, J.; Sun, K. Applicability evaluation of CFSR meteorological data in watershed hydrological simulation—A case study of Bahe River basin. J. Geogr. 2016, 9, 1571–1586. [Google Scholar]
  18. Zhang, Z.P.; Duan, K.Q.; Liu, H.C.; Meng, Y.L.; Chen, R.; Li, D.W.; Li, S.S. Runoff projections of the Qinling Mountains and their impact on water demand of Guanzhong region in Northwest China. J. Mt. Sci. 2022, 19, 2272–2285. [Google Scholar] [CrossRef]
  19. Lu, F.Z.; Lu, H.Y. Establishment of high-resolution grid data set of temperature and precipitation in Qinling-Dabashan mountains and its indication to regional climate. J. Geogr. 2019, 5, 875–888. [Google Scholar]
  20. Zheng, W.F.; Yang, X.L.; Cheng, X.R.; Wang, Y.; Zhang, M. Prediction of main hydrological processes in the upper reaches of the Yangtze River based on CMIP5 and VIC models. J. China Hydrol. 2018, 6, 48–53. [Google Scholar]
  21. Zhu, Y.L.; Chang, J.X. Application of comprehensive drought index based on VIC model in Yellow River Basin. J. Northwest A&F Univ. Nat. Sci. Ed. 2017, 2, 203–212. [Google Scholar]
  22. Yao, C.; Zhang, Y.X.; Li, Z.J.; Sun, L. Hydrological simulation and similarity analysis in areas without data. J. Hehai Univ. (Nat. Sci. Ed.) 2013, 41, 108–113. [Google Scholar]
  23. Yang, Y.H. Runoff Analysis of the Northern Foot of Qinling Mountains in Xi’an Based on SWAT Model. Master’s Thesis, Chang’an University, Xi’an, China, 2015. [Google Scholar]
  24. Hu, S.; Qiu, H.J.; Song, J.X.; Ma, S.; Yang, D.; Pei, Y.; Yang, W.; Cao, M. Influencing mechanisms of climate change on runoff process in the north slope of Qinling Mountains:A case of the Bahe River Basin. Arid Land Geogr. 2017, 40, 976–978. [Google Scholar]
  25. Dong, W.X. Study on Water Resources and Its Development and Utilization in Qinling Mountains. Master’s Thesis, Northwest University, Xi’an, China, 2015. [Google Scholar]
  26. Wei, H.Y.; Li, J.; Wang, J.; Tian, P. Analysis of runoff change trend and its influencing factors in Weihe River basin. Bull. Soil Water Conserv. 2008, 1, 76–80. [Google Scholar]
  27. Zheng, A.Q.; Wang, W.K.; Duan, L. Analysis of water use structure change and its driving factors in Guanzhong basin. Resour. Environ. Arid Areas 2011, 9, 75–79. [Google Scholar]
  28. Lian, L.L.; Zhao, X.J.; Zhen, Z.J. Application of drop index method in calculating the relationship between water level and discharge-taking Huangjiagang hydrological station of Hanjiang River as an example. People’s Yangtze River 2013, 23, 70–72. [Google Scholar]
  29. Meng, M. Study on the Influence of Climate Change on Adjustable Water Quantity and Water Supply Risk in the Middle Route of South-to-North Water Transfer Project. Master’s Thesis, Zhengzhou University, Zhengzhou, China, 2019. [Google Scholar]
  30. Daniel, V.; Rolf, W. The hydrological significance of mountains: Form regional to global scale. Hydrol. Earth Syst. Sci. 2004, 8, 1016–1029. [Google Scholar]
  31. Qiang, Z.; Xu, C.Y.; Hui, T.; Tao, J.; Chen, Y.D. Climate changes and their impacts on water resources in the arid regions: A case study of the Tarim River basin, China. Stoch. Environ. Res. Risk Assess. 2010, 24, 349–358. [Google Scholar]
  32. Zhu, Y.L.; Chang, J.X. Calibration of parameters for VIC model based on uniform design method. J. Northwest A&F Univ. 2015, 43, 217–224. [Google Scholar]
Figure 1. Location (a), elevation (b), and meteorological and hydrological stations (c) of the study area.
Sustainability 17 03948 g001
Figure 2. The spatial distribution of annual average precipitation in the Qinling Mountains and a comparison of interaction with observed values at Taibai Station from 1970 to 2020 (Dashed lines represent 51-year average value).
Sustainability 17 03948 g002
Figure 3. Comparison of the monthly runoff simulated and measured values in hydrological stations (Calibrated period: (a1f1); Validated period: (a2f2); (a) Heiyukou; (b) Maduwang; (c) Xiangjiaping; (d) Changtancun; (e) Qinduzhen; (f) Shengxiancun).
Sustainability 17 03948 g003
Figure 4. Annual average runoff at northern foothills (a), annual average runoff at southern foothills (b), annual average runoff (c), annual average temperature (d), and annual average precipitation (e) from 1970 to 2020 in Qinling Mountains.
Sustainability 17 03948 g004
Figure 5. Difference of water vapor transport flux (unit: kg/m·s) and divergence (unit: kg/(m2·s)) between total and climatological mean state in extreme years ((a) years of heavy rainfall; (b) years with little rain; the red line is the research area, the dotted areas represent the 0.05 significance test was passed).
Sustainability 17 03948 g005
Table 1. The simulation results of the watershed in the Qinling Mountains with measures.
Sub–BasinHydrological StationRate PeriodVerification Period
N S R 2 RE (%) N S R 2 RE (%)
Southern foothillsJialingFengzhou0.730.9115.790.690.935.10
Qu ShuiChadian0.810.9524.110.790.9417.13
BaoMa Dao0.880.968.730.850.9412.89
Xu ShuiSheng Xian Cun0.850.9419.140.810.94−13.76
Yi ShuiChang Tan Cun0.730.8716.530.650.84−18.95
You ShuiYou Shui0.710.917.100.810.96−3.53
Zi WuLiang He Kou0.610.8921.730.630.9118.57
ChiMa Chi0.830.9211.320.720.9−8.1
YueChang Qiang Pu0.810.9320.590.830.9516.48
XunXiang Jia Ping0.820.9418.410.870.94−2.10
ShuShu River0.710.85−0.520.880.95−2.67
Jin QianNan Kuan Ping0.630.946.210.610.84−13.21
DanDan Feng0.80.9421.440.710.9118.77
LuoLing Kou0.790.9116.230.620.88−11.69
Northern foothillsHeiHei Yu Kou0.820.92−19.50.760.91−17.4
LaoLao Yu Kou0.850.90−14.20.840.93−11.5
BaMa Du Wang0.780.93−25.10.740.91−22.2
FengQin Du Zhen0.770.892.50.820.913.8
The order of hydrological stations is from west to east in Figure 1c.
Table 2. Similar results of runoff and hydrology of substream in Qinling Mountains.
RiverArea
(km2)
Runoff
(108 m3/Year)
Proportion
(%)
Hydrologically
Similar Basin
RiverArea
(km2)
Runoff
(108 m3/Year)
Proportion
(%)
Hydrologically
Similar Basin
Northern foothillsYao Yu4731.644.61LaoGan770.20.56Lao
Qing Jiang790.250.7LaoLao3030.922.58-
Qing Shui2540.982.75LaoTai Ping Yu4311.423.99Wang Yu
Ma Wei140.270.76LaoGao Guan Yu690.220.62Lao
Pan Xi770.290.81LaoFeng2030.722.02-
Fa Yu710.250.7LaoHao690.230.65Lao
Mai Li1270.511.43LaoDa Yu1520.51.4Lao
Shi Tou660.260.73LaoKu Yu2731.022.86Lao
Ba Wang630.250.7LaoChan5722.216.21Hei
Xi Sha7202.87.86Wang YuWang Yu11055.1114.35-
Tang Yu790.250.7LaoLing1280.621.74Lao
Dong Sha2050.762.13LaoYou1270.551.54Lao
Ni Yu1480.491.38LaoChi Shui770.240.67Lao
Zhu Yu650.240.67LaoShi Ti610.220.62Lao
Che Yu600.230.65LaoLuo Wen4691.74.77Hei
Sha600.260.73LaoFang Shan Yu4691.74.77Hei
Hei15706.1317.21-Luo Fu570.20.56Lao
Jiu Yu650.210.59LaoChang Jian840.20.56Lao
Tian Yu2030.681.91LaoTong910.210.59Lao
Geng Yu6172.166.07HeiTotal944835.6100
Southern foothillsJia Ling686827.8912.98-Chi14707.253.37-
Heihe20308.884.13-Zi Yang15428.253.84Shu
Yan7713.41.58You ShuiYue315813.876.45-
Bao394118.18.42-Xun644824.2411.28-
Xu Shui230712.355.75-Jin Qian468926.1712.18-
Yi Shui4872.241.04-Dan755219.79.16-
Dang Shui4131.920.89Yi ShuiLuo30722.31.07-
You Shui12615.762.68-Shu4911.830.85-
Jin Shui7653.761.75You ShuiYou Jiang4798.84.09Shu
Zi Wu363918.218.47-Total51,383214.9100
Total 60,831250.5
The order of the basin is from west to east in Figure 1c.
Disclaimer/Publisher’s Note: The statements, opinions and data contained in all publications are solely those of the individual author(s) and contributor(s) and not of MDPI and/or the editor(s). MDPI and/or the editor(s) disclaim responsibility for any injury to people or property resulting from any ideas, methods, instructions or products referred to in the content.

