Article

Digital Transformation and Corporate Carbon Emissions: Evidence from China’s Listed Companies

1
School of Accounting, Hunan University of Technology and Business, Changsha 410205, China
2
School of Business Administration, Hunan University of Technology and Business, Changsha 410205, China
3
School of Economics and Management, Changsha University, Changsha 410022, China
*
Author to whom correspondence should be addressed.
Sustainability 2025, 17(9), 3944; https://doi.org/10.3390/su17093944
Submission received: 28 November 2024 / Revised: 20 March 2025 / Accepted: 15 April 2025 / Published: 27 April 2025

Abstract

:
Digital transformation is a crucial engine empowering enterprises for green, low-carbon development and a key pathway towards achieving China’s dual carbon goals. To investigate the carbon-emission reduction effects and mechanisms of corporate digital transformation, the panel data of China’s A-share listed companies from 2010 to 2021 were utilized to empirically examine the impact and mechanisms of digital transformation on corporate carbon emissions in this study, based on the dynamic capability and resource-based theory. The results show that the following: (1) Digital transformation demonstrates significant potential in reducing corporate carbon emissions; (2) The emission reduction effects are primarily achieved through the three key mechanisms of enhancing green innovation capabilities, alleviating financing constraints, and optimizing human capital structures; (3) The effect of digital transformation on carbon emission reductions demonstrates significant heterogeneity across enterprise characteristics and geographical locations, with particularly notable impacts observed in high-tech firms, state-owned enterprises, carbon-intensive industries, and companies located in eastern China. Therefore, we should vigorously promote the process of digital transformation of enterprises and implement targeted policy measures to support corporate green innovation, enhance financing accessibility, and optimize human capital structure. Simultaneously, we should develop differentiated emission reduction mechanisms that account for enterprise-specific characteristics, thereby maximizing the effectiveness of digital transformation in achieving dual-carbon objectives.

1. Introduction

In recent years, the global climate crisis has emerged as a paramount concern within the international community [1]. This universal challenge has fostered a global consensus on the imperative need for climate change mitigation and carbon emission reductions [2]. As a responsible major power, China actively engages in global environmental governance and honors its pledge to reduce emissions [3,4]. In September 2020, China introduced the dual carbon goals of “aiming to reach peak carbon dioxide emissions before 2030 and to achieve carbon neutrality before 2060” at the 75th United Nations General Assembly [5,6]. It has become a pivotal national strategy for China to adopt the “dual carbon target” as a fundamental framework, to drive comprehensive green economic transformation and achieve high-quality, sustainable development.
It is noteworthy that the booming digital economy has become a driving force for high-quality economic growth in China [7,8]. The integration of the digital economy with traditional industries has demonstrated reformation potential in addressing innovation demands and energy conservation challenges. This has emerged as a critical pathway for regional low-carbon transitions, particularly through its significant contributions to energy efficiency improvements and carbon emission reductions [9]. However, enterprises are both primary sources of carbon emissions and key implementers of emission reduction initiatives [10,11]. To develop targeted and specific emission reduction strategies, it is imperative to concentrate on the influence of digital transformation on corporate carbon emissions. Nowadays, as micro-entities of carbon emission reductions and high-quality development, the effectiveness of enterprises’ digital transformation in achieving carbon mitigation plays a decisive role in realizing China’s dual-carbon targets and fostering sustainable economic growth. However, it has not been fully verified whether and how digital transformation can promote corporate carbon emission reductions. This study addresses the two following important questions: (1) Can digital transformation reduce corporate carbon emissions? (2) How can digital transformation reduce corporate carbon emissions?
According to the dynamic capability view (DCV), an enterprise’s long-term competitiveness depends on its “dynamic capability”, which represents the enterprise’s ability to integrate, organize, and reconfigure internal and external resources to adapt to the rapidly changing environment [12]. By enhancing this dynamic capability, digital transformation can promote corporate carbon reductions [13]. At the same time, the resource-based view (RBV) holds that resources with value, scarcity, inimitability, and irreplaceability are the key to enterprises obtaining competitive advantages [14]. As an important strategic resource for enterprises [15], digital transformation can promote the allocation of technology, capital, talent, and other elements [16], thereby reducing corporate carbon emissions.
Therefore, this study explores the impact of digital transformation on carbon emissions based on the DCV and RBV and chooses Chinese A-share listed companies from 2010 to 2021 as samples for empirical analysis. Additionally, this study delves into three pathways in which digital transformation affects corporate carbon emissions. Firstly, digital transformation reduces corporate carbon emissions through a “technology” path. Secondly, digital transformation reduces corporate carbon emissions through the “capital” path. Thirdly, digital transformation reduces corporate carbon emissions through the “talent” path. In addition, the carbon reduction effect of digital transformation varies depending on enterprise characteristics such as technological attributes, property rights, carbon emission characteristics, and regional location.
This paper’s marginal contributions are as follows. First, based on the DCV and RBV, the carbon emission reduction effect of enterprise digital transformation is discussed from a micro-perspective. Second, different from previous research results, by combining the DCV and RBV theories, this paper verifies that digital transformation can reduce corporate carbon emissions from the aspects of green technology innovation level, financing constraints, and human capital structure, and further clarifies the mechanism of digital transformation affecting corporate carbon emissions. Third, it examines the heterogeneity of the carbon emission reduction effects of digital transformation from multiple corporate characteristics such as technological attributes, the nature of property rights, carbon emission characteristics, and regional location. This further delineates the boundary conditions under which corporate digital transformation can effectively reduce carbon emissions.

2. Literature Review

Over the past few years, with the flourishing of the digital economy and the growing awareness of low-carbon growth, a multitude of scholars both domestically and internationally have engaged in comprehensive discussions regarding the connection between the digital economy and carbon emissions from a macro-perspective, focusing on regions and sectors. Nevertheless, a unified agreement has not yet been established. Certain studies by scholars have suggested that digital transformation has the potential to decrease carbon emissions in regions and facilitate their shift towards low-carbon economies through the improvement of industrial configurations [17,18], reducing energy intensity [19,20]. However, the impact of carbon emission reductions exhibits notable regional heterogeneity, and it is not substantial in resource-based economic regions [21]. Other studies have verified that the process of digitalization can lead to improvements in China’s energy efficiency and a reduction in energy usage, thereby achieving enhancements in both productivity and carbon efficiency [22]. On the other hand, some scholars have found that digitalization has intensified carbon emissions. Wang et al. (2023) found that the utilization and advancement of digital technology have spurred economic expansion, yet they have concurrently contributed to a surge in carbon emissions within the industry [8]. Other research has indicated that the proliferation of digital technologies, including the internet, has contributed to a rise in carbon emissions in developing nations such as China and India [23,24]. Additionally, some scholars have argued that the correlation between digitalization and carbon emissions is non-linear. Yang et al. (2022) determined that the progression of digitalization substantially lowered the intensity of carbon emissions in urban areas [25,26], and its impact on the aggregate quantity of carbon emissions follows an inverted “U” shaped curve pattern [27,28]. In addition, Wang et al. (2023) determined that significant reductions in carbon emissions of heavily polluting industries are achievable through digital transformation only when the emissions reach a specific level [29].
Compared to the macro-level, there is relatively less research that starts from the micro-level to focus on the carbon emission reduction effects of corporate digital transformation, and no consensus has yet been formed. Some scholars have found that digital transformation can reduce corporate carbon emissions [30,31]. However, there exists a certain heterogeneity in its carbon emission reduction effects. Specifically, the impact of digital transformation is more pronounced for enterprises situated in regions with robust intellectual property protection and for capital-intensive enterprises. Nevertheless, no heterogeneity is observed in terms of enterprise type, environmental regulatory intensity, and the development of enterprise information infrastructure [32]. Some scholars also believe that the impact of digital transformation on corporate carbon emissions shows an inverted U-shape [33,34]. Yu et al. (2023) found that digital transformation has the potential to lower the carbon emission intensity of enterprises, but short-sighted management will impact its effectiveness [35]. Lin et al. (2024) suggested that digital transformation can reduce corporate carbon emissions by reducing managers’ short-sightedness [36]. Some scholars have also confirmed that digital transformation has increased corporate carbon emissions [37]. In terms of the influence mechanism, some scholars believe that enterprises reduce their carbon emissions through optimizing the supply chain [38,39], improving technology [40,41], and enhancing capacity utilization [42]. Some scholars believe that enterprises are affected by external mechanisms, such as new media exposure [43] and financial subsidies [44,45].
In summary, the existing literature provides important references and ideas for in-depth discussion on the impact of digital transformation on corporate carbon emissions, but there are the following deficiencies. Current studies simply discuss the impact of digital development on carbon emissions, with an unclear mechanism selection, or use of provincial and industry-level data to discuss the impact of digital development on carbon emissions. In contrast, the influence of digital transformation on enterprises is diverse and all-encompassing, and its effects on carbon emissions are also complex. The process by which digital transformation impacts corporate carbon emissions remains to be fully investigated. Therefore, combined with the DCV and the RBV, in this research, an empirical analysis is conducted on the impact of corporate digital transformation on carbon emission reductions and its underlying mechanisms, drawing on data from Chinese A-share listed companies between 2010 and 2021. It also elucidates the intricate interplay between digital transformation and carbon emissions, offering theoretical support and micro-level evidence to assist enterprises in harnessing the benefits of digitization to attain carbon emission reduction goals.

3. Theoretical Analysis and Hypothesis Formulation

3.1. Digital Transformation and Corporate Carbon Emissions

Enterprises have three dynamic capabilities: absorptive capacity, innovative capacity, and adaptive capacity [46]. These capabilities help enterprises to respond quickly to environmental changes and uphold their competitive advantages [47]. Therefore, dynamic capability directly promotes carbon emission reductions in enterprise digital transformation.
Firstly, digital transformation reduces corporate carbon emissions by enhancing the absorptive capacity. Enterprises utilize digital technologies, such as the Internet and big data, to acquire more timely and accurate external information [48] and accelerate internal information sharing and absorption. This can assist enterprises in gaining a clearer understanding of the changes in “green” market demand and the environmental pressure exerted by stakeholders such as the government [49]. Moreover, digital tools will promote cooperation among enterprises, streamline information storage and analysis links, and accelerate knowledge transfer among partners to enhance the knowledge absorption capacity of enterprises [50]. Therefore, when encountering environmental pressure, enterprises with stronger knowledge absorption capabilities can better integrate their knowledge into the research and application of emission reduction technologies. This enables them to more effectively develop carbon reduction plans and encourage the reduction in carbon emissions.
Secondly, digital transformation reduces corporate carbon emissions by enhancing innovative capabilities. Enterprises can gain a fresh drive for innovation through digital transformation. On the one hand, digital technology-based internet business models have facilitated closer relationships between enterprises and consumers. This can encourage consumers to participate more widely in the entire process of product production and value creation, serving as a significant catalyst for enterprise innovation [51]. On the other hand, enterprises can break through the “R&D silo” by leveraging digital technologies such as big data and the Internet. This enables them to establish a collaborative innovation system among industry, academia, and research, thereby enhancing their innovation capabilities [13]. Enterprises with strong innovation capabilities have the ability to produce environmentally friendly products at a higher rate [50] and replace non-clean products with environmentally friendly products, thereby improving carbon reduction performance [52].
Finally, digital transformation reduces carbon emissions by enhancing adaptive capacity. The adaptability of enterprises emphasizes that of available resources [46]. Enterprises use digital technology to continuously penetrate and break down information silos among enterprises, accelerate the flow of factor resources, and optimize resource allocation [53]. Consequently, this reduces energy consumption and improves corporate carbon performance [37]. Based on the above analysis, this study proposes Hypothesis 1:
H1. 
Digital transformation can reduce corporate carbon emissions.

3.2. The Impact Mechanism of Digital Transformation on Corporate Carbon Emissions

The RBV posits that the competitive advantages of enterprises are derived from resources that possess value, scarcity, inimitability, and irreplaceability [14]. As a crucial strategic resource for enterprises, digital transformation can help reduce corporate carbon emissions by promoting green technology innovation (technology), alleviating financing constraints (capital), and optimizing human capital structure (talent), as shown in Figure 1.

3.2.1. Digital Transformation, Green Technology Innovation, and Corporate Carbon Emissions

The current literature indicates that digital transformation is a crucial factor in promoting the innovation of green technologies within enterprises [54]. Firstly, digital transformation can facilitate the sharing of information on internal and external environments and resources [55], encouraging enterprises to actively engage in the exploration and practice of green technologies. Secondly, the application of digital technologies, including big data analysis and digital simulation, aids enterprises in achieving the intelligent management of R&D innovation. This reduces the trial and error costs associated with green technological innovation and fosters its advancement within enterprises [56]. Lastly, the integration of abundant information is a prerequisite for green technological innovation [54]. Through the application of digital technologies to process, analyze, and transform extensive datasets into low-carbon and environmentally sustainable information necessary for business operations [57], organizations create a solid foundation of knowledge for research and development in green technology. This, in turn, contributes to the increased efficiency of innovations in green technology.
The enhancement of green technological innovation levels, on one hand, can help enterprises develop and adopt more energy-efficient equipment, systems, and processes, reducing energy consumption and carbon emissions [58]. On the other hand, it promotes the concentrated use of energy, improves energy utilization efficiency, and effectively reduces carbon emissions. Additionally, green technological innovation contributes to the advancement of renewable energy development and optimizes its use by enterprises [59], facilitating corporate carbon emission reduction. Based on the above analysis, this study proposes Hypothesis 2:
H2. 
Digital transformation can reduce carbon emissions by improving the level of green technology innovation in enterprises.

3.2.2. Digital Transformation, Financing Constraints, and Corporate Carbon Emissions

In the process of carbon emission reduction, companies typically require substantial financial investment. Digital transformation can assist enterprises in addressing the financing challenges associated with carbon emission reduction. Firstly, through digital information-sharing technologies such as big data and the Internet, companies can filter and collect more relevant information [60] to better understand government environmental policy directions, which is beneficial for companies to secure more government policy support and win the favor of investors [61], thereby expanding financing channels. Secondly, the digital transformation of enterprises is consistent with China’s strategy for the development of the digital economy. In response, governments at both national and local levels have implemented a range of fiscal incentives to foster enterprises to transform [62]. Additionally, the enterprises are more likely to obtain financing from financial institutions [61], expanding the scale of corporate financing. Lastly, enterprises undergoing digital transformation not only have easier access to special loans for digital transformation established by the government to reduce transnational financing costs but can also enhance stock liquidity by reducing market frictions caused by information issues [63], thereby lowering the required rate of return from investors, making financing costs lower [64]. Enterprises with lower financing constraints have less financial pressure and are more willing and capable of engaging in carbon emission reduction activities when facing carbon emission reduction pressures. On one hand, these enterprises are more likely to use clean energy and purchase environmentally friendly equipment [37], promoting the enterprise to enhance its emission reduction capabilities and reduce energy and carbon emission intensities [35]. On the other hand, management of enterprises with ample funds can focus more on long-term strategies without being excessively distracted by short-term goals, which helps the enterprise to form a robust strategic vision and effectively formulate and implement carbon emission reduction strategies. Based on the above analysis, this paper proposes Hypothesis 3:
H3. 
Digital transformation reduces corporate carbon emissions by alleviating financing constraints.

3.2.3. Digital Transformation, Human Capital Structure, and Corporate Carbon Emissions

Human capital not only contributes to the enhancement of corporate competitiveness but also effectively reduces corporate carbon emissions [65]. Enterprises can reduce carbon emissions by optimizing the structure of human capital through digital transformation. Firstly, the application of digital-intelligence equipment will replace low-skilled positions that involve routine and repetitive labor [66]; concurrently, as digital technology becomes increasingly intertwined with the production and operational processes of businesses [67], it encourages the establishment of new digital departments and positions, thereby optimizing the functional structure of human capital. Secondly, digital transformation involves enterprises continuously improving and upgrading their business models by leveraging information technologies such as cloud computing, block-chain, and artificial intelligence. This process often relies on employees with higher levels of education and professional skills [68]. Therefore, digital transformation amplifies the demand for highly educated and highly skilled talent, which facilitates the optimization of the quality structure of human capital. An optimized structure of human capital can enhance the optimal allocation of internal resources within enterprises [69], effectively enhancing the total factor productivity of enterprises, and thus reducing corporate carbon emissions. Based on the above analysis, this paper proposes Hypothesis 4:
H4. 
Digital transformation reduces corporate carbon emissions by optimizing human capital structure.

4. Study Design

4.1. Sample and Data

The swift evolution of digital technology in China and the digital transformation of businesses have mainly unfolded post-2010 [70]. As such, this research targets Chinese A-share listed companies in Shanghai and Shenzhen from 2010 to 2021 as its preliminary research cohort. It screened them based on the following criteria: (1) exclusion of ST, *ST, and PT companies; (2) exclusion of financial companies; (3) exclusion of samples with significant amounts of missing data. As a result, data from 3337 listed companies were obtained, with a total of 20,278 observations. In addition, this study applied a 1% truncation to continuous variables. The data were mainly derived from CMSAR, annual corporate reports, environmental reports, and social responsibility reports, as well as China Statistical Yearbook and various provincial statistical yearbooks.

4.2. Variable Measurement and Description

4.2.1. Carbon Emissions (CE)

To neutralize the effect of company size, this study gauged corporate carbon emissions using the ratio of total carbon emissions to total assets at the end of the year. The calculation of the total carbon emissions of companies adheres to the methodology proposed by Wang et al. (2022) [71].
According to the specific disclosure situation of enterprises, we divided enterprises into two categories. The first type directly discloses annual direct carbon emissions, indirect carbon emissions or total carbon emissions. For these businesses, we used the data disclosed in their reports directly and standardized them into the same unit. The second type does not directly disclose annual carbon emissions, but discloses different types of fossil energy consumption, electricity consumption and heat consumption. For these enterprises, we calculated their Category I and Category II emissions according to the Guidelines for Enterprise Greenhouse Gas Emissions Accounting and Reporting (hereinafter referred to as the “Guidelines”) issued by the National Development and Reform Commission for different industries. If the company had these two characteristics, we added them together to obtain the total carbon emissions. According to the 2006 IPCC Guidelines for National Greenhouse Gas Inventories, one method of calculating carbon emissions from fuels is the following:
CE = AD × EF
AD represents the activity data of fossil fuel consumption, obtained by multiplying the fuel consumption by its average lower calorific value, and EF is the emission factor of that fossil fuel. The guidelines issued by the National Development and Reform Commission provide default values for the lower average calorific value and emission factor of commonly used fossil fuels. Therefore, we used these official parameters and corporate disclosure of fossil energy consumption to obtain the direct carbon emissions. The calculation method of electricity consumption is the same as that of fossil energy consumption, where AD is the electricity purchased by the enterprise and EF is the average emission coefficient of the power grid in the region where the enterprise is located, published by the National Center for Climate Change Strategy and International Cooperation. We used data from the most recent year of the sample period. Heat consumption is uniformly regulated by the state, and the emission coefficient is 0.11 t CO2/GJ. The sum of carbon emissions calculated based on electricity and heat consumption constitutes indirect carbon emissions.

4.2.2. Digital Transformation (Digital)

In reference to the research methodology employed by Wu et al. (2021) [72], the extent of corporate digital transformation was gauged through text analysis and word frequency statistics. The detailed procedure is outlined below. Firstly, construct a digital transformation keyword dictionary based on the five dimensions of “artificial intelligence, block chain, cloud computing, big data, and digital technology applications”; secondly, use Python 3.8.10 to conduct text analysis on the collected annual reports of enterprises and perform frequency analysis on the digital transformation keywords in each annual report, while removing stop words such as “not, no”. Finally, summarize and apply logarithmic processing to word frequencies to derive digital transformation (Digital) metrics for businesses. The greater the indicator, the more advanced the enterprise’s digital transformation.

4.2.3. Mediating Variables

Green technology innovation. This paper employed the quantity of green patent applications as a measure. In order to alleviate the problem of skewed distribution of rights in green patent data, the method proposed by Kammer et al. (2009) [73] was adopted. The number of green patent applications was increased by 1 and subsequently subjected to a natural logarithm transformation, yielding a metric for green technology innovation.
Financing constraints (WW). We employed the WW index [74] to assess corporate financing constraints. This index, in contrast to others, takes into account various factors including operating cash flow, cash dividends, long-term debt, total assets, industry, and company sales growth rate, providing a more comprehensive reflection of the financing constraints by enterprises. The greater the value of the WW index, the more severe the degree of financing constraints.
Human capital structure (Edu). The higher the employees’ education level often indicates that the enterprise has more human capital accumulation, which is not only difficult to replace, but also has a stronger learning ability to update skills [75], indicating that enterprises have a stronger human capital structure [76]. Referring to Gan et al. (2022) [77], Edu was measured by the percentage of employees with undergraduate, master’s, and doctoral degrees as a percentage of the workforce.

4.2.4. Control Variables

Referring to the research of Lee et al. (2022) and Zhang et al. (2020) [78,79], the following three groups of control variables were introduced to eliminate the interference of other factors on the regression results and reduce the estimation bias. The first group entails the variables that reflect the external environment of the enterprise, including the degree of marketization (Market) and environmental regulation (Er). The second group includes the variables that reflect the internal governance of the enterprise, such as dual roles combined (dual) and the proportion of independent directors (Indep). The third group comprises the variables that reflect the characteristics of the enterprise, such as enterprise size (Size), profitability (ROE), and asset-liability ratio (Lev). Table 1 shows the main variable definitions.

4.3. Models Setting

4.3.1. Regression Mode

To empirically test whether digital transformation can effectively reduce corporate carbon emissions, we constructed a basic model (1):
C E it = β 0 + β 1 Digital it + γ 0 Controls it + μ t + δ i + λ j + ε it
where i and t represent individual enterprises and years, respectively; the independent variable is Digital it , which represent the enterprise’s degree of digital transformation, with a regression coefficient of β 1 ; the dependent variable CE it is the enterprise’s carbon emissions; Controls it denotes the control variable group, with a vector coefficient of γ 0 ; δ i , μ t , and λ j represent individual, time, and industry fixed effects, respectively; and ε it is a random perturbation term.

4.3.2. The Mechanism Test Model

As previously stated, digital transformation has the potential to decrease corporate carbon emissions through the advancement of green technological innovation, alleviating financing constraints, and optimizing human capital structure. This section will empirically test the above mechanism. The mechanism verification model is established as follows:
Mechanism it = β 0 + α 1 Digital it + γ 1 Controls it + μ t + δ i + λ i + ε it
C E it = β 0 + α 2 Digital it + α 3 mechanism it + γ 2 Controls it + μ t + δ i + λ i + ε it
In Equations (2) and (3), Mechanism it is the mediating variable. It represents green technology innovation, financing constraints, and human capital structure; the definitions of the remaining variables align with those specified in Equation (1). In Formula (2), coefficient α 1 is the effect of the independent variable Digital it on the mediating variable Mechanism it . The coefficient α 3 of Formula (3) is the effect of mediating variable Mechanism it on dependent variable CE it after controlling the influence of independent variable Digital it ; Coefficient α 2 is the direct effect of independent variable Digital it on dependent variable CE it after controlling the influence of intermediary variable Mechanism it . If α 2 is negative, it indicates that digital transformation can effectively reduce corporate carbon emissions. When the Mechanism it is green technology innovation and human capital structure, α 3 should be positive, indicating that digital transformation has a positive impact on it and also reduces corporate carbon emissions; when the Mechanism it is constrained by financing, α 3 should be negative, indicating that digital transformation can alleviate financing constraints and reduce corporate carbon emissions.

5. Results and Discussion

5.1. Descriptive Statistical Analysis

The descriptive statistical analysis depicted in Table 1 reveals a substantial gap between the lowest and highest values of the dependent variable, CE, as indicated by a standard deviation of 54.932. This suggests a considerable variation in CE across different enterprises. The mean extent of digital transformation is 2.752, with values spanning from a nadir of 0 to a zenith of 5.811. This discovery suggests that the aggregate extent of digital transformation within Chinese enterprises is comparatively low, with some enterprises yet to initiate digital transformation. To assess the collinearity of all variables within the model, this study employed the variance inflation factor (VIF) for analysis. The outcomes in Table 2 reveal that the VIF values are significantly below 5, with an average of 1.53. This suggests that there is no significant issue with multicollinearity among the variables, and it will not compromise the integrity of the regression results.

5.2. Baseline Regression

Table 2 presents the outcomes of the regression analysis examining the impact of digital transformation on corporate carbon emissions. Column (1) incorporates solely the variables related to digital transformation, while controlling for the fixed effects of individual enterprises. The results indicate that the estimated coefficient is significantly negative, suggesting that digital transformation has a negative effect on corporate carbon emissions. Column (2) incorporates additional control variables, and the results continue to show that digital transformation maintains a negative impact on corporate carbon emissions, significant at the 1% level. Building upon the findings of the previous column, Column (3) accounts for time and industry fixed effects, and the regression coefficient remains negative and significant at the 1% level. Therefore, H1 is supported, indicating digital transformation does bring about a reduction in enterprise carbon emissions.
In terms of control variables, the level of marketization and environmental regulation plays a dampening effect on enterprise carbon emissions. It is because a higher level of marketization and environmental regulation means enterprises are facing more intense market competition and stricter government environmental pressures. In order to gain a competitive advantage and meet government environmental requirements, enterprises are more motivated to reduce carbon emissions. The contribution of dual roles on enterprise carbon emissions is small and insignificant. It may be that under the pressure of the dual carbon target, the chairman or general manager’s business philosophy on carbon emission reductions is basically consistent. Enterprise size, profitability, and the asset-liability ratio act as a disincentive to corporate carbon emission reductions. It may be due to the fact that the larger and more profitable the enterprise is, the more resources and energy it consumes, and the corresponding carbon emissions will also increase. Enterprises with higher debt face stronger financing constraints, which are not conducive to increasing investment and implementing emission reduction measures.

5.3. Robustness Test

5.3.1. Replacing the Independent Variable

Referring to Zhao et al.’s (2021) approach [80], we constructed a digital transformation keyword dictionary from the following five dimensions: “digital technology application, internet business model, intelligent manufacturing, and modern information system”. Based on these five dimensions, the frequency of digital keywords is re-collected and statistically analyzed. The total frequency of keywords+1 is taken as the logarithm to obtain digital1, which replaces the original independent variable. Concurrently, taking into account that the prevalence of digital keywords might be influenced by the extent of the annual report’s textual content, this research calculates the ratio of the cumulative frequency of digital keywords within the primary text to the total length of the entire document, and thus obtains the substitution of the core independent variable with digital2. Columns (1) and (2) of Table 3 present the regression outcomes. The findings suggest that the impact of digital transformation, which is measured by digital1 and digital2, on corporate carbon emissions is significantly negative at the 5% statistical level, indicating that digital transformation helps reduce enterprise carbon emission. This provides further evidence to support our hypotheses.

5.3.2. Replacing the Dependent Variable

Drawing on Shen et al.’s (2022) research [81], the ratio of corporate carbon emissions to corporate revenue is used as the second proxy variable for carbon emissions, CE2, for robustness testing. The regression results presented in column (3) of Table 3 are consistent with the baseline regression findings, thereby reinforcing the robustness of the conclusions drawn.

5.3.3. Shorten the Sample Interval

According to Zhou et al. (2022) [82], 85% of enterprises did not undergo digital transformation before 2012. This statistic may lead to bias in the sample estimation. Secondly, due to the impact of COVID-19 in December 2019, which resulted in a decline in enterprise performance, the management may pursue the enterprise’s short-term interests, thus ignoring the control of carbon emissions. Therefore, this study reduces the sample time interval to 2013–2019, with 11928 observations. Column (4) of Table 3 displays the results of the regression analysis, indicating that the regression coefficient associated with digital transformation continues to exhibit a significant negative value. Furthermore, the absolute magnitude of this coefficient (2.173) is greater than that of the previous coefficient (1.9070). This indicates that within a limited time frame, digital transformation exerts a significant influence on corporate carbon emissions, and the conclusion remains robust.

5.3.4. Counterfactual Test

To test the impact of digital transformation on corporate carbon emission reductions rather than other factors, we borrowed Song et al.’s (2022) [55] method and constructed a false digital transformation variable for enterprises (digital3). Regression analysis was conducted between false variables and corporate carbon emissions. A non-significant coefficient suggests that digital transformation is the primary factor contributing to the reduction in corporate carbon emissions, as opposed to other potential influences. The specific operation is as follows. Firstly, construct a virtual variable digital A for enterprise digital transformation. If the degree of digital transformation (Digital) of the enterprise in year t changes from 0 to greater than 0, then year t is designated as the first year for the enterprise to start digitizing. If the year is the first year after the enterprise’s digital transformation, then the value is 1; otherwise, the value is 0. Secondly, construct false digital transformation variables for enterprises (digital3). The year in which a company initiates its digital transformation is set to be two years prior to the actual year. If the company’s digital transformation begins in or after this year, the value is considered as 1; otherwise, it is considered as 0. Column (5) of Table 3 presents the specific regression outcomes. The regression coefficient for the dummy variable digital3 is no longer significant, suggesting that the decrease in corporate carbon emissions is a result of digital transformation.

5.3.5. Instrumental Variable Method

Due to sample selection bias, endogeneity issues may be present in this empirical study. Furthermore, it is possible that a reverse causal relationship exists between corporate digital transformation and carbon emissions. That is, low-carbon enterprises may have more power and demand for digital transformation. Therefore, to avoid potential endogeneity issues, this study refers to the research concepts of Xiao et al. (2021) [83]. The mean digital transformation index of enterprises situated within the same city and industry is computed by utilizing the city and industry associated with the enterprise’s location as the instrumental variable (IV) in a two-stage estimation framework. In the preliminary phase of the analysis, instrumental variables are employed to forecast the explanatory variable and to evaluate the relationship between these instrumental variables and the explanatory variable, referred to as Digital. The subsequent phase entails estimating the carbon emissions produced by enterprises and validating the effectiveness of the instrumental variables. The findings of the initial stage test are presented in column (1) of Table 4. The analysis reveals that the estimated coefficient of the instrumental variable (iv) concerning the explanatory variable is significantly positive, thereby demonstrating a strong association between the instrumental variable and the explanatory variable. Column (2) presents the outcomes of the second stage, indicating that the explanatory variable ’Digital’ exerts a substantial mitigating influence on corporate carbon emissions. Additionally, the Kleibergen–Paap rk LM statistic obtained from the instrumental variable test is 531.557, accompanied by a p-value of 0. This finding offers substantial support for rejecting the null hypothesis concerning the weak identification of the instrumental variable, with a significance level of 1%. Furthermore, the Kleibergen–Paap rk Wald F statistic is recorded at 4016.797, which surpasses the critical threshold of 16.38 for a maximal IV size of 10%. This finding suggests that weak instrumental variables are not present. The results of the two-stage test further affirm the efficacy of the selected instrumental variables, thereby reinforcing the robustness of the research outcomes presented in this study.

5.3.6. Propensity Score Matching

To further address concerns regarding endogeneity, this study utilizes the propensity score matching (PSM) method for assessment. In line with Ma et al.’s (2022) methodology [84], the research designates enterprises with a digital transformation level above the median as the treatment group and those below the median as the control group. Variables including enterprise size, proportion of independent directors, and enterprise age were chosen as covariates for PSM. Upon passing the balance test, the nearest neighbor matching method was utilized to conduct regression analyses on the matched samples. The findings displayed in column (3) of Table 4 demonstrate that even after matching, digital transformation significantly fosters corporate carbon emission reductions, thus suggesting that the aforementioned conclusion is highly robust.

5.4. Mechanism Test

5.4.1. Green Technology Innovation

Table 5, columns 1 and 2, outline the results of the mediation effect analysis for green technology innovation. In column (1), the coefficient estimated for digital transformation is 0.0687, which is statistically significant at the 1% level. This suggests that digital transformation markedly boosts the level of green technology innovation within enterprises. In column (2), the coefficient for green technology innovation is notably negative, whereas the coefficient for digital transformation stays significantly positive. This suggests that digital transformation can diminish corporate carbon emissions by increasing the level of green technology innovation, with the latter acting as an intermediary factor. This may be due to the fact that digital transformation has improved the input–output efficiency of green technology in enterprises and increased the enthusiasm for the application of green technology, so enterprises have better technologies to achieve carbon emission reductions. This underscores that digital transformation can lower carbon emissions via a “technology” pathway, and thereby verifies Hypothesis H2.

5.4.2. Financing Constraints

Table 5, columns 3 and 4, outline the test outcomes concerning the mediating influence of financing constraints on digital transformation. In column (3), the coefficient for digital transformation is −0.023, significantly negative at the 1% level, indicating that digital transformation notably alleviates the financing constraints encountered by enterprises. Transitioning to column (4), the coefficient for digital stands at −1.468, and the WW coefficient is 33.27. Both coefficients pass the significance test at a minimum of the 1% level, suggesting that digital transformation has the potential to reduce corporate carbon emissions by alleviating financing constraints. This finding underscores that digital transformation can lower corporate carbon emissions through the “capital” pathway. This may be because digital transformation helps companies win the favor of governments and investors and can reduce the cost of obtaining financing. Therefore, companies have more financing channels and larger financing scales, making them more capable of reducing carbon emissions. Consequently, Hypothesis H3 is supported.

5.4.3. Human Capital Structure

The analysis results of the intermediary effect of human capital structure are shown in columns 5 and 6 of Table 5. In column (5), the coefficient for digital transformation is reported as 0.721, which is statistically significant at the 1% level. This results indicates that digital transformation has a substantial positive impact on enhancing the human capital structure within enterprises. Conversely, in column (6), the coefficient associated with digital transformation is −1.549, whereas the coefficient pertaining to the human capital structure, denoted as Edu, is −0.258. The regression analysis remains significant at the 5% level, suggesting that digital transformation may contribute to a reduction in corporate carbon emissions by optimizing the human capital structure, with the latter serving as a partial mediator in this relationship. This implies that enterprise digital transformation can significantly reduce corporate carbon emissions carbon emissions through the “talent” pathway. This may be because digital transformation requires companies to have high-quality and highly skilled talent that matches them, which is beneficial for the efficient utilization of enterprise resources, and these talents have more concern for the environment, thereby promoting more effective implementation of carbon emission reduction technologies and measures within enterprises. Consequently, Hypothesis H4 is supported.

5.5. Heterogeneity Analysis

5.5.1. Enterprise Technological Attributes

Digital transformation in enterprises requires the support of basic conditions such as technological levels, production methods, and organizational culture. Enterprises characterized by varying technological attributes may exhibit differences in their capacity for carbon emission reductions, particularly in the context of digital transformation. Consequently, this study categorizes industries into high-tech and non-high-tech enterprises, utilizing the Industry Classification Guidelines for Listed Companies and the Strategic Emerging Industries Classification Catalogue as a framework. The regression analysis displayed in Table 6, Panel A, demonstrates that digital transformation exerts a significant positive influence on carbon emission reductions in high-tech enterprises. In contrast, its impact on non-high-tech enterprises is not significant. The reasons for this are primarily as follows: First, high-tech enterprises inherently belong to the forefront of technology industries. Compared to traditional industries, these enterprises have a greater number of technical talents and exhibit a higher willingness to pursue self-innovation. Therefore, they possess a stronger capability and desire to undergo digital transformation. Secondly, high-tech enterprises place a greater emphasis on research and development investment than other industries. By fully utilizing digital technology, they strengthen their connections with the outside world, thus obtaining more “first-hand” information. By combining technical talents, these enterprises aim to enhance both the efficiency and output of their research and development initiatives. This strategic approach not only enables them to save on resource investments but also contributes to the overall reduction in corporate carbon emissions. In addition, high-tech enterprises closely follow our country’s development strategy needs; thus, they may be more likely to receive government assistance and access more resources. By fully utilizing resources through digital technology, enterprises can promote productivity development and enhance their value, thereby having more energy and the ability to reduce carbon emissions.

5.5.2. Property Rights

Due to the different property rights of enterprises, they may face various market competition pressures and environmental regulatory efforts. As a result, there may be variations in the motivations driving digital transformation and the commitment to carbon emission reduction. Accordingly, this research classifies enterprises into two distinct categories: state-owned enterprises and non-state-owned enterprises [85]. Regression analysis is conducted independently for each group. From columns (3) and (4) in panel a of Table 6, it can be found that the internal digital transformation of non-state-owned enterprises has a more significant impact on promoting carbon emission reductions. On the one hand, to maintain competitiveness and market position, non-state-owned enterprises may be more inclined to invest more resources and technology in digital transformation. Previous research has discovered that most private enterprises have already developed a sense of transformation and have started engaging in substantial investment and action exploration in digital transformation. Such resources and technological investment may provide non-state-owned enterprises with greater opportunities to achieve carbon emission reduction targets. On the other hand, as the backbone of China’s national economy and an important entity in the implementation of the “dual carbon” goals, state-owned enterprises are also important actors and key players in the field of carbon emission reductions. The carbon emission reduction effectiveness of state-owned enterprises is relatively high, resulting in a relatively insignificant role of digital transformation in the carbon emission reductions of state-owned enterprises.

5.5.3. Carbon Emission Characteristics

To examine the influence of digital transformation on corporate carbon emission reduction, enterprises were categorized into high-carbon emission and low-carbon emission groups, utilizing the median of corporate carbon emissions as the basis for classification. A grouped regression analysis was subsequently performed on these categories. The results of the regression estimations are presented in Table 6, Panel B. The results from columns (1) and (2) indicate that digital transformation exerts a more pronounced effect on carbon emission reductions for enterprises classified within the high-carbon emission group. On the one hand, this difference may be due to the fact that companies with higher carbon emissions frequently face greater emission reduction pressures from regulatory requirements, customer needs, social opinion, etc. These pressures force companies to actively seek solutions, such as implementing digital transformation strategies, to achieve carbon emission reduction goals. On the other hand, enterprises with high-carbon emissions typically have greater potential for technological innovation. Faced with enormous pressures to reduce carbon emissions, these enterprises may be more actively engaged in exploring and adopting new digital technologies and innovative solutions to reduce carbon emissions. In contrast, low-carbon-emitting enterprises may have achieved relatively satisfactory performance in carbon emission reductions due to the characteristics of the industry itself; hence, they are not sensitive to the potential emission reduction benefits of digital transformation.

5.5.4. Regional Location

Due to the various levels of economic development in different regions of our country, there is often a significant digital divide among regions, and environmental policies in each region are different. These factors may influence the degree of digital transformation and carbon emission reduction efforts of enterprises. Therefore, in light of the distributional characteristics of provinces, the locations of enterprises have been categorized into three distinct regions: eastern, central, and western. The division of this regional difference is similar to some existing studies [86]. The regression analysis detailed in columns (3) to (5) of Panel B in Table 5 indicates that digital transformation plays a significant role in decreasing carbon emissions for enterprises situated in the eastern region. Conversely, the impact of digital transformation on areas located in the central and western regions does not exhibit statistical significance. This variation can be attributed to the relatively advanced economic development and resource availability in the eastern region, which enhances the capacity and willingness of enterprises to engage in digital transformation and carbon emission reduction initiatives. Additionally, enterprises located in the eastern region exhibit a greater level of digital transformation and are more inclined to employ digital technologies to enhance energy efficiency and decrease energy consumption, consequently contributing to a reduction in carbon emissions. In contrast, enterprises in the central and western regions may encounter limitations related to financial resources and technological investments, which impede their ability to adopt sophisticated digital technologies that could optimize production processes and lower carbon emissions.

6. Conclusions and Implications

6.1. Conclusions

In today’s surging digital economy, digital transformation has quietly become a key force for promoting the carbon emission reductions of enterprises and leading the high-quality development of China’s economy. This study dug deep into the micro-data of Chinese A-share listed companies between 2010 and 2021, aiming to reveal the profound impact of digital transformation on corporate carbon emissions and the complex mechanisms behind it. The main conclusions are as follows:
(1)
Digital transformation can significantly reduce enterprises’ carbon emissions, which still holds even after undergoing various robustness tests.
(2)
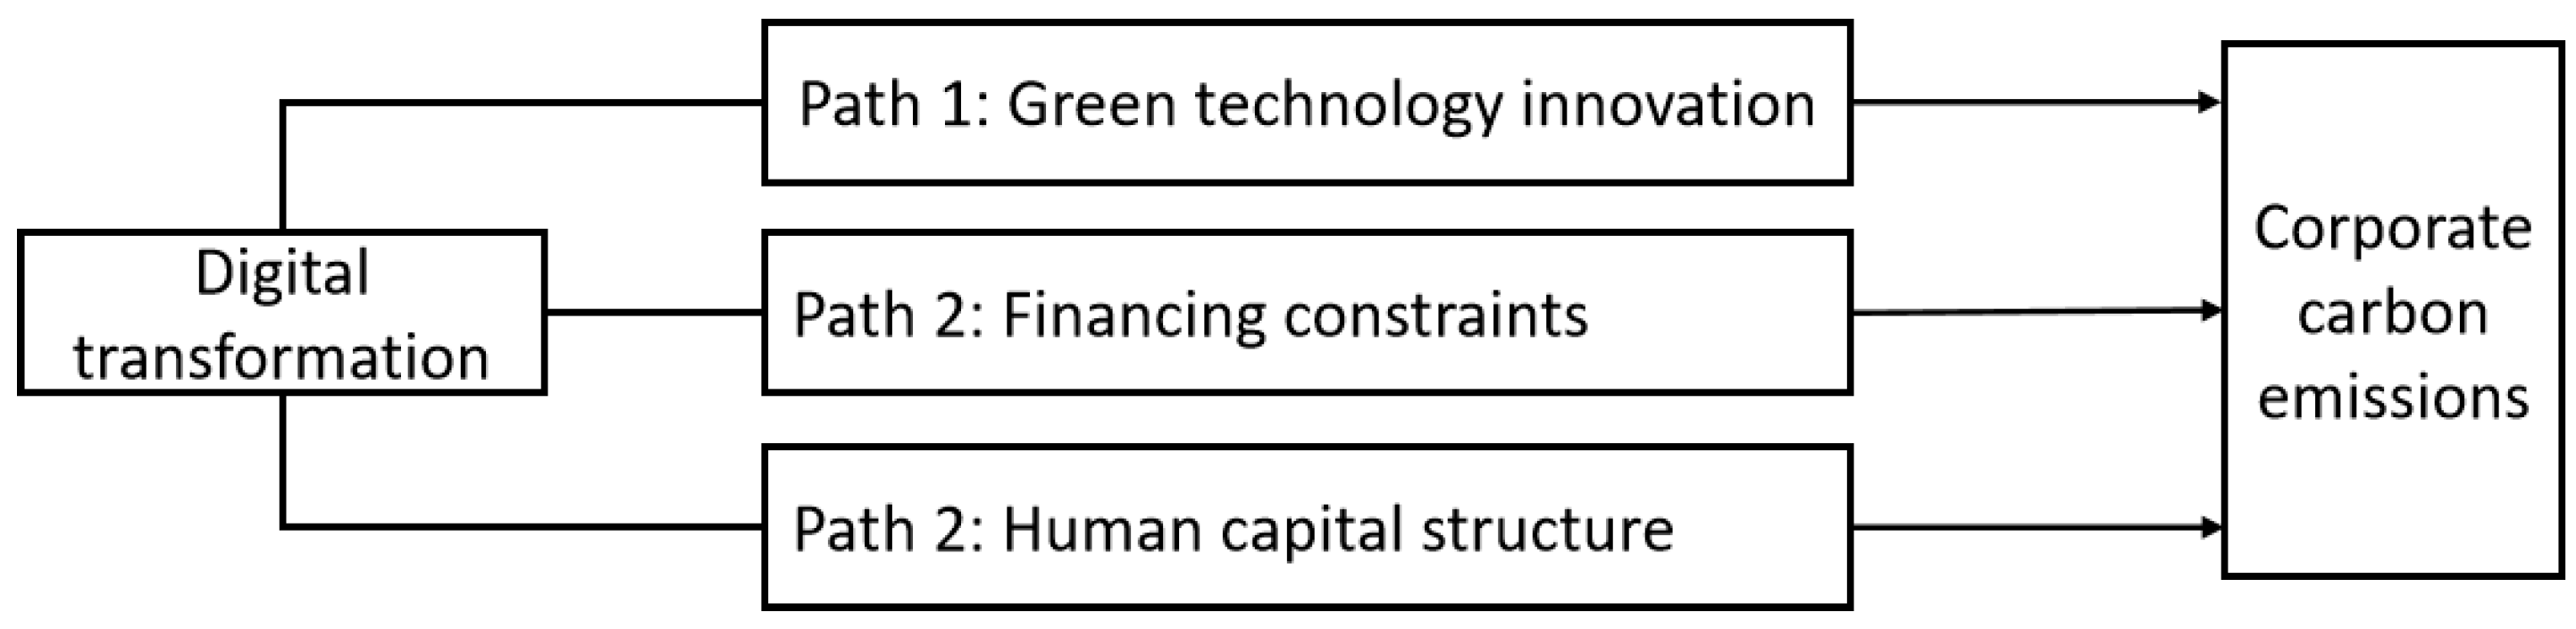
The mechanism assessment reveals that digital transformation has the potential to decrease carbon emissions within enterprises via three distinct pathways. The first pathway, referred to as the “technology” pathway, suggests that digital transformation facilitates a reduction in carbon emissions by fostering proactive green innovation initiatives. Consequently, this leads to a decrease in the costs associated with green technology innovation and enhances the overall efficiency of such innovations. The second is the “capital” path, where enterprise digital transformation reduces carbon emissions by expanding financing channels, increasing financing scale, and reducing financing costs. The third is the “talent” path, where enterprise digital transformation reduces carbon emissions by optimizing the function and quality structure of human capital.
(3)
The heterogeneous results are categorized into four types. First, in terms of industry heterogeneity, digital transformation significantly promotes carbon emission reductions in high-tech enterprises, but the results are not significant in non-high-tech enterprises. Second, from the perspective of property rights heterogeneity, digital transformation has a more significant effect on promoting carbon emission reductions in non-state-owned enterprises, but it does not perform as well in state-owned enterprises. Third, from the perspective of carbon emission characteristics, digital transformation has a more significant effect on promoting carbon emission reductions among enterprises in the high-carbon emissions group. Fourth, from the perspective of regional heterogeneity, digital transformation significantly reduces carbon emissions of enterprises in the eastern region, whereas the impact on the central and western cities is not significant.

6.2. Policy Recommendations

Given the above conclusions, this paper proposes the following policy recommendations.
(1)
The government should enhance its support for the digital transformation of enterprises and foster the progression of this process.
Firstly, the implementation of robust incentive policies, including tax reductions, financial aid, and grants, can alleviate the substantial economic pressures that enterprises often face during their digital transformation journey. These financial incentives can serve as a catalyst, encouraging more companies to embark on this path by reducing the initial costs and risks associated with adopting new technologies.
Secondly, the government should leverage its resources to enhance investment in the development and upgrading of digital infrastructure. This includes expanding and improving broadband networks, cloud computing services, and big data platforms. Such investments will not only facilitate the seamless integration of digital technology into various aspects of business operations but also pave the way for innovation and efficiency gains in the context of sustainable development. By ensuring that the necessary technological backbone is in place, the government can enable enterprises to harness the full potential of digitalization.
Thirdly, the government can play a pivotal role in encouraging industry alliances and cooperation among enterprises. By facilitating platforms for collaboration and knowledge sharing, the government can help create synergies and economies of scale, which can further accelerate the digital transformation process. Additionally, formulating regulations and policies that ensure fairness, transparency, and data security in the digital environment is crucial. This includes establishing clear guidelines for data privacy, cybersecurity, and competition, thereby fostering a trustworthy and conducive digital ecosystem. Such regulatory frameworks will provide enterprises with the assurance they need to confidently embrace digital transformation, knowing that their interests and data are protected.
Moreover, the government should also focus on upskilling and reskilling the workforce to meet the demands of the digital economy. This involves investing in education and training programs that equip workers with the necessary digital skills and competencies. By doing so, the government can ensure that the benefits of digital transformation are widely shared, contributing to overall economic growth and social inclusivity.
In summary, these policy recommendations, if implemented effectively, can create a supportive environment for enterprises to undergo digital transformation successfully. By addressing economic, infrastructural, regulatory, and human resource challenges, the government can pave the way for a digital future that is not only efficient and innovative but also inclusive and sustainable.
(2)
The government should offer comprehensive and strategic support to enterprises to achieve their carbon emission reduction targets during their digital transformation. This holistic approach involves multiple facets, each designed to incentivize, facilitate, and enhance enterprises’ efforts in minimizing their environmental footprint.
Firstly, the government can establish dedicated green financing channels tailored to support low-carbon environmental projects. By providing financial incentives such as low-interest loans, grants, and subsidies, the government can spur greater investment in these projects. This not only motivates enterprises to prioritize carbon emission reductions but also ensures they have the necessary funds to implement sustainable practices. Furthermore, the creation of a green bond market can attract investors seeking to fund environmentally friendly initiatives, further amplifying the financial support available.
Secondly, the government should actively encourage the adoption of digital technology in the development of green and low-carbon technologies. Offering tax benefits, research and development rewards, and rebates on energy-efficient equipment can significantly aid enterprises in cultivating their capacity to diminish carbon emissions. Simultaneously, strengthening intellectual property protection is vital to ensure that enterprises can reap reasonable returns from their innovations in the green field. This not only protects their investments but also encourages more enterprises to engage in R&D activities aimed at developing sustainable technologies. Additionally, promoting industry–university research cooperation can facilitate the widespread application of digital technology in sustainable development. By fostering collaborative projects between academia and industry, the government can accelerate the commercialization of cutting-edge green technologies.
Thirdly, the government should encourage universities and enterprises to establish deep and enduring cooperative relationships. This can be achieved by facilitating joint research projects and encouraging two-way knowledge transfer. By bringing together the theoretical expertise of academia with the practical experience of industry, the government can foster innovation and drive the development of new technologies that address both digital transformation and environmental challenges. Moreover, creating a dedicated platform for industry-university cooperation can streamline this process, ensuring that collaborative efforts are efficient and impactful.
Furthermore, the government should prioritize the training and development of digital talents who are well-versed in both digital technology and environmental protection. By strengthening educational programs and offering scholarships and internships in this field, the government can cultivate a skilled workforce that is essential for the successful implementation of digital transformation initiatives aimed at carbon emission reduction. Additionally, formulating policies to attract and retain professional talents with backgrounds in digital technology and environmental protection is crucial. This can involve offering competitive salaries, work visas for foreign experts, and creating an innovative and inclusive work environment.
In conclusion, the government’s comprehensive support for enterprises during their digital transformation journey, focused on carbon emission reduction, involves establishing green financing channels, incentivizing the adoption of digital technology in green innovation, fostering industry-university cooperation, and nurturing a talented workforce. These strategic measures, when implemented effectively, can pave the way for a sustainable and environmentally friendly digital future.
The government should formulate differentiated support policies based on enterprises’ attributes to ensure a comprehensive and balanced approach to economic development.
Firstly, for non-high-tech enterprises, the government can actively guide their transformation by providing substantial research and development funds and comprehensive training services. These initiatives will not only enhance their technological capabilities but also encourage them to forge partnerships with high-tech enterprises. Such collaborations can facilitate the utilization of digital technology capabilities and expedite the process of digital transformation, allowing non-high-tech enterprises to keep pace with the rapid advancements in the technological landscape.
Secondly, the government should pay special attention to non-state-owned enterprises, particularly large traditional enterprises, by offering them the necessary environment and talent pool for successful transformation and upgrading. This includes creating conducive regulatory frameworks, providing access to cutting-edge technology, and fostering innovation ecosystems. Additionally, the government should formulate tailored transformation strategies according to the unique characteristics of each enterprise. Simultaneously, it is crucial to deepen the digital transformation process of state-owned enterprises, leveraging their scale and resources to drive the adoption of digital technologies across the economy.
Thirdly, to address the challenge of high-carbon emissions, the government can implement a more stringent carbon-emission trading system. This system will incentivize high-carbon emitting enterprises to transition to more environmentally friendly and low-carbon production methods. Furthermore, the government can facilitate cooperation between high-tech enterprises and high-carbon emitters. By sharing expertise and resources, these partnerships can promote the adoption of smart manufacturing practices, leading to improved production efficiency and reduced carbon footprints. Such initiatives will not only contribute to environmental sustainability but also enhance the competitiveness of these enterprises in the global market.
Moreover, the government should prioritize fostering digital advancement in the central and western regions of the country. This can be achieved through strategic capital investments, comprehensive policy support, robust infrastructure construction, and targeted industrial guidance. These measures will facilitate the industrial transformation and upgrading of enterprises in these regions, enabling them to benefit from the digital revolution. In turn, this will promote more balanced and coordinated development between the eastern, central, and western regions, reducing economic disparities and fostering inclusive growth.
Overall, by adopting a differentiated approach and tailoring support policies to the specific needs and attributes of enterprises, the government can drive sustainable economic development, enhance technological advancement, and contribute to a more equitable and resilient society.

6.3. Limitations and Future Research

This paper has the following shortcomings:
First, we explored the impact of digital transformation on carbon emissions based on micro-data at the enterprise level, and we can focus on an industry for more detailed exploration in future research. Second, we have not yet differentiated between the different impacts of substantive and formal digital transformation on corporate carbon emissions, and further exploration can be conducted in this area in the future research. Additionally, developing a more scientific measurement method for the degree of digital transformation in enterprises is also a worthwhile research direction for the future.

Author Contributions

Conceptualization, X.C. and D.H.; methodology, D.H.; software, Z.Z.; data curation, Z.Z.; writing—original draft preparation, Z.Z.; writing—review and editing, X.C. and D.H.; supervision, C.Q.; project administration, C.Q.; funding acquisition, X.C. and C.Q. All authors have read and agreed to the published version of the manuscript.

Funding

This research was funded by the National Social Science Foundation of China, grant number 23BJY087; Hunan Provincial Natural Science Foundation of China, grant number 2022JJ30203, 2024JJ6195; the Evaluation committee of social science achievements of Hunan Province, grant number XSP2023ZDI005; Changsha Municipal Natural Science Foundation, grant number kq2202304; Excellent youth funding of Hunan Provincial Education Department, grant number 22B0617.

Institutional Review Board Statement

Not applicable.

Informed Consent Statement

Not applicable.

Data Availability Statement

The data presented in this study are available on request from the corresponding author.

Conflicts of Interest

The authors declare no conflicts of interest.

References

  1. Tang, J.; Zhong, S.; Xiang, G. Environmental Regulation, Directed Technical Change, and Economic Growth: Theoretic Model and Evidence from China. Int. Reg. Sci. Rev. 2019, 42, 519–549. [Google Scholar] [CrossRef]
  2. Bashir, M.F.; Shahbaz, M.; Malik, M.N.; Ma, B.; Wang, J. Energy transition, natural resource consumption and environmental degradation: The role of geopolitical risk in sustainable development. Resour. Policy 2023, 85, 103985. [Google Scholar] [CrossRef]
  3. Rong, L.; Wang, Z.; Li, Z. Unraveling the role of Financial Risk, social globalization and Economic Risk towards attaining sustainable environment in China: Does resources curse still holds. Resour. Policy 2024, 88, 104375. [Google Scholar] [CrossRef]
  4. Xia, Q.; Li, L.; Zhang, B.; Dong, J. Nonlinear Influence of Land-Use Transition on Carbon Emission Transfer: A Threshold Regression Analysis of the Middle Reaches of the Yangtze River in China. Land 2022, 11, 1531. [Google Scholar] [CrossRef]
  5. Cheng, X.; Ouyang, S.; Quan, C.; Zhu, G. Regional allocation of carbon emission quotas in China under the total control target. Environ. Sci. Pollut. Res. 2023, 30, 66683–66695. [Google Scholar] [CrossRef]
  6. Zhou, Z.; Zhang, T.; Wen, K.; Zeng, H. Carbon risk, cost of debt financing and the moderation effect of media attention: Evidence from Chinese companies operating in high-carbon industries. Bus. Strategy Environ. 2018, 27, 1131–1144. [Google Scholar] [CrossRef]
  7. Liu, Y.; Hao, Y. How does coordinated regional digital economy development improve air quality? New evidence from the spatial simultaneous equation analysis. J. Environ. Manag. 2023, 342, 118235. [Google Scholar] [CrossRef]
  8. Wang, W.; He, Y.; Lei, Y.; Zhou, X.; Li, Z. Digital economy sectors are key CO2 transmission centers in the economic system. J. Clean. Prod. 2023, 407, 136873. [Google Scholar] [CrossRef]
  9. Ding, T.; Li, J.; Shi, X.; Li, X.; Chen, Y. Is artificial intelligence associated with carbon emissions reduction? Case of China. Resour. Policy 2023, 85, 103892. [Google Scholar] [CrossRef]
  10. Li, D.; Huang, M.; Ren, S.; Chen, X.; He, X. Environmental Legitimacy, Green Innovation, and Corporate Carbon Disclosure: Evidence from CDP China 100. J. Bus. Ethics 2018, 150, 1089–1104. [Google Scholar] [CrossRef]
  11. Jalil, F.M.; Marikan, A.B.A.D.; Jais, B.M.; Zainal, N.B.; Othman, R.B. Kickstart manufacturing SMEs’ go green journey: A green hydrogen acceptance framework to enhance low carbon emissions through green digital technologies. Int. J. Hydrogen Energy 2025, 105, 592–610. [Google Scholar] [CrossRef]
  12. Teece, D.J.; Pisano, G.; Shuen, A. Dynamic capabilities and strategic management. Strateg. Manag. J. 1997, 18, 509–533. [Google Scholar] [CrossRef]
  13. Yang, G.; Nie, Y.; Li, H.; Zhang, P.; Wang, X. Digital transformation and low-carbon technology innovation in manufacturing firms: The mediating role of dynamic capabilities. Int. J. Prod. Econ. 2023, 263, 108969. [Google Scholar] [CrossRef]
  14. Barney, J. Firm resources and sustained competitive advantage. J. Manag. 1991, 17, 99–120. [Google Scholar] [CrossRef]
  15. Zeng, H.; Ran, H.; Zhou, Q.; Jin, Y.; Cheng, X. The financial effect of firm digitalization: Evidence from China. Technol. Forecast. Soc. Change 2022, 183, 121951. [Google Scholar] [CrossRef]
  16. Wang, L.; Shao, J. Digital economy, entrepreneurship and energy efficiency. Energy 2023, 269, 126801. [Google Scholar] [CrossRef]
  17. Wang, S.L. Digital economy development for urban carbon emissions: ‘accelerator’ or ‘speed bump’? China Popul. Resour. Environ. 2023, 33, 11–22. [Google Scholar] [CrossRef]
  18. Wang, L.; Chen, Y.; Ramsey, T.S.; Li, J.; Zhang, W. Will researching digital technology really empower green development? Technol. Soc. 2021, 66, 101638. [Google Scholar] [CrossRef]
  19. Zhang, W.; Liu, X.; Wang, D.; Zhou, P.; Zhang, Y. Digital economy and carbon emission performance: Evidence at China’s city level. Energy Policy 2022, 165, 112927. [Google Scholar] [CrossRef]
  20. Xu, Q.; Zhong, M.; Li, X. How does digitization affect energy? International evidence. Energy Econ. 2022, 107, 105879. [Google Scholar] [CrossRef]
  21. Bai, L.; Guo, T.; Xu, W.; Zhang, Y.; Wang, C. Effects of digital economy on carbon emission intensity in Chinese cities: A life-cycle theory and the application of non-linear spatial panel smooth transition threshold model. Energy Policy 2023, 183, 113792. [Google Scholar] [CrossRef]
  22. Zhang, J.; Hou, Y.; Liu, S.; Li, X.; Wang, Y. Can the Energy Internet promote China’s energy system to achieve carbon emission peak goal? J. Clean. Prod. 2023, 417, 138014. [Google Scholar] [CrossRef]
  23. Sadorsky, P. Information communication technology and electricity consumption in emerging economies. Energy Policy 2012, 48, 130–136. [Google Scholar] [CrossRef]
  24. Zhang, Y.; Ran, C. Effect of digital economy on air pollution in China? New evidence from the “National Big Data Comprehensive Pilot Area” policy. Econ. Anal. Policy 2023, 79, 986–1004. [Google Scholar] [CrossRef]
  25. Yang, Z.; Gao, W.; Han, Q.; Li, X.; Chen, Y. Digitization and carbon emissions: How does digital city construction affect China’s carbon emission reduction? Sustain. Cities Soc. 2022, 87, 104201. [Google Scholar] [CrossRef]
  26. Yang, X.; Wang, H.; Yan, T.; Cao, M.; Han, Y.; Pan, Y.; Feng, Y. The road to inclusive green growth in China: Exploring the impact of digital-real economy integration on carbon emission efficiency. J. Environ. Manag. 2024, 370, 122989. [Google Scholar] [CrossRef]
  27. Zheng, R.; Wu, G.; Cheng, Y.; Li, X.; Wang, L. How does digitization drive carbon emissions? The inverted U-shaped effect in China. Environ. Impact Assess. Rev. 2023, 102, 107203. [Google Scholar] [CrossRef]
  28. Wang, W.; Zhou, S.; Li, D.; Zhang, Y.; Chen, X. Disentangling the non-linear relationships and interaction effects of urban digital transformation on carbon emission intensity. Urban Clim. 2025, 59, 102283. [Google Scholar] [CrossRef]
  29. Wang, S.; Li, J. Does Digital Transformation Promote Green and Low-Carbon Synergistic Development in Enterprises? A Dynamic Analysis Based on the Perspective of Chinese Listed Enterprises in the Heavy Pollution Industry. Sustainability 2023, 15, 15600. [Google Scholar] [CrossRef]
  30. Ma, Y.; Tao, P. A Perspective on Management Myopia: The Impact of Digital Transformation on Carbon Emission Intensity. Sustainability 2023, 15, 9417. [Google Scholar] [CrossRef]
  31. Zhong, T.Y.; Ma, F.Q. Carbon Reduction Effect of Enterprise Digital Transformation: Theoretical Mechanism and Empirical Test. Jianghai Acad. J. 2022, 99–105. [Google Scholar] [CrossRef]
  32. Shang, Y.; Raza, S.A.; Huo, Z.; Yang, X.; Wang, C. Does enterprise digital transformation contribute to the carbon emission reduction? Micro-level evidence from China. Int. Rev. Econ. Financ. 2023, 86, 1–13. [Google Scholar] [CrossRef]
  33. Zhao, Y.; Wang, W. The multiple empowerment effects of digital transformation on carbon emissions in manufacturing industry from the prospective of factor allocation: Theoretical analysis and empirical evidence. Environ. Impact Assess. Rev. 2025, 110, 107698. [Google Scholar] [CrossRef]
  34. Zhang, Y.; Jia, K.; Cen, L.; Li, X.; Wang, M. Does digital transformation promote corporate carbon reduction? Evidence from Chinese A-share listed companies. Environ. Dev. Sustain. 2024, 1–28. [Google Scholar] [CrossRef]
  35. Yu, C.J.; Tang, W. Can Digital Transformation of Industrial Enterprises Contribute to Carbon Emission Reduction: Evidence Based on Chinese A-share Listed Industrial Enterprises. Macroeconomics 2023, 97–110+127. [Google Scholar] [CrossRef]
  36. Lin, Y.; Qi, X.; Wang, L. Digital Transformation and Carbon Intensity: Evidence from Chinese Tourism Companies. Sustainability 2024, 16, 9454. [Google Scholar] [CrossRef]
  37. He, L.Y.; Chen, K.X. Digital transformation and carbon performance: Evidence from firm-level data. Environ. Dev. Sustain. 2023, 1–26. [Google Scholar] [CrossRef]
  38. Ying, X.; Fu, J.; Lujie, C.; Zhang, R.; Wang, L. Does digital transformation foster carbon emissions reduction? Evidence from China’s manufacturing supply chain. Int. J. Logist. Manag. 2024, 35, 1827–1846. [Google Scholar] [CrossRef]
  39. Zheng, D.; Song, H.; Zhao, C.; Wang, Y.; Liu, Y. Is it possible for semiconductor companies to reduce carbon emissions through digital transformation? Evidence from China. Int. J. Prod. Econ. 2024, 272, 109246. [Google Scholar] [CrossRef]
  40. Chen, Y.; Liu, S.; Xiao, Y.; Li, Y.; Zhang, W. Can Digital Transformation Reduce Enterprise Carbon Intensity? An Empirical Analysis of Chinese Manufacturers. Sustainability 2024, 16, 5236. [Google Scholar] [CrossRef]
  41. Guo, L.; Tang, M. How Does Digital Transformation Improve Corporate Carbon Emission Reduction Performance? An Empirical Study on Data from Listed Companies in China. Sustainability 2024, 16, 3499. [Google Scholar] [CrossRef]
  42. Liu, H.; Han, P.; Wang, D.; Li, X.; Zhang, Y. Decoding enterprise digital transformation: External oversight and carbon emission reduction performance. J. Environ. Manag. 2024, 359, 121039. [Google Scholar] [CrossRef] [PubMed]
  43. Zou, S.; Fan, X.; Zhou, Y.; Chen, J.; Li, W. Achieving collaborative pollutant and carbon emissions reduction through digital governance: Evidence from Chinese enterprises. Environ. Res. 2024, 263, 120197. [Google Scholar] [CrossRef] [PubMed]
  44. Chen, J.; Guo, Z.; Lei, Z. Research on the mechanisms of the digital transformation of manufacturing enterprises for carbon emissions reduction. J. Clean. Prod. 2024, 449, 141817. [Google Scholar] [CrossRef]
  45. Zhang, C.; Fang, J.; Ge, S.; Sun, G. Research on the impact of enterprise digital transformation on carbon emissions in the manufacturing industry. Int. Rev. Econ. Financ. 2024, 92, 211–227. [Google Scholar] [CrossRef]
  46. Wang, C.L.; Ahmed, P.K. Dynamic capabilities: A review and research agenda. Int. J. Manag. Rev. 2007, 9, 31–51. [Google Scholar] [CrossRef]
  47. Gupta, S.; Qian, X.; Bhushan, B.; Luo, Z. Role of cloud ERP and big data on firm performance: A dynamic capability view theory perspective. Manag. Decis. 2019, 57, 1857–1882. [Google Scholar] [CrossRef]
  48. Aben, T.A.E.; van der Valk, W.; Roehrich, J.K.; Selviaridis, K. Managing information asymmetry in public–private relationships undergoing a digital transformation: The role of contractual and relational governance. Int. J. Oper. Prod. Manag. 2021, 41, 1145–1191. [Google Scholar] [CrossRef]
  49. Xiao, J.; Zeng, P.; Ren, G. Digital Transformation, Absorptive Capacity and Dual Performance of Manufacturing Enterprises—Moderating Effect of Regional Digital Level. R&D Manag. 2023, 35, 129–143. [Google Scholar] [CrossRef]
  50. Liu, H.M.; Long, J.C.; Shen, Z.H. Research on the impact of digital transformation on the green innovation of enterprises. Sci. Res. Manag. 2023, 44, 22–34. [Google Scholar] [CrossRef]
  51. Zhao, C.Y. Digital development and servitization: Empirical evidence from listed manufacturing companies. Nankai Bus. Rev. 2021, 24, 149–163. [Google Scholar] [CrossRef]
  52. Li, W.H.; Li, N. Green innovation, digital transformation and energy-intensive enterprises carbon emission reduction performance. J. Ind. Eng. Eng. Manag. 2023, 37, 66–76. [Google Scholar] [CrossRef]
  53. Jing, W.J.; Sun, B.W. Digital Economy Promotes High-quality Economic Development:A Theoretical Analysis Framework. Economist 2019, 2, 66–73. [Google Scholar] [CrossRef]
  54. Haefner, N.; Wincent, J.; Parida, V.; Gassmann, O. Artificial intelligence and innovation management: A review, framework, and research agenda. Technol. Forecast. Soc. Change 2021, 162, 120392. [Google Scholar] [CrossRef]
  55. Song, D.Y.; Zhu, W.B.; Ding, H.C. Can Firm Digitalization Promote Green Technological Innovation? An Examination Based on Listed Companies in Heavy Pollution Industries. J. Financ. Econ. 2022, 48, 34–48. [Google Scholar] [CrossRef]
  56. Xiao, R.Q.; Wang, R.; Qian, L. The Non-linear Impact of Digitalization Level on Corporate Carbon Performance: The Mediating Effect of Green Technology Innovation. Sci. Technol. Prog. Policy 2023, 40, 96–106. [Google Scholar] [CrossRef]
  57. Rodgers, W.; Cardenas, J.A.; Gemoets, L.A.; Sarfi, R.J. A smart grids knowledge transfer paradigm supported by experts’ throughput modeling artificial intelligence algorithmic processes. Technol. Forecast. Soc. Change 2023, 190, 122373. [Google Scholar] [CrossRef]
  58. Rehman, S.U.; Kraus, S.; Shah, S.A.; Khanin, D.; Mahto, R. Analyzing the relationship between green innovation and environmental performance in large manufacturing firms. Technol. Forecast. Soc. Change 2021, 163, 120481. [Google Scholar] [CrossRef]
  59. Sohag, K.; Husain, S.; Hammoudeh, S.; Omar, N. Innovation, militarization, and renewable energy and green growth in OECD countries. Environ. Sci. Pollut. Res. 2021, 28, 36004–36017. [Google Scholar] [CrossRef]
  60. Li, C.; Huo, P.; Wang, Z.; Zhang, W.; Liang, F.; Mardani, A. Digitalization generates equality? Enterprises’ digital transformation, financing constraints, and labor share in China. J. Bus. Res. 2023, 163, 113924. [Google Scholar] [CrossRef]
  61. Chen, W.; Yuan, X. Financial inclusion in China: An overview. Front. Bus. Res. China 2021, 15, 4. [Google Scholar] [CrossRef]
  62. Luo, J.; Wang, Z.; Wu, M. Effect of place-based policies on the digital economy: Evidence from the Smart City Program in China. J. Asian Econ. 2021, 77, 101402. [Google Scholar] [CrossRef]
  63. Jin, X.K.; Xu, L.P.; Xin, Y. Corporate Digitalization and the Cost of Equity Capital. J. Financ. Econ. 2023, 49, 79–93+123. [Google Scholar] [CrossRef]
  64. Wang, J.Y.; Sun, T.; Li, P.; Gong, Y. Digital Transformation and Financing Constraints of Small and Medium-sized Enterprises: Empirical Evidence Based on GEM Listed Companies. Sci. Decis. Mak. 2022, 1–23. Available online: https://read.cnki.net/web/Journal/Article/KXJC202211001.html (accessed on 14 April 2025).
  65. Umar, M.; Mirza, N.; Hasnaoui, J.A.; Rochoń, M.P. The nexus of carbon emissions, oil price volatility, and human capital efficiency. Resour. Policy 2022, 78, 102876. [Google Scholar] [CrossRef]
  66. Yami, S.; M’Chirgui, Z.; Spano, C.; Barykina, O.J. Reinventing science and technology entrepreneurship education: The role of human and social capitals. Technol. Forecast. Soc. Change 2021, 164, 120044. [Google Scholar] [CrossRef]
  67. Wadley, D. Technology, capital substitution and labor dynamics: Global workforce disruption in the 21st century? Futures 2021, 132, 102802. [Google Scholar] [CrossRef]
  68. Lai, X.B.; Yue, S.J. Do Pilot Smart Cities Promote Corporate Digital Transformation? An Empirical Study Based on a Quasi-natural Experiment. Foreign Econ. Manag. 2022, 44, 117–133. [Google Scholar] [CrossRef]
  69. Sun, Y.F.; Zhao, Y. The influence of internal and external environment on TFP of manufacturing enterprises: Findings from fsQCA. Syst. Eng. 2023, 10, 1–14. [Google Scholar]
  70. Wu, Q.; Yao, Y.X. Firm Digital Transformation and Supply Chain Configuration: Centralization or Diversification. China Ind. Econ. 2023, 99–117. [Google Scholar] [CrossRef]
  71. Wang, H.; Liu, J.Z.; Zhang, L.H. Carbon Emissions and Assets Pricing--Evidence from Chinese Listed Firms. China J. Econ. 2022, 9, 28–75. [Google Scholar] [CrossRef]
  72. Wu, F.; Hu, H.; Lin, H.; Ren, X. Enterprise Digital Transformation and Capital Market Performance: Empirical Evidence from Stock Liquidity. J. Manag. World 2021, 37, 130–144+10. [Google Scholar] [CrossRef]
  73. Kammerer, D. The effects of customer benefit and regulation on environmental product innovation.: Empirical evidence from appliance manufacturers in Germany. Ecol. Econ. 2009, 68, 2285–2295. [Google Scholar] [CrossRef]
  74. Whited, T.M.; Wu, G. Financial constraints risk. Rev. Financ. Stud. 2006, 19, 531–559. [Google Scholar] [CrossRef]
  75. Yu, M.G.; Ma, L.; Wang, K. Digital Transformation of Commercial Banks and Labor Demand: Creation or Destruction? Manag. World 2022, 38, 212–230. [Google Scholar] [CrossRef]
  76. Kong, D.; Zhang, B.; Zhang, J. Higher education and corporate innovation. J. Corp. Financ. 2022, 72, 102165. [Google Scholar] [CrossRef]
  77. Gan, J.; Liu, L.; Qiao, G.; Zhang, Q. The role of robot adoption in green innovation: Evidence from China. Econ. Model. 2023, 119, 106128. [Google Scholar] [CrossRef]
  78. Lee, C.C.; Chang, Y.F.; Wang, E.Z. Crossing the rivers by feeling the stones: The effect of China’s green credit policy on manufacturing firms’ carbon emission intensity. Energy Econ. 2022, 116, 106413. [Google Scholar] [CrossRef]
  79. Zhang, L.; Ren, S.; Chen, X.; Li, D.; Yin, D. CEO Hubris and Firm Pollution: State and Market Contingencies in a Transitional Economy. J. Bus. Ethics 2020, 161, 459–478. [Google Scholar] [CrossRef]
  80. Zhao, C.Y.; Wang, W.C.; Li, X.S. How Does Digital Transformation Affect the Total Factor Productivity of Enterprises? Financ. Trade Econ. 2021, 42, 114–129. [Google Scholar] [CrossRef]
  81. Shen, H.T.; Huang, N. Will the Carbon Emission Trading Scheme Improve Firm Value? Financ. Trade Econ. 2019, 40, 144–161. [Google Scholar] [CrossRef]
  82. Zhou, S.; Zhou, P.; Ji, H. Can digital transformation alleviate corporate tax stickiness: The mediation effect of tax avoidance. Technol. Forecast. Soc. Change 2022, 184, 122028. [Google Scholar] [CrossRef]
  83. Xiao, H.J.; Yang, Z.; Liu, M.Y. The Promotion Effect of Corporate Digitalization on Corporate Social Responsibility: A Test of Internal and External Dual Paths. Bus. Manag. J. 2021, 43, 52–69. [Google Scholar]
  84. Ma, H.; Chen, S.L. Digital Transformation, Bad News Withholding, and Stock Price Crash Risk. Account. Res. 2022, 31–44. [Google Scholar] [CrossRef]
  85. Li, D.; Xin, L.; Chen, X.; Ren, S. Corporate social responsibility, media attention and firm value: Empirical research on Chinese manufacturing firms. Qual. Quant. 2017, 51, 1563–1577. [Google Scholar] [CrossRef]
  86. Zhou, A.; Li, J. Impact of anti-corruption and environmental regulation on the green development of China’s manufacturing industry. Sustain. Prod. Consum. 2021, 27, 1944–1960. [Google Scholar] [CrossRef]
Figure 1. The impact path of digital transformation on corporate carbon emissions.
Sustainability 17 03944 g001
Table 1. Descriptive statistical of variables.
VariableNMeanS.D.Min.Max.VIF
CE20,27890.4554.93212.87336.986
Digital20,2782.7521.14905.8111.31
Size20,2787.5781.1824.90511.0742.7
Lev20,2780.3740.1930.0070.9761.34
ROE20,2780.0780.083−0.2990.311.24
Indep20,2780.380.0640.2670.61.02
Dual20,2780.3090.462011.07
Er20,2780.0020.00200.0091.29
Market20,2789.6831.6394.13812.391.33
Innovation17,5740.9361.1607.3191.39
WW16,664−1.0180.069−1.234−0.8652.78
Edu13,33328.53118.4733.8384.361.40
Table 2. Baseline estimation tests.
(1)(2)(3)
VariableCECECE
Digital−2.745 ***−2.981 ***−1.907 ***
(0.282)(0.320)(0.533)
Size 2.530 ***3.377 ***
(0.552)(1.252)
Lev 25.04 ***23.29 ***
(2.337)(4.435)
ROE 91.74 ***86.39 ***
(3.021)(4.757)
Indep 9.159 **11.03 **
(4.215)(4.765)
Dual −1.130−1.478
(0.710)(1.025)
Er −1202 ***−406.5 *
(163.4)(234.8)
Market −1.714 ***−0.570
(0.349)(0.730)
Constant98.00 ***78.91 ***87.89 ***
(0.798)(4.703)(19.80)
Firm FEYesYesYes
Year/Industry FENoNoYes
Observations20,27820,27820,278
R-sq Within0.0060.0680.100
Note: *** p < 0.01, ** p < 0.05, * p < 0.1, the standard error in brackets, column (3) has undergone robust clustering processing.
Table 3. Robustness test.
(1)(2)(3)(4)(5)
VariableCECECE2CECE
Digital −0.725 ***−2.173 ***
(0.220)(0.654)
digital1−0.961 **
(0.446)
digital2 −7.959 **
(3.620)
digital3 −3.340
(3.019)
Size3.205 **3.182 ***−0.650 *2.2642.685 *
(1.252)(1.224)(0.359)(1.782)(1.550)
Lev23.39 ***23.50 ***−1.22115.96 **28.61 ***
(4.441)(4.464)(1.464)(6.343)(5.681)
ROE85.89 ***85.93 ***−1.55766.56 ***86.02 ***
(4.760)(4.762)(1.943)(6.565)(6.586)
Indep11.33 **11.32 **3.52515.27 ***19.23 ***
(4.776)(4.781)(2.559)(5.891)(5.676)
Dual−1.503−1.5200.112−0.381−1.928
(1.027)(1.027)(0.445)(1.376)(1.238)
Er−393.0 *−399.0 *113.7−111.0−337.5
(234.6)(234.3)(118.3)(257.0)(260.3)
Market−0.516−0.526−0.3540.467−0.114
(0.731)(0.731)(0.317)(0.813)(0.797)
Constant83.03 ***83.53 ***179.7 ***37.48 **69.62 ***
(20.11)(20.00)(6.619)(16.76)(23.15)
Firm FEYesYesYesYesYes
Year/Industry FEYesYesYesYesYes
Observations20,27820,27820,27811,92813,569
R-sqWithin0.0990.1000.0060.0860.102
Note: *** p < 0.01, ** p < 0.05, * p < 0.1, the standard error in brackets.
Table 4. Endogeneity tests.
IVPSM
(1)(2)(3)
First-stageSecond-stageNearest neighbor matching
VariableDigitalCECE
iv0.895 ***
(0.0141)
Digital −3.388 **−1.875 ***
(1.598)(0.710)
Size0.131 ***8.307 ***4.643 ***
(0.0112)(0.917)(1.385)
Lev0.012647.06 ***25.98 ***
(0.0682)(5.202)(5.340)
ROE0.00965128.8 ***85.44 ***
(0.0983)(7.548)(6.790)
Indep0.110−14.49 *13.00 **
(0.132)(8.303)(6.530)
Dual0.00923−4.702 ***0.946
(0.0215)(1.338)(1.176)
Er1.475−114.1−594.6 *
(5.581)(440.5)(307.9)
Market−0.0120 *3.229 ***−1.691 *
(0.00642)(0.569)(0.920)
Firm FEYesYesYes
Year/Industry FEYesYesYes
Observations20,27820,27810,163
R-sqWithin 0.3350.115
Kleibergen–Paap rk LM statistic 531.557 ***
Kleibergen–Paap rk Wald F 4016.797
[16.38]
Note: *** p < 0.01, ** p < 0.05, * p < 0.1.The square brackets represent the critical values of the Stock Yogo weak instrumental variable identification F-test at a significance level of 10%.
Table 5. Mechanism Tests.
(1)(2)(3)(4)(5)(6)
VariableInnovationCEWWCEEduCE
Digital0.0687 ***−1.992 ***−0.00181 ***−1.468 ***0.721 ***−1.549 **
(0.0123)(0.548)(0.000578)(0.556)(0.162)(0.641)
Innovation −1.062 **
(0.431)
WW 33.27 ***
(12.64)
Edu −0.258 ***
(0.0916)
Size0.312 ***3.361 **−0.0297 ***4.224 ***−4.823 ***0.780
(0.0270)(1.365)(0.00146)(1.352)(0.608)(2.048)
Lev0.12224.91 ***−0.0135 ***22.44 ***3.029 **23.58 ***
(0.0910)(4.838)(0.00467)(4.760)(1.419)(5.754)
ROE−0.10185.29 ***−0.193 ***93.06 ***2.04984.88 ***
(0.110)(5.150)(0.00552)(5.449)(1.248)(5.432)
Indep−0.059710.17 **0.0091113.06 **−1.44313.66 **
(0.146)(5.068)(0.00594)(5.309)(1.376)(5.386)
Dual0.00714−1.101−0.000962−1.4240.408−1.182
(0.0267)(1.119)(0.00115)(1.059)(0.309)(1.091)
Er8.485−548.4 **−0.302−571.8 **−26.73−273.9
(5.465)(241.1)(0.308)(236.7)(66.74)(301.9)
Market−0.00769−0.905−0.00128−0.642−0.267−1.065
(0.0196)(0.828)(0.000893)(0.848)(0.200)(0.855)
Constant−2.613 ***85.90 ***−0.686 ***113.0 ***54.11 ***91.23 ***
(0.472)(17.47)(0.0314)(22.43)(10.94)(34.14)
Firm FEYesYesYesYesYesYes
Year/Industry FEYesYesYesYesYesYes
Observations17,57417,57416,66416,66413,33313,333
R-sqWithin0.2000.1020.4630.1100.2420.104
Note: *** p < 0.01, ** p < 0.05, the standard error in brackets.
Table 6. Heterogeneity tests.
Panel A(1)(2)(3)(4)
High-TechNon-High-TechState-OwnedNon-State-Owned
VariableCECECECE
Digital−2.325 ***−0.876−1.348−2.662 ***
(0.719)(0.751)(1.028)(0.621)
Size2.0354.240 ***−1.3315.535 ***
(1.804)(1.629)(2.780)(1.230)
Lev35.71 ***−2.37617.69 *19.98 ***
(5.705)(7.163)(10.59)(4.494)
ROE90.00 ***81.48 ***88.62 ***84.05 ***
(6.018)(7.753)(8.822)(5.667)
Indep10.03 *8.32413.938.695
(5.667)(8.107)(9.041)(5.456)
Dual−1.873−0.4480.363−1.963
(1.197)(1.863)(1.968)(1.220)
Er−319.9−601.3−1114 ***−85.12
(294.8)(376.8)(387.8)(287.4)
Market0.214−2.485 *−4.118 ***1.525 *
(0.792)(1.488)(1.345)(0.877)
Constant144.8 ***113.4 ***140.8 ***94.39 ***
(22.48)(19.42)(28.49)(29.65)
Firm FEYesYesYesYes
Year/Industry FEYesYesYesYes
Observations13,6646614602514,253
R-sq Within0.0970.1200.1370.108
Panel B(1)(2)(3)(4)(5)
High-Carbon EmissionsLow-Carbon EmissionsEasternCentralWestern
VariableCECECECECE
Digital−2.091 **−0.364−2.286 ***−1.122−0.609
(0.845)(0.272)(0.659)(1.162)(1.305)
Size−1.3643.731 ***4.153 ***2.714−2.602
(2.461)(0.547)(1.604)(2.779)(3.297)
Lev22.47 ***3.768 *22.29 ***23.24 **27.87 ***
(7.849)(2.042)(5.544)(9.878)(9.937)
ROE74.79 ***46.09 ***84.94 ***88.71 ***105.4 ***
(8.322)(2.855)(5.775)(11.03)(12.78)
Indep11.814.30011.39 **14.45−1.887
(7.855)(2.898)(5.604)(10.78)(12.58)
Dual−0.556−0.567−1.9402.376−5.543 **
(1.777)(0.537)(1.200)(2.491)(2.492)
Er−1275 ***179.5−704.2 **−2013 ***−180.5
(390.5)(128.9)(289.5)(587.0)(537.3)
Market−0.2490.1061.028−1.897−3.751 *
(1.308)(0.401)(0.901)(2.497)(2.113)
Constant134.1 ***52.24 ***72.95 ***69.01*98.19 ***
(34.21)(8.110)(25.58)(36.54)(33.64)
Firm FEYesYesYesYesYes
Year/Industry FEYesYesYesYesYes
Observations10,16610,11214,71032002368
R-sq Within0.0850.1290.1050.1260.152
Note: *** p < 0.01, ** p < 0.05, * p < 0.1, the standard error in brackets.
Disclaimer/Publisher’s Note: The statements, opinions and data contained in all publications are solely those of the individual author(s) and contributor(s) and not of MDPI and/or the editor(s). MDPI and/or the editor(s) disclaim responsibility for any injury to people or property resulting from any ideas, methods, instructions or products referred to in the content.

