Abstract
This paper investigates how octanol, used as a renewable additive in Jet A fuel, influences the performance and emissions of aviation micro-turbo engines. Blends containing 10%, 20%, and 30% octanol, with an additional 5% n-heptane, were tested to closely replicate Jet A’s physical–chemical properties. Mathematical models validated using density and viscosity data achieved accurate predictions, with maximum absolute errors of 0.0018 g/cm3 for density and 0.4020 mm2/s for viscosity. Performance assessments showed that fuel consumption increased due to octanol’s lower calorific value, requiring higher fuel flow to sustain engine speed. Combustion temperature variations ranged from a decrease of 5.38% in Regime 1 (30% octanol) to increases of up to 1.47% and 1.13% in Regimes 2 and 3, respectively, without compromising engine stability. Thrust variations were minimal, with decreases up to 0.72% observed at 30% octanol concentration. Emission analysis indicated significant reductions in CO and NOx levels with increased octanol content, attributed to enhanced combustion completeness and additional oxygen availability. SO2 emissions also decreased slightly due to the lower sulfur content. Thermal efficiency marginally declined from 5.04% (Jet A) to approximately 4.92–4.97% for octanol blends. These findings support octanol as a viable sustainable additive, offering substantial emission benefits with only minor efficiency trade-offs.
1. Introduction
Aviation faces stricter environmental regulations due to high emissions of greenhouse gases (GHGs) and air pollutants from turbine engines using fossil based fuels like Jet A-1. To address these concerns, sustainable aviation fuels (SAFs), particularly alcohol-based alternatives such as methanol, ethanol, and butanol, are increasingly explored. Research shows that these renewable alcohol blends reduce harmful emissions while maintaining engine performance, representing a viable pathway toward carbon-neutral aviation. Continued studies into alcohol-based SAFs could significantly lower aviation’s environmental impact without compromising operational reliability [1].
Among the various alternative fuel sources, biofuels, hydrogen, and alcohols have shown considerable promise. Biofuels, and especially biodiesel, are already being blended with conventional jet fuel to reduce carbon emissions [2,3,4]. Hydrogen, a clean fuel with no carbon emissions during combustion, is another option being explored [5,6]. However, hydrogen requires significant infrastructure changes and storage considerations, which can delay its implementation in commercial aviation [5]. In contrast, alcohols, which are already widely used in other sectors such as automotive and industrial applications, present a more immediate and practical alternative for aviation fuel [7].
Alcohols, including methanol, ethanol, n-butanol, and n-pentanol, have distinct advantages as SAFs because their high O2 content positively helps combustion and reduces harmful emissions. The incorporation of oxygenates like alcohols in fuel blends helps to decrease CO, HC, and PM emissions, which are some of the primary pollutants in jet engine exhaust. These fuels also tend to have lower carbon-to-hydrogen ratios, which means they release less CO2 per unit of energy produced compared to conventional jet fuels. Despite these advantages, alcohols are not yet a mainstream solution for aviation fuel, and several challenges remain. When compared with classical aviation fuels, alcohols show a disadvantage because of their decreased energy density, which is a significant hurdle, as alcohols like ethanol contain less energy per liter than Jet A. This lower energy content could affect the range and efficiency of aircraft if used in pure form. However, the blending of alcohols with conventional fuels offers a potential compromise, as it allows for a reduction in carbon emissions while maintaining the performance characteristics of the fuel [7,8]. Several studies have studied the effects of the use of alcohols/Jet A blends and other aviation fuels in both laboratory and engine tests. These tests assess the impact of alcohols on fuel properties, combustion performance, and emissions. Alcohol-based fuels are characterized by their increased O2 content, which delivers enhanced combustion and, consequently, reduces the formation of gaseous pollutants in engine exhaust. Short-chain alcohols (C1–C4) have been the most studied alcohols in terms of their application as aviation fuels. These fuels are generally produced via fermentation processes from biomass, making them renewable and capable of contributing to a decreased lifecycle for CO and CO2 when compared to “classical” fuels. Alcohols have distinct advantages over traditional jet fuels, especially in terms of their combustion characteristics. The higher oxygen content in alcohols aids in more complete combustion, potentially reducing the formation of soot and unburned hydrocarbon [9,10,11,12,13,14]
In a study by Prak et al. [15], a surrogate mixture for alcohol-to-jet (ATJ) fuel was developed using commercially available hydrocarbons. The surrogate blend, consisting of 25% 2,2,4,4,6,8,8-heptamethylnonane and 75% iso-dodecane, closely matched the physic-chemical properties of ATJ: density, viscosity, and flash point. Combustion tests in a Yanmar diesel engine with 30% surrogate mixtures showed similar performance to a 70% JP-5/30% ATJ blend, validating the surrogate’s effectiveness in replicating ATJ fuel behavior [15]. This finding underscores the potential of alcohol-based ATJ fuels to mimic the performance of traditional jet fuels, making them a viable alternative for aviation. The effects of blending various alcohols (methanol, ethanol, iso-propanol, and diethylene glycol monomethyl ether) with JP-8 fuel were examined by Yasar et al. [16] Their study focused on key fuel physical–chemical properties. The results showed that alcohol additions did not significantly affect the density of the fuel, but the viscosity increased with higher alcohol concentrations, particularly with isopropanol and di-EGME. Notably, the freezing point of the fuel lowered as the concentration of methanol and ethanol increased, improving the fuel’s performance in cold weather conditions [16]. Research by Park et al. [17] focused on blending long-chain alcohols (C4–C8) with JP-5 jet fuel to determine their impact on fuel properties and engine combustion. The study found that blending made of alcohols/jet fuel often resulted in lower flash points; the longer-chain alcohols (e.g., n-octanol) exhibited combustion properties closer to those of JP-5, making them more compatible with military jet applications [17]. This suggests that the blending of longer-chain alcohols may be particularly beneficial for applications where fuel volatility and engine performance are crucial. The authors of paper [18] have investigated the use of cosolvents to improve the stability of alcohol/diesel and alcohol/jet fuel blends. This research demonstrated that cosolvents effectively stabilized methanol and hydrous methanol blends, eliminating phase separation at various temperatures. These findings are particularly important because phase separation in alcohol-based fuel blends is a significant challenge in maintaining fuel stability and performance. Another challenge is the compatibility of alcohol blends with existing infrastructure, particularly in terms of fuel storage, transportation, and handling at airports. Some alcohols, such as methanol, can be corrosive to certain materials used in aviation fuel systems, requiring modifications to infrastructure and equipment.
A significant focus has been placed on alcohol-based additives, such as n-butanol, n-pentanol, and ethanol, which have demonstrated potential in improving combustion efficiency and reducing emissions. For example, blends made of pentanol/Jet A, which were fed in a swirl-stabilized combustor, were shown to significantly reduce soot production, with 10% and 20% by energy content leading to lower PM emissions, while the primary soot particle sizes remained relatively unaffected [19]. Similarly, blending n-pentanol with aviation kerosene (Jet A) improved thermal efficiency, reduced NOx emissions by up to 40%, and lowered combustion temperatures without negatively affecting engine performance [20]. In the context of alcohol-to-jet (ATJ) fuels, studies revealed that although incorporating these bio-based fuels into Jet A-1 blends resulted in slight increases in CO, HC, and NOx emissions, these changes were minimal and well within acceptable limits, ensuring that the operational conditions of the engine remained stable [21]. Further, n-butanol blends with Jet A-1 have been explored in micro gas turbines, showing that higher concentrations of n-butanol can enhance combustion efficiency and lower SO2 and CO emissions [22]. These findings highlight n-butanol’s potential to improve performance while simultaneously reducing the environmental footprint of aviation fuels.
A relevant study is discussed in [23], analyzing the influence of methanol on microturbine performance through testing fuel blends containing 10%, 20%, and 30% methanol across various operating conditions. The findings reveal that blends with 10% and 20% methanol concentrations ensure stable operation, whereas a 30% methanol blend causes instability, particularly at maximum operational speeds. Additionally, emissions produced during testing were examined, reinforcing the viability of utilizing lower-concentration methanol blends in aviation. Moreover, research presented in [24] evaluates microturbine performance using ethanol blends between 10 and 30% tested at multiple operating conditions from min to max. Results demonstrate that ethanol/Jet A blends maintain unchanged performances of the engine and notably decrease emissions, thus substantiating their potential as efficient sustainable aviation fuels (SAFs) for aviation engines. Additionally, biofuel-enriched blends, such as those containing ethanol or rapeseed oil, have shown similar benefits, a thrust increase of 35% and a 41% decrease in specific fuel consumption, alongside lower emissions of NOx, CO, and HC [25]. Moreover, n-butanol’s addition to Jet A-1 fuel in turbulent swirl-stabilized flames led to a consistent reduction in soot volume fraction and primary particle sizes, confirming its ability to mitigate soot formation and enhance combustion efficiency [26]. These studies underscore the promise of alcohol-based and biofuel-enriched SAFs in both improving engine performance and reducing harmful emissions in aviation.
The current paper aims to assess the performances of a micro-turbo engine using aviation fuel blends composed of octanol and Jet A at concentrations of 10%, 20%, and 30%, along with a 5% n-heptane blend. The addition of n-heptane to the mixture was chosen to improve the freezing point, as n-heptane exhibits a more favorable freezing point of −90.55 °C [27] compared to Jet A fuel (−40 °C) [28]. Aircraft engine fuel is exposed to extremely low temperatures at high altitudes, and a higher freezing point can lead to the formation of ice crystals. These crystals can block fuel filters and lines, resulting in insufficient fuel supply and potentially engine shutdown. This approach is a step forward and may represent the added value within this field since most research groups are focused on using short-chain alcohols to feed aviation turb engines. The most important parameters linked to engine performance (thrust, fuel consumption, combustion chamber temperature, specific fuel consumption, combustion efficiency, and thermal efficiency) have been assessed. In addition, the emissions analysis focuses on gaseous emissions (CO, NOx, and SOx). The objective of this comparative analysis is to gain insights into the potential of using n-butanol as SAF by blending it with Jet A. This work aims to contribute to the development of optimized engines suitable for a large variety of applications. The approach is particularly relevant given the growing need for environmentally friendly fuels, as stringent environmental regulations continue to emerge. Furthermore, by using long-chain alcohols like octanol to form blends and feed an aviation turbo engine, the study contributes to the specialized literature by identifying effective strategies for integrating higher alcohols into aviation fuel systems, highlighting both the advantages of and challenges in their practical application.
2. Materials and Methods
2.1. Materials and Mixture Preparation
Jet A fuel and oil (Aeroshell 500) for engine lubrication were purchased from a local company. n-heptane (≥99%) was produced by Lach-Ner (Neratovice, Czech Republic). n-octanol (≥99%) was obtained from Merck SA Company (Darmstadt, Germany).
Some physical–chemical properties of Jet A fuel have previously been reported by Osman et al. [29].
In this study, mixture fuels were prepared by adding 1-octanol at 10%, 20%, and 30% volumetric rates (Table 1) with an accuracy of ±0.05 mL. All mixtures are miscible. To avoid evaporation into the atmosphere, the mixtures are stored in airtight containers.

Table 1.
Mixture compositions.
2.2. Analysis Procedures
Following preparation, samples were analyzed using the procedures outlined below.
- Blend Composition: A Fourier Transform Infrared (FT-IR) spectrometer from Perkin Elmer (Waltham, MA, USA) was used to analyze the blend composition.
- Experimental data on the density and viscosity of these mixtures, as reported in our earlier work [29], will serve as the basis for testing the predictive capabilities of various mixing models. The density and viscosity of Jet A, oil, heptane, and octanol were experimentally determined at a temperature of 293.15 K and atmospheric pressure. Density measurements were carried out using an Anton Paar SVM 3000 instrument, as in the ASTM D7042 test method. The accuracy of the density measurements is ±5 × 10⁻⁴ g·cm−3. The dynamic viscosity was also measured using the Anton Paar SVM 3000, following the ASTM D7042 test method. The dynamic viscosity measurements have an accuracy of ±0.35%. The SVM 3000 includes a thermostat with an accuracy of ±2 × 10⁻² °C. The Anton Paar SVM 3000 measures dynamic viscosity and density, and then calculates the kinematic viscosity based on these measurements.
2.2.1. Models for Predicting Mixtures Density and Kinematic Viscosity
Different equations were employed to represent the experimental data.
To calculate the density of liquid blends, Kay’s mixing rule (KMR) [30] is often used. This rule states the following:
in which ρ is the blend’s density (g/cm3), ρ1, ρ2, ρ3 and ρ4 are the densities of the individual components, and v1, v2, v3 and v4 are their respective volume fractions.
The kinematic viscosity of a liquid mixture measured at atmospheric pressure only depends on the mixture composition and temperature. Mixing rules, such as the Arrhenius model (which is a simplified Grunberg–Nissan equation), are often used.
Arrhenius Equation [31]:
Models with parameters were also used to estimate the viscosity of Jet A blends with biofuels; the Grunberg–Nissan [32] equation is as follows:
The significance of symbols used in Equations (2) and (3) is as follows: η represents the viscosity of the blend; η1, η2, η3, and η4 represent the viscosity of Jet A, n-heptane, oil and n-octanol, respectively; v1, v2, v3, and v4 represent Jet A, n-heptane, oil and n-octanol volume fraction in the blend, respectively; and G12 is an adjustable parameter.
To evaluate the accuracy of different equations used to predict mixture properties, the absolute error (AE) was calculated and analyzed for each blend.
where Ycal represents the calculated property value, and Yexp represents the measured property value.
- Analysis of the Combustion Process of the Mixtures
Once the elemental composition is established, various fundamental parameters stemming from the stoichiometrically accurate oxidation of the fuels can be computed. Accordingly, the estimation employs the generic molecular structure CcHhOoNn [33], incorporating particular proportions of gC, gH, gO, and gN. To grasp the combustion mechanism, it is vital to determine the minimal quantity of oxygen demanded for complete burning, as illustrated in Equation (5), followed by the volume of air required for the reaction, as indicated in Equation (6). In addition, a critical aspect of combustion evaluation involves quantifying the carbon dioxide formed, depicted in Equation (7), as well as the volume of water vapor produced during the reaction, outlined in Equation (8).
CO2 and H2O from the combustion process can be calculated by using the following:
2.2.2. Experimental Testing Approach
The test campaign was performed on a Jet Cat P80 microturbine engine, manufactured by Gunt in Hamburg, Germany, as shown in Figure 1. The components marked A and B refer to the microturbine and the emissions probe, respectively.
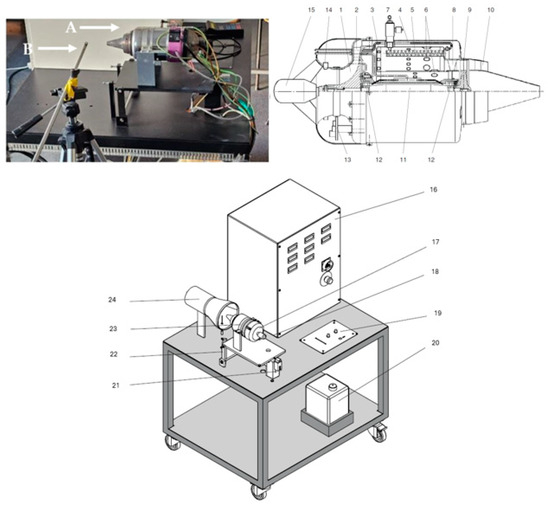
Figure 1.
Experimental test stand, A and B refer to the microturbine and the emissions probe, respectively.
The engine configuration consists of an axial turbine mechanically connected to a radial compressor, both integrated into a ring-shaped combustion module. These components, along with the supporting frame, form a compact unit primarily designed for model aircraft applications.
The operation initiates with the high-speed rotation of the compressor rotor (1), reaching rotational speeds between 35,000 and 115,000 rpm to draw in air. This air is then directed into a cast aluminum diffuser (2), where its velocity is converted into pressure.
As the compressed air enters the combustion zone (3), a portion is guided to the leading edge of the internal flame tube (4). Simultaneously, liquid fuel is injected from the rear end into specific evaporator tubes (5), where it is atomized and vaporized. The resulting vaporized fuel combines with the primary air near the flame tube’s entry point and is subsequently ignited.
To prevent thermal overload inside the combustion chamber, the internal liner receives additional airflow through designated slots (6), allowing cooler secondary air to moderate the temperature. This method ensures that the extremely high combustion temperatures (potentially reaching 2000 °C) are reduced to approximately 600–800 °C before entering the turbine stage. Ignition is initiated via a plug (7) during engine start-up.
The combustion products are then funneled into the turbine diffuser (8), where the gases are directed toward the turbine’s axial rotor (9). Within the turbine stage, the high-energy gas stream imparts mechanical energy to the compressor shaft while simultaneously expanding and cooling.
Eventually, the exhaust gases exit through the propulsion nozzle (10) at a temperature close to 600 °C. The turbine and compressor share a common shaft (11), supported by ball bearings (12), which are lubricated and cooled via airflow from the compressor. The front hood houses the electronic components (13) that control the starter motor (15), monitor temperature, and measure speed (14).
Additional components incorporated in the setup include the following: (16) a command panel outfitted with switches and status indicators; (17) an air intake nozzle; (18) the support frame for the turbine; (19) the control system interface for the turbine; (20) a dedicated fuel tank; (21) a force measurement sensor for thrust analysis; (22) a support mount for the turbine; (23) the propulsion unit; and (24) the mixing duct.
Control of the microturbine is carried out through an operator interface situated ahead of the turbine housing, where the real-time status of onboard electronics is displayed. The engine’s power output is adjusted using a throttle mechanism with a sliding lever. Fuel is delivered into the system by an electric pump, directed toward the evaporator tubes, while the flow rate is precisely regulated according to engine speed via an electronic controller. For safety, an emergency valve is available to instantly interrupt fuel supply.
The engine’s startup sequence is automated and utilizes a high-performance DC motor to rotate the compressor shaft, employing a self-adjusting cone-type clutch. After reaching a defined minimum rotational speed, the ignition circuit is enabled, and startup fuel is injected via a solenoid-actuated valve. Following ignition, the electric drive continues to accelerate the turbine. Once a stable combustion temperature is reached, the main fuel line is activated, and the initial auxiliary fuel supply is shut off. The electric motor remains operational to stabilize the system. All stages of the startup and operating process are digitally monitored, ensuring consistent engine speed and optimal thermal behavior.
To monitor crucial parameters during testing, sensors continuously capture and record thrust, pre-turbine temperature, post-compressor temperature, rotational speed, combustion chamber exit pressure, fuel consumption, and airflow. The micro-turbo engine’s instrumentation logs all these metrics every second throughout testing procedures.
Since this type of turbojet engine lacks an oil circulation pump, the bearings are lubricated by the fuel itself; therefore, 5% Aeroshell 500 oil is blended into the fuel.
Testing was conducted under three primary operational conditions—idle, cruising power, and peak output.
Each operating regime was sustained for roughly two minutes, ensuring that all measured variables were consistently monitored and logged.
While using its standard reference fuel (in this context, kerosene), the control algorithm targets a specific engine speed corresponding to a set throttle input. When a different fuel mixture with altered properties—such as Jet A blended with octanol—is introduced, the engine’s rotational output decreases, affecting speed performance. To counteract this, the onboard regulation system increases fuel injection into the combustor, allowing the engine to preserve its rotational performance regardless of fuel composition.
For the analysis of gas emissions, an MRU Vario Plus analyzer (Messgeräte für Rauchgase und Umweltschutz GmbH, Neckarsulm-Obereisesheim, Germany) was utilized. As shown in Figure 2, A denotes the analyzer, B the heating tube for gas sample conveyance, and C the probe. The analyzer enabled simultaneous detection of multiple gaseous species, with primary focus on carbon monoxide (CO) and sulfur dioxide (SO2). The detection range for SO2 spanned 0–2000 ppm, with a margin of ±10 ppm or 5%; for CO2, the range was 0–4000 ppm with identical accuracy. Nitrogen oxides (NOx) were measured within 0–200 ppm, with an error margin of ±5 ppm or 5%.
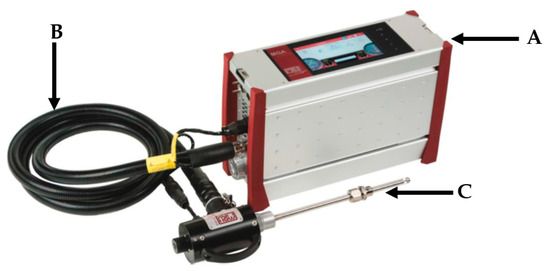
Figure 2.
Analyzer used for recording gaseous emissions A denotes the analyzer, B the heating tube for gas sample conveyance, and C the probe.
2.3. Calculating Micro-Turbine Engine Performance
The most pivotal performance indicators that can be exclusively derived from experimental measurements include specific fuel consumption—an indispensable metric for assessing the operational efficiency of turbine engines—along with combustion efficiency and thermal efficiency. The determination of these parameters relies on the application of a defined set of equations [34].
To evaluate the specific fuel consumption, Equation (9) is employed. Given that the micro-turbine instrumentation provides direct measurements of both the fuel mass flow rate and the thrust output, the specific fuel consumption can be accurately computed from these empirical values. In this context, F denotes the thrust force recorded in newtons (N), while represents the fuel mass flow rate in kilograms per second (kg/s).
Accordingly, Equation (9) is used for the computation of the specific consumption parameter, denoted as S.
is the fuel flow rate expressed in kg/s, while F is the thrust force generated by the micro-turbine engine in N. Since the micro-turbine instrumentation records fuel flow in L/s, it is necessary to know the density of each fuel, which is determined in the laboratory.
Combustion efficiency is determined using Equation (10).
In this expression, is the fuel flow rate expressed in kg/s, LCP denotes the lower heating value of the fuel, refers to the temperature measured upstream of the turbine (i.e., at the exit of the combustion chamber), and corresponds to the temperature recorded at the inlet of the combustion chamber (immediately downstream of the compressor). Ma represents the mass flow rate of air, expressed in kilograms per second (kg/s), while and signify the specific heat capacities at constant pressure for the compressed air at the compressor outlet and for the combustion products at the outlet of the combustion chamber, respectively. These specific heat values are evaluated at the associated measured temperatures.
Thermal efficiency is calculated using Equation (11), utilizing parameters obtained directly through measurements or derived from the data recorded by the micro-turbine instrumentation.
In this instance, ve characterizes the outflow velocity of the gases from the nozzle after combustion.
3. Results and Discussion
3.1. Modeling Results
The measured and calculated density values for the prepared mixtures are detailed in Table 2. Experimental determination of the density of Jet A, Aeroshell oil, n-heptane, and n-octanol was required to verify Equation (1). Specifically, at a temperature of 293.15 K, the following densities were determined: Jet A, 0.7849 g/cm3; Aeroshell oil, 0.9987 g/cm3; n-heptane, 0.6832 g/cm3; and n-octanol, 0.8247 g/cm3. The calculated densities, derived from the component densities and mixture compositions, demonstrated a high level of accuracy, with absolute errors (AEs) ranging from 0.0012 to 0.0018 g/cm3.
Table 2.
Comparison of experimental and calculated density and kinematic viscosity of mixtures at 293.15 K.
The measured and calculated kinematic viscosity values for the mixtures are detailed in Table 2. To verify the accuracy of the prediction equations, experimental viscosity measurements were conducted for the individual components at 293 K. Specifically, at 293.15 K, the kinematic viscosities were determined as follows: Jet A, 1.4377 mm2/s, Aeroshell oil, 59.5130 mm2/s; n-heptane, 0.4996 mm2/s; and n-octanol, 11.2790 mm2/s. As shown in Table 3, Equation (3) demonstrated the highest accuracy in predicting the mixture viscosities, with absolute errors (AEs) between 0.00010 and 0.0130 mm2/s. The absolute error for Equation (2) was found to be within the range of 0.1281–0.4020 mm2/s.
Table 3.
Elemental composition and lower heating value.
Another characteristic analyzed in the laboratory is the FTIR analysis. Figure 3 presents the FTIR analysis for Jet A and Aeroshell 500 oil, while Figure 4 shows a comparative FTIR analysis of Jet A + 5% Aeroshell 500 oil against the three studied blends.
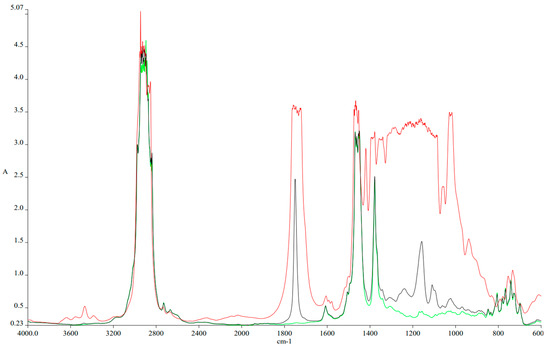
Figure 3.
FTIR spectra comparison for Jet A (green), Aeroshell 500 oil (red), and a Jet A blend with 5% Aeroshell 500 oil (black).
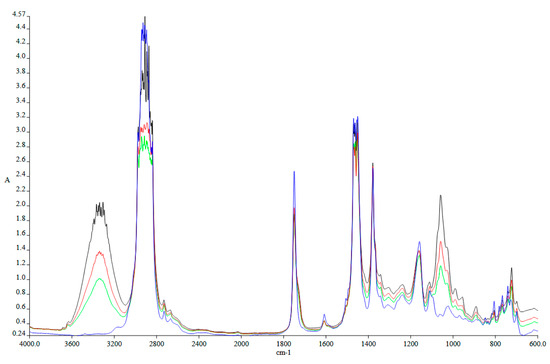
Figure 4.
FTIR spectra of Jet A + 5% Aeroshell 500 Oil (blue), 10% Octanol (green), 20% Octanol (red), and 30% Octanol (black).
Figure 3 shows the spectra of pure kerosene (green), pure Aeroshell 500 oil (red) and the used fuel for Jet CAT 80 turbo engine kerosene + 5% Aeroshell 500 (black). The adding of the oil into the kerosene is needed in order to protect the internal components of the engine since it does not have a separate lubrication system. Therefore, the fuel must contain 5% oil while it is fed into the engine. The choice of Aeroshell 500 oil is recommended by the engine producer, and its warranty is based on the use of recommended products.
As shown in the figure, adding the oil into the mixture brings along some new bonds. Thus, between 700 and 1350 cm−1 the added structures within the mixture are based on glycols (1000–1140 cm−1) due to the fact that Aeroshell 500 is a PAG (poly alkyl glycol)-based oil, sulphate (1150 cm−1) and anti-ware additive (930–1000 cm−1). Also, the anti-oxidation additive can be observed at 1720 cm−1. The presence of sulfur-based additives should translate into increased SOx formation during the combustion process.
Figure 4 presents the comparative trends among the fuel samples as the concentration of octanol increases from 10% to 30%, relative to the baseline fuel designated as KE (where KE consists of pure kerosene blended with 5% Aeroshell 500 lubricant). In this context, KE serves as the reference formulation, while the modified mixtures—KE with 10% octanol (depicted in green), KE with 20% octanol (in red), and KE with 30% octanol (in dark blue)—are examined for analytical comparison.
Spectroscopic analysis reveals that the hydroxyl (-OH) functional group is detectable within the wavenumber range of 3650–3150 cm−1. As the proportion of alcohol increases, the absorbance within this region intensifies, attributable to the greater incorporation of -OH moieties introduced by the octanol. This behavior is anticipated to enhance the overall combustion performance of the mixture, given that the intrinsic oxygen content in the alcohol facilitates more complete oxidation reactions. As a result, the requirement for externally supplied air diminishes, thereby contributing to a potential reduction in nitrogen oxide (NOx) emissions.
Another notable spectral feature is observed at approximately 1750 cm−1, corresponding to the carbonyl group (C=O), indicative of oxygen atoms doubly bonded to carbon. At 1450 cm−1, a marginal decrease in methylene (-CH2) group intensity is detected in comparison to the reference fuel. Conversely, the absorption observed around 1350 cm−1 signifies an increase in methyl (-CH3) groups. Furthermore, a distinct peak at 1000 cm−1, attributed to the C–OH bond, also intensifies with higher alcohol content, mirroring the trend seen in the -OH absorption region.
Additional characteristics relevant to the modified fuel blends, such as the lower heating value (LHV) and elemental composition, are summarized in the accompanying table. Analysis of the tabulated data indicates a slight decline in the LHV with increasing octanol content. However, the inclusion of n-heptane—possessing a higher LHV than the Jet A and 5% Aeroshell 500 mixture—demonstrates a compensatory benefit in terms of energy content.
Regarding the elemental analysis, both n-heptane and octanol have a lower carbon content and a higher hydrogen content, which will affect the amount of CO2 and water vapor produced during combustion.
3.2. The Results of Theoretical Combustion Process
After performing the calculations using Formulas (5)–(8) for the values in Table 3, the resulting data are presented in the Table 4, which shows the amounts of CO2, water, oxygen, and air required for the stoichiometric combustion of one kilogram of fuel.
Table 4.
Evaluation results per unit mass of fuel.
It can be observed from the table above that n-heptane requires more air for stoichiometric combustion compared to kerosene and octanol. N-heptane does not have a positive influence on the amount of CO2 emitted during combustion; thus, it would be better to use only octanol in the blends. However, the presence of n-heptane has improved other properties, such as calorific value, etc. A decrease in the required air quantity is noted as the alcohol concentration increases. This trend aligns with the higher oxygen content introduced by the alcohol component. Additionally, a slight but consistent drop in CO2 emissions is observed with increasing alcohol content. These results highlight the complex interplay between alcohol proportion, oxygen contribution, and the resulting carbon dioxide formation under stoichiometric combustion conditions.
3.3. The Results of Micro Turbo Jet Engine Experiments
Following the experiments conducted for the three operating regimes of the turbo engine, the main parameters of interest are presented in the following Figure 5, Figure 6 and Figure 7, namely the combustion gas temperature in front of the turbine , the fuel flow rate (Qc), and the thrust force generated by the micro-turbo engine (F).
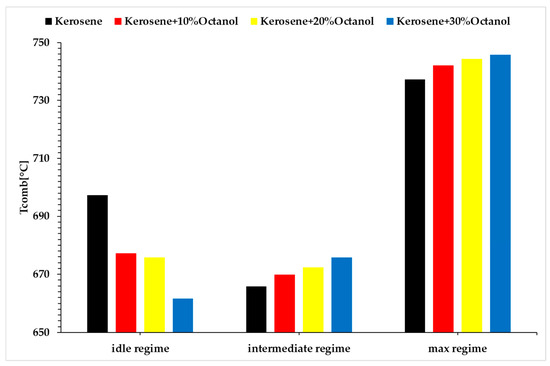
Figure 5.
Combustion gas temperature in front of the turbine vs. regimes vs. fuel blends.
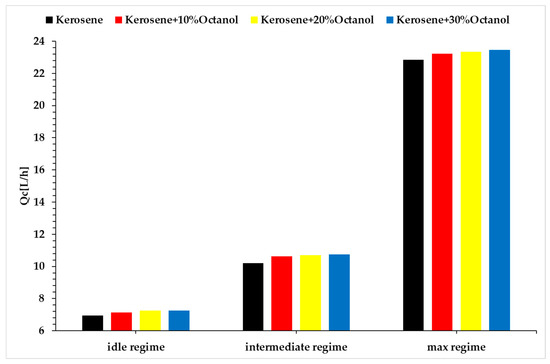
Figure 6.
Fuel flow rate vs. regimes vs. fuel blends.
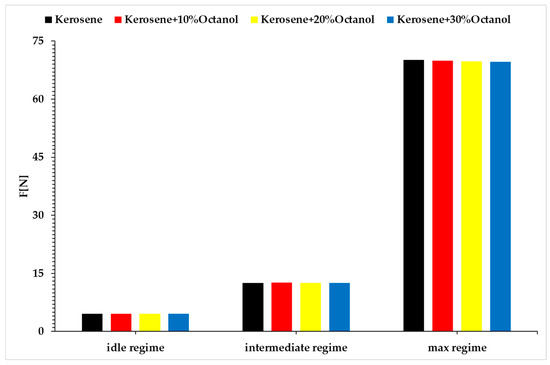
Figure 7.
Thrust vs. regimes vs. fuel blends.
Analyzing the above figures, it can be observed that the fuel consumption rate of the micro-turbo engine increases with the rising concentration of added octanol for all three regimes. The micro engine operates under a specific performance law, which requires the engine to achieve a certain rotational speed at a specific throttle percentage. Since the tested blends have lower calorific values than the base fuel, the energy released during combustion is lower. Consequently, for the engine to maintain the same rotational speed, the fuel pump must supply a larger amount of fuel to the combustion chamber. This explains the increase in fuel consumption, and at the same time, with an increased fuel flow rate and maintaining the same operating speed, the same amount of air drawn in by the compressor will result in a higher combustion temperature, as shown in Figure 5.
The idle regime (Regime 1) is quite unstable, exhibiting fluctuations in operation, which could explain the lower combustion temperatures observed in idle compared to the base fuel. Although the combustion gas temperatures for Regimes 2 and 3 are higher than for the base fuel, these increases are not significant enough to jeopardize the integrity of the micro-turbo engine. Based on the recorded data for thrust, the variation is extremely small compared to the base fuel, indicating that the use of octanol does not significantly decrease thrust, although there is a slight increase in fuel consumption, which will be reflected in the specific fuel consumption calculations.
Based on the analysis of Figure 5, it can be observed that, in the idle regime, the combustion gas temperature decreases for the mixtures with octanol compared to the base fuel. Specifically, in the idle regime, when 10% octanol is added, the combustion gas temperature decreases by 2.95%; with 20% octanol, the decrease is 3.17%; and with 30% octanol, the decrease is 5.38%. In Regime 2, when 10% octanol is added, there is an increase in the combustion gas temperature of approximately 0.6%; with 20% octanol, the increase is about 0.99%; and with 30% octanol, the increase is around 1.47%. In Regime 3, when 10% octanol is added, an increase of 0.65% is observed; with 20% octanol, the increase is about 0.95%; and with 30% octanol, the increase is around 1.13%. This does not affect the integrity of the engine.
Regarding the fuel consumption by the microturbine, Figure 6, a slight increase can be observed in all the tested scenarios. In Regime 1, when 10% octanol is added, the fuel flow rate increases by 4.1%; with 20% octanol, the increase is 6.13%; and with 30% octanol, the increase is 6.5%. In Regime 2, when 10% octanol is added, the fuel flow rate increases by approximately 5.49%; with 20% octanol, the increase is about 6.57%; and with 30% octanol, the increase is approximately 7.45%. In Regime 3, when 10% octanol is added, the fuel flow rate increases by approximately 3%; with 20% octanol, the increase is about 3.95%; and with 30% octanol, the increase is around 4.90%.
Regarding thrust force, Figure 7, when idle, when 10% octanol is added, there is a slight increase in thrust force of 0.07%; when 20% octanol is added, a decrease of 0.26% is observed, and with 30% octanol, the decrease is 0.3%. In Regime 2, when 10% octanol is added, a slight increase in thrust force of approximately 0.79% is observed; when 20% octanol is added, the decrease is around 0.18%, and with 30% octanol, the decrease is approximately 0.12%. In Regime 3, when 10% octanol is added, a decrease of approximately 0.26% is observed; with 20% octanol, the decrease is about 0.56%, and with 30% octanol, the decrease is approximately 0.72%. These decreases in thrust force are attributed to the increased fuel flow rate and the higher density of the fuel due to the addition of octanol.
A second important direction of the analysis was the recording of emission concentrations. Thus, Figure 8 presents the variation in CO concentration.
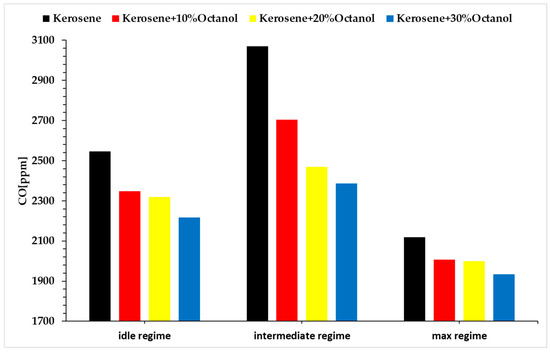
Figure 8.
CO emissions across operating regimes and fuel blends.
The concentration of CO decreases with the increasing concentration of octanol. This can also be explained by the fact that at higher combustion temperatures, the combustion is more complete, which reduces the CO concentration and produces more carbon dioxide (CO2) instead of CO. This occurs because high temperatures promote the complete oxidation of carbon in the fuel, which reduces the formation of CO. This is supported by the data presented in Figure 5, which shows the variation in combustion gas temperatures.
The formation of the NOx emission is strongly affected by the oxygen concentration, combustion temperature and the residence timing during the combustion process.
From the analysis of the figures above, it can be observed that the concentration of NOx decreases when using octanol blends for all three regimes compared to Jet A alone. This can be a direct consequence of the oxygen required for combustion also coming from the octanol molecule, resulting in lower NOx formation. Additionally, the addition of octanol reduces the proportion of nitrogen due to a lower need for outside air in the blend compared to Jet A.
Figure 9 also shows an increase in NOx production as the regimes increases, and by correlating this aspect with Figure 5 and Figure 6, it can clearly be seen that as the temperatures increases from regime 1 to 3, so does the formation of NOx. Figure 7 shows the variation in thrust, and this parameter does not vary significantly, but the concentration of octanol in the blend increases. This means a decrease in the calorific power of the blend. So, for the engine to deliver the same amount of thrust while burning a fuel with lower calorific power it means that the fuel is kept within the combustion chamber for a longer period of time, which leads to an increase in NOx formation.
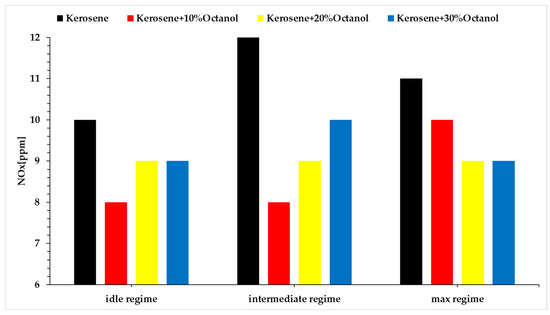
Figure 9.
NOx concentration vs. regimes vs. fuel blends.
Regarding SO2, Figure 10, it is found in trace amounts in the composition of kerosene and in certain proportions in Aeroshell 500 oil. A decrease in SO2 concentration is observed.
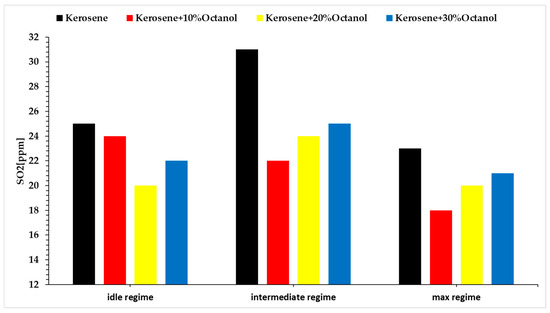
Figure 10.
SO2 concentration vs. regimes vs. fuel blends.
3.4. Results for Engine’s Performances
Based on Formula (9), the graphs in Figure 11 have been plotted.
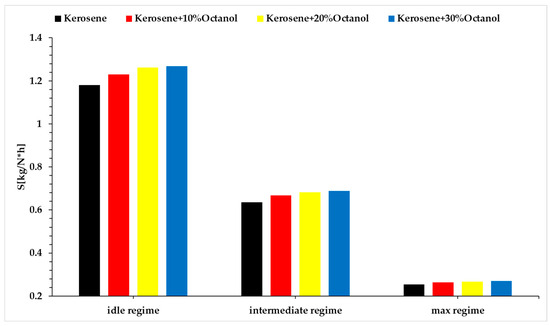
Figure 11.
Specific fuel consumption vs. regimes vs. fuel blends.
Specific consumption increases alongside an increase in the amount of octanol in each operating regime. This increase in specific consumption is due to the lower calorific value of octanol in the analyzed blends. The rise in specific consumption is not a positive characteristic and indicates a lower performance of the new fuels compared to the benchmark fuel.
In Figure 12, the variation in combustion efficiency is presented based on Formula (10).
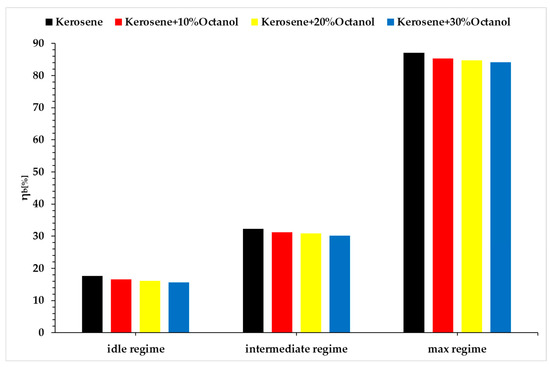
Figure 12.
Combustion efficiency vs. regimes vs. fuel blends.
As shown in Equation (10), combustion efficiency was calculated based on the measured temperatures and specific heat capacities of the working fluid at key points in the engine cycle. The slight decrease in combustion efficiency observed in the idle and intermediate regimes as octanol concentration increases is primarily attributed to less favorable fuel–air mixing due to the increased viscosity and lower volatility of octanol compared to kerosene. These characteristics impair atomization and vaporization, leading to incomplete combustion, especially at low thermal loads.
In contrast, at the maximum regime (Regime 3), the elevated combustion chamber temperature and intensified airflow promote more efficient atomization and enhanced vaporization of octanol-containing blends, which helps maintain combustion efficiency at near-constant levels across all tested mixtures. The influence of octanol’s molecular oxygen also contributes to more complete oxidation, compensating for the drop in calorific value.
Moreover, the thermodynamic state of the reactant mixture plays a significant role. At higher regimes, the increased pressure and temperature shift the equilibrium toward faster reaction kinetics and improved flame stability, thereby reducing sensitivity to the fuel’s physical properties.
The observed trends in Figure 12 are the combined result of mixture formation quality, changes in air–fuel ratio required to maintain power output with lower energy fuels, and combustion thermodynamics under different engine loads. These parameters become particularly critical when integrating oxygenated bio-components such as octanol in aviation fuels.
Based on Formula (11), the graphs in Figure 13 have been plotted, showing only the results from Regime 3, a superior regime.
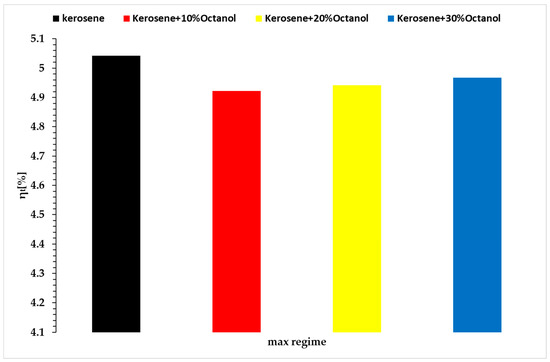
Figure 13.
Thermal efficiency vs. regime 3 vs. fuel blends.
At first glance, the thermal efficiency for micro-turbo engines is much lower than that for larger turbo engines. The thermal efficiency is slightly lower when using octanol as an additive in kerosene, with variations from 5.04% for the baseline case to values of 4.92% at a 10% octanol concentration, 4.94% at a 20% octanol concentration, and 4.97% at a 30% octanol concentration. The observed variations can be linked to both the lower heating value of octanol and the higher density of the resulting fuel mixtures, which is reflected in a higher mass flow rate of fuel to achieve similar thrust values for the four fuels.
Compared to methanol/Jet A blends, the Jet A/octanol mixtures demonstrated enhanced engine stability even at higher blend ratios (up to 30%), whereas methanol blends above 20% significantly impaired engine stability and operational continuity at idle and maximum regimes. This highlights octanol’s superior miscibility and combustion stability, likely due to its less polar nature and higher boiling point.
Regarding n-butanol, while both octanol and n-butanol contribute to reduced CO and SO2 emissions due to their oxygen content, octanol showed slightly better thermal stability, with lower viscosity increases and improved compatibility with engine operation over a wider range of conditions. In terms of fuel consumption, all alcohol blends increased specific consumption due to their lower calorific value. However, octanol induced only minor decreases in thermal efficiency (approx. 1.2%) compared to the 4–5% reported for methanol at higher concentrations.
Overall, these comparative results reinforce the potential of higher alcohols like octanol in aviation fuels, particularly for micro-turbojet applications, by offering a balanced compromise between environmental benefits and operational reliability. We have added this comparative analysis to the Section 4 of the revised manuscript.
4. Conclusions
This study assessed the integration of octanol-based fuel blends into micro-turbo engine operation, focusing on emissions, efficiency trade-offs, and practical viability. The key findings are as follows:
- Emission Reductions and Environmental Benefits
- The most notable advantage of using octanol blends is the significant reduction in harmful emissions:
- CO and NOx emissions decreased with increasing octanol concentration due to more complete combustion and additional molecular oxygen provided by octanol.
- A slight reduction in SO2 emissions was observed, attributed to the lower sulfur content in the blends.
- Although CO2 emissions were not directly reduced by n-heptane addition, higher levels of oxygenated octanol contributed to a slight decrease, indicating an intricate balance between fuel composition and emission profiles.
These improvements position octanol as a promising eco-friendly additive for aviation fuels, particularly in applications where emission regulations are increasingly stringent.
- 2.
- Trade-offs in Efficiency and Fuel ConsumptionThe benefits in emissions come with modest efficiency penalties:
- Specific fuel consumption increased in all regimes with higher octanol content due to its lower calorific value.
- Thermal efficiency decreased slightly—from 5.04% (base fuel) to between 4.92% and 4.97% for octanol blends.
- Combustion efficiency showed a mild drop in low and medium regimes but remained stable in high-load (Regime 3) operations, where increased fuel flow compensated for energy deficits.
Despite these efficiency trade-offs, engine performance remained within acceptable operational bounds.
- 3.
- Engine Performance and Operational StabilityFrom a mechanical standpoint, engine thrust and temperature changes were minimal:
- Thrust variations remained within ±0.72% across all regimes.
- Combustion temperatures increased slightly in Regimes 2 and 3 (by up to 1.47% and 1.13%) but decreased in Regime 1 by 5.38%. These changes did not compromise engine integrity or stability.
- This confirms that engine performance remains reliable when using octanol blends, even with shifts in fuel properties.
- 4.
- Fuel Blend Properties and Industry StandardsThe studied blends demonstrated consistent physical behavior:
- Density and viscosity increased with octanol concentration but decreased with temperature, all staying within ASTM D1655 limits.
- These properties make octanol blends compatible with existing aviation fuel standards, facilitating potential implementation without major design changes.
- 5.
- Practical Implications and Industry RecommendationsGiven the balance of reduced emissions and acceptable performance penalties, octanol presents a viable alternative fuel additive:
- Suitable for short- to medium-range flight operations or unmanned aerial systems (UAS) where emission reduction outweighs marginal efficiency losses.
- Promising for hybrid or partially renewable fuel strategies in light aviation or micro turbine applications.
Future work should explore long-term wear, combustion chamber deposits, and cold-weather performance to further validate its practical deployment in the aviation industry.
Further experiments need to be performed in order to assess other important parameters of the engine such as shaft rotational speed and behavior of engine performance under transient regimes, and other gaseous pollutants also need to be measured, such as CO2 and unburnt hydrocarbons. Moreover, a comparative study between different alcohols and/or other fuels blended with Jet A needs to be performed on the same turbo engine to assess their behavior.
Author Contributions
Conceptualization, V.S., G.C., R.M. and S.O.; methodology, G.C.; software, R.M. and S.O.; validation, V.S. and R.E.; writing—original draft preparation, V.S., G.C., R.M., R.E. and S.O.; writing—review and editing, V.S., G.C., R.M., R.E. and S.O. All authors have read and agreed to the published version of the manuscript.
Funding
This work was carried out through the “Nucleu” Program within the National Research Development and Innovation Plan 2022–2027, with the support of MCID, project no. PN 23.12.01.01.
Institutional Review Board Statement
Not applicable.
Informed Consent Statement
Not applicable.
Data Availability Statement
Data are available on request to the corresponding author. The data are not publicly available due to the IPR agreement signed by authors with the funding institution. All data to be made public must undergo institution’s internal check and approval.
Conflicts of Interest
The authors declare no conflicts of interest.
References
- Christodoulakis, J.; Karinou, F.; Kelemen, M.; Kouremadas, G.; Fotaki, E.F.; Varotsos, C.A. Assessment of air pollution from Athens International Airport and suggestions for adaptation to new aviation emissions restrictions. Atmos. Pollut. Res. 2022, 13, 101441. [Google Scholar] [CrossRef]
- Thonemann, N.; Pierrat, E.; Dudka, K.M.; Saavedra-Rubio, K.; Lia, S.A.; Dragsdahl, T.; Laurent, A. Towards sustainable regional aviation: Environmental potential of hybrid-electric aircraft and alternative fuels. Sustain. Prod. Consum. 2024, 45, 371–385. [Google Scholar] [CrossRef]
- Amhamed, A.I.; Hamdan Al Assaf, A.; Le Page, L.M.; Alrebei, O.F. Alternative sustainable aviation fuel and energy (SAFE)—A Review with selected simulation cases of study. Energy Rep. 2024, 11, 3317–3344. [Google Scholar] [CrossRef]
- Li, T.; Yin, L.; Xu, W.; Zhang, Y.; Xian, H.; Ronsse, F.; Li, Z.; Cordon, M.; Wang, K. Synthesis of aviation biofuel precursors from biomass-derived ketones: Substrate adsorption configuration-catalytic activity. Bioresour. Technol. 2025, 417, 131858. [Google Scholar] [CrossRef]
- Jaffary, Z.; Wiedemann, M. Towards net zero aviation: Exploring safe hydrogen refuelling at airports. J. Air Transp. Res. Soc. 2025, 4, 100048. [Google Scholar] [CrossRef]
- Yusaf, T.; Shadate Faisal Mahamude, A.; Kadirgama, K.; Ramasamy, D.; Farhana, K.; Dhahad, H.A.; Rahim Abu Talib, A.B.D. Sustainable hydrogen energy in aviation—A narrative review. Int. J. Hydrogen Energy 2024, 52, 1026–1045. [Google Scholar] [CrossRef]
- Vallejo-Blancas, D.; Sánchez-Ramirez, E.; María Ponce-Ortega, J.; Segovia-Hernández, J.G.; Quiroz Ramírez, J.J.; Contreras-Zarazúa, G. A process intensification 4.0 approach to determine the feasibility and sustainability of producing biojet-fuel by alcohol to jet route. A case of study of Mexico. Chem. Eng. Process. Process Intensif. 2025, 208, 110078. [Google Scholar] [CrossRef]
- Wei, S.; Li, Y.; Wu, L.; Zhang, Z.; Yan, S.; Ran, W. Combustion chemical reaction mechanism and kinetic analysis of RP-3 aviation kerosene/low carbon alcohol blends. J. Clean. Prod. 2024, 469, 143202. [Google Scholar] [CrossRef]
- Su-Ungkavatin, P.; Tiruta-Barna, L.; Hamelin, L. Biofuels, electrofuels, electric or hydrogen?: A review of current and emerging sustainable aviation systems. Prog. Energy Combust. Sci. 2023, 96, 101073. [Google Scholar] [CrossRef]
- Muhammed Raji, A.; Manescau, B.; Chetehouna, K.; Ekomy Ango, S.; Ogabi, R. Performance and spray characteristics of fossil JET A-1 and bioJET fuel: A comprehensive review. Renew. Sustain. Energy Rev. 2025, 207, 114970. [Google Scholar] [CrossRef]
- Lee, D.S.; Allen, M.R.; Cumpsty, N.; Owen, B.; Shine, K.P.; Skowron, A. Uncertainties in mitigating aviation non-CO2 emissions for climate and air quality using hydrocarbon fuels. Environ. Sci. Atmos. 2023, 3, 1693–1740. [Google Scholar] [CrossRef]
- Almanzalawy, M.; Nada, S.; Elwardany, A.; Elkady, M. Enhancing diesel engine performance and carbon nanotube yield using high alcohols and ferrocene. Chem. Eng. Sci. 2025, 303, 120964. [Google Scholar] [CrossRef]
- Zhu, Q.; Zong, Y.; Ren Tan, Y.; Lyu, J.-Y.; Zhou, X.; Wu, Y.; Pan, J.; Liu, H.; He, S.; Chen, W.; et al. Reducing particulate matter emissions and investigating soot characteristics in CI engines using alcohol-based additives: An experimental analysis. Int. J. Hydrog. Energy 2024, 87, 10–19. [Google Scholar] [CrossRef]
- Hua, Y. Research progress of higher alcohols as alternative fuels for compression ignition engines. Fuel 2024, 357, 129749. [Google Scholar] [CrossRef]
- Luning Prak, D.J.; Jones, M.H.; Trulove, P.; McDaniel, A.M.; Dickerson, J.T.; Cowart, S. Physical and Chemical Analysis of Alcohol-to-Jet (ATJ) Fuel and Development of Surrogate Fuel Mixtures. Energy Fuels 2015, 29, 3760–3769. [Google Scholar] [CrossRef]
- Yaşar, F. Investigation of the Effects of Alcohol and Anti-Icing Additives on the Properties of Jet Fuel. J. Turk. Chem. Soc. Sect. A Chem. 2024, 11, 945–958. [Google Scholar] [CrossRef]
- Luning Prak, D.; Cowart, J. Physical properties and diesel engine combustion of blends of alcohols with military jet fuel JP-5. Fuel 2024, 371, 132070. [Google Scholar] [CrossRef]
- El-Seesy, A.I.; El-Zoheiry, R.M.; Fouad, A.K.; Hussien, A.M.; Elshabrawy, S.O.M.; He, Z.; Nasserb, A. Impacts of octanol and decanol addition on the solubility of methanol/hydrous metha-nol/diesel/biodiesel/Jet A-1 fuel ternary mixtures. RSC Adv. 2021, 11, 18213–18224. [Google Scholar] [CrossRef]
- Vishwanath, R.B.; Carniglia, P.A.; Weber, J.K.; Gülder, Ö.L. Effects of n-pentanol blending on soot formation in swirl-stabilized turbulent spray flames of Jet A-1 in a laboratory gas turbine combustor. Fuel 2024, 357, 129971. [Google Scholar] [CrossRef]
- Suchocki, T.; Kazimierski, P.; Lampart, P.; Januszewicz, K.; Białecki, T.; Gawron, B.; Janicka, A. A comparative study of pentanol (C5 alcohol) and kerosene blends in terms of gas turbine engine performance and exhaust gas emission. Fuel 2023, 334, 126741. [Google Scholar] [CrossRef]
- Przysowa, R.; Gawron, B.; Białecki, T.; Łęgowik, A.; Merkisz, J.; Jasiński, R. Performance and Emissions of a Microturbine and Turbofan Powered by Alternative Fuels. Aerospace 2021, 8, 25. [Google Scholar] [CrossRef]
- Cican, G.; Mirea, R. An Experimental Insight into the Use of N-Butanol as a Sustainable Aviation Fuel. Fire 2024, 7, 313. [Google Scholar] [CrossRef]
- Cican, G.; Mirea, R.; Rimbu, G. Experimental Evaluation of Methanol/Jet-A Blends as Sustainable Aviation Fuels for Turbo-Engines: Performance and Environmental Impact Analysis. Fire 2024, 7, 155. [Google Scholar] [CrossRef]
- Cican, G.; Mirea, R. Performance and environmental impact of ethanol-kerosene blends as sustainable aviation fuels in micro turbo-engines. Int. J. Engine Res. 2024, 25, 2204–2214. [Google Scholar] [CrossRef]
- Manigandan, S.; Atabani, A.E.; Ponnusamy, V.K.; Gunasekar, P. Impact of additives in Jet-A fuel blends on combustion, emission and exergetic analysis using a micro-gas turbine engine. Fuel 2020, 276, 118104. [Google Scholar] [CrossRef]
- Rault, T.M.; Vishwanath, R.B.; Gülder, Ö.L. Soot formation in turbulent swirl-stabilized spray flames in a model combustor fueled with n-butanol/JetA-1 blends. Fuel 2021, 287, 119452. [Google Scholar] [CrossRef]
- Wypych, A.G. 3.4-Aliphatic hydrocarbons. Datab. Solvents 2014, 143–197. [Google Scholar] [CrossRef]
- Edwards, T.; Colket, M.; Cernansky, N.; Dryer, F.; Egolfopoulos, F.; Friend, D.; Law, E.; Lenhert, D.; Lindstedt, P.; Pitsch, H.; et al. Development of an experimental database and kinetic models for surrogate jet fuels. In Proceedings of the 45th AIAA Aerospace Sciences Meeting and Exhibit, Reno, NV, USA, 8–11 January 2007; pp. 2007–2770. [Google Scholar]
- Osman, S.; Ceatra, L.; Cican, G.; Mirea, R. Physicochemical Properties of Jet-A/n-Heptane/Alcohol Blends for Turboengine Applications. Inventions 2025, 10, 3. [Google Scholar] [CrossRef]
- Clements, D.L. Proceedings of the Third Liquid Fuels; American Society of Agricultural Engineers: St. Joseph, MI, USA, 1996; p. 44. [Google Scholar]
- Irving, J.B. Viscosities of Binary Liquid Mixtures: A Survey of Mixture Equations; National Engineering Laboratory: London, UK, 1977; p. 630. [Google Scholar]
- Grunberg, L.; Nissan, A.H. Mixture law for viscosity. Nature 1949, 164, 799–800. [Google Scholar] [CrossRef]
- Speight, J.G. Handbook of Industrial Hydrocarbon Processes; Gulf Professional Publishing: Oxford, UK, 2020; ISBN 978-0-12-809923-0. [Google Scholar]
- Mattingly, J. Elements of Propulsion: Gas Turbines and Rockets, 2nd ed.; American Institute of Aeronautics: Reston, VA, USA, 2006. [Google Scholar]
Disclaimer/Publisher’s Note: The statements, opinions and data contained in all publications are solely those of the individual author(s) and contributor(s) and not of MDPI and/or the editor(s). MDPI and/or the editor(s) disclaim responsibility for any injury to people or property resulting from any ideas, methods, instructions or products referred to in the content. |
© 2025 by the authors. Licensee MDPI, Basel, Switzerland. This article is an open access article distributed under the terms and conditions of the Creative Commons Attribution (CC BY) license (https://creativecommons.org/licenses/by/4.0/).