
Research on the Driving Factors and Trade-Offs/Synergies of Woodland Ecosystem Services in Zhangjiajie City, China


Abstract
1. Introduction
2. Materials and Methods
2.1. Study Area
2.2. Data Sources
2.3. Research Methods
2.3.1. Methods for Evaluating Ecosystem Services
2.3.2. Analysis of Driving Factors
2.3.3. Trade-Off and Synergy Analysis
2.3.4. Coupling Coordination Degree Model
3. Results
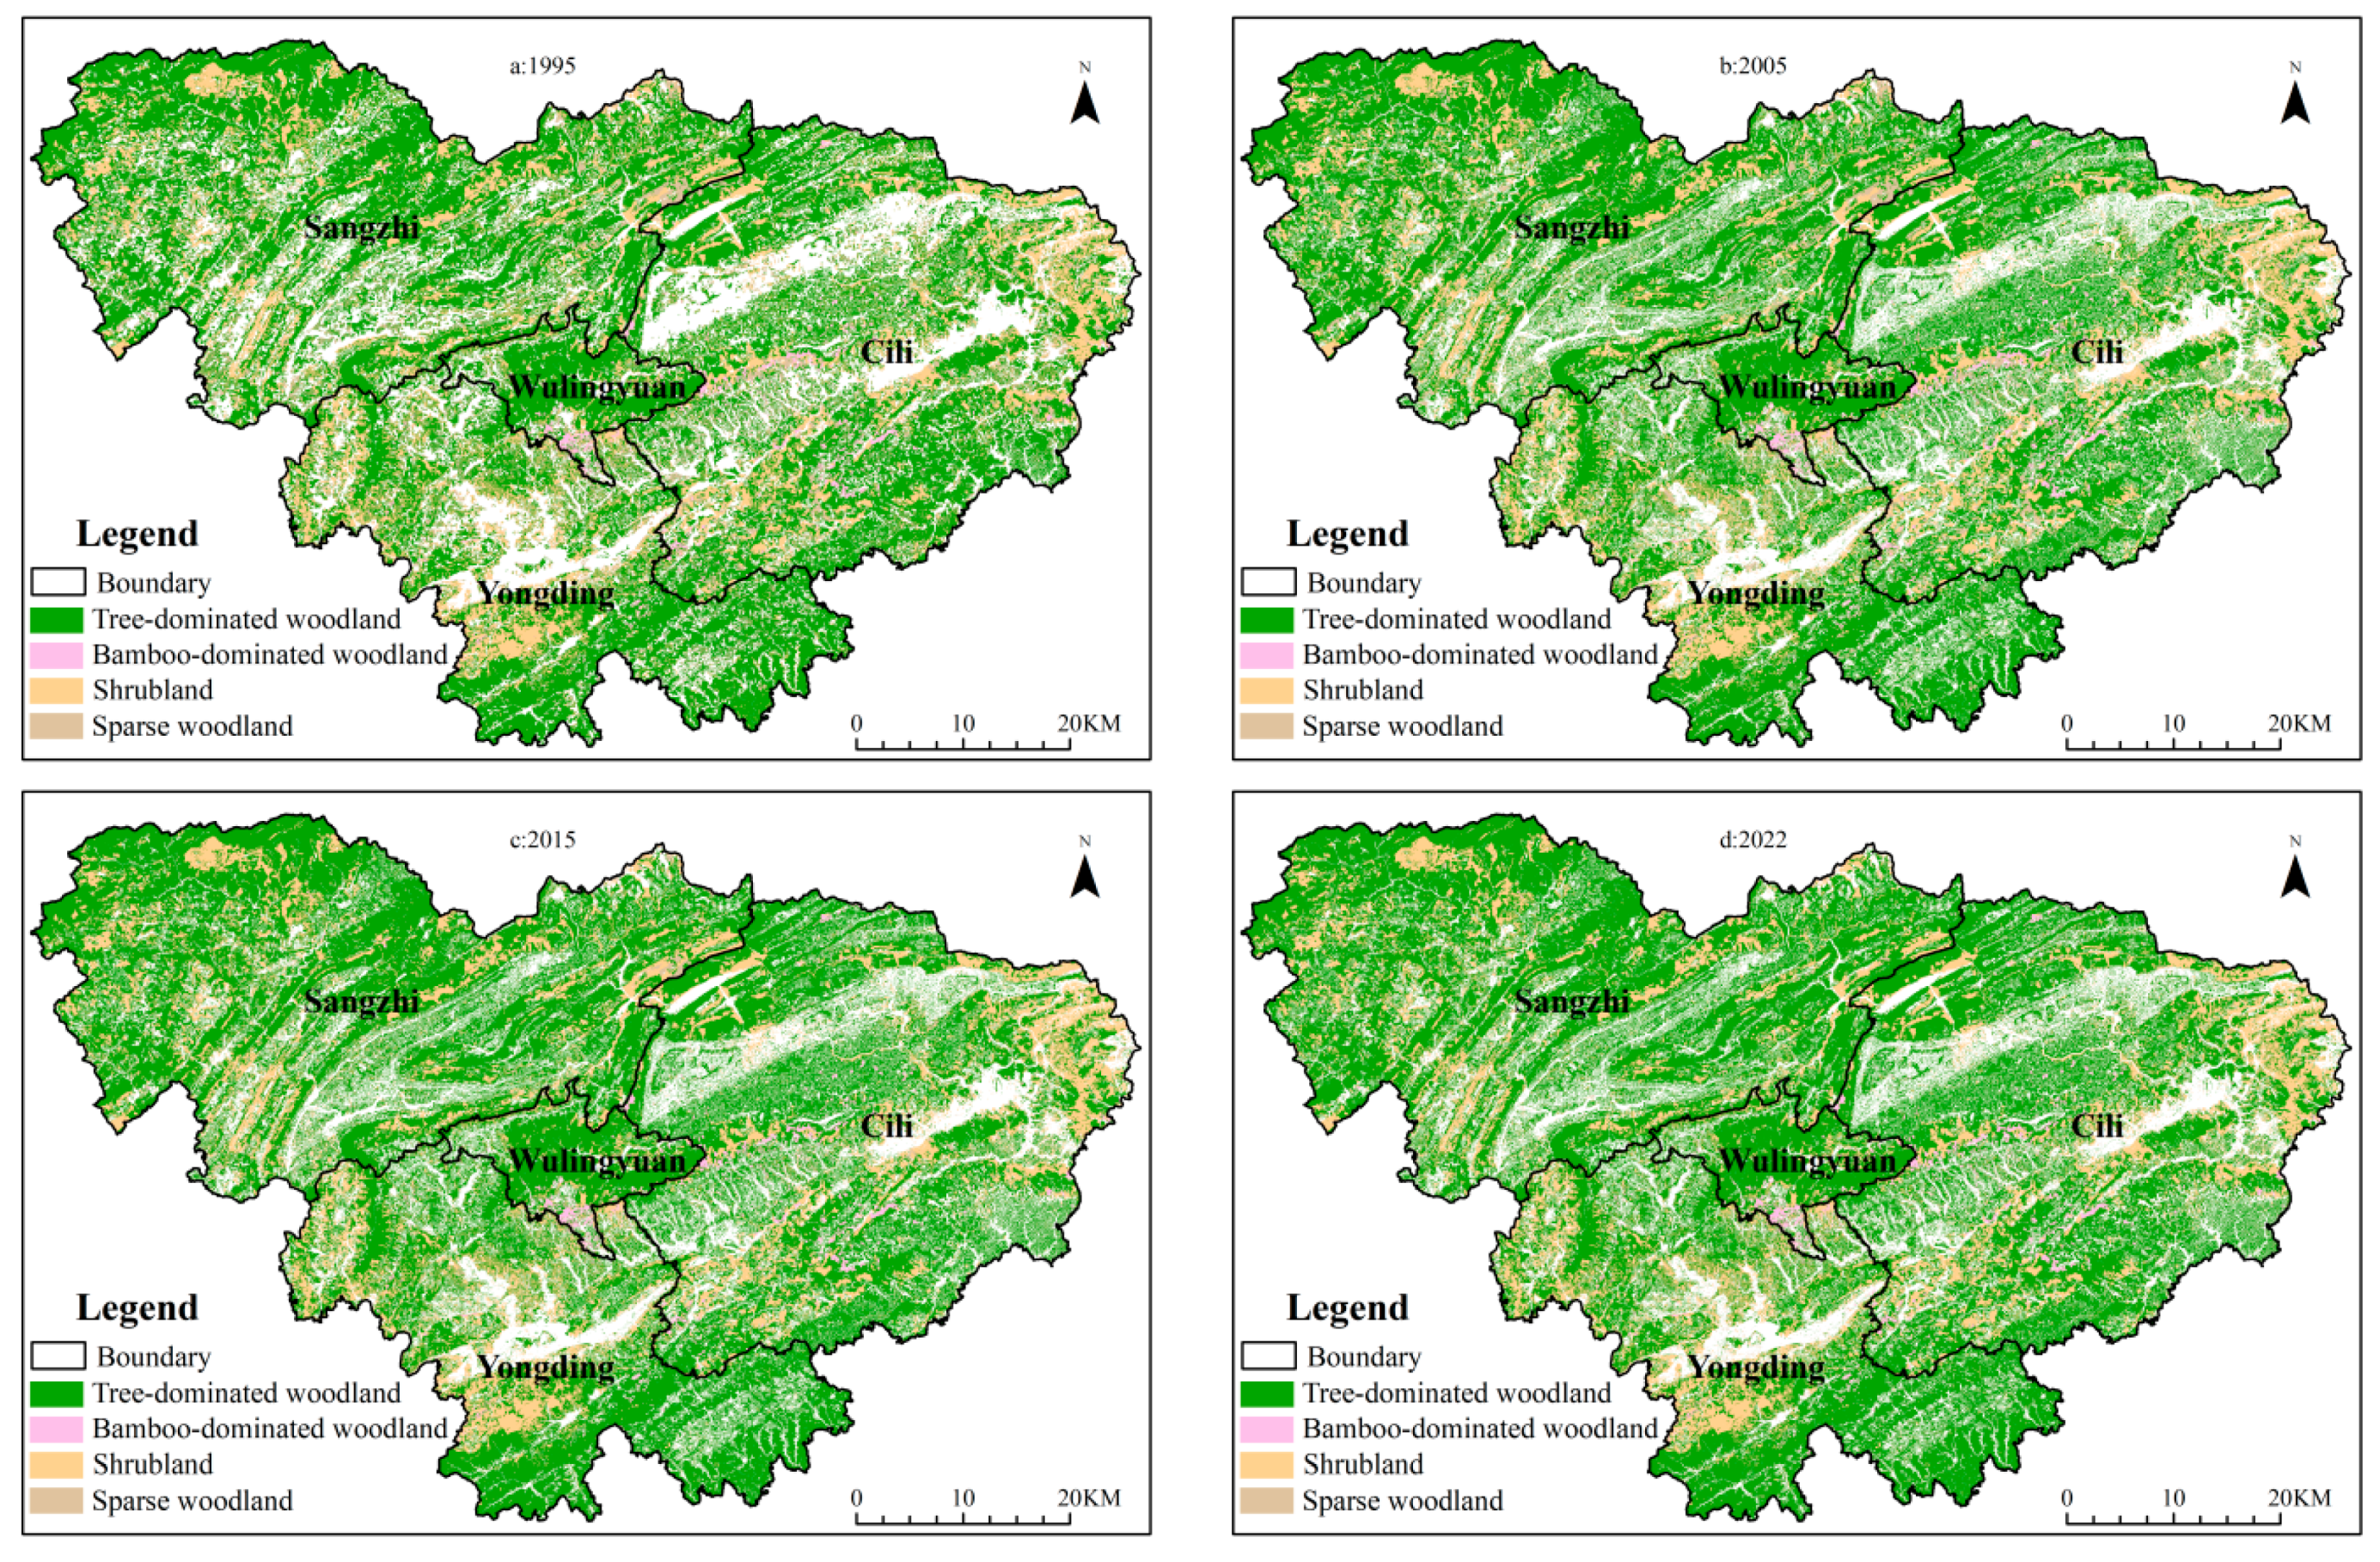
3.1. Analysis of Woodland-Use Changes
3.2. Analysis of Changes in Woodland Ecosystem Services
3.2.1. HQ
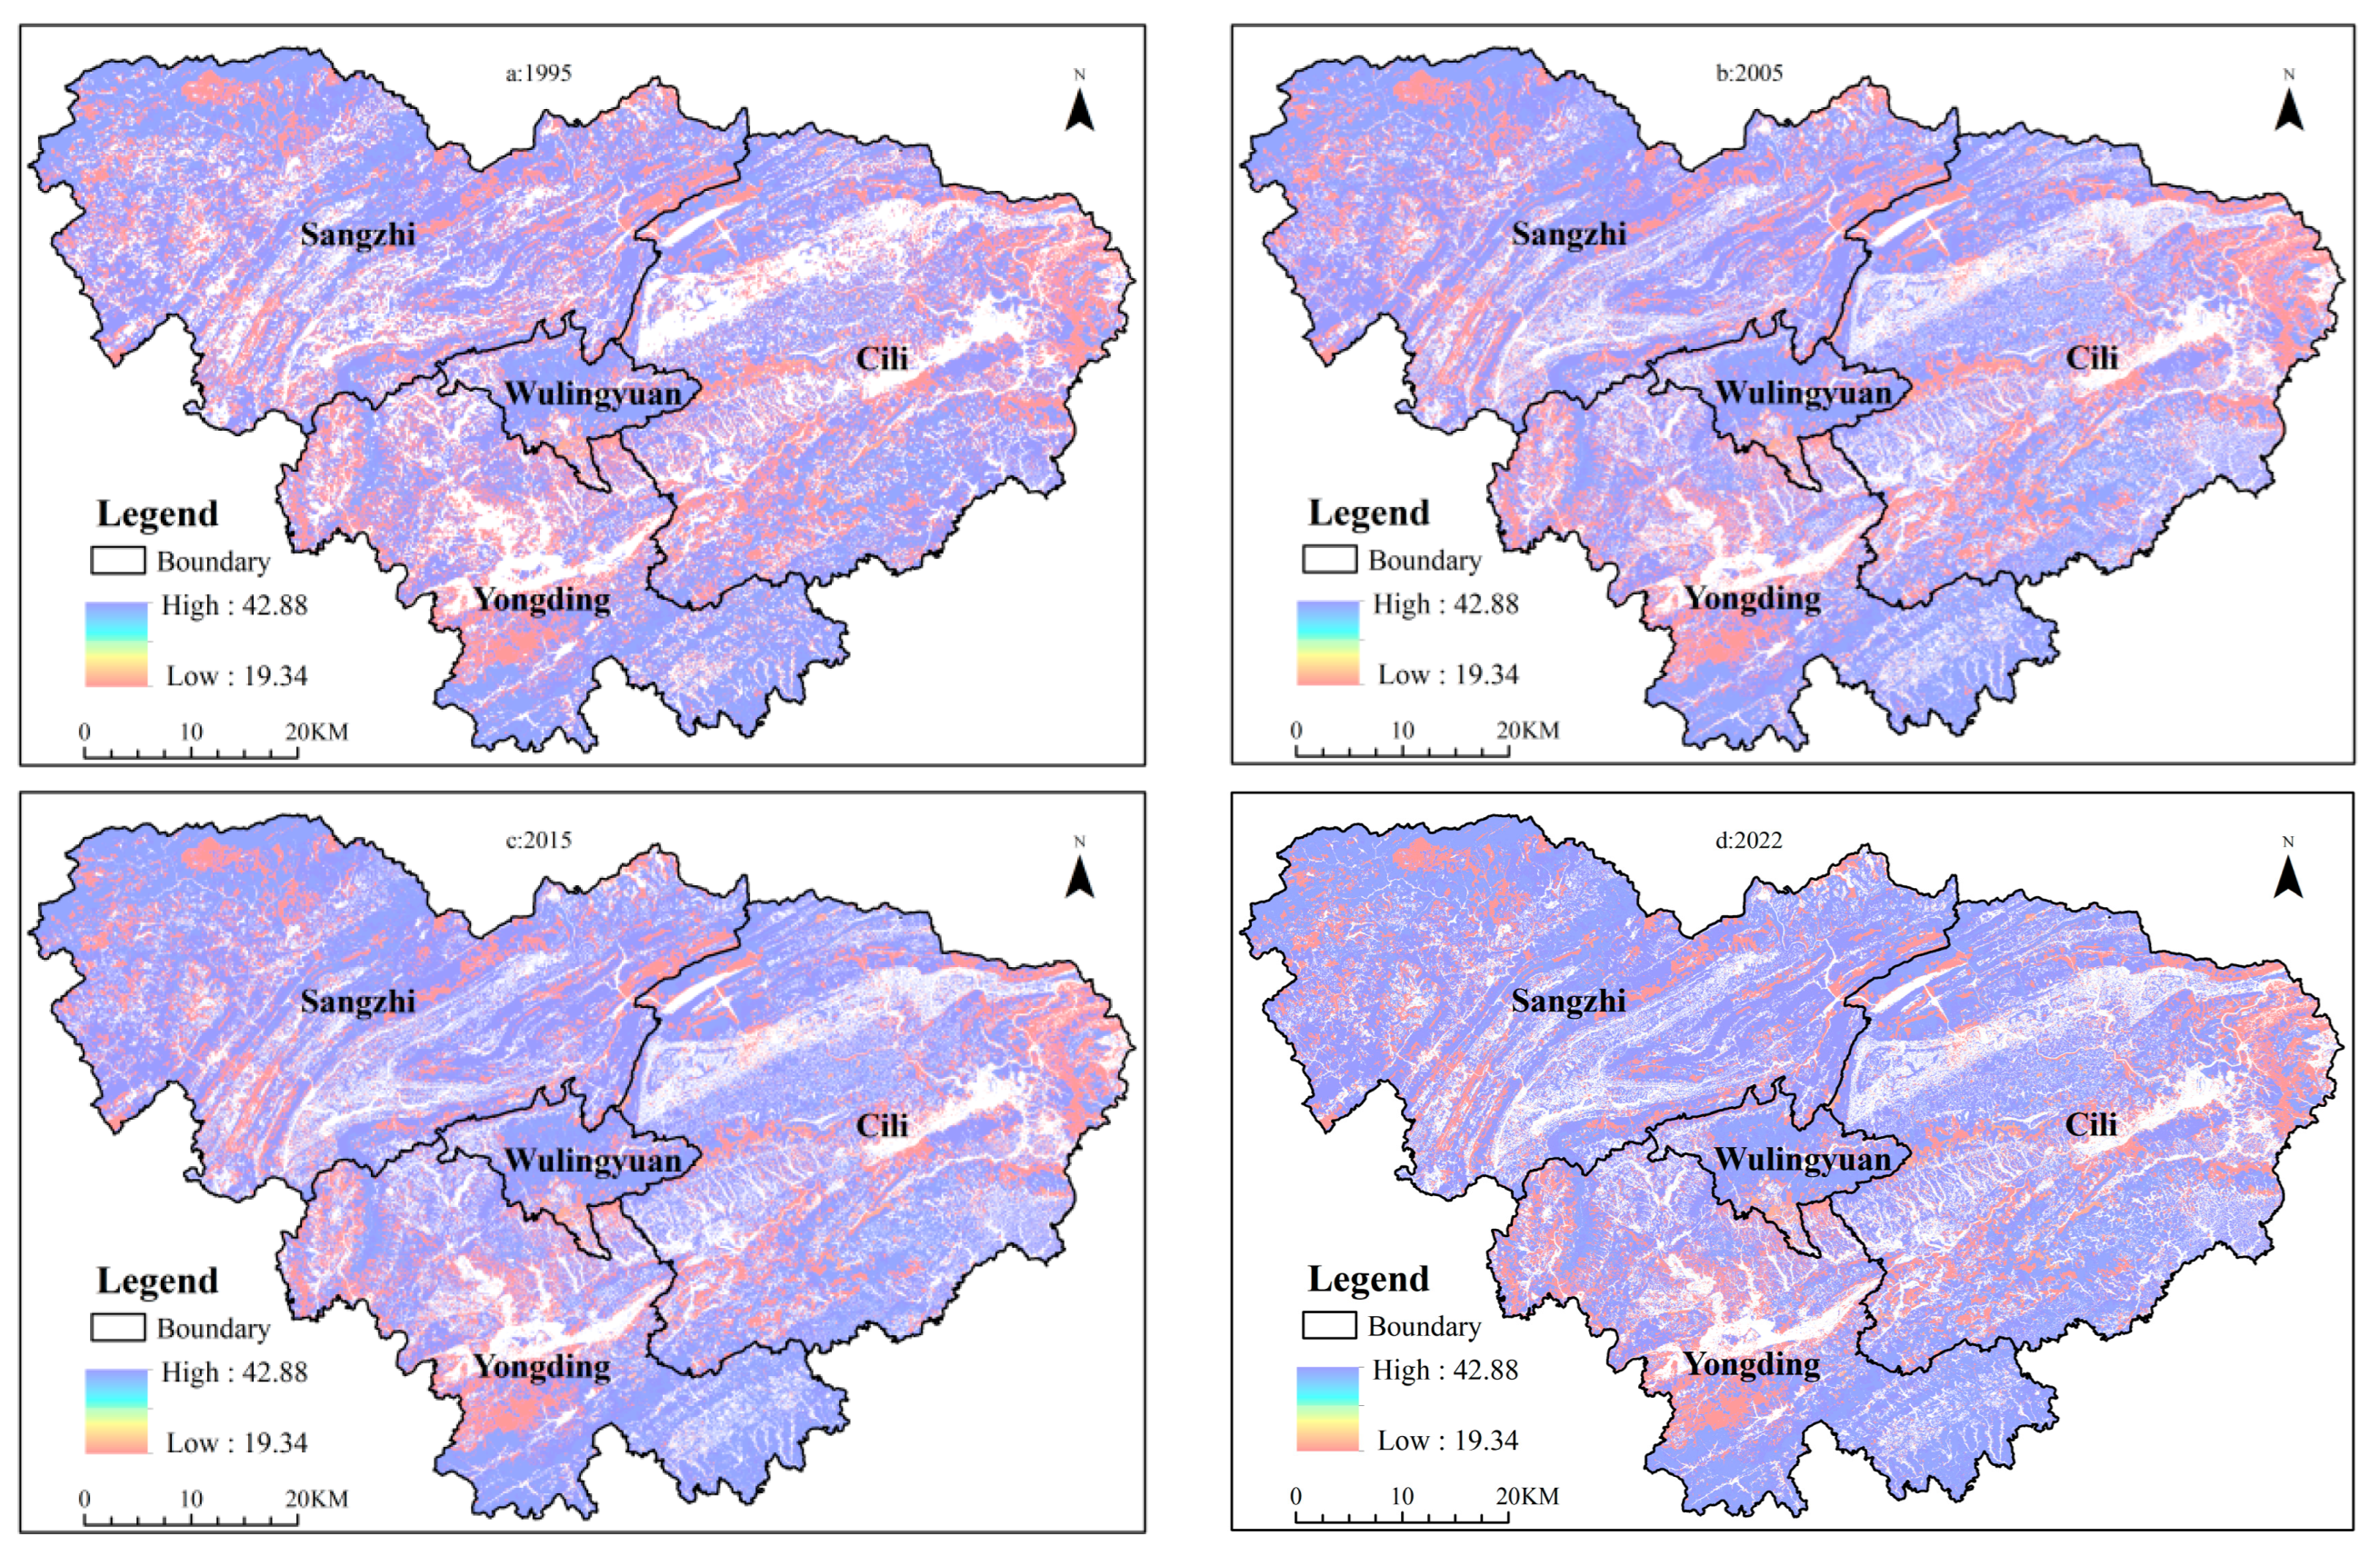
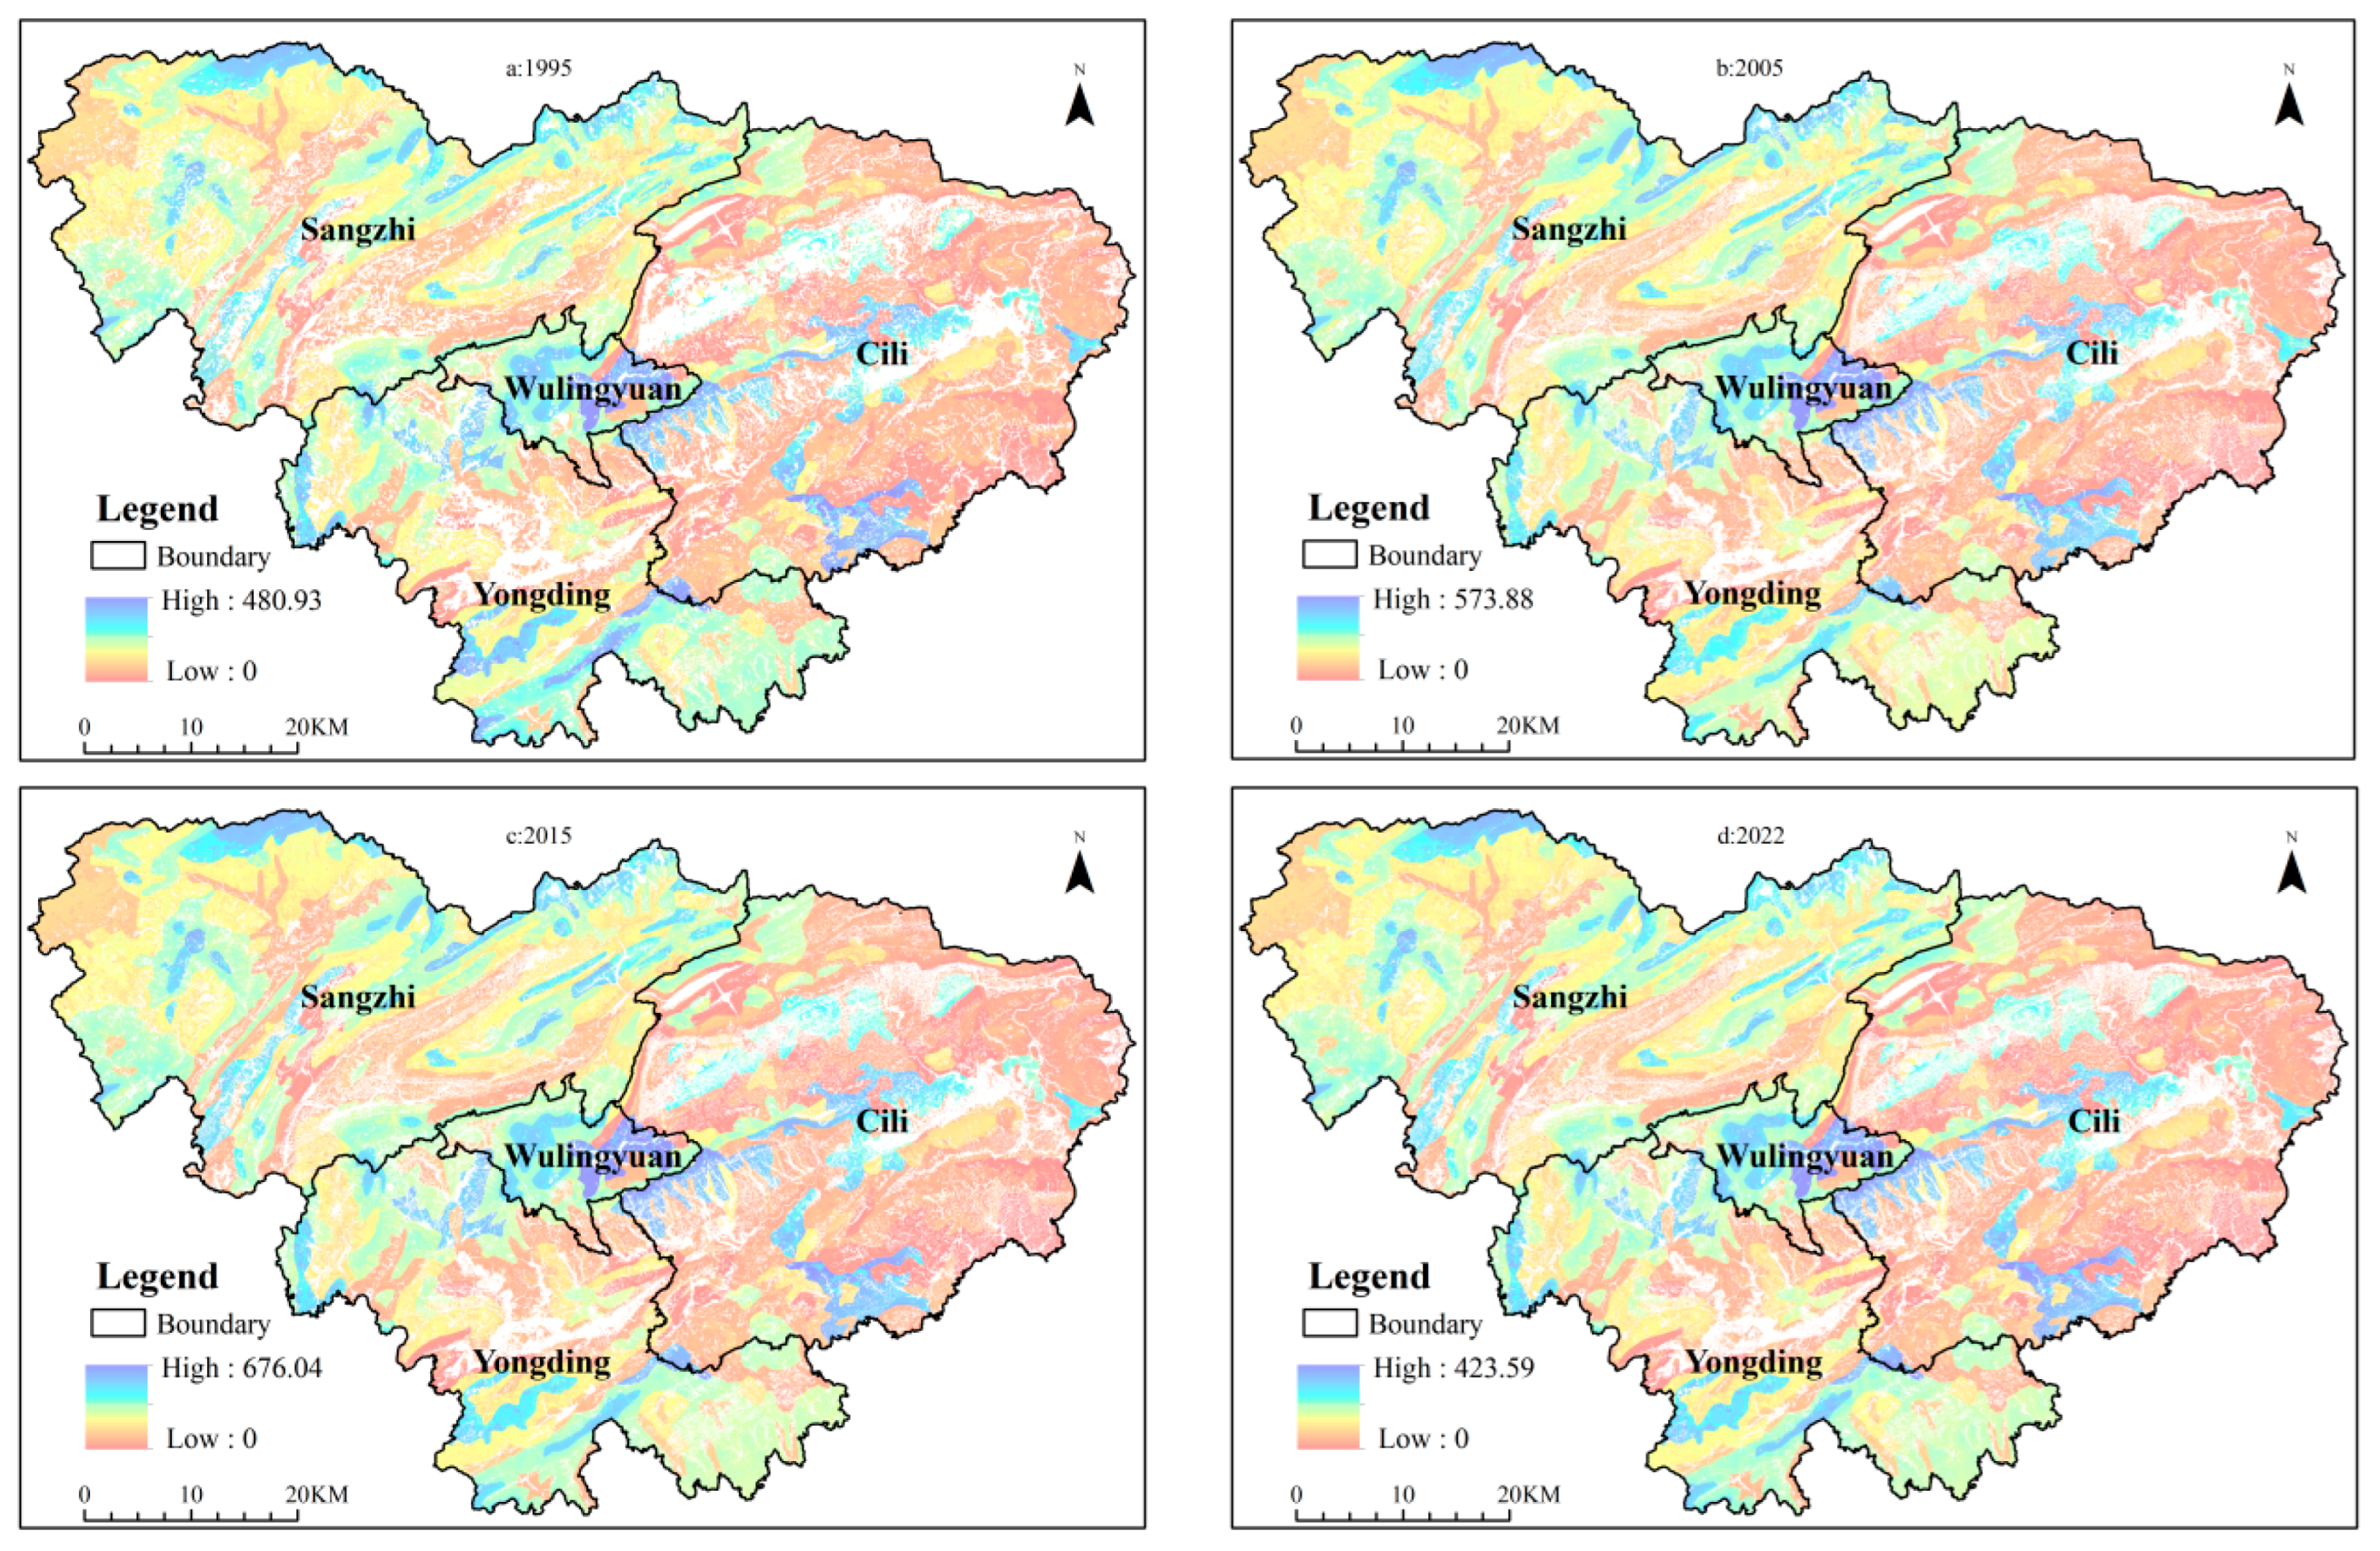
3.2.2. SC
3.2.3. CS
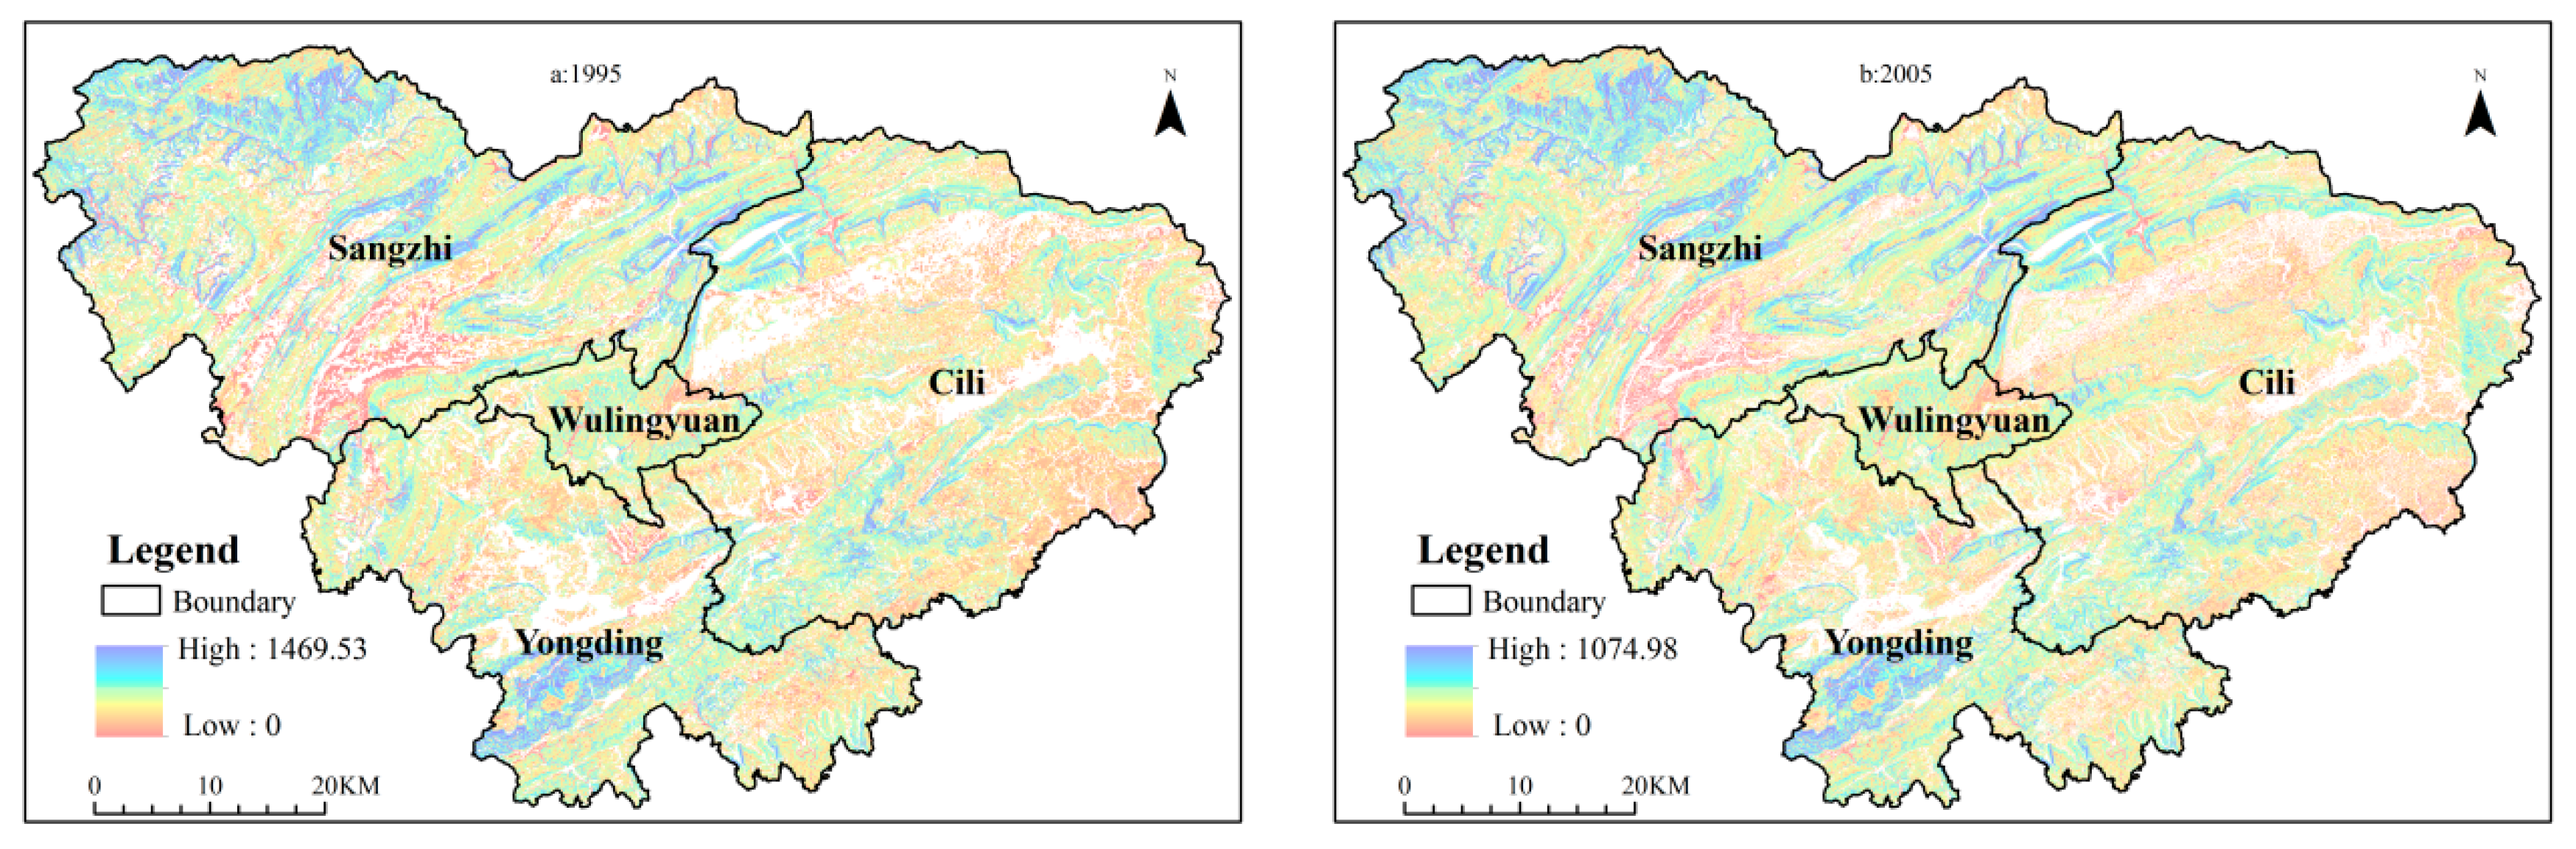
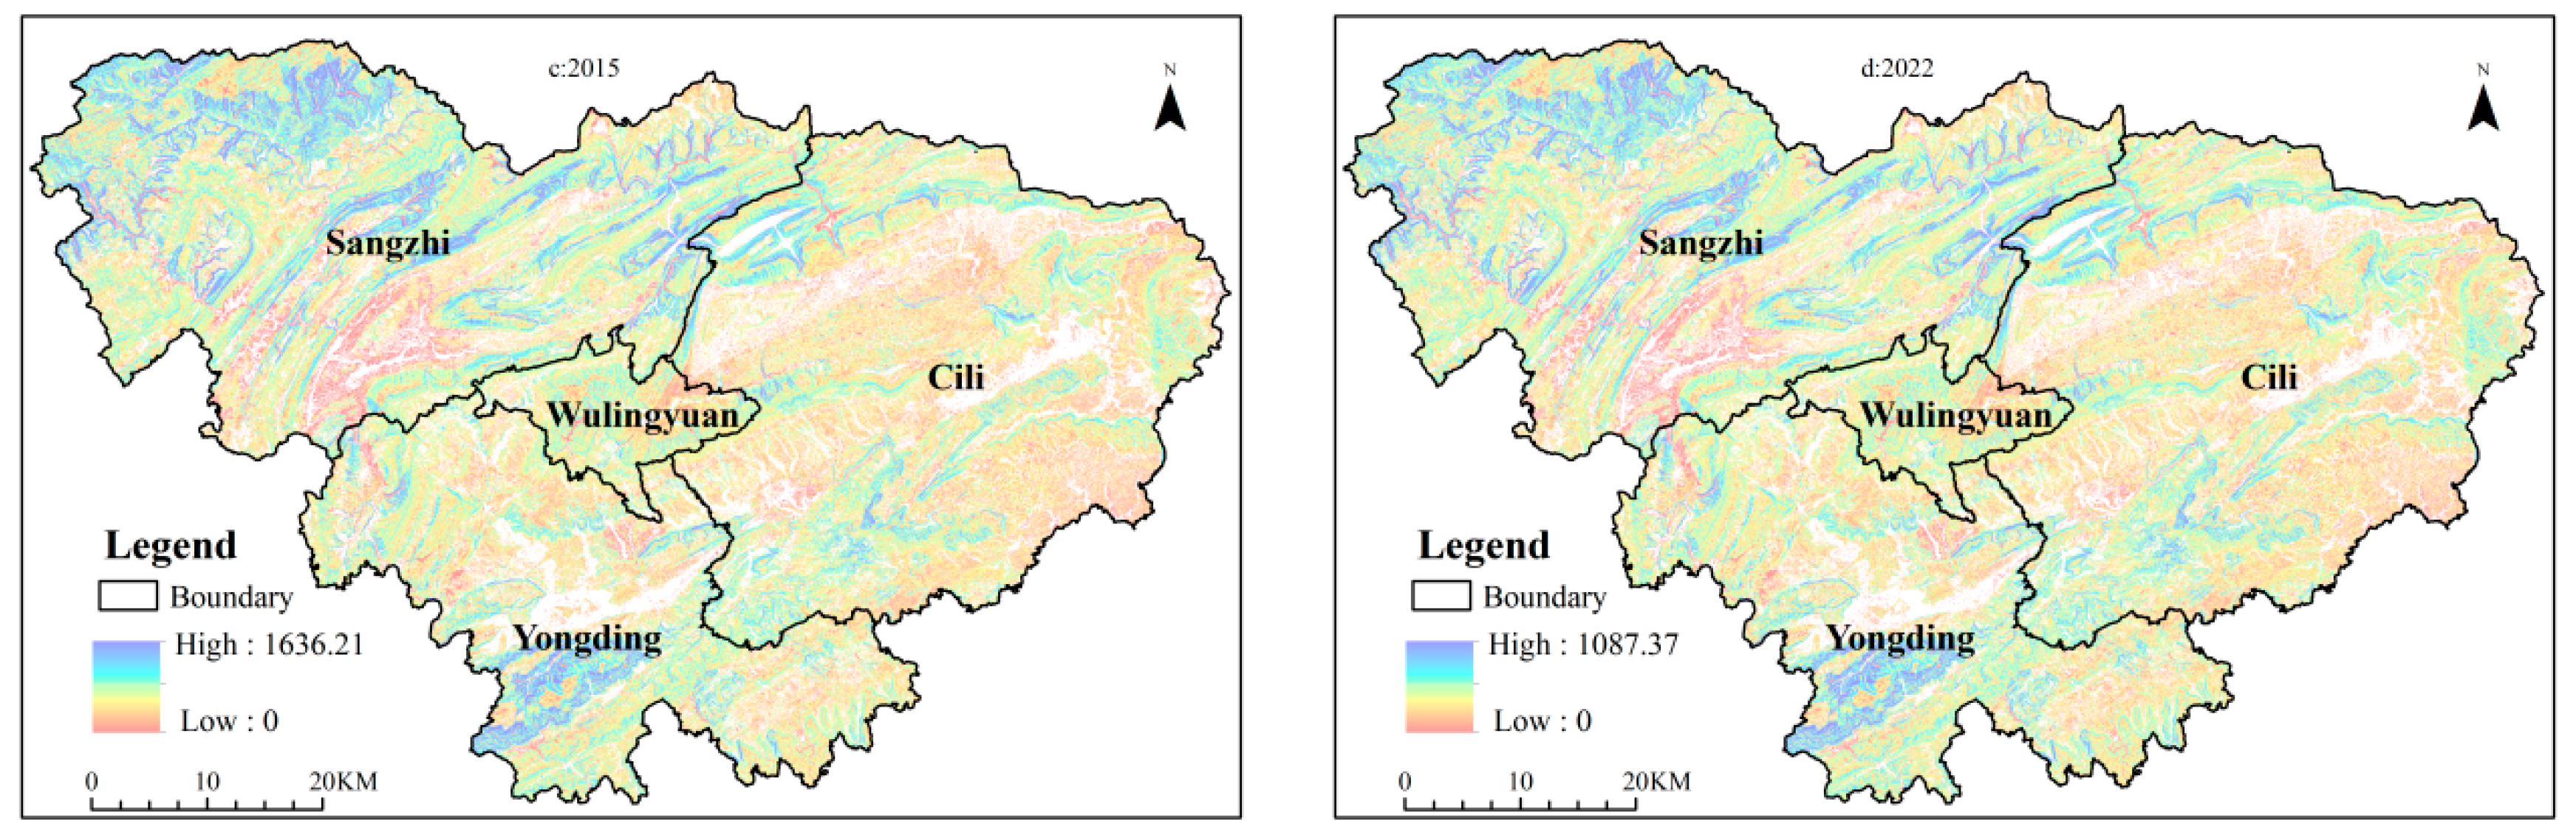
3.2.4. WC
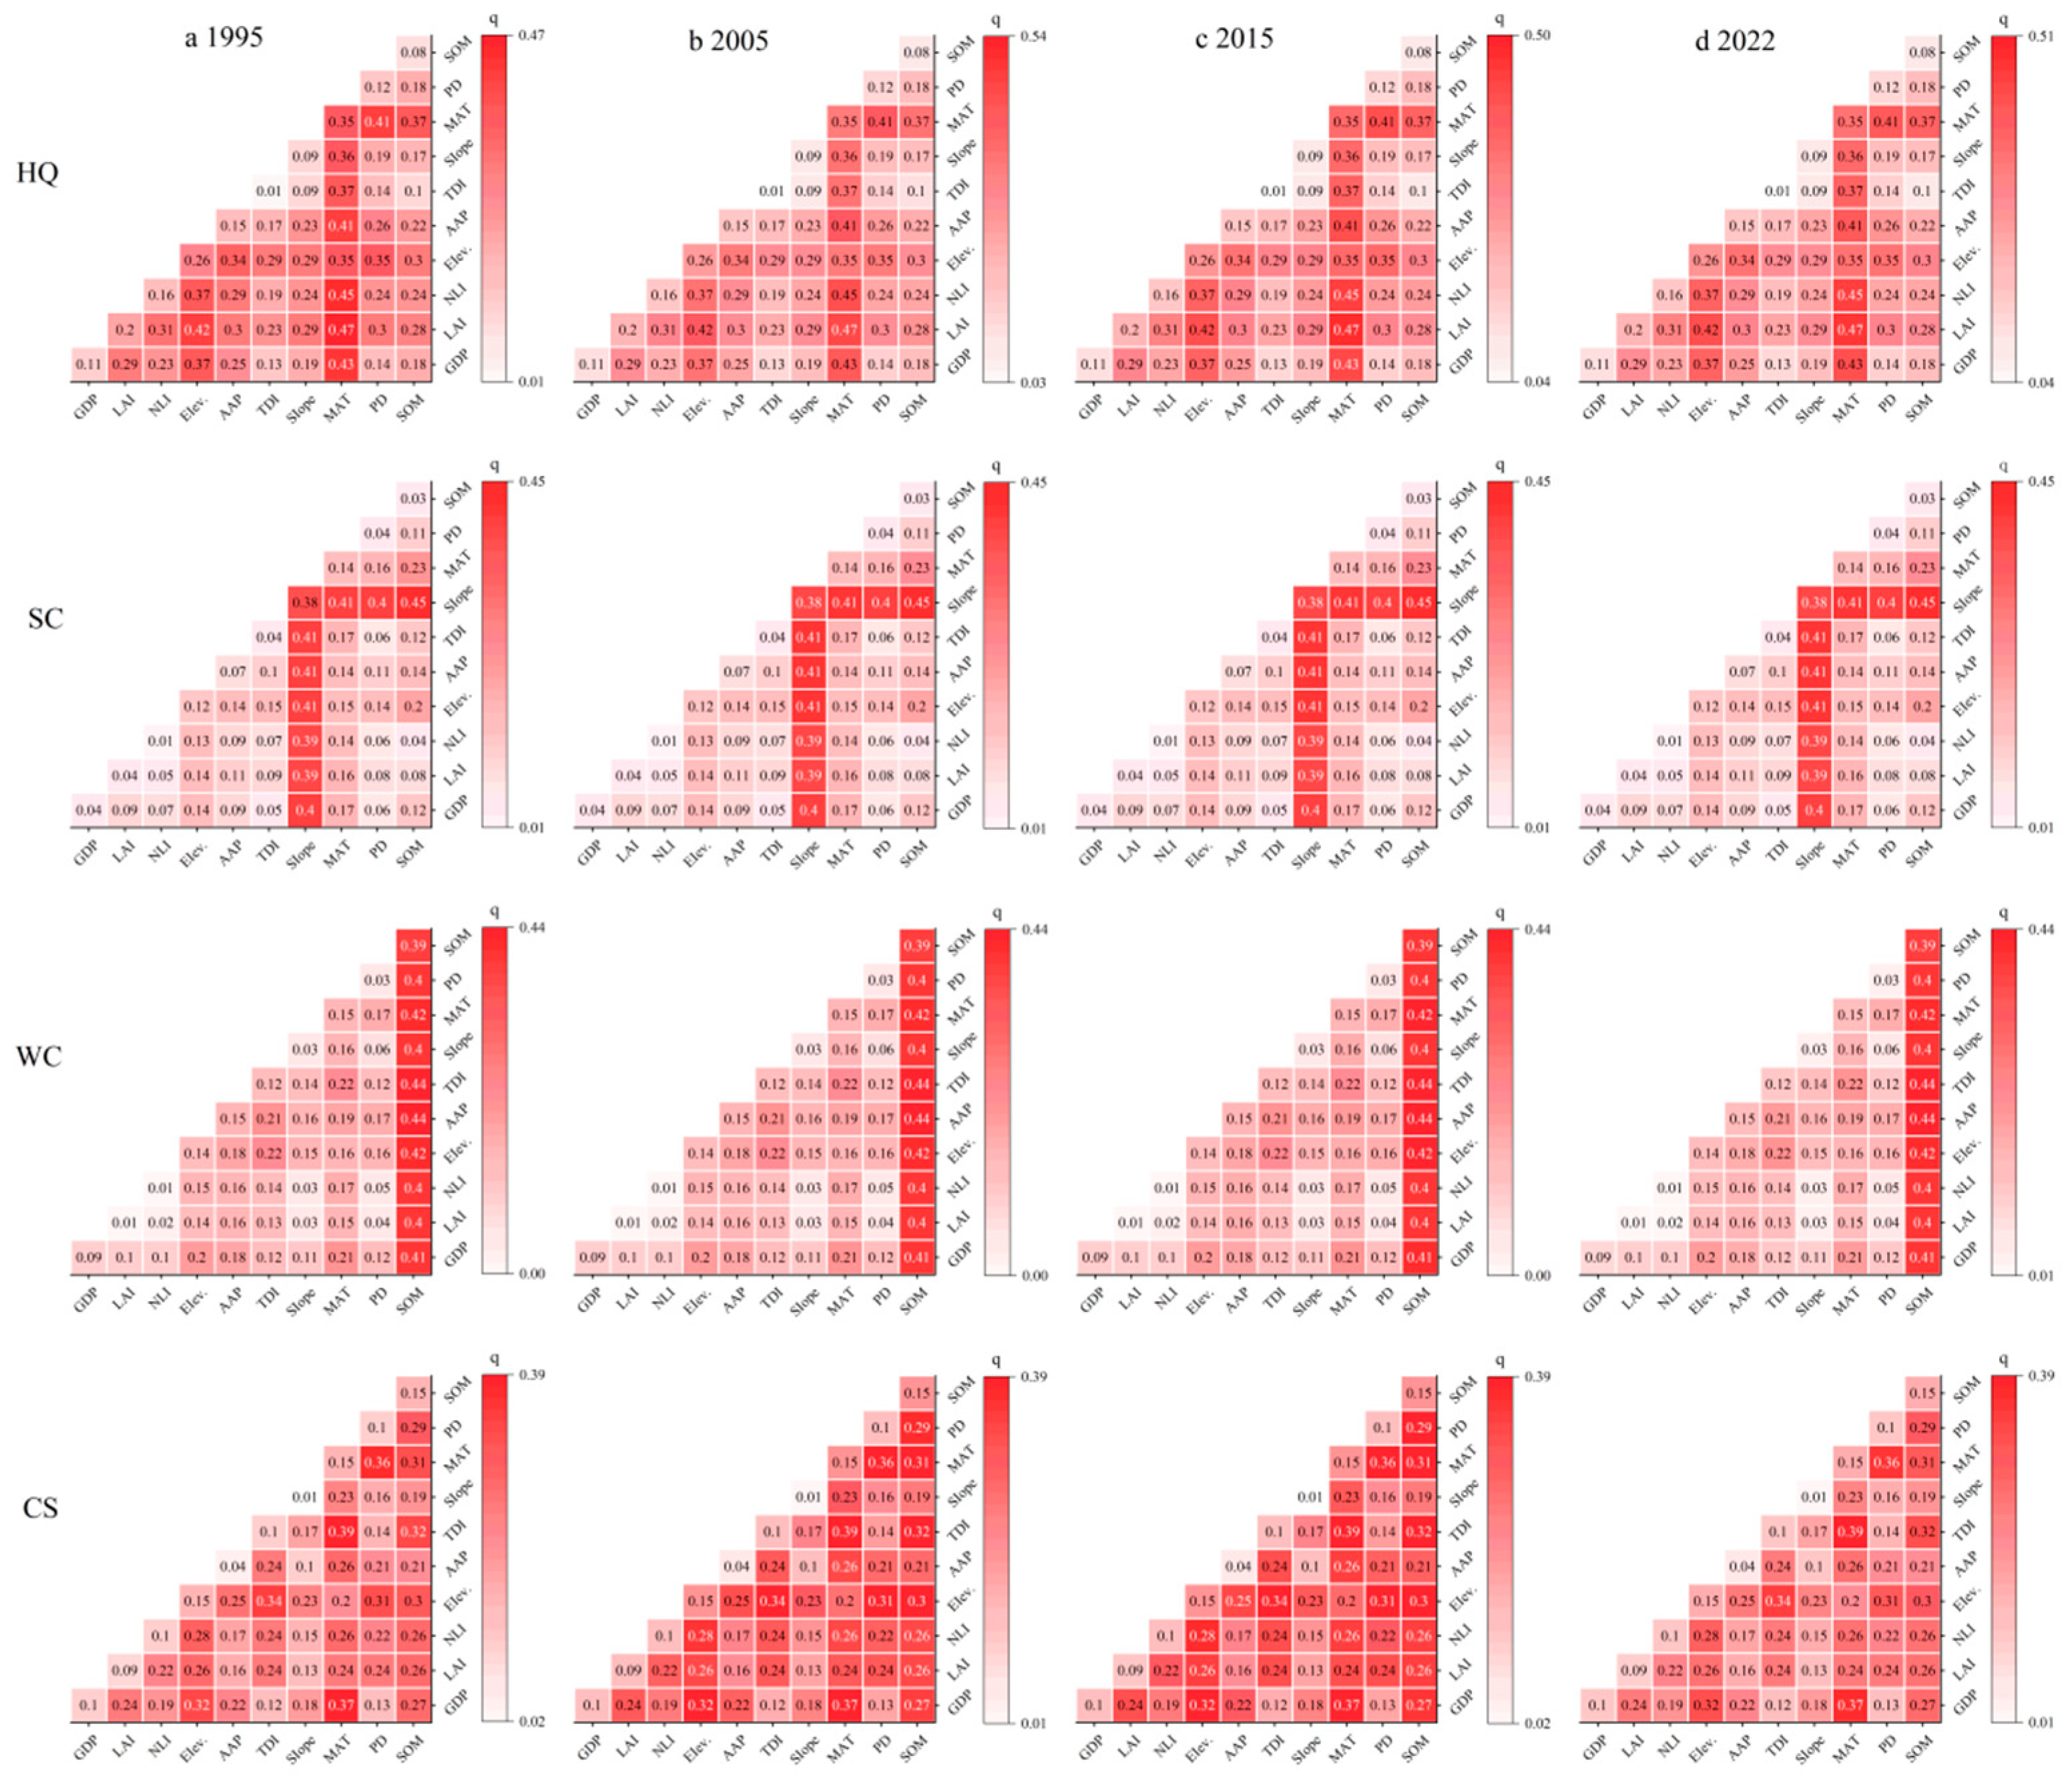
3.3. Analysis of Driving Factors for Woodland Ecosystem Services
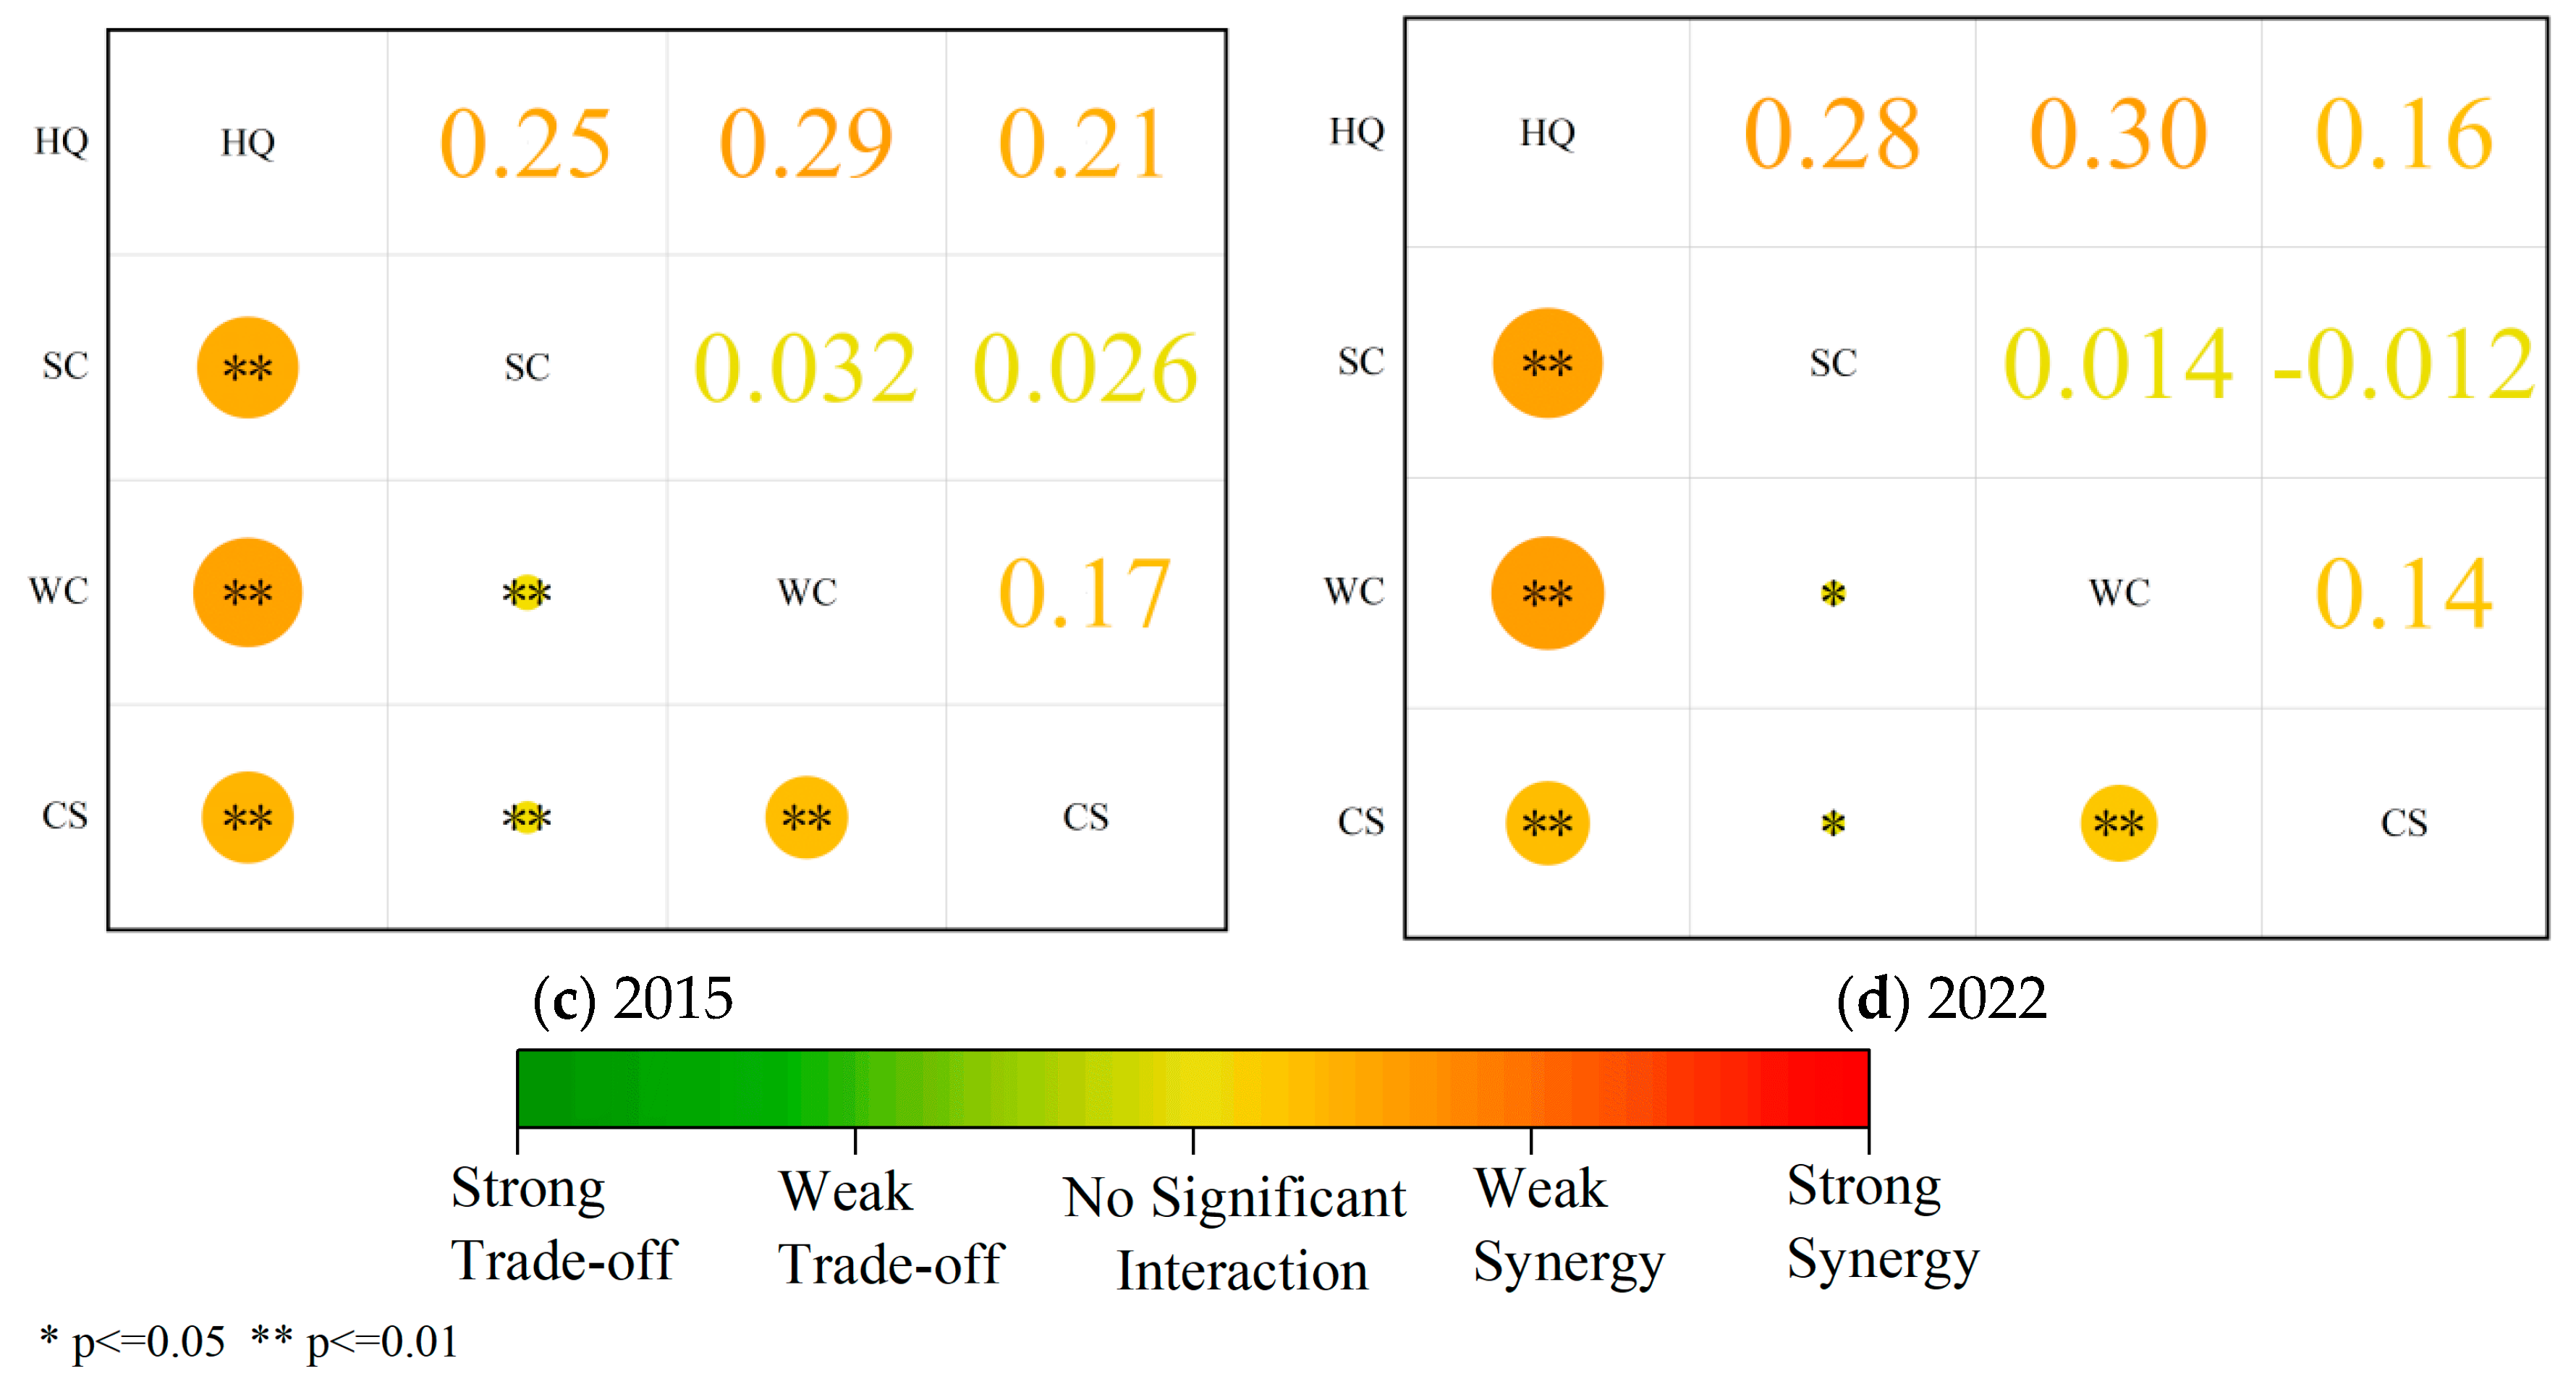
3.4. Trade-Off and Synergy Analysis of Woodland Ecosystem Services
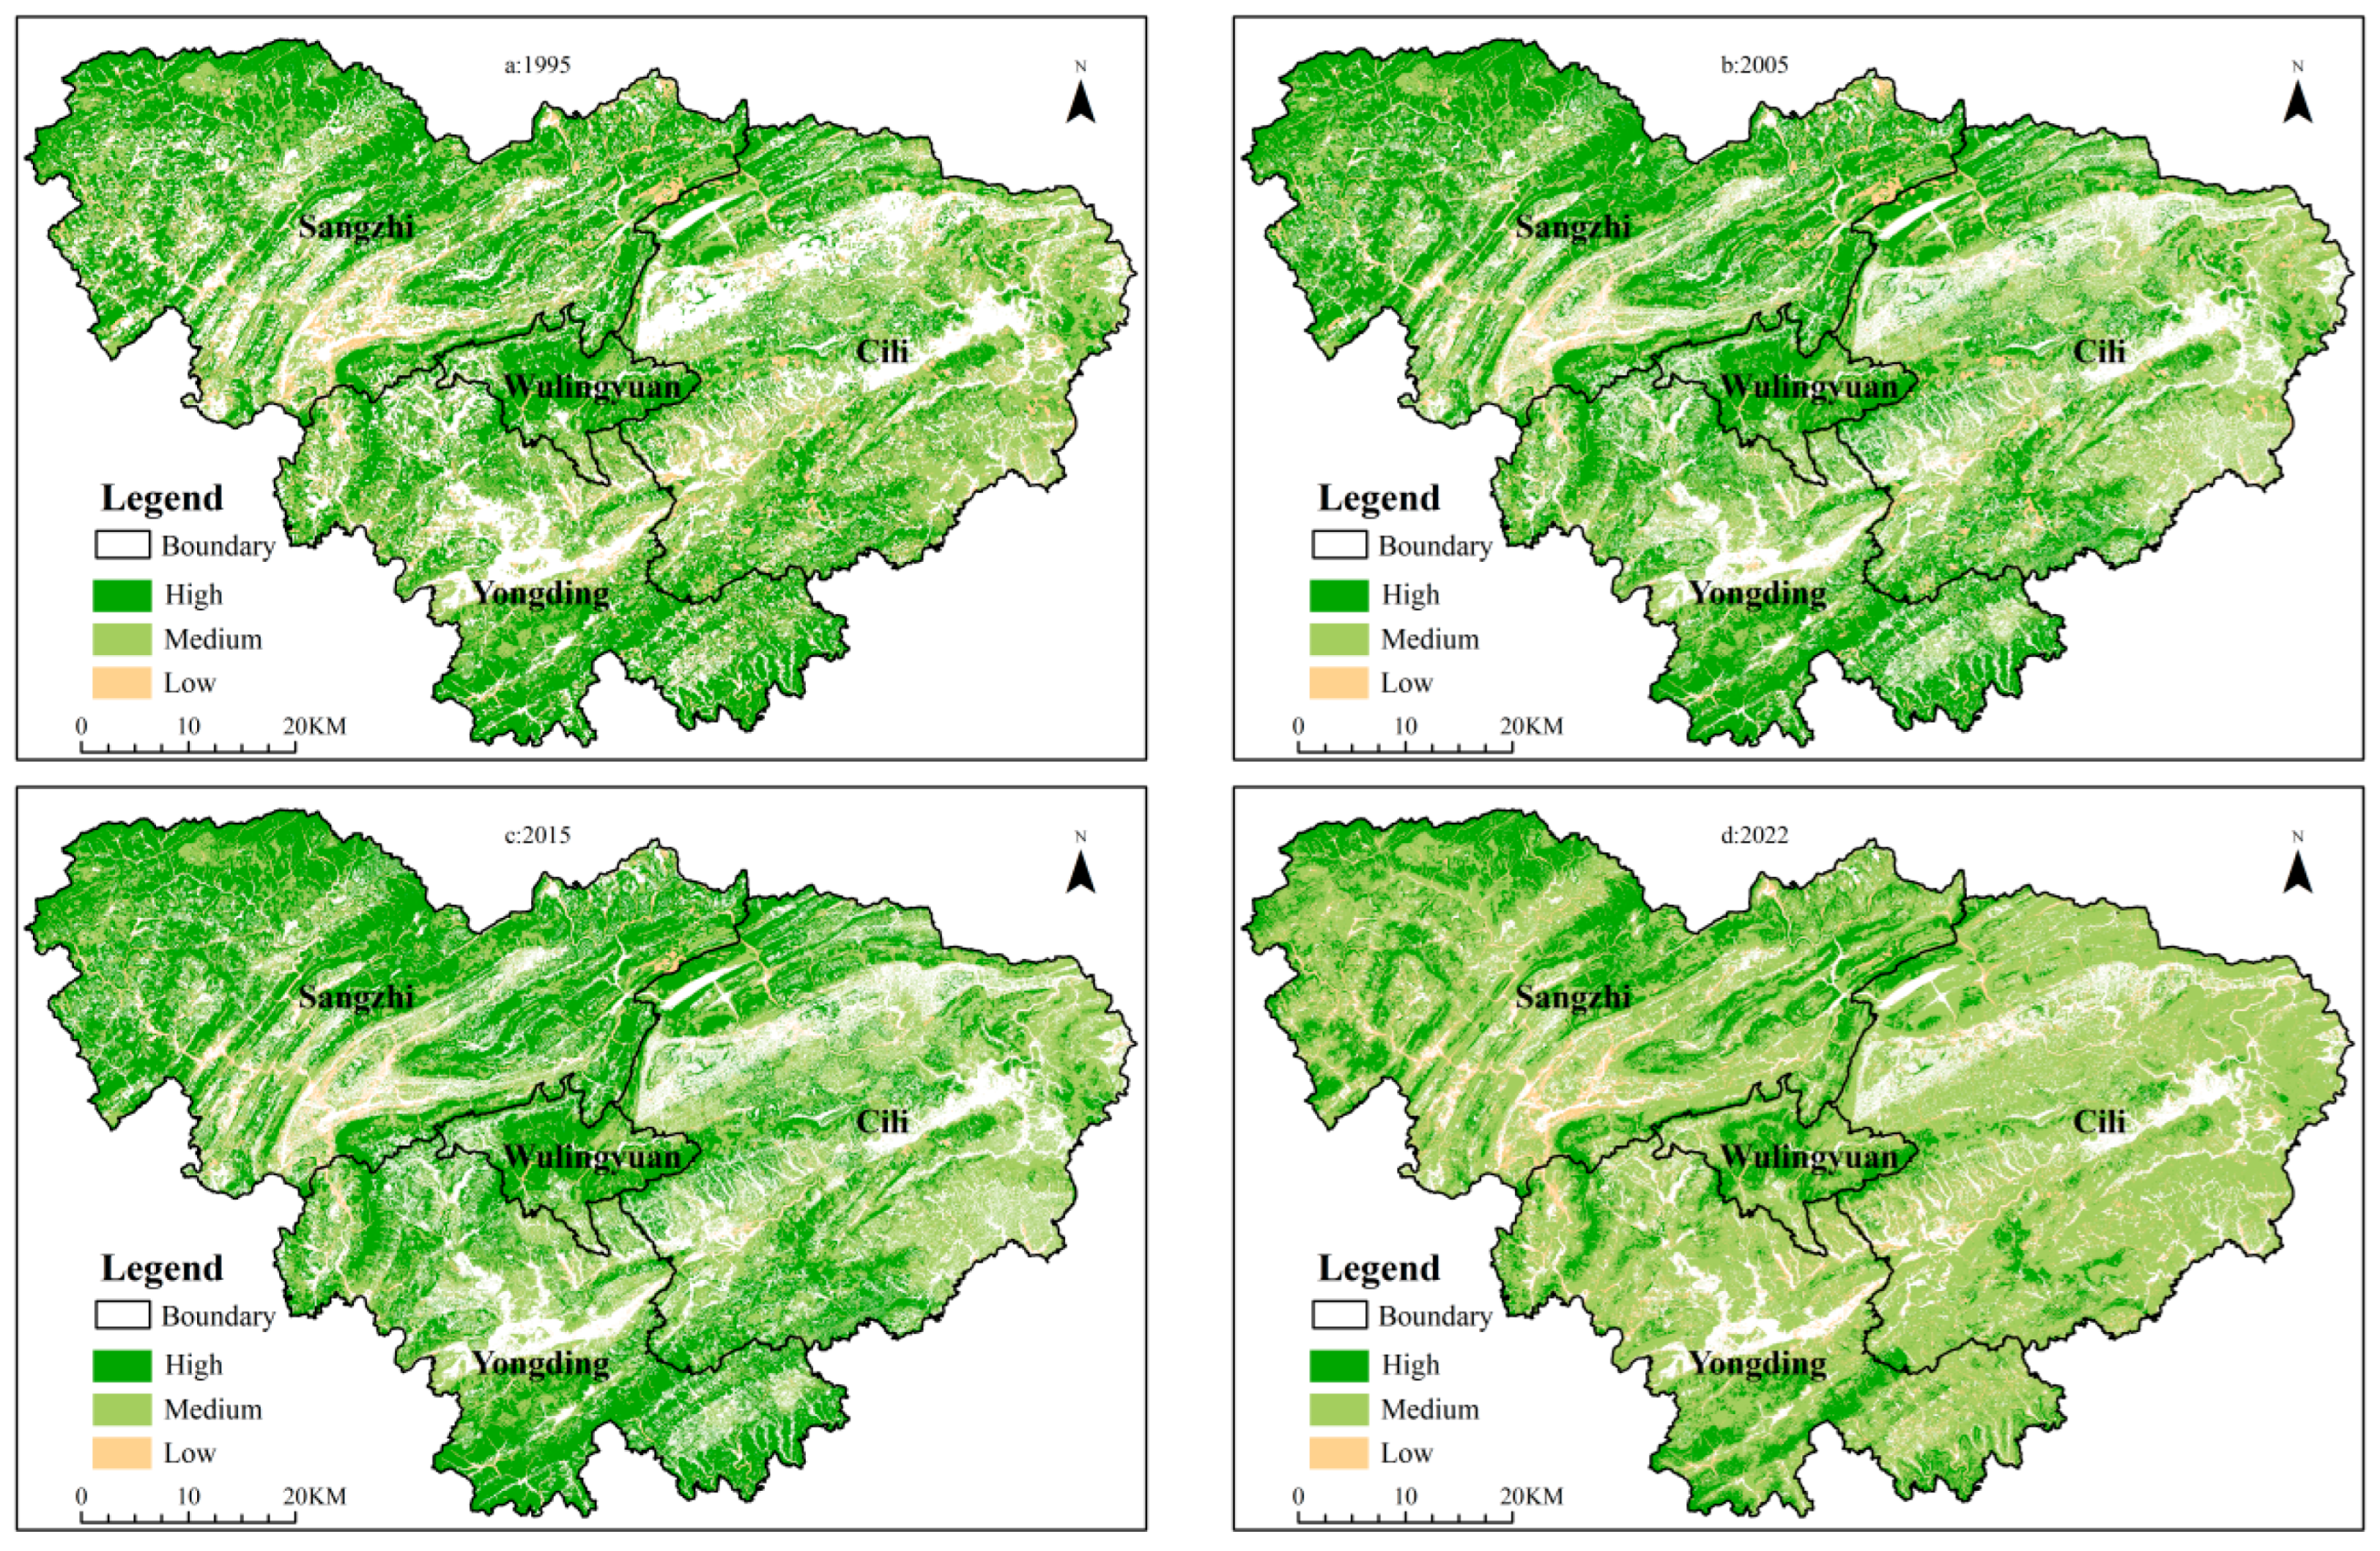
3.5. Coupling Coordination Analysis of Woodlan Ecosystem Services
4. Discussion
4.1. Driving Mechanisms of Dynamic Changes in Ecosystem Services
4.2. Temporal and Spatial Characteristics of Trade-Offs in Ecosystem Services
4.3. Limitations and Future Directions
4.4. Implications for Regional Sustainable Development
5. Conclusions
- During the study period, the area of tree-dominated woodland and bamboo-dominated woodland in Zhangjiajie City continuously increased, with cumulative growth of 623.89 km2 and 13.24 km2, respectively, primarily due to ecological protection policies such as mountain closure for afforestation and forest quality improvement. The reduction in shrubland and sparse woodland areas reflects human disturbances such as tourism development and urbanization.
- HQ declined significantly, with the area of medium-or-above HQ decreasing from 98.30% to 15.88%, mainly due to the influences of urbanization, transportation expansion, and tourism activities. Pilot habitat restoration can be carried out in places with better woodland quality, and key ecological protection points, ecological corridors, and other measures can be set up to improve HQ. SC showed fluctuating changes, with high-value areas being concentrated in mountainous regions such as Sangzhi County and Yongding District. Measures such as the management of spatial zoning, optimizing vegetation structure, implementing engineering facilities control, and innovating the system of ecological compensation and community co-governance can enhance the SC capacity. WC peaked in 2015 and then declined, with 2022 being the worst; this is linked to reduced precipitation, increased evapotranspiration, and changes in surface cover due to tourism development. To improve the WC capacity of woodland, it is also possible to start from spatial zoning control, optimization of the vegetation structure, and the management of litter and implement engineering measures. CS increased continuously, with high-value and low-value areas being highly correlated with different woodland types. Mixed coniferous–broadleaf forests had the highest CS per unit area (4.76 × 10⁴ tons/km2). The enhancement approach is similar to other ecosystem services.
- HQ showed weak synergy with WC, SC, and CS, indirectly enhancing ecological functions through vegetation cover and biodiversity. In 2022, SC and CS shifted to a weak trade-off, reflecting the conflict between climate change (reduced precipitation) and short-term ecological restoration. The synergistic effect of WC and CS is weakened. The synergistic relationship of woodland ecosystem services can be promoted by implementing differentiated remediation strategies, climate-adaptive management, and strengthening policy synergy and community participation.
- Natural factors (MAT, AAP, Elev., slope) are the fundamental drivers, while socioeconomic factors (TDI, NLI) have weaker influences. The strengthening of interactions indicates that the combined effects of natural and anthropogenic factors require focused attention. Climate-adaptive design should be prioritized in woodland ecological conservation and management. We strictly implement the management of Three Zones and Three Lines and promote the model of eco-tourism.
- The overall coupling coordination of the four ecosystem services was good, but in 2022, high-value areas decreased significantly, and medium-value areas increased substantially, indicating a higher risk of declining coupling coordination. There is a need to strengthen cross-sectoral collaborative governance and public participation to achieve a balance between ecological security and sustainable development.
Author Contributions
Funding
Institutional Review Board Statement
Informed Consent Statement
Data Availability Statement
Conflicts of Interest
Abbreviations
| HQ | Habitat quality |
| SC | Soil conservation |
| WC | Water conservation |
| CS | Carbon storage |
| InVEST | Integrated valuation of ecosystem services and tradeoffs |
| NDVI | Normalized difference vegetation index |
| AWC | Available water content |
| PET | Potential evapotranspiration |
| DEM | Digital elevation model |
| LULC | Land use and land cover |
| MAT | Mean annual temperature |
| AAP | Annual average precipitation |
| Elev. | Elevation |
| LAI | Leaf area index |
| SOM | Soil organic matter |
| GDP | Gross domestic product |
| PD | Population density |
| NLI | Nighttime light index |
| TDI | Tourism dependency index |
References
- Jin, X.; Fang, D.; Chen, B.; Wang, H. Multiobjective layout optimization for low impact development considering its ecosystem services. Resour. Conserv. Recycl. 2024, 209, 107794. [Google Scholar] [CrossRef]
- Romanazzi, R.G.; Palmisano, O.G.; Cioffi, M.; Leronni, V.; Toromani, E.; Koto, R.; Boni, A.D.; Acciani, C.; Roma, R.A. Cost—Benefit Analysis for the Economic Evaluation of Ecosystem Services Lost Due to Erosion in a Mediterranean River Basin. Land 2024, 13, 1512. [Google Scholar] [CrossRef]
- Altuwaijri, A.H.; Kafy, A.A.; Rahaman, A.Z. Multi-temporal remote sensing and geospatial analysis for urban ecosystem service dynamics: A three-decade assessment of land surface transformation in Jeddah, Saudi Arabia. Phys. Chem. Earth 2025, 139, 103892. [Google Scholar] [CrossRef]
- Daily, G.C. Nature’s Services: Societal Dependence on Natural Ecosystems; Island Press: Washington, DC, USA, 1997. [Google Scholar]
- Costanza, R.; d’Arge, R.; Groot, R.d.; Farber, S.; Grasso, M.; Hannon, B.; Limburg, K.; Naeem, S.; O’Neill, R.V.; Paruelo, J.; et al. The value of the world’s ecosystem services and natural capital. Nature 1997, 387, 253–260. [Google Scholar] [CrossRef]
- MA (Millennium Ecosystem Assessment). Ecosystems and Human Well-Being: Synthesis; Island Press: Washington, DC, USA, 2005. [Google Scholar]
- Rodríguez, P.J.; Beard, D.T.J.; Bennett, E.M.; Cumming, G.S.; Cork, S.J.; Agard, J.; Dobson, A.P.; Peterson, G.D. Trade-offs across Space, Time, and Ecosystem Services. Ecol. Soc. 2006, 11, 28. [Google Scholar] [CrossRef]
- Fu, B.; Yu, D. Trade-off analyses and synthetic integrated method of multiple ecosystem services. Resour. Sci. 2016, 38, 1–9. [Google Scholar]
- Soto, R.J.; Escobedo, J.F.; Khachatryan, H.; Adams, D.C. Consumer demand for urban forest ecosystem services and disservices: Examining trade-offs using choice experiments and best-worst scaling. Ecosyst. Serv. 2018, 29, 31–39. [Google Scholar] [CrossRef]
- Jian, P.; Pei, X.; Yanxu, L.; Zihan, X.; Huining, Z.; Tianhan, L.; Shuying, Y. Ecosystem services research: From golden era to next crossing. Trans. Earth Environ. Sustain. 2023, 1, 9–19. [Google Scholar]
- Bennett, E.M.; Peterson, G.D.; Gordon, L.J. Understanding relationships among multiple ecosystem services. Ecol. Lett. 2009, 12, 1394–1404. [Google Scholar] [CrossRef]
- Power, A.G. Ecosystem services and agriculture: Tradeoffs and synergies. Philos. Trans. R. Soc. London. Ser. B Biol. Sci. 2010, 365, 2959–2971. [Google Scholar] [CrossRef]
- Lovrić, M.; Torralba, M.; Orsi, F.; Pettenella, D.; Mann, C.; Geneletti, D.; Plieninger, T.; Primmer, E.; Hernandez-Morcillo, M.; Thorsen, B.J.; et al. Mind the income gap: Income from wood production exceed income from providing diverse ecosystem services from Europe’s forests. Ecosyst. Serv. 2025, 71, 101689. [Google Scholar] [CrossRef]
- Faria, B.; Nunes, P.J.; Baartman, E.J.; Dias, L.; Wu, J.; Prats, S.A. Assessing cost-effectiveness of land management measures to restore forest ecosystem services after fire using hydrological modelling and multi-criteria decision analysis. Catena 2025, 251, 108808. [Google Scholar] [CrossRef]
- Toriyama, J.; Hashimoto, S.; Nakao, K.; Saitoh, T.M.; Nishzono, T.; Uchiyama, K.; Araki, M.G.; Murakami, W.; Hirata, Y. Management strategies for shrinking and aging tree plantations are constrained by the synergies and trade-offs between carbon sequestration and other forest ecosystem services. J. Environ. Manag. 2025, 373, 123762. [Google Scholar] [CrossRef]
- Renó, V.; Novo, E.; Escada, M. Forest Fragmentation in the Lower Amazon Floodplain: Implications for Biodiversity and Ecosystem Service Provision to Riverine Populations. Remote Sens. 2016, 8, 886. [Google Scholar] [CrossRef]
- Istanbuly, N.M.; Binesh, A.; Amiri, J.D.; Parsa, V.A.; Amiri, B.J. Unveiling the threshold in forest patch shapes to soil retention ecosystem services. J. Environ. Manag. 2024, 368, 122188. [Google Scholar] [CrossRef] [PubMed]
- Soumik, S.; Biswajit, B.; Pravat, S.K.; Sumana, B.; Debashish, S.; Nairita, S.; Paetha, P.A. Recurrent forest fires, emission of atmospheric pollutants (GHGs) and degradation of tropical dry deciduous forest ecosystem services. Total Environ. Res. Themes 2023, 7, 100057. [Google Scholar]
- Liu, S.R.; Dai, L.M.; Weng, G.Y.; Wang, H. A review on forest ecosystem management towards ecosystem services: Status, challenges, and future perspectives. Acta Ecol. Sin. 2015, 35, 1–9. [Google Scholar]
- Hernández, M.I.R.; Hernández, B.R.A.; Chávez, G.I.F.; Galindo, F.; Pérez, E.V.B.; Campos, S.C.Á. Long-term synergies and trade-offs among ecosystem services for silvopasture management in temperate forests of Chapa de Mota (Mexico). Agrofor. Syst. 2025, 99, 40. [Google Scholar] [CrossRef]
- Garmaeepour, R.; Alambeigi, A.; Danehkar, A.; Shabani, A.A. Mangrove forest ecosystem services and the social well-being of local communities: Unboxing a dilemmA. J. Nat. Conserv. 2025, 84, 126827. [Google Scholar] [CrossRef]
- Kassun, B.; Kallio, M.; Trømborg, E.; Rannestad, M.M. Land use and land cover change, trade-offs, and synergies between ecosystem services in a dry Afromontane Forest. J. Nat. Conserv. 2025, 85, 126874. [Google Scholar] [CrossRef]
- Mersha, E.; Degefa, S.; Argaw, M.; Mengist, W. Impact of Land Use Land Cover Changes on Ecosystem Service Values: Implication for Landscape Management. J. Landsc. Ecol. 2025, 18, 61–85. [Google Scholar] [CrossRef]
- Xu, L.; He, Y.; Zhang, L.; Tang, C.; Xu, H. Relationships and Spatiotemporal Variations of Ecosystem Services and Land Use in Alpine Ecosystems: A Case Study of the Daxing’anling Forest Area, Inner Mongolia. Forests 2025, 16, 359. [Google Scholar] [CrossRef]
- Hao, C.; Wu, S.; Cheng, W.; Chen, M.; Ren, Y.; Chang, X.; Zhang, L. Spatiotemporal Relationship Between Landscape Pattern and Ecosystem Service Connectivity in Wetland Environment: Evidence from Yellow River Delta, China. Land 2025, 14, 273. [Google Scholar] [CrossRef]
- Elgueta, Z.C.; Orsi, F.; Geneletti, D.; Cayuela, L.; Hamer, R.; Lara, A.; Benayas, J.M.R.B. Integrating Ecological Suitability and Socioeconomic Feasibility at Landscape Scale to Restore Biodiversity and Ecosystem Services in Southern Chile. Environ. Manag. 2024, 75, 1–18. [Google Scholar]
- Huang, G.; Feng, S.; Hu, C. A Study of the Spatiotemporal Evolution Patterns and Coupling Coordination between Ecosystem Service Values and Habitat Quality in Diverse Scenarios: The Case of Chengdu Metropolitan Area, China. Sustainability 2024, 16, 3741. [Google Scholar] [CrossRef]
- Ratna, P.M.; Tridoyo, K.; Luky, A.; Achmad, F. Valuing habitat quality for managing mangrove ecosystem services in coastal Tangerang District, Indonesia. Mar. Policy 2021, 133, 104747. [Google Scholar]
- Li, Y.; Zhen, W.; Shi, D.; Tang, Y.; Xia, B. Coupling Coordination and Influencing Mechanism of Ecosystem Services Using Remote Sensing: A Case Study of Food Provision and Soil Conservation. Remote Sens. 2024, 16, 4598. [Google Scholar] [CrossRef]
- Stefanidis, S.; Proutsos, N.; Alexandridis, V.; Mallinis, G. Ecosystem Services Supply from Peri-Urban Watersheds in Greece: Soil Conservation and Water Retention. Land 2024, 13, 765. [Google Scholar] [CrossRef]
- Liu, Y.; Hou, P.; Wang, P.; Zhu, J.; Chen, Y.; Wang, J.; Xie, L. Quantitative Analysis about the Spatial Heterogeneity of Water Conservation Services Function Using a Space—Time Cube Constructed Based on Ecosystem and Soil Types. Diversity 2024, 16, 638. [Google Scholar] [CrossRef]
- Radoslava, K.; Nikola, B.; Janka, Š.; Matej, M.; Miriam, K.; Lubica, J.; Feng, J. Fluvisols Contribution to Water Retention Hydrological Ecosystem Services in Different Floodplain Ecosystems. Land 2022, 11, 1510. [Google Scholar] [CrossRef]
- Nie, Q.; Man, W.; Li, Z.; Wu, X. From Policy to Practice: Assessing Carbon Storage in Fujian Province Using Patch-Generating Land Use Simulation and Integrated Valuation of Ecosystem Services and Tradeoffs Models. Land 2025, 14, 179. [Google Scholar] [CrossRef]
- Ahmed, T.S.; Ashraf, K.M.S.; Rana, T.M.; Ripta, S.K.; Afroz, M.S.; Urmi, S.M.S.T.; Asha, S.B.R.; Shafiqe, S.B.; Islam, K.K. Valuation of Madhupur Sal Forest Ecosystem Services and Carbon Sequestration Potency in Bangladesh: An Avenue for Mitigating Climate Change Impact. Contemp. Probl. Ecol. 2024, 17, 450–459. [Google Scholar] [CrossRef]
- Li, M.Z.; Xu, N.; Liu, F.; Tong, H.R.; Ding, N.Y.; Dong, J.W.; Wang, M.H. Ecological Management Zoning Based on the Supply–Demand Relationship and Synergies of Urban Forest Ecosystem Services: A Case Study from Fuzhou, China. Forests 2024, 16, 17. [Google Scholar] [CrossRef]
- Paré, D.; Bognounou, F.; Emilson, E.J.S.; Leach, J.; Mansuy, N.; Martineau, C.; Norris, C.; Venier, L.; Webster, K. Connecting forest soil properties with ecosystem services: Toward a better use of digital soil maps—A review. Soil. Sci. Soc. Am. J. 2024, 88, 981–999. [Google Scholar] [CrossRef]
- Eger, A.M.; Marzinelli, E.M.; Beas, L.R.; Blain, C.O.; Blamey, L.K.; Byrnes, J.E.K.; Carnell, P.E.; Choi, C.G.; Hessing, L.M.; Kim, K.Y.; et al. The value of ecosystem services in global marine kelp forests. Nat. Commun. 2023, 14, 1894. [Google Scholar] [CrossRef]
- Huang, Y.; Zhang, X.; Sheng, X.; Wang, Y.; Leung, K.M.Y. The impact of payment for ecosystem service schemes on participants’ motivation: A global assessment. Ecosyst. Serv. 2024, 65, 101595. [Google Scholar] [CrossRef]
- Cao, S.; Suo, X.; Xia, C.; Yu, Z.; Feng, F. Net value of forest ecosystem services in China. Ecol. Eng. 2020, 142, 105645. [Google Scholar] [CrossRef]
- Ma, S.; Deng, G.; Wang, J.L.; Hu, H.; Fang, X.; Jiang, J. Telecoupling between urban expansion and forest ecosystem service loss through cultivated land displacement: A case study of Zhejiang Province, China. J. Environ. Manag. 2024, 357, 120695. [Google Scholar] [CrossRef]
- Chen, S.; Wu, J. The Driving Factors of the Tradeoff-Synergistic Relationship Among Forest Ecosystem Service Values in the Yangtze River Delta, China. Forests 2024, 15, 2031. [Google Scholar] [CrossRef]
- Veloso, V.A.; Ruano, I.; Bravo, F. Trade-offs and management strategies for ecosystem services in mixed Scots pine and Maritime pine forests. Eur. J. For. Res. 2024, 1–15. [Google Scholar] [CrossRef]
- Xiong, K.; Kong, L.; Yu, Y.; Zhang, S.; Deng, X. The impact of multiple driving factors on forest ecosystem services in karst desertification control. Front. For. Glob. Change 2023, 6, 1220436. [Google Scholar] [CrossRef]
- Lingwei, K.; Kangning, X.; Shihao, Z.; Yu, Z.; Xuehua, D. Review on Driving Factors of Ecosystem Services: Its Enlightenment for the Improvement of Forest Ecosystem Functions in Karst Desertification Control. Forests 2023, 14, 582. [Google Scholar] [CrossRef]
- Roces-Díaz, J.V.; Jordi, V.; Miquel, C.D.; Raúl, C.V.; Mireia, B.C.; Alejandra, M.O.; Lluís, B.; Sergio, D.M.; Jordi, M.V. Temporal changes in Mediterranean forest ecosystem services are driven by stand development, rather than by climate-related disturbances. For. Ecol. Manag. 2021, 480, 118623. [Google Scholar] [CrossRef]
- Chen, Y.Q.; Zhang, F.Y.; Lin, J.Y. Projecting Future Land Use Evolution and Its Effect on Spatiotemporal Patterns of Habitat Quality in China. Appl. Sci. 2025, 15, 1042. [Google Scholar] [CrossRef]
- Pang, J.T.; He, L.; He, Z.W.; Zeng, W.T.; Yuan, Y.; Bai, W.Q.; Zhao, J.H. Interactions and Driving Force of Land Cover and Ecosystem Service Before and After the Earthquake in Wenchuan County. Sustainability 2025, 17, 3094. [Google Scholar] [CrossRef]
- Li, T.; Wang, X.; Jia, H. Evaluate Water Yield and Soil Conservation and Their Environmental Gradient Effects in Fujian Province in South China Based on InVEST and Geodetector Models. Water 2025, 17, 230. [Google Scholar] [CrossRef]
- Cai, C.F.; Ding, S.W.; Shi, Z.H.; Huang, L.; Zhang, G.Y. Study of applying USLE and geographical information system IDRISI to predict soil erosion in small watershed. Soil. Water Conserv. 2000, 14, 19–24. [Google Scholar]
- Peng, Z.; Xiaoping, L.; Weihong, Z.; Chunjing, L.; Hengqi, Y.; Chengyang, G.; Jingzhi, W. Spatio-temporal Changes in Water Conservation Ecosystem Service During 1990–2019 in the Tumen River Basin, Northeast China. Chin. Geogr. Sci. 2023, 33, 102–115. [Google Scholar]
- Jia, Y.F.; Wang, G.Q. Assessment of water conservation capacity of Yiluo River Basin bsed on the InVEST Model. J. Soil. Water Conserv. 2023, 37, 101–108. [Google Scholar]
- Zhang, L.; Dawes, W.; Walker, G. Response of mean annual evapotranspiration to vegetation changes at catchment scale. Water Resour. Res. 2001, 37, 701–708. [Google Scholar] [CrossRef]
- Wang, J.F.; Xu, C.D. Geodetector: Principle and prospective. Acta Geogr. Sin. 2017, 72, 116–134. [Google Scholar]
- Huang, Y.; Chen, X.; Zhu, L. Exploring Trade-Offs/Synergies and Drivers of Ecosystem Services in the Dongting Lake Area, China. Sustainability 2025, 17, 1650. [Google Scholar] [CrossRef]
- Zhao, S.F.; Zeng, W.; Feng, D. Coupling Coordination of Urban Resilience and Urban Land Use Efficiency in Hunan Province, China. Sustainability 2024, 16, 10860. [Google Scholar] [CrossRef]
- Wang, P.J.; Zhang, J.H.; Yang, L.J.; Guo, L.J.; Ma, X.B.; Kan, Y.; Chen, M. Spalio-temporal evolution of ecasystem services in a typical tourist city and its influencing factors: A case study of Huangshan City. Acta Ecol. Sin. 2024, 44, 3897–3910. [Google Scholar]
- Li, Z.K.; Li, X.Y.; Zhou, S.; Yang, X.F.; Fu, Y.S.; Miao, C.Y.; Wang, S.; Zhang, G.H.; Wu, X.C.; Yang, C.; et al. A comprehensive review on coupled processes and mechanisms of soil-vegetation-hydrology, and recent research advances. Sci. China Earth Sci. 2022, 65, 2083–2114. [Google Scholar]
- Liu, S.R.; Wang, H.; Li, H.K.; Yu, Z.; Luan, J.W. Projections of China’s Forest Carbon Storage and Sequestration and Ways of Their Potential Capacity Enhancement. Sci. Silvae Sin. 2024, 60, 157–172. [Google Scholar]
- Cui, J.P.; Chen, A.P.; Huntingford, C.; Piao, S.L. Integrating ecosystem water demands into drought monitoring and assessment under climate change. Nat. Water 2024, 2, 215–218. [Google Scholar] [CrossRef]
- Zhang, J.J.; Zhu, W.B.; Zhu, L.Q.; Li, Y.H. Multi-scale analysis of trade-off/synergistic effects of forest ecosystem services in the Funiu Mountain Region, China. J. Geogr. Sci. 2022, 32, 981–999. [Google Scholar] [CrossRef]


| No. | Data Name | Format | Resolution | Data Source |
| 1 | Remote-Sensing Imagery (Landsat TM/ETM+/OLI) | Raster | 30 m | Geographic Data Spatial Cloud |
| 2 | Elevation | Raster | 30 m | Geographic Data Spatial Cloud |
| 3 | Soil | Raster | 30 m | HWSD Soil Database |
| 4 | Leaf Area Index (LAI) | Raster | 500 m | Institute of Geographic Sciences and Natural Resources Research, CAS |
| 5 | Temperature and Precipitation | Raster | 1 km | National Earth System Science Data Center |
| 6 | Nighttime Light Data | Raster | 500 m | National Earth System Science Data Center |
| 7 | GDP | Raster | 1 km | Geographic Data Spatial Cloud |
| 8 | Population Density | Raster | 1 km | Geographic Data Spatial Cloud |
| 9 | Socioeconomic Data (e.g., Total Tourism Revenue) | Table | - | Regional Yearbooks, Statistical Yearbooks |
| Threatening Factor | Maximum Influence Distance (km) | Weight | Attenuation Type |
|---|---|---|---|
| Paddy field | 8 | 0.7 | Exponential |
| Dryland | 8 | 0.5 | Linear |
| Urban land | 10 | 1 | Exponential |
| Rural residential land | 5 | 0.7 | Exponential |
| Other construction land | 10 | 1 | Exponential |
| Woodland Type | Habitat Suitability | Paddy Field | Dryland | Urban Land | Rural Residential Land | Other Construction Land | |
|---|---|---|---|---|---|---|---|
| Tree-dominated woodland | Broadleaf forest | 1 | 0.6 | 0.6 | 0.95 | 0.85 | 0.8 |
| Coniferous forest | 1 | 0.6 | 0.6 | 0.95 | 0.85 | 0.8 | |
| Mixed coniferous–broadleaf forest | 1 | 0.6 | 0.6 | 0.95 | 0.85 | 0.8 | |
| Bamboo-dominated woodland | 1 | 0.6 | 0.6 | 0.95 | 0.85 | 0.8 | |
| Shrubland | 0.95 | 0.7 | 0.7 | 1 | 0.85 | 0.8 | |
| Sparse woodland | 0.9 | 0.8 | 0.8 | 1 | 0.9 | 0.65 | |
| Woodland Type | Cabove | Cbelow | Csoil | Cdead | |
|---|---|---|---|---|---|
| Tree-dominated woodland | Broadleaf forest | 63.92 | 132.1 | 254.8 | 7.8 |
| Coniferous forest | 83.21 | 136.25 | 240.25 | 7.8 | |
| Mixed coniferous–broadleaf forest | 102.5 | 140.4 | 225.7 | 7.8 | |
| Bamboo-dominated woodland | 20.35 | 67.5 | 170 | 7.8 | |
| Shrubland | 26.6 | 67.5 | 150 | 6 | |
| Sparse woodland | 22.35 | 67.5 | 120 | 5 | |
| Woodland Type | Vegetation-Cover Factor (C) | Soil and Water Conservation Measures Factor (P) | |
|---|---|---|---|
| Tree-dominated woodland | Broadleaf forest | 0.005 | 0.99 |
| Coniferous forest | 0.005 | 0.99 | |
| Mixed coniferous–broadleaf forest | 0.005 | 0.99 | |
| Bamboo-dominated woodland | 0.01 | 0.99 | |
| Shrubland | 0.03 | 0.99 | |
| Sparse woodland | 0.05 | 0.99 | |
| Woodland Type | Maximum Root Depth (mm) | Plant Transpiration Coefficient | Vegetation Cover | |
|---|---|---|---|---|
| Tree-dominated woodland | Broadleaf forest | 6000 | 0.95 | 1 |
| Coniferous forest | 5800 | 0.95 | 1 | |
| Mixed coniferous–broadleaf forest | 5600 | 0.95 | 1 | |
| Bamboo-dominated woodland | 5400 | 0.95 | 1 | |
| Shrubland | 5200 | 0.93 | 1 | |
| Sparse woodland | 5200 | 0.90 | 1 | |
| Correlation Coefficient | Trade-Off/Synergy Classification |
|---|---|
| (−1–−0.5) | Strong trade-off |
| (−0.5–0) | Weak trade-off |
| 0 | No significant interaction |
| (0–0.5) | Weak synergy |
| (0.5–1) | Strong synergy |
| Year | Tree-Dominated Woodland | Bamboo- Dominated Woodland | Shrubland | Sparse Woodland | Total | |||
|---|---|---|---|---|---|---|---|---|
| Broadleaf Forest | Coniferous Forest | Mixed Coniferous–Broadleaf Forest | Subtotal | |||||
| 1995 | 2040.62 | 2353.96 | 893.78 | 5288.36 | 96.24 | 1366.58 | 575.35 | 7326.52 |
| 2005 | 2170.03 | 2602.98 | 802.01 | 5575.02 | 102.66 | 1334.98 | 422.72 | 7435.38 |
| 2015 | 2191.81 | 2956.14 | 641.91 | 5789.85 | 102.52 | 1365.02 | 156.73 | 7414.12 |
| 2022 | 2169.99 | 2606.45 | 1135.81 | 5912.24 | 109.48 | 1332.51 | 142.83 | 7497.06 |
| Year | Lowest | Lower | Medium | Higher | Highest |
|---|---|---|---|---|---|
| 1995 | 26.86 | 114.76 | 377.48 | 830.60 | 5976.82 |
| 2005 | 392.95 | 1174.79 | 2371.30 | 2052.13 | 1444.21 |
| 2015 | 507.37 | 1470.68 | 2444.74 | 1874.69 | 1116.65 |
| 2022 | 3613.42 | 2693.38 | 844.64 | 264.77 | 80.84 |
| Type | Specific Driving Factors |
|---|---|
| Climate | MAT (Mean Annual Temperature) |
| AAP (Annual Average Precipitation) | |
| Topography | Elev. (Elevation) |
| Slope | |
| Vegetation | LAI (Leaf Area Index) |
| Soil | SOM (Soil Organic Matter) |
| Socioeconomics | GDP (Gross Domestic Product) |
| PD (Population Density) | |
| NLI (Nighttime Light Index) | |
| TDI (Tourism Dependency Index) |
| Year | High | Medium | Low |
|---|---|---|---|
| 1995 | 54.77% | 34.24% | 10.99% |
| 2005 | 54.91% | 36.35% | 8.74% |
| 2015 | 57.04% | 37.61% | 5.35% |
| 2022 | 24.16% | 70.17% | 5.17% |
Disclaimer/Publisher’s Note: The statements, opinions and data contained in all publications are solely those of the individual author(s) and contributor(s) and not of MDPI and/or the editor(s). MDPI and/or the editor(s) disclaim responsibility for any injury to people or property resulting from any ideas, methods, instructions or products referred to in the content. |
© 2025 by the authors. Licensee MDPI, Basel, Switzerland. This article is an open access article distributed under the terms and conditions of the Creative Commons Attribution (CC BY) license (https://creativecommons.org/licenses/by/4.0/).
Share and Cite
Zhao, S.; Zeng, W.; Yang, Q.; Zheng, R. Research on the Driving Factors and Trade-Offs/Synergies of Woodland Ecosystem Services in Zhangjiajie City, China. Sustainability 2025, 17, 3916. https://doi.org/10.3390/su17093916
Zhao S, Zeng W, Yang Q, Zheng R. Research on the Driving Factors and Trade-Offs/Synergies of Woodland Ecosystem Services in Zhangjiajie City, China. Sustainability. 2025; 17(9):3916. https://doi.org/10.3390/su17093916
Chicago/Turabian StyleZhao, Shuangfei, Wei Zeng, Qian Yang, and Rong Zheng. 2025. "Research on the Driving Factors and Trade-Offs/Synergies of Woodland Ecosystem Services in Zhangjiajie City, China" Sustainability 17, no. 9: 3916. https://doi.org/10.3390/su17093916
APA StyleZhao, S., Zeng, W., Yang, Q., & Zheng, R. (2025). Research on the Driving Factors and Trade-Offs/Synergies of Woodland Ecosystem Services in Zhangjiajie City, China. Sustainability, 17(9), 3916. https://doi.org/10.3390/su17093916