Article

Spatial Assessment of Ecosystem Services in Zhoushan Archipelago Based on InVEST Model

Marine Science and Technology College, Zhejiang Ocean University, Zhoushan 316022, China
*
Author to whom correspondence should be addressed.
Sustainability 2025, 17(9), 3913; https://doi.org/10.3390/su17093913
Submission received: 25 February 2025 / Revised: 18 April 2025 / Accepted: 23 April 2025 / Published: 26 April 2025

Abstract

:
Island ecosystems are vulnerable, as natural disasters and inappropriate anthropogenic activities can easily disrupt the ecological balance, posing significant challenges to the delivery of ecosystem services. In order to evaluate the ecosystem service functions of the Zhoushan Archipelago, based on the InVEST model, the four services of water conservation, carbon storage, habitat quality, and soil conservation in the Zhoushan Archipelago in 2017, 2020, and 2023 were estimated, and the spatial pattern of comprehensive ecosystem service function was determined by principal component analysis. The results showed the following: (1) the spatial distribution of water conservation, carbon storage, habitat quality, and soil conservation values in 2017, 2020, and 2023 show the same trend, with high values distributed in the central areas of Zhoushan Island, Changtu Island, Taotao Island, and Qushan Island, and low values distributed in the coastal areas of Zhoushan Island, Yangshan Island, and Yushan Island; (2) land use types have a significant effect on four services. Trees, built areas, rangeland, and cropland were the primary contributors to these four ecosystem services; (3) from 2017 to 2023, the highly important areas and extremely important areas showed a decreasing trend. In 2023, the highly important areas and extremely important areas accounted for 17.29% and 2.33% of the total area, which are important for maintaining the virtuous cycle of the ecosystem. This study provides a scientific basis for the sustainable development of the island.

1. Introduction

Ecosystem service functions refer to the environmental conditions and utilities provided by natural ecosystems to support human survival and activities, encompassing four main types: provisioning, regulating, cultural, and supporting services [1,2]. Island ecosystems are an important support point for marine economic development, and the ecosystems they belong to possess important economic values, scientific research values, and ecological values. In recent years, islands have faced a series of ecological challenges such as the impacts of global climate change, the deterioration of seawater quality, the scarcity of freshwater resources, and land resource constraints [3]. Climate change has led to sea level rise, gradually reducing the limited land area of the archipelago [4]. In addition, the increased frequency of unusual and extreme weather events has led to more frequent meteorological and climatic disasters, further disrupting the balance of island ecosystems [5,6].
Ecosystem service modeling tools include the InVEST model [7], ARIES model [8], ecological footprint model [9], MSEM model [10], and SolVES [11]. The methodological system of the InVEST model, as a mainstream tool for the quantitative assessment of ecosystem service functions, has been systematically verified through global multi-scale empirical studies [12], which can achieve a large-scale assessment of ecosystem service functions based on simpler model parameters and less data. The InVEST model shows unique advantages in assessing the spatial differentiation characteristics of ecosystem service functions. It has been widely used in ecosystem assessment in different regions of the world, providing a scientific basis for the optimization of regional ecological security patterns and the formulation of ecological restoration policies. However, the integrated assessments of ecosystem services have focused on inland areas such as Anhui Province [13], the Yellow River Basin of Henan Province [14], and the Sichuan–Yunnan ecological buffer zone [15]. Most existing studies on islands focus on individual ecosystem service functions, such as water yield [16], soil conservation [17], habitat quality [18], and carbon storage [19] and tend to neglect the interactions between multiple services and the overall value of ecosystem services on islands.
The Zhoushan Archipelago is widely distributed and relatively fragmented. Due to the topography and geomorphology of the islands, only 31% of the land in the Zhoushan Archipelago is suitable for development. Most of the land is steep slopes unsuitable for development, and most of it is covered by ecological protection forests. Agricultural land is dominated by coastal protection forests and ecological public welfare forests, and arable land is scarce and fragmented, with serious soil salinization and low quality. These challenges are exacerbated by the depletion of reserve resources. The unreasonable development and over-utilization of resources will further reduce the area of ecological and productive land and threaten the ecosystem service function of the area [20,21,22]. Therefore, identifying more effective initiatives for the ecologically sustainable development of the Zhoushan Islands remains a top priority.
For island ecosystem services, existing studies have not yet developed a systematic assessment framework. This study is committed to filling the knowledge gap in the literature and providing a comprehensive assessment of the widely distributed and relatively vulnerable Zhoushan Archipelago. In order to avoid the influence of weather conditions in a single year, the years 2017, 2020, and 2023 were selected, and the process is described below. (1) The integrated ecosystem service functions of the Zhoushan Archipelago in 2017, 2020, and 2023 were assessed using the InVEST model, revealing the spatial distribution characteristics of functions such as water retention, carbon storage, habitat quality, and soil conservation. This fundamental analysis provides a basis for the study of the spatial pattern of regional ecosystem services. (2) Based on the evaluation results of the importance of each ecosystem service, the ecosystem service functions of the seven land use types in 2023 were itemized to analyze the contributions of different land use types to the four ecosystem service functions. (3) On the basis of the evaluation results of individual ecosystem service functions, the four service functions in 2017, 2020, and 2023 were weighted, superimposed, and calculated using principal component analysis to obtain the results of the comprehensive grading of the importance of ecosystem services in the Zhoushan Archipelago. The spatial assessment of the ecosystem service functions of the islands and the formulation of the corresponding ecological function management zoning measures are of great practical significance for the ecological protection and sustainable development of the islands.

2. Materials and Methods

2.1. Study Area

The Zhoushan Archipelago (121°30′–123°25′ E, 29°32′–31°04′ N) is located in the north-eastern part of Zhejiang Province and is the largest archipelago in China (Figure 1). It covers a total area of 22,200 km2, with a land area of 1400 km2 and a sea area of 20,800 km2 [23]. The archipelago comprises numerous islands, 58 of which exceed 1 km2 in size, accounting for approximately 96.9% of the total area. As a typical island ecosystem, the Zhoushan Archipelago is subject to the synergistic effects of ocean circulation and the East Asian monsoon system, resulting in the formation of a unique subtropical maritime monsoon climate [24]. The average annual temperature in the area is about 16 °C, and there is abundant precipitation, providing a stable climatic basis for the formation of ecosystem services. Tropical storms during the summer are a common meteorological hazard in the region.
The forest vegetation of the Zhoushan Archipelago is predominantly composed of secondary broad-leaved forests and shrubs. The unique geographical and climatic conditions of the islands have given rise to distinctive evergreen broad-leaved forests and evergreen scrub, which are sporadically distributed on the sea-facing slopes of the southeastern islands and small offshore islands. Due to poor soil conditions, as well as natural factors such as wind and salt spray, vegetation development is constrained, resulting in the formation of a uniquely stable ecosystem. This vegetation type represents the most typical and characteristic feature of the Zhoushan Archipelago.

2.2. Data Collection and Processing
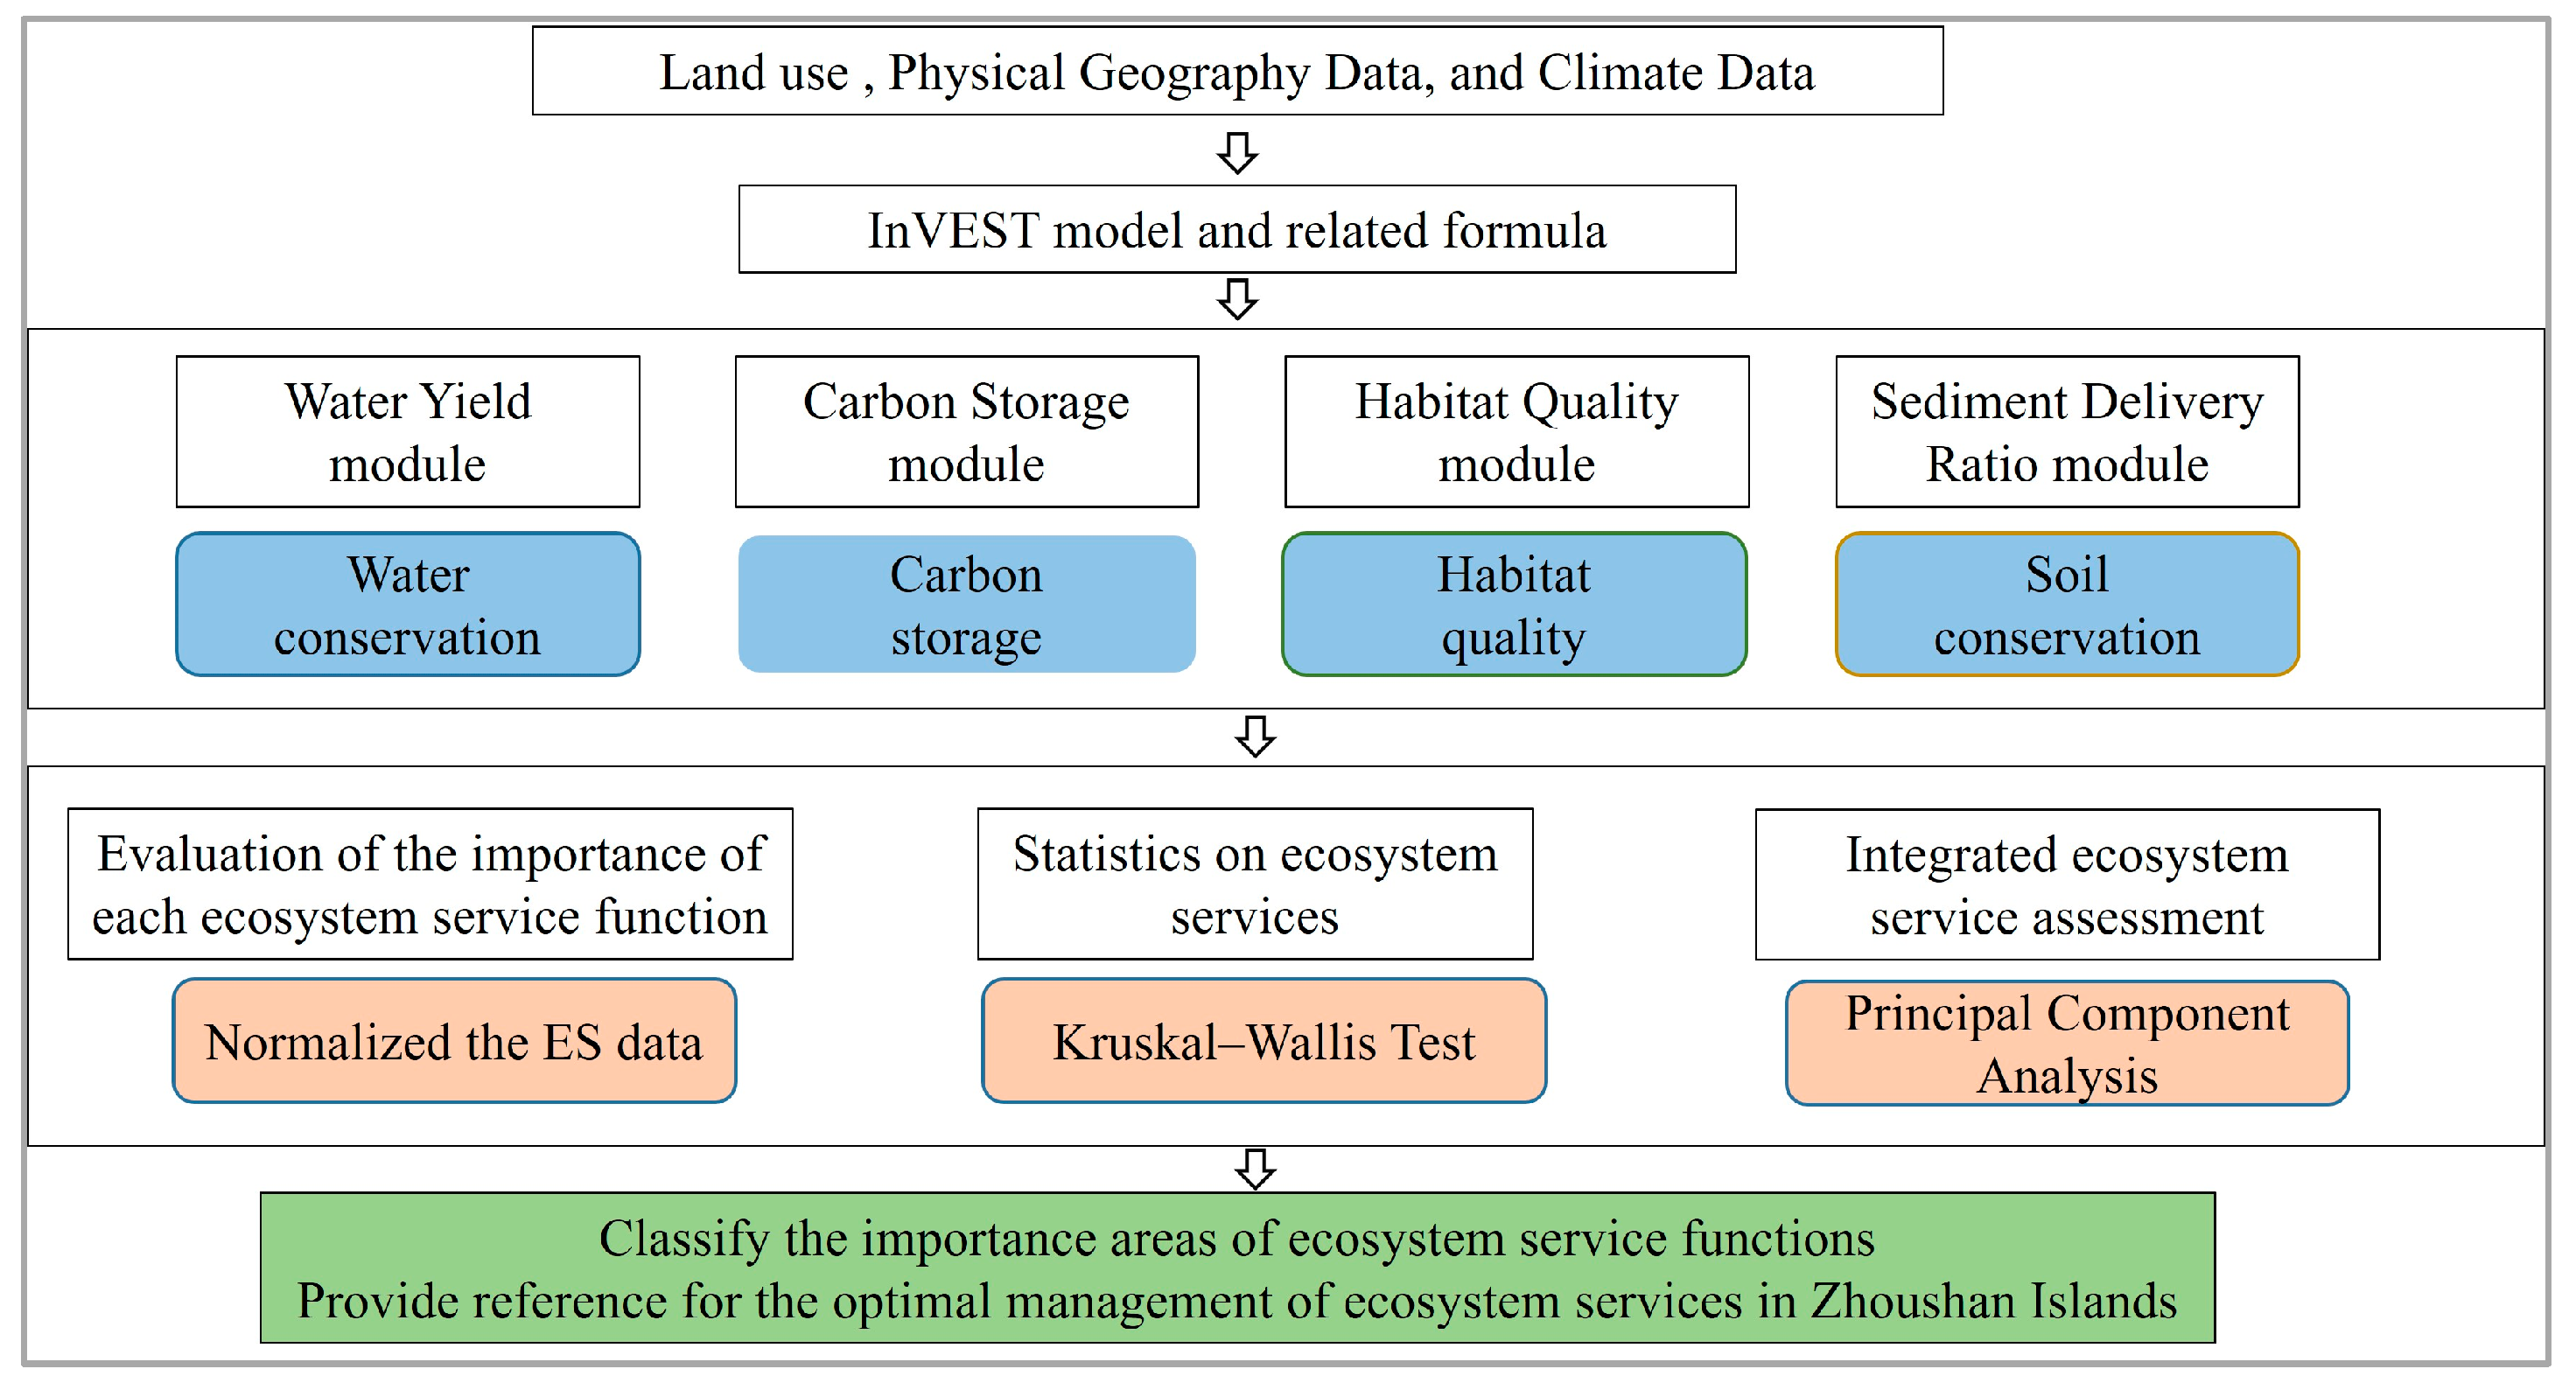
This study collects and processes data from three sources: land use, physical geography, and climate data. The data used are detailed in Table 1.

2.3. Methods

2.3.1. Ecosystem Service Function Assessment Methods

The Zhoushan City Land Space Ecological Restoration Plan (2021–2035), released in December 2024, aims to significantly improve the ecological conditions of Zhoushan City’s critical marine ecological function areas, agricultural production zones, and urban–rural development zones. This plan also seeks to enhance ecosystem quality, ecological service functions, and ecosystem stability. Through the implementation of key projects—such as coastline ecological restoration, urban and rural habitat upgrading, forest ecological restoration, and biodiversity protection—the plan addresses ecological challenges, including soil erosion, irrational urban spatial development, and biodiversity loss. To address these issues, this study selected four ecosystem services—water conservation, carbon storage, habitat quality, and soil conservation—to analyze the spatial distribution characteristics of ecosystem services in the Zhoushan Archipelago based on the InVEST model [25,26]. The analysis framework is shown in Figure 2.

2.3.2. Water Conservation

The InVEST water yield tool was utilized to estimate annual water yield. This model operates on a gridded map and employs the Budyko hydrothermal coupling equilibrium hypothesis [27,28]. The total annual water yield ( Y x ) for each pixel (x) is calculated as the difference between annual rainfall ( P x ) and actual evapotranspiration ( A E T x ). The formula is expressed as follows:
Y x = 1 A E T x P x × P x
where Y x represents the annual water yield of the grid unit (mm); P x represents the average annual rainfall of grid unit x (mm). A E T x P x represents the approximate Budyko curve proposed by Zhang et al. [27], which defines the shape of the curve, relating potential evapotranspiration to actual evapotranspiration.
A E T x P x = 1 + ω P E T x P x 1 + ω P E T x P x + P x P E T x
P E T x = K c x × E T o x
E T o x = 0.0013 × 0.408 × R A × ( T A V + 17 ) × ( T D 0.0123 P ) 0.76
where P E T x represents the potential evapotranspiration,  ω represents a nonphysical empirical fitting parameter, K c x represents the crop coefficient; T A V and T D represent the mean and difference in the monthly average daily maximum temperature and average daily minimum temperature; R A represents extraterrestrial radiation, and P represents the monthly precipitation. The ω can be calculated according to the expression proposed by Donohue et al. [28] as follows:
ω = Z × A W C P x
A W C = m i n S o i l . D e p t h , R o o t . D e p t h × P A W C
where Z is seasonal factors, reflecting the seasonal distribution of rainfall as well as the depth of rainfall; A W C represents the water content available to plants. S o i l . D e p t h represents the maximum soil depth. R o o t . D e p t h represents the root depth. P A W C represents the available water available through indirect calculation.
The resulting layers were superimposed with topographic index ( T I ), soil saturated hydraulic conductivity ( K S ), and velocity coefficient ( v e l o c i t y ) parameters. The results obtained indicate the amount of water conservation in the system under the combined effect of topography, soil, and climate, reflecting the level of water-holding capacity of the study area [29,30]. And the formula is expressed as follows:
R e t e n t i o n = m i n 1 , 249 v e l o c i t y × m i n 1 , 0.9 × T I 3 × m i n 1 , K S 300 × Y x
T I = l g D r a i n a g e a r e a s o i l _ d e p t h × p e r c e n t _ s l o p e
where R e t e n t i o n represents water conservation volume, v e l o c i t y represents the velocity coefficient, K S represents the saturated soil hydraulic conductivity, and T I represents the topographic index. D r a i n a g e a r e a represents the number of pixels in the catchment area, s o i l _ d e p t h represents the soil depth, and p e r c e n t _ s l o p e represents the slope.
The biophysical coefficients for land use (LULC) types are listed in Table 2 [16,29,31,32].

2.3.3. Carbon Storage

The functional assessment of carbon storage service using the carbon storage module of the InVEST model. Carbon stocks were assessed based on land use and land cover types. The total carbon stock was calculated by aggregating contributions from four components: above-ground biomass, below-ground biomass, and dead organic and soil carbon storage. Total carbon stocks were calculated by multiplying the area of each land use type by its corresponding average carbon density and summing these values across all land use types. And the formula is expressed as follows:
C i = C a b o v e + C b e l o w + C s o i l + C d e a d
  C t o t a l = i = 1 n A i C i
where C t o t a l is the total carbon storage of land cover category; C a b o v e , C b e l o w , C s o i l   , and C d e a d denote the above-ground, below-ground, soil, and dead organic carbon storage.
According to the conclusions of existing studies, the carbon density of the same land use type is consistent within the same climate zone [33]. Therefore, in this study, the carbon density parameters with comparable climatic conditions and land use types to the study area were extracted by systematically searching the literature and scientific research data in the nearby areas of the East China Sea and the neighboring islands. The carbon density of the Zhoushan Archipelago is summarized in Table 3 [34,35,36,37,38].

2.3.4. Habitat Quality

The functional assessment of habitat quality service is performed using the habitat quality module of the InVEST model. The module integrates multi-dimensional parameters to construct an assessment system and outputs a habitat quality index. The closer the value of this index is to 1, the lower the degree of habitat fragmentation and the stronger the ability to maintain biodiversity; the closer the value of this index is to 0, the higher the risk of habitat degradation, and the formula is expressed as follows [39,40,41,42]:
Q x j = H j 1 D x j z D x j z + k z
where Q x j represents the habitat quality in grid x within land use class j . H j represents each LULC assigned a habitat score from 0 to 1, z and k are constants, usually taking the values of 2.5 and 0.5. D x j represents the habitat degradation level in grid x within land use class j :
  D x j = r = 1 R y = 1 Y r W r r = 1 R W r r y i r x y β x S j r
where R represents the number of threat factors, y represents a grid in threat factor r , Y r represents the number of grids in that factor, W r represents the weight for threat factor r , r y represents the value of factor r in grid y , i r x y represents the threat degree of r y to grid x , β x represents the accessibility to grid x , and S j r represents the susceptibility of land use j to threat factor r , where i r x y is assessed using the linear or exponential decay formula:
i r x y = 1 d x y / d r   m a x l i n e a r
i r x y = e x p 2.99 / d r   m a x · d x y e x p o n e n t i a l
where d x y represents the straight-line distance from grid x to grid y , and d r   m a x represents the maximum threat range for factor r .
Considering previous studies and the unique environment of the island, three threat factors were identified in this study: cropland, built areas, and bare ground. In terms of spatial attenuation characteristics, exponential attenuation was used, considering the influence of point-source threats such as built areas. In contrast, for linear features, such as cropland and bare ground, a linear decay function was used. The parameters used were set within a reasonable range based on previous studies. Based on previous studies, the maximum threat range, weights, and distance decay functions were assigned to each threat factor (Table 4) [31,43,44,45,46].
The sensitivities of the various land use types to each threat factor varied significantly. The sensitivities ranged from 0 (lowest sensitivity) to 1 (highest sensitivity). Based on previous studies, the habitat suitability of different land use types and the sensitivity of each threat factor to each land use type in the Zhoushan Archipelago were determined (Table 5) [31,43,45,46].

2.3.5. Soil Conservation

The functional assessment of soil conservation service is performed using the sediment delivery ratio module of the InVEST model. Soil conservation represents the ability of ecosystems to retain soil and control erosion and is important for maintaining ecosystem stability, conserving biodiversity, promoting agricultural production, water resource management, and responding to climate change. This module quantifies the difference between potential and actual soil erosion. The formula is as follows:
R K L S x = R x × K x × L x × S x
U S L E x = R x × K x × L x × S x × C x × P x
S E D R E T x = R K L S x U S L E x
where R x represents the rainfall erosion factor; K x represents the soil erosion factor; L x represents the slope length factor; S x represents the slope gradient factor; C x   represents the vegetation cover factor; P x is the factor for soil conservation measures; R K L S x is the potential soil erosion; U S L E x is the actual soil erosion. The L x and P x data are calculated from the DEM data (Table 1).
  R x = i = 1 12 ( 1.5577 + 0.1792 P i ) × 17.02
K x = 0.2 + 0.3 e 0.0256 S a 1 S i 100 × S i S c + S i 0.3 × 1 0.25 C C + e 3.72 2.95 C × 1 0.7 1 S a 100 / 1 S a 100 + e 5.51 + 22.9 1 S a 100 × 0.1317
where P i represents the rainfall in the i -th month; S a represents the sand content; S i represents the powder particle content; S c represents the content of clay particles; C represents the organic carbon content. The P i , S a , S i , S c , and C used in the formula are obtained from precipitation data and soil data (Table 1).
The factor for soil conservation measures takes the value of [0,1]. When the P x value is the minimum value of 0, it indicates that the study area has implemented adequate soil and water erosion prevention and control measures, and no erosion occurs on the surface; when the P x value is the maximum value of 1, it reflects that the area has not taken any soil and water conservation engineering or management measures. The vegetation cover factor takes the same value of [0,1]. When the C x   value is the maximum value of 1, it indicates that the ground surface is completely exposed and lacks the protective effect of vegetation cover; when the C x   value is the minimum value of 1, it indicates that the ground surface vegetation is well developed and forms an effective ecological protective layer. Based on previous studies, the C x and P x for different land use classes were determined (Table 6) [47,48,49,50].

2.3.6. Kruskal–Wallis Test

The Kruskal–Wallis test was used to test whether there is a significant difference between land use types and ecosystem service functions. The Kruskal–Wallis test is the non-parametric equivalent of one-way ANOVA [51]. Compared with classical ANOVA, the Kruskal–Wallis test has the following characteristics: (1) it does not require data to be normally distributed. It is suitable for dealing with data that are not normally distributed or have unequal variance; (2) it compares not the means or variances but the sum of ranks, by comparing whether there is a significant difference between the medians of the groups.
The Kruskal–Wallis test is applied to compare the medians of three or more independent samples for significant differences. The basic principle is to combine and rank order all the data and then compare the rank sums of the groups. If the medians of all the groups are the same, the rank sums of the groups should be approximately equal; if the rank sum of one group is significantly higher or lower than that of the other groups, the median of that group may be significantly different from the other groups. In the table of test results, the p-values are interpreted as significant if p < 0.05 [52]. The Kruskal–Wallis test is based on Equation (20):
  H = 12 n ( n + 1 ) i = 1 k R i 2 n i 3 n + 1
where n is the total sample size, and R i   is the sum of the ranks assigned to the scores in the i-th trial.

2.3.7. Principal Component Analysis

Principal component analysis (PCA) reveals the strength of association between variables and principal components by constructing a loading matrix [53,54]. The values of the elements in the loading matrix intuitively reflect the relative importance of each original variable in each principal component: the larger the absolute value of the loading coefficient, the higher the contribution of the variable to the corresponding principal component. Compared with traditional weighting methods (e.g., expert scoring and hierarchical analysis), the significant advantage of principal component analysis is its ‘objective weighting’ feature. Traditional methods often rely on the researcher’s subjective judgment of the importance of the indicators, which can easily lead to a distortion of the results due to the bias of the weight setting. On the other hand, principal component analysis automatically generates an objective weight matrix by calculating the variance contribution of each variable to the principal components. Based on the importance scores of these variables, the weights of the four ecosystem service functions can be scientifically determined [55].
To further assess the integrated ecosystem service functions, the evaluation results of the individual ecosystem service functions were analyzed using SPSS software (version 27.0) [56,57]. Principal component analysis (PCA) is a multivariate statistical method used to objectively determine the weights of indicators and principal components. Usually, principal components with a cumulative contribution of more than 85 percent and an eigenvalue greater than 1 are selected, as they provide an adequate overview of the data with less loss of information. If the eigenvalues of the principal components are <1, there is the problem that the principal components do not fully explain the variance in the original variables [58]. Subsequently, a weighted overlay was calculated for the four services, and the results were equally divided into five grades. The classification criteria were as follows: slightly important areas (0–0.2), lightly important areas (0.2–0.4), moderately important areas (0.4–0.6), highly important areas (0.6–0.8), and extremely important areas (0.8–1).
In order to comprehensively and systematically assess the integrated functions of the Zhoushan Archipelago in terms of water conservation, carbon storage, habitat quality, and soil conservation, this research used normalization to eliminate the differences in magnitude between the four services and to achieve numerical standardization. The formula is as follows:
N = X X m i n X m a x X m i n
where N represents the normalized value, X represents the original value, X m i n represents the minimum value, and X m a x represents the maximum value.
The formulae used for principal component analysis are as follows:
  w i = λ i / i = 1 n λ i
E S I = r 1 W 1 + r 2 W 2 + + r i W i
where w i represents the weight of the i-th principal component; λ i represents the contribution rate of the ith principal component; n represents the total number of principal components; E S I represents the integrated ecosystem services assessment index; r 1 represents the i-th principal component.

3. Results and Analyses

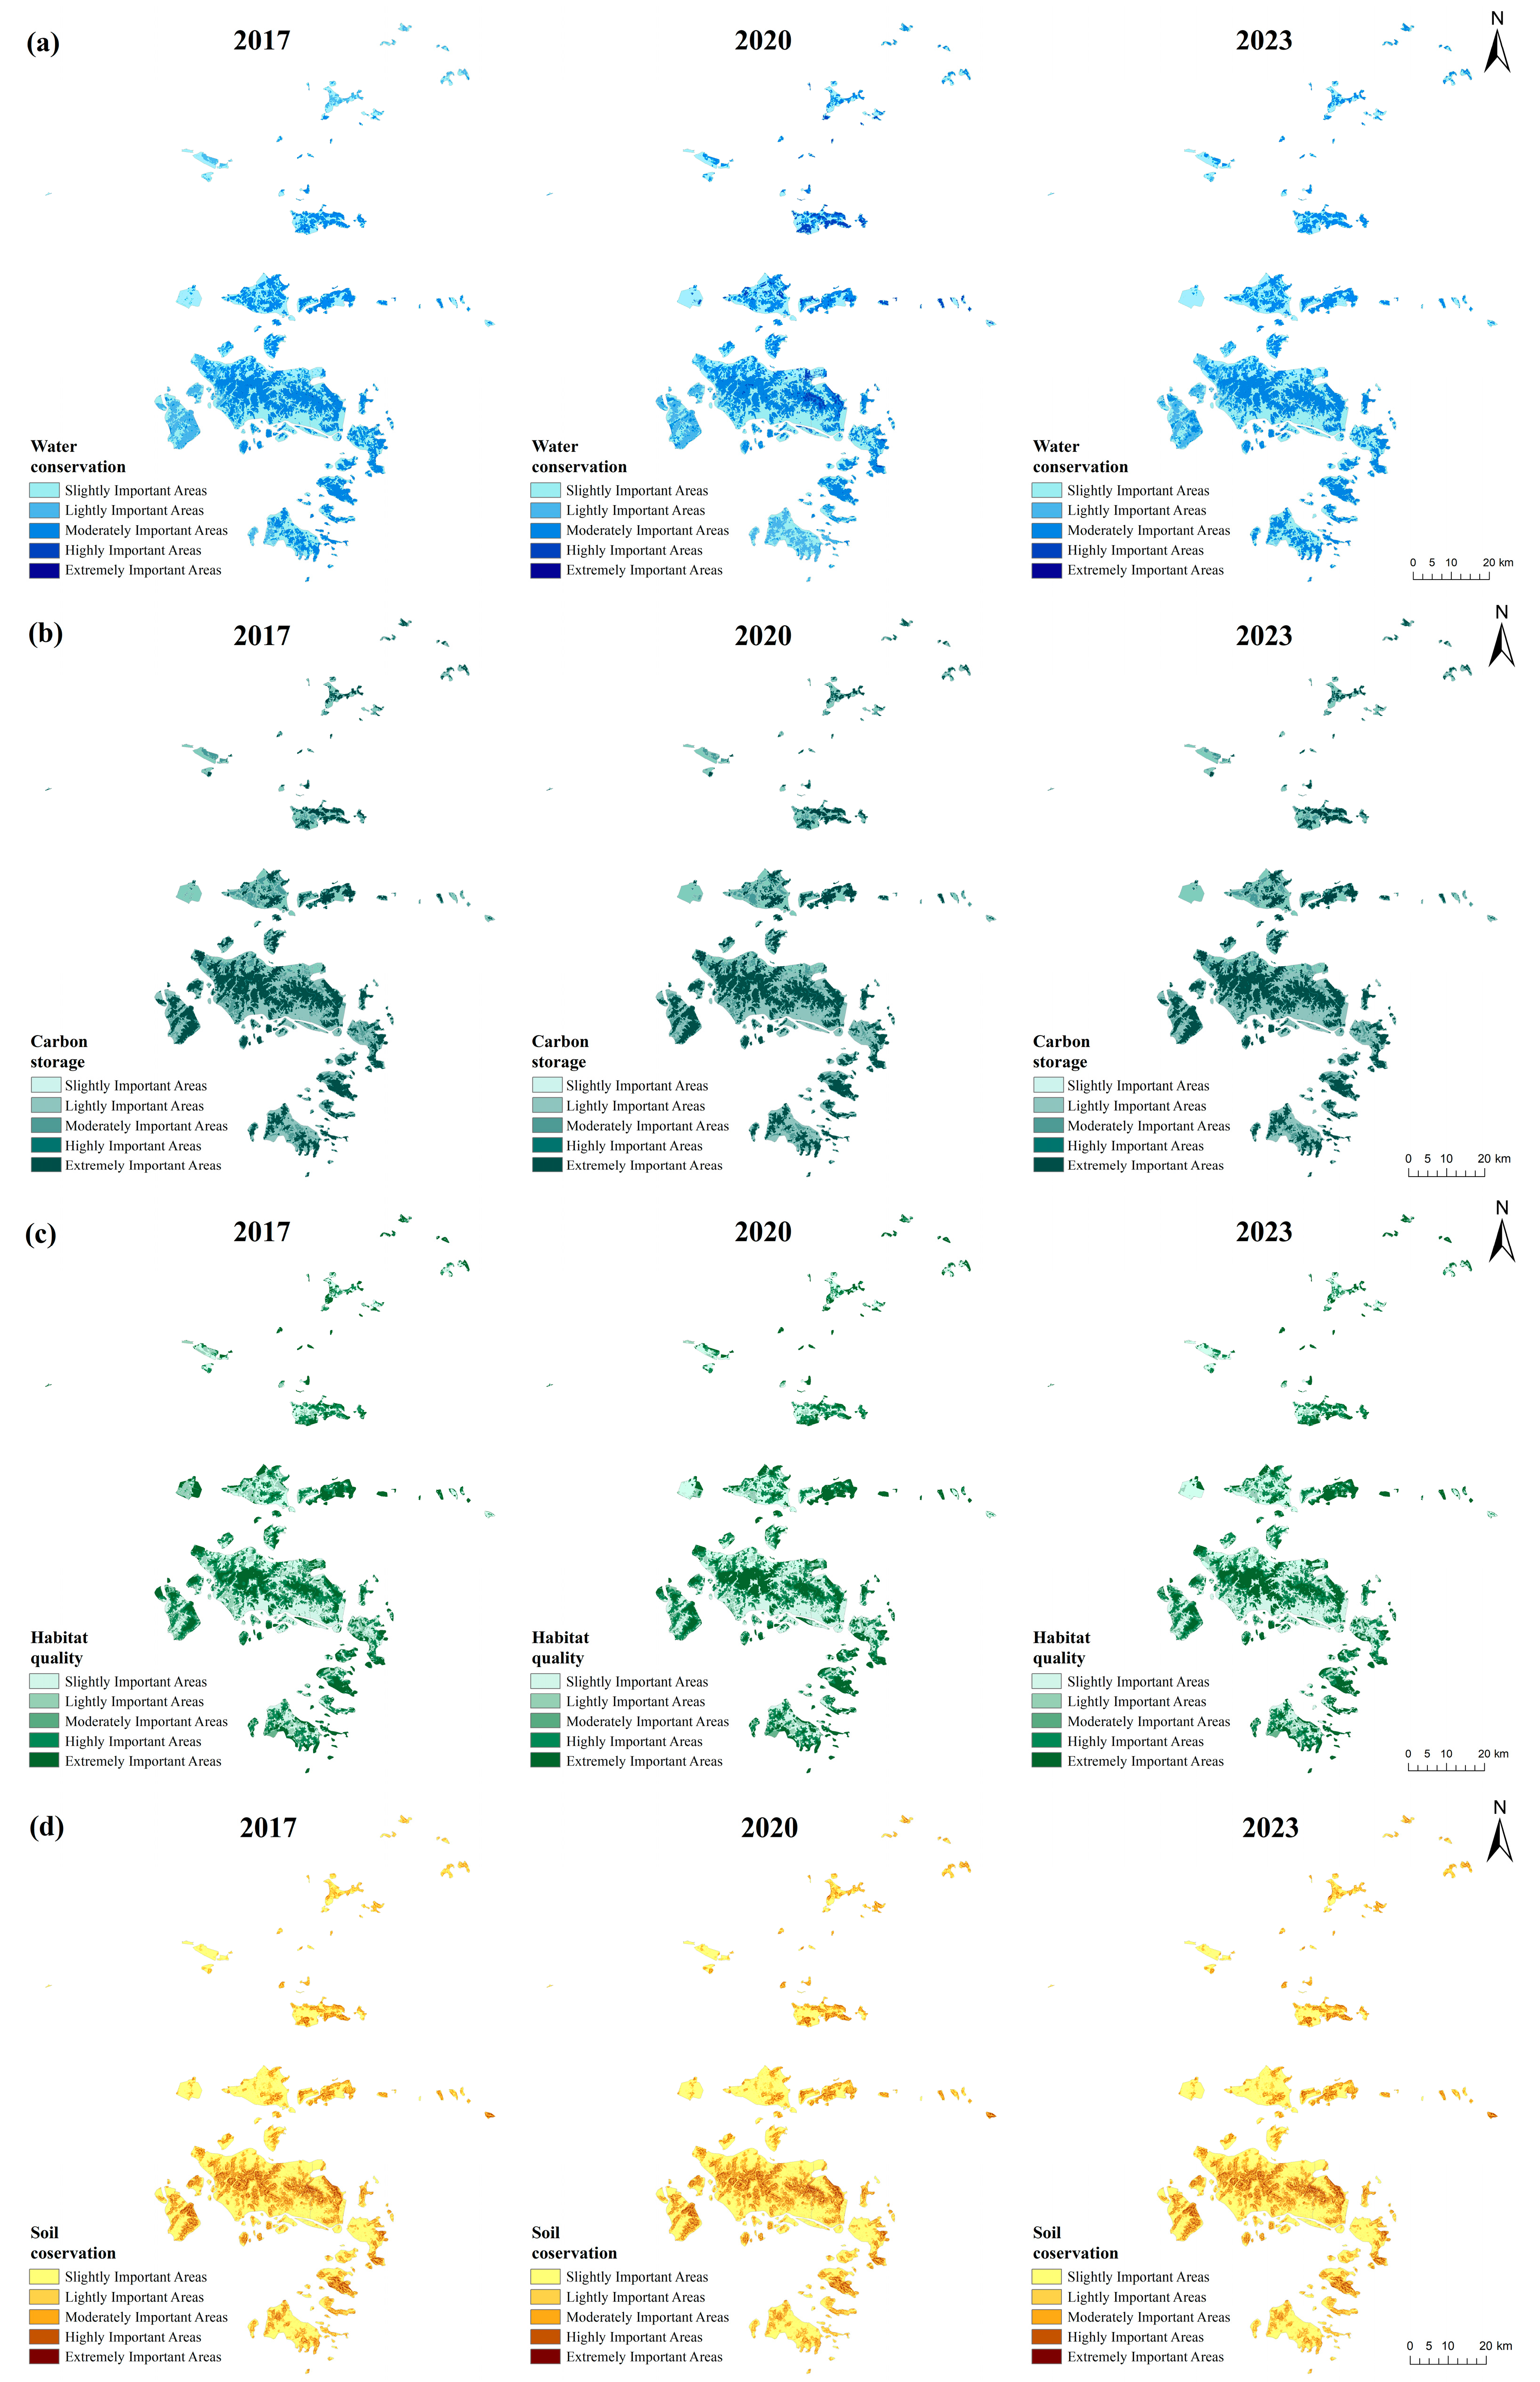
3.1. Evaluation of the Importance of Each Ecosystem Service Function in Zhoushan Archipelago

To further analyze the spatial differentiation of ecosystem service functions, the results were all divided into five grades: slightly important areas (0–0.2), lightly important areas (0.2–0.4), moderately important areas (0.4–0.6), highly important areas (0.6–0.8), and extremely important areas (0.8–1), and the trends of the spatial distribution of the four services were basically the same in the three periods. The spatial distribution in 2023 was analyzed.
The spatial distribution of water conservation in the Zhoushan Archipelago (Figure 3a) shows that highly important areas and extremely important areas’ dispersed distribution is located in the central areas of Zhoushan Island, Changtu Island, Qushan Island, Xiushan Island, Putuo Island, Zhujiajian Island, and Taohua Island. Slightly important areas are mainly located in the offshore areas of Zhoushan Island, Yushan Island, Yangshan Island, Cezi Island, and Jintang Island. Highly important areas and extremely important areas account for 11.13% and 5.77% of the total area, respectively (Table 7), and their distribution is relatively scattered. Slightly important areas cover an area of 538.05 km2, accounting for about 40.01% of the total area, and are scattered on Zhujiajian Island, Liuheng Island, and other islands, except for some islands in the western region where the distribution is more concentrated.
The spatial distribution of carbon storage in the Zhoushan Archipelago shows obvious differentiation, and the distribution pattern of carbon storage among different islands is not the same (Figure 3b). Highly important and extremely important areas are mainly concentrated in the central areas of Zhoushan Island, Changtu Island, Jintang Island, Putuo Island, and Taohua Island. Slightly important areas are mainly distributed in the offshore areas of Zhoushan Island, Yushan Island, Yangshan Island, and Liuhang Island. Highly important areas and extremely important areas of carbon storage accounted for 18.13% and 9.39% of the total area, respectively (Table 7), and their distribution is relatively scattered. Taohua Island, Jintang Island, and Changtu Island, which have higher topography among these islands, play an important role in carbon storage. In contrast, Yushan Island and Yangshan Island have the lowest carbon storage due to limited natural vegetation cover.
The spatial distribution of habitat quality in the Zhoushan Archipelago (Figure 3c) shows a patchy and scattered distribution of highly important and extremely important areas, which are mainly distributed in the central areas of Zhoushan Island, Changtu Island, Putuo Island, Jinzhai Island, Qushan Island, and Taohua Island. Though extremely important areas account for a relatively small proportion of the total area of the Zhoushan Archipelago, they play an important role in biodiversity conservation; the slightly important areas are centrally distributed in the offshore areas of Zhoushan Island, Yushan Island, Yangshan Island, and Gouqi Island. Habitat quality importance types are dominated by slightly important areas and lightly important areas, with areas and percentages of 524.43 km2, 238.84 km2, 38.43%, and 17.50%, respectively (Table 7). The extremely important areas for habitat quality in the research area are concentrated in areas with high terrain, high natural vegetation cover, and rich species resources.
The spatial distribution of soil conservation in the Zhoushan Archipelago (Figure 3d) has a patchy and scattered distribution of highly important and extremely important areas, mainly distributed in the central areas of Zhoushan Island, Changtu Island, Zhongjieshan Archipelago, Shengsi Archipelago, Putuo Island, and Taohua Island, while slightly important areas are concentrated in the offshore areas of Zhoushan Island, Yangshan Island, Daishan Island, Liuhang Island, and Yushan Island. Soil conservation importance types are mainly dominated by slightly important areas and lightly important areas, with an area and proportion of 744.7 km2, 244.9 km2, 54.69%, and 17.99%, respectively (Table 7). In the Zhoushan Archipelago, areas with higher vegetation cover have higher soil retention rates, a better overall ecological environment, and a stronger soil retention capacity. On the other hand, some of the islands with low vegetation cover generally have low soil retention rates, mainly due to insufficient vegetation cover in the region, which, in consequence, leads to a relatively weak soil retention capacity.

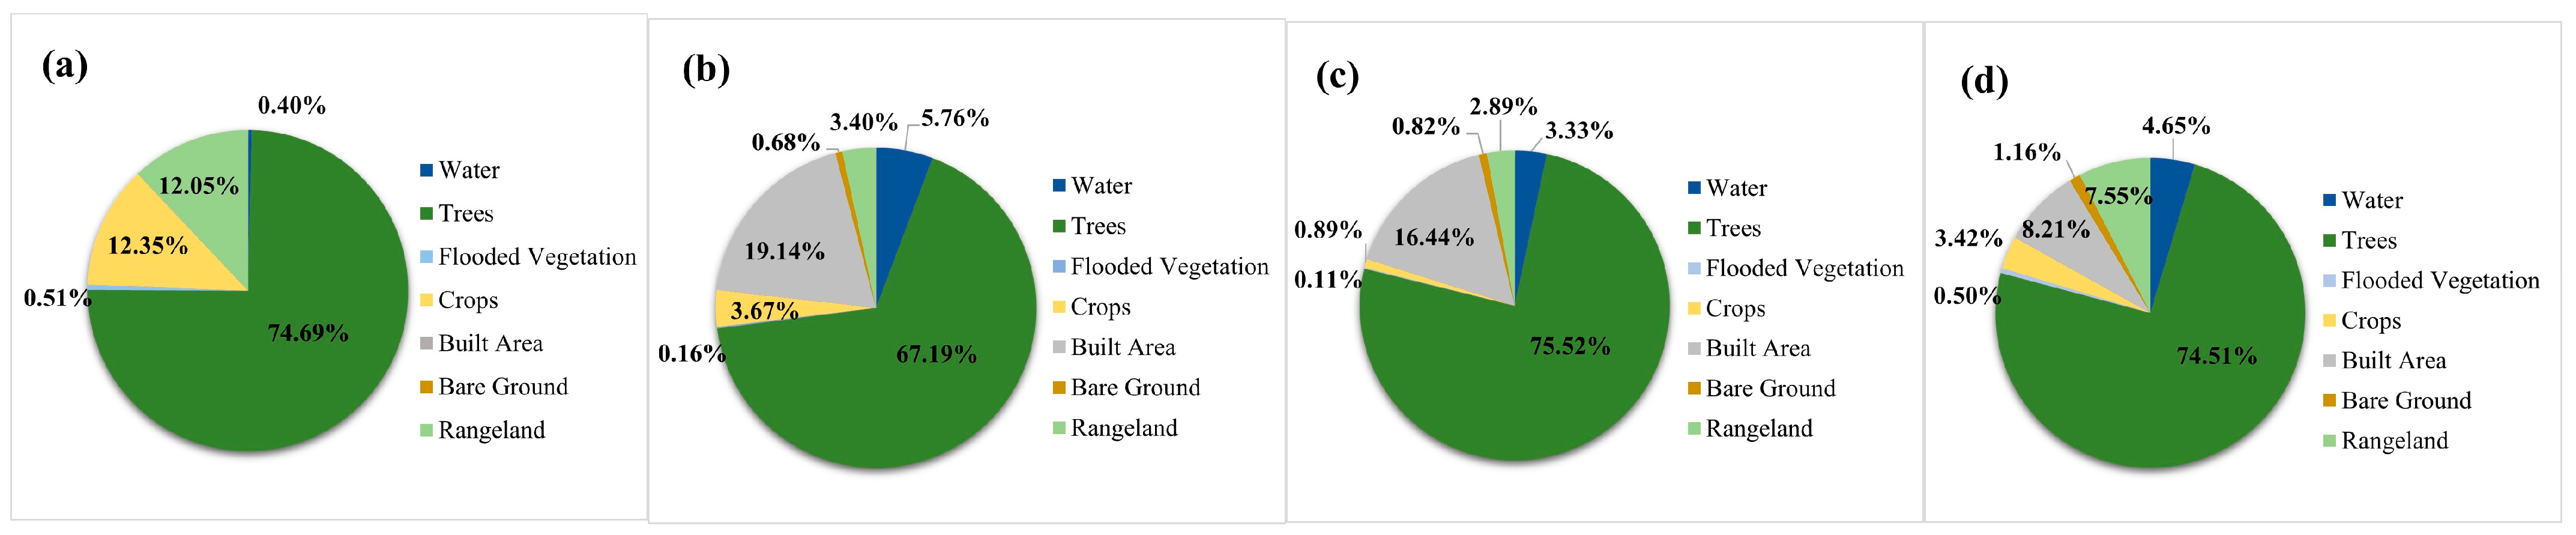
3.2. Statistics on Ecosystem Services in Zhoushan Archipelago

3.2.1. Kruskal–Wallis Test for Land Use Types and Ecosystem Service Functions

In this study, the normality of the data was first verified using the Shapiro–Wilk test, and the p-value of the test was less than 0.05. It indicated that the data did not conform to normal distribution and were statistically significant. According to the statistical norms, when the premise assumptions of parametric tests are not satisfied, non-parametric tests should be used. Therefore, the Kruskal–Wallis test was used in order to determine whether there might be significant differences between land use types and the four ecosystem services.
The results of the Kruskal–Wallis test showed that the land use type had a significant effect (p < 0.01) on the four services (Table 8). This indicates that land use type influences the assessment results of service functions.

3.2.2. The Primary Contributors to Four Ecosystem Services

Based on the evaluation results of ecosystem service importance in the Zhoushan Archipelago, the ecosystem services were normalized across seven land types. In terms of water conservation, trees contributed the most, accounting for 74.69% (Figure 4a), followed by cropland and rangeland, which accounted for 12.35% and 12.04%, respectively. For carbon storage, trees represented the largest share at approximately 67.19% (Figure 4b), followed by built area and waters, which accounted for 19.14% and 5.76%, respectively. The remaining land types contributed relatively small proportions. Regarding habitat quality, trees played a significant role in maintaining biodiversity, contributing 75.52% (Figure 4c). For soil conservation, trees were the primary contributors, accounting for 74.51% (Figure 4d), respectively. In summary, trees, built areas, cropland, and rangeland were the key contributors to the four ecosystem service functions, while bare ground and flooded vegetation had relatively low contributions due to their limited coverage.

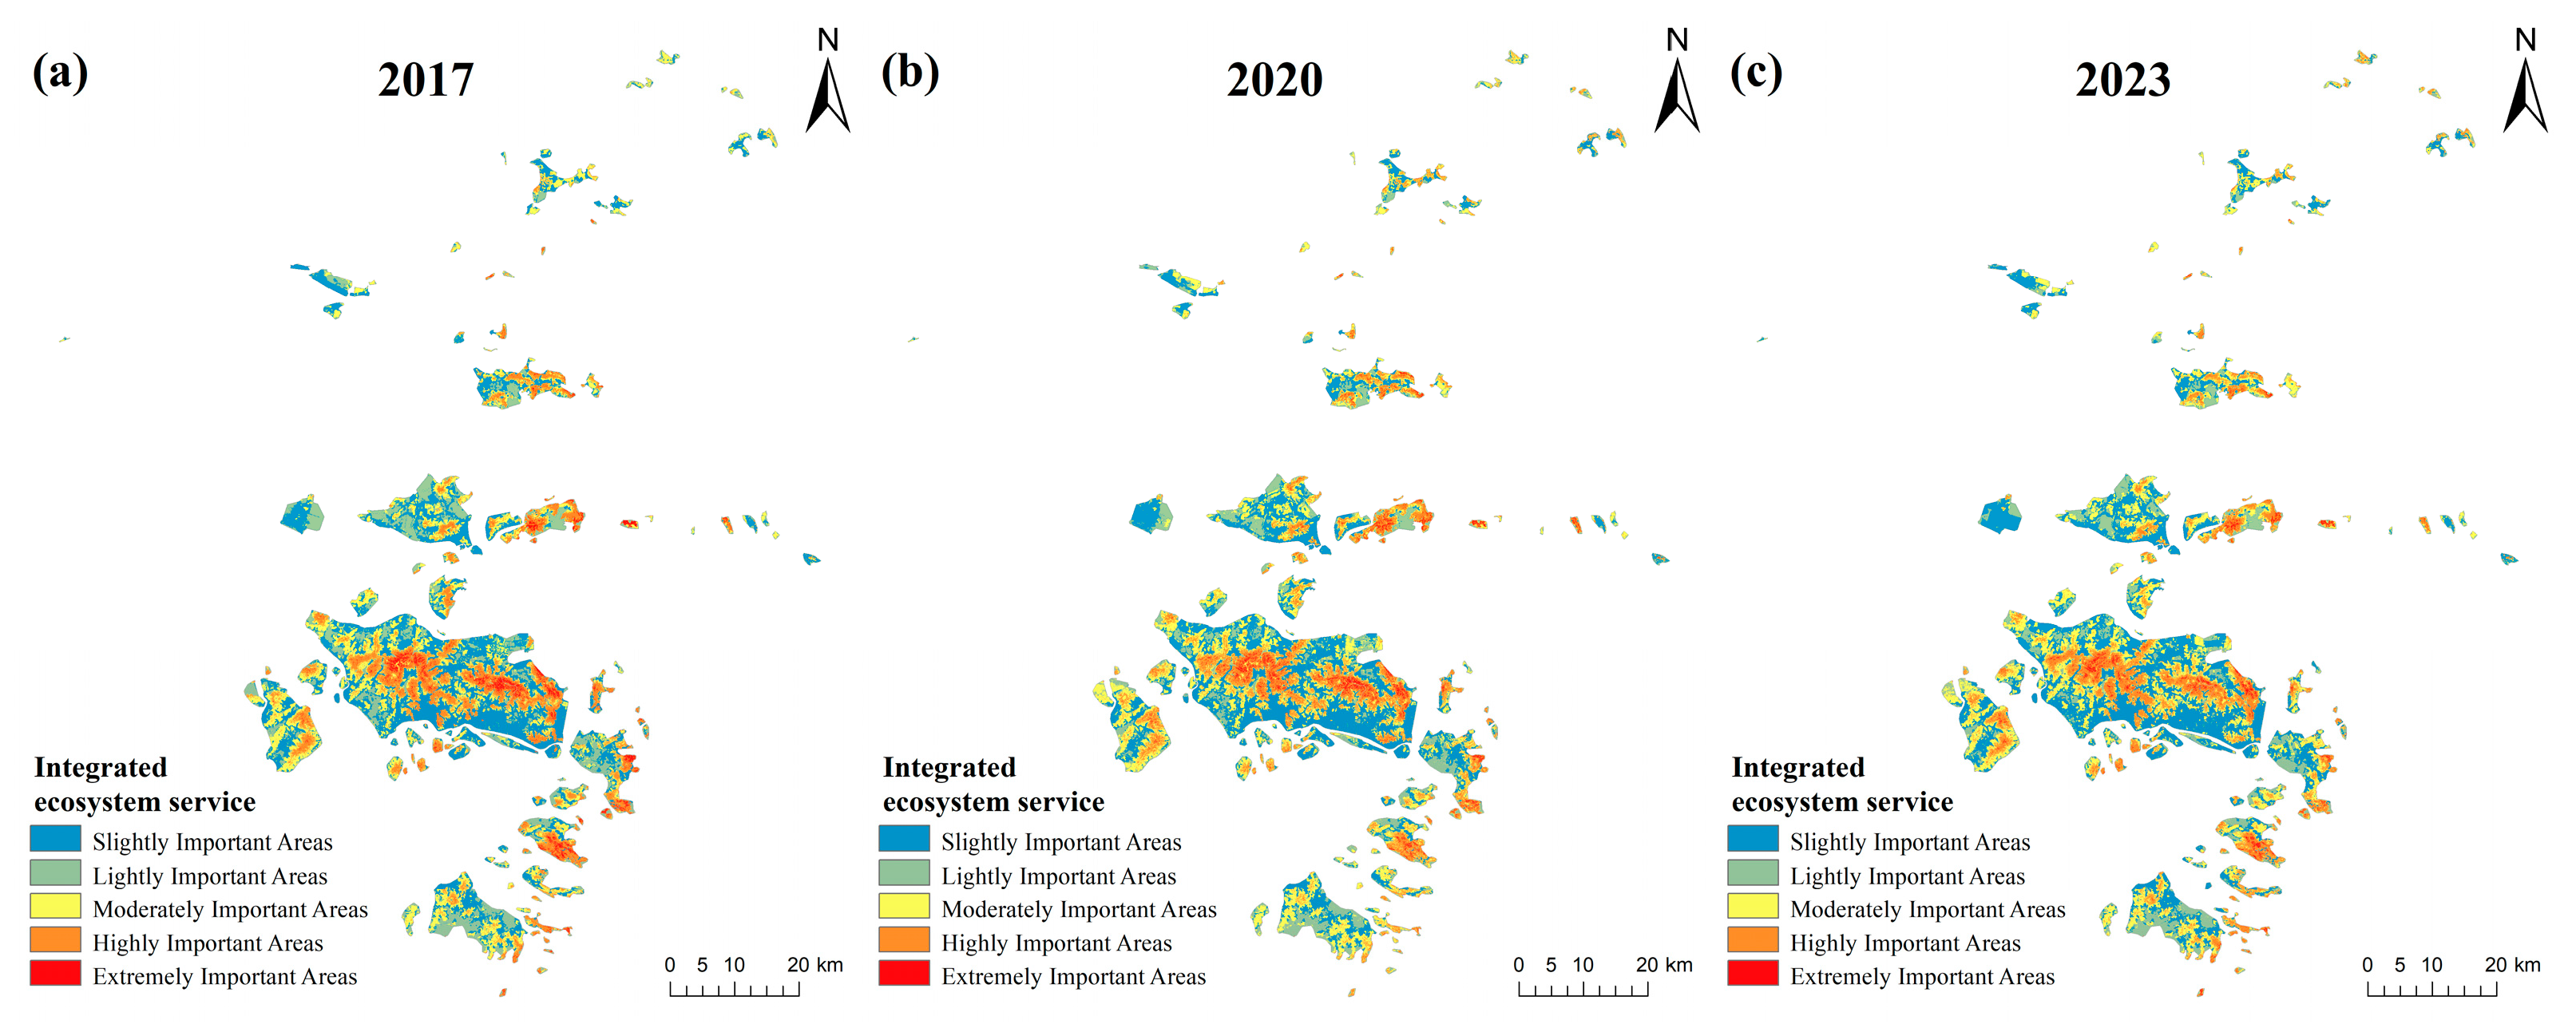
3.3. Integrated Ecosystem Service Assessment

The data on the four ecosystem service functions in Zhoushan City in 2017, 2020, and 2023 were standardized using principal component analysis (PCA).
Before performing principal component analysis on the four services, the correlation between the four services needs to be verified to determine whether the dataset is suitable for use in principal component analysis. According to Table 9, the KMO test coefficient is >0.6, and the significance probability p-value of Bartlett’s test of sphericity is <0.05, which indicates that the data satisfy the conditions for principal component analysis.
Based on the extraction principles of PCA, the contribution rate and cumulative contribution rate of each indicator were calculated (Table 10). A principal component with a cumulative contribution rate of 85.25% was identified, which encompassed the majority of the valid information from the original data. This principal component was suitable for assessing the importance of various ecosystem services in the Zhoushan Archipelago.
Through the PCA method for assigning the weight of the four ecosystem service functions, we obtained the weight of water conservation, carbon storage, habitat quality, and soil conservation for the target region of the Zhoushan Archipelago in 2017, 2020, and 2023 (Table 11).
The distribution of integrated ecosystem services in the study area in 2017, 2020, and 2023 was obtained by the weighted superimposition of the normalized values of the four services and equating them into five classes (Figure 5). The results were all divided into five grades: slightly important areas (0–0.2), lightly important areas (0.2–0.4), moderately important areas (0.4–0.6), highly important areas (0.6–0.8), and extremely important areas (0.8–1). The spatial pattern of the three years is basically consistent with the four ecosystem services, showing the same trend (Table 12). Slightly important areas are mainly concentrated in the offshore areas of Zhoushan Island, Yushan Island, and Yangshan Island. Lightly important areas are mainly distributed in Daishan Island and Zhujiajian Island. Moderately important areas are mainly distributed in Jintang Island and the Shengsi Archipelago. Highly important areas are mainly concentrated in the central areas of Zhoushan Island, Changtu Island, Qushan Island, and Taohua Island. Extremely important areas are distributed around highly important areas and are concentrated in the central regions of Zhoushan Island, Taotu Island, and Changtu Island. The highly important and extremely important areas account for 17.29% and 2.33% of the total area, respectively, while the slightly important areas account for the largest proportion, about 36.06%. Highly important areas and extremely important areas play an important role in maintaining the comprehensive ecological stability of the Zhoushan Archipelago region.

4. Discussion and Conclusions

4.1. Discussion

In 2023, the comprehensive evaluation of ecosystem services in the Zhoushan Archipelago revealed a spatial pattern characterized by lower values in the west and higher values in the east. This aligns with the Zhoushan City Land Space Ecological Restoration Plan (2021–2035), released by the Zhoushan City Department of Natural Resources and Planning in 2024, which proposes dividing the city into six major restoration zones: the offshore estuarine ecological reserve in the west, the offshore marine ecological restoration zone in the east, the habitat enhancement and ecological restoration zone in the Ningbo–Zhoushan metropolitan area, the ecological barrier restoration and conservation zone, the ecological island group protection zone, and the coastal wetland ecological restoration zone. Therefore, offshore areas and nature reserves should be prioritized for protection.
The spatial patterns of importance for each ecosystem service function are similar. For instance, the coastal area of Zhoushan Island, which has a high level of urbanization, exhibits low levels of water conservation, carbon storage, habitat quality, and soil conservation. This is primarily due to the expansion of urbanization [59]. The increase in impermeable surfaces has also degraded natural vegetation, reduced soil fertility, and increased soil erosion, further diminishing soil retention [60]. Additionally, higher population densities have disrupted natural habitats, resulting in low habitat quality [61]. Forest land, construction land, and water bodies are the primary land types in the Zhoushan Archipelago, playing a crucial role in ecosystem service functions. Therefore, a proportion of ecological land should be prioritized in future land space optimization [62].
With the national ecological civilization construction and the “dual carbon” goals gaining prominence, research on ecosystem service functions—such as water conservation, carbon storage, habitat quality, and soil retention—based on national land spatial patterns has become a key academic focus. Simultaneously, Zhoushan City is committed to building a strong manufacturing city with marine characteristics, aiming to achieve rapid economic development. Thus, it is crucial to balance economic growth with ecological protection [63].
In view of the characteristics of the spatial distribution of resources in the Zhoushan Archipelago, in the future process of land space control and ecosystem protection, a sub-island protection and construction land control proposal should be adopted [64,65]: (1) Zhoushan Island: As the core island of the city, Zhoushan Island contains rich coastline, wetlands, and urban green spaces. It is recommended to designate coastal ecological protection zones and strictly limit new coastal development. Total construction land should be strictly managed within the framework of the Territorial Spatial Master Plan, and new development projects must undergo rigorous ecological assessment. While short-term impacts may include longer investment–return cycles and stricter approval processes, the long-term benefits include urban branding, attracting high-quality investment, and achieving sustainable development. (2) Taohua Island, Zhongjieshan Archipelago, and Shengsi Archipelago: With their scenic island landscapes and intact marine environments, these islands are critical areas for coastal tourism and recreation. A tourism ecological protection zone should be established, emphasizing coastal protection and ecosystem function preservation. Although some high-return tourism projects may be restricted in the short term, long-term advantages include lower environmental management costs and sustainable tourism growth. (3) Liuheng Island and Xiazhi Island: These islands are dominated by marine fisheries and small residential communities. It is proposed to designate core fisheries protection zones, prohibiting large-scale development and conserving traditional fisheries culture. Strict ecological monitoring should be implemented, and illegal reclamation and shoreline damage should be strictly prohibited. While initial monitoring and planning costs may be high, this approach ensures the sustainable use of fishery resources and community resilience. (4) Qushan Island and Changtu Island: These islands are characterized by fragile ecological conditions, marine agriculture, and aquaculture activities. Strict marine ecological protection measures should be enforced, limiting large-scale construction and promoting eco-agriculture, marine farming, and eco-tourism. An ecological compensation mechanism should be introduced to incentivize local residents’ participation in conservation, limit illegal development, and support industrial transformation. While development restrictions may affect certain industries, long-term gains include reduced ecological degradation costs and sustainable industrial upgrading.
In 2005, Shenzhen, China, took the lead in drawing about 50 percent of its land area into the basic ecological control line, and now draws about 24 percent of its land area into the red line of ecological protection and builds 1238 parks. It is an important reference value for the delineation of the ecological protection red line in Zhoushan City, and this study proposes a phased implementation path [66,67]: (1) Short-term goals (1–3 years): Based on the zoning of ecosystem service importance across the Zhoushan Archipelago, core ecological protection areas, buffer zones, and moderate development zones will be clearly defined. Construction land on each island will be strictly controlled by the ecological red line and land use index, in alignment with territorial spatial planning. Digital supervision, utilizing remote sensing, GIS data management, and other technologies, will enable the real-time monitoring of construction land use and ecological changes. (2) Medium-term goals (3–8 years): Key ecological restoration projects: Ecological restoration efforts will focus on degraded areas affected by construction, particularly in the coastal zones of Zhoushan Island, Yushan Island, and Yangshan Island. Projects will include mangrove planting, wetland restoration, and the construction of ecological corridors to enhance connectivity between the archipelagos and strengthen ecosystem services. Social capital and private enterprises will be encouraged to invest in ecological restoration and green industries through an ecological compensation model. A phased assessment system will be established to regularly evaluate land use control, ecological restoration outcomes, and industrial transformation progress. (3) Long-term goals (8–15 years): Institutionalized management and sustainable development: Incorporate the Zhoushan Archipelago’s ecological protection and construction land use control into the overall planning and territorial spatial planning and ensure that the ecological red line and land use indicators are legally effective. Draw on Shenzhen’s practice of transforming the ecological control line from a policy tool to a legal control so as to achieve long-term stable management. Improve the mechanism for realizing the value of ecological products, convert the ecosystem service functions embedded in a good ecological environment into real economic value, and realize the high-level protection of the ecological environment in tandem with high-quality economic development. Regularly adjust ecological protection and construction land management measures to ensure that they respond to changing environmental and economic development needs.
This study assesses the spatial pattern of the importance of ecosystem services in the Zhoushan Archipelago, which provides a reference for identifying key protection areas and a scientific basis for sustainable development [68]. However, this study also has limitations. Because the parameters of the model are mostly based on the existing literature and the recommended parameters of the model, there may be some errors with the actual conditions. There are some small islands in the study area, which require high data accuracy and limit the data that can be collected. Comprehensive ecological assessment is inherently complex and multifaceted, and future research should take field surveys and incorporate more ecosystem service functions on this basis to further improve the results.

4.2. Conclusions

Using the InVEST model combined with principal component analysis, this study assessed the ecosystem service functions of Zhoushan City and revealed the contributions of different land use types to ecosystem service values. The main conclusions are as follows:
(1)
The spatial distribution of the importance of the four ecosystem services in the Zhoushan Archipelago exhibits a clear pattern. Highly important areas and extremely important areas for water conservation, carbon storage, habitat quality, and soil conservation are concentrated in the central areas of Zhoushan Island, Changtu Island, Qushan Island, Dengbu Island, and Taohua Island. Slightly important areas and lightly important areas for four services are concentrated in the offshore areas of Zhoushan Island, Yushan Island, and Yangshan Island.
(2)
Trees, built areas, rangeland, and cropland are significant contributors to the four ecosystem service functions, with trees playing the most substantial role across all functions.
(3)
The integrated function of the ecosystem service function of the Zhoushan Archipelago is generally favorable, but highly important and extremely important areas show a decreasing trend from 2017 to 2023, with highly important areas and extremely important areas accounting for 17.29% and 2.33% of the total area, respectively, in 2023. The ecological pattern is mainly concentrated in islands with higher terrain and rich forest resources, such as Taohua Island, Changtu Island, Qushan Island, and Zhujiajian Island.

Author Contributions

Conceptualization, M.L. and S.Z.; Methodology, M.L.; Software, M.L.; Validation, S.Z.; Resources, S.Z.; Data Curation, M.L.; Writing—Original Draft, M.L.; Writing—Review and Editing, S.Z.; Visualization, M.L.; Supervision, S.Z.; Project Administration, S.Z.; Funding Acquisition, S.Z. All authors have read and agreed to the published version of the manuscript.

Funding

This study is sponsored by the National Key R&D Program of China (No. 2019YFD0901204); the Fundamental Research Funds for Zhejiang Provincial Universities and Research Institutes (No. 2021JD006); the Key R&D Program of Zhejiang Province (No. 2019C02056); and the Zhoushan City Marine Special Protected Areas Survey Data Integration and Optimization Evaluation Project over the Years (No. SZGXZS2024090).

Institutional Review Board Statement

Not applicable.

Informed Consent Statement

Not applicable.

Data Availability Statement

Data are contained within the article.

Conflicts of Interest

The authors declare no conflicts of interest.

References

  1. Assessment, M.E. Ecosystems and Human Well-Being: Biodiversity Synthesis; World Resources Institute: Washington, DC, USA, 2005; Volume 86. [Google Scholar]
  2. Shoyama, K.; Kamiyama, C.; Morimoto, J.; Ooba, M.; Okuro, T. A review of modeling approaches for ecosystem services assessment in the Asian region. Ecosyst. Serv. 2017, 26, 316–328. [Google Scholar] [CrossRef]
  3. Liu, Y.; Wu, H.; Xue, J. The invasion and its impact for the spread of Chthamalus challengeri in Zhoushan sea area. J. Fish. China 2014, 38, 1047–1055. [Google Scholar]
  4. Wang, D.; Yu, M.; Mo, W.; Lv, D.A.; Cheng, J.; Sun, L. Ecological Safety Evaluation for Water Resources of China Based on Pressure-State-Response Model: A Case from Zhoushan Archipelago. Nat. Environ. Pollut. Technol. 2021, 20, 601–612. [Google Scholar] [CrossRef]
  5. Zhang, H.; Xiao, Y. Planning island sustainable development policy based on the theory of ecosystem services: A case study of Zhoushan Archipelago, East China. Isl. Stud. J. 2020, 15, 237–252. [Google Scholar] [CrossRef]
  6. Tang, R.; Cai, L.; Yan, X.; Ye, X.; Xu, Y.; Yin, J. Study of the Response of Environmental Factors of the Coastal Area in Zhoushan Fishery to Typhoon In-fa Based on Remote Sensing. Remote Sens. 2023, 15, 3349. [Google Scholar] [CrossRef]
  7. Gianuca, K.; Silva, T.; Asmus, M. Ecosystem-based spatial modeling: Assessing the supply of hydrological services in a watershed in Southern Brazil. Ecol. Model. 2024, 492, 110723. [Google Scholar] [CrossRef]
  8. Pashanejad, E.; Thierry, H.; Robinson, B.E.; Parrott, L. The application of semantic modelling to map pollination service provisioning at large landscape scales. Ecol. Model. 2023, 484, 110452. [Google Scholar] [CrossRef]
  9. Wu, J.; Yang, X. Assessment of Ecological Carrying Capacity in Xilingol League Based on Three-Dimensional Ecological Footprint Model. Sustainability 2025, 17, 128. [Google Scholar] [CrossRef]
  10. Liu, M.; Tu, Z.; Xu, X.; Wang, Z.; Wang, Y. A data-driven approach for constructing multilayer network-based service ecosystem models. Softw. Syst. Model. 2023, 22, 919–939. [Google Scholar] [CrossRef]
  11. Sherrouse, B.C.; Semmens, D.J.; Ancona, Z.H. Social Values for Ecosystem Services (SolVES): Open-source spatial modeling of cultural services. Environ. Model. Softw. 2022, 148, 105259. [Google Scholar] [CrossRef]
  12. Chen, X.; Yu, L.; Du, Z.; Xu, Y.; Zhao, J.; Zhao, H.; Zhang, G.; Peng, D.; Gong, P. Distribution of ecological restoration projects associated with land use and land cover change in China and their ecological impacts. Sci. Total Environ. 2022, 825, 153938. [Google Scholar] [CrossRef] [PubMed]
  13. Yang, Q.; Zhang, P.; Qiu, X.; Xu, G.; Chi, J. Spatial-temporal variations and trade-offs of ecosystem services in Anhui Province, China. Int. J. Environ. Res. Public Health 2023, 20, 855. [Google Scholar] [CrossRef] [PubMed]
  14. Fan, L.; Wang, X.; Chen, Z.; Chen, R.; Liu, X.; He, Y.; Wang, S. Analysis of Spatial and Temporal Evolution of Ecosystem Services and Driving Factors in the Yellow River Basin of Henan Province, China. Forests 2024, 15, 1547. [Google Scholar] [CrossRef]
  15. Miao, P.; Li, C.; Xia, B.; Zhao, X.; Wu, Y.; Zhang, C.; Wu, J.; Cheng, F.; Pu, J.; Huang, P.; et al. Incorporating Ecosystem Service Trade-Offs and Synergies with Ecological Sensitivity to Delineate Ecological Functional Zones: A Case Study in the Sichuan-Yunnan Ecological Buffer Area, China. Land 2024, 13, 1503. [Google Scholar] [CrossRef]
  16. Lei, J.; Zhang, L.; Wu, T.; Chen, X.; Li, Y.; Chen, Z. Spatial-temporal evolution and driving factors of water yield in three major drainage basins of Hainan Island based on land use change. Front. For. Glob. Chang. 2023, 6, 1131264. [Google Scholar] [CrossRef]
  17. Yao, X.; Zhou, L.; Wu, T.; Yang, X.; Ren, M. Ecosystem services in National Park of Hainan Tropical Rainforest of China: Spatiotemporal dynamics and conservation implications. J. Nat. Conserv. 2024, 80, 126649. [Google Scholar] [CrossRef]
  18. Lai, J.; Qi, S.; Chen, J.; Guo, J.; Wu, H.; Chen, Y. Exploring the spatiotemporal variation of carbon storage on Hainan Island and its driving factors: Insights from InVEST, FLUS models, and machine learning. Ecol. Indic. 2025, 172, 113236. [Google Scholar] [CrossRef]
  19. Wu, Q.; Wang, L.; Wang, T.; Ruan, Z.; Du, P. Spatial–temporal evolution analysis of multi-scenario land use and carbon storage based on PLUS-InVEST model: A case study in Dalian, China. Ecol. Indic. 2024, 166, 112448. [Google Scholar] [CrossRef]
  20. Qiu, S.; Yue, W.; Zhang, H.; Qi, J. Island ecosystem services value, land-use change, and the National New Area Policy in Zhoushan Archipelago, China. Isl. Stud. J. 2017, 12, 177–198. [Google Scholar] [CrossRef]
  21. Shao, X.; Jing, C.; Qi, J.; Jiang, J.; Liu, Q.; Cai, X. Impacts of land use and planning on island ecosystem service values: A case study of Dinghai District on Zhoushan Archipelago, China. Ecol. Process. 2017, 6, 27. [Google Scholar] [CrossRef]
  22. Xiao, Y.; Zhang, H.; Ma, K.; Perera, H.A.C.C.; Ramli, M.Z.; Deng, Y. Exploring the Relationships between Tradeoffs and Synergies among Island Ecosystem Service Bundles: A Study on Zhoushan Archipelago Located on the Southeast Coast of China. Sustainability 2024, 16, 394. [Google Scholar] [CrossRef]
  23. Cao, W.; Zhou, Y.; Li, R.; Li, X.; Zhang, H. Monitoring long-term annual urban expansion (1986–2017) in the largest archipelago of China. Sci. Total Environ. 2021, 776, 146015. [Google Scholar] [CrossRef]
  24. Zhou, B.; Xu, J.M.; Yu, H.; Wang, L.T. Comprehensive assessment of ecological risks of Island destinations—A case of Mount Putuo Island, China. Ecol. Indic. 2023, 154, 110783. [Google Scholar] [CrossRef]
  25. Li, W.; Geng, J.; Bao, J.; Lin, W.; Wu, Z.; Fan, S. Analysis of spatial and temporal variations in ecosystem service functions and drivers in Anxi county based on the InVEST model. Sustainability 2023, 15, 10153. [Google Scholar] [CrossRef]
  26. He, F.; Jin, J.; Zhang, H.; Yuan, L. The change of ecological service value and the promotion mode of ecological function in mountain development using InVEST model. Arab. J. Geosci. 2021, 14, 510. [Google Scholar] [CrossRef]
  27. Zhang, L.; Hickel, K.; Dawes, W.R.; Chiew, F.H.; Western, A.W.; Briggs, P.R. A rational function approach for estimating mean annual evapotranspiration. Water Resour. Res. 2004, 40, 89–97. [Google Scholar] [CrossRef]
  28. Donohue, R.J.; Roderick, M.L.; McVicar, T.R. Roots, storms and soil pores: Incorporating key ecohydrological processes into Budyko’s hydrological model. J. Hydrol. 2012, 436, 35–50. [Google Scholar] [CrossRef]
  29. Li, M.; Liang, D.; Xia, J.; Song, J.; Cheng, D.; Wu, J.; Cao, Y.; Sun, H.; Li, Q. Evaluation of water conservation function of Danjiang River Basin in Qinling Mountains, China based on InVEST model. J. Environ. Manag. 2021, 286, 112212. [Google Scholar] [CrossRef]
  30. Zhang, B.; Li, W.; Xie, G.; Xiao, Y. Water conservation of forest ecosystem in Beijing and its value. Ecol. Econ. 2010, 69, 1416–1426. [Google Scholar]
  31. Wang, Y.; Ye, A.; Peng, D.; Miao, C.; Di, Z.; Gong, W. Spatiotemporal variations in water conservation function of the Tibetan Plateau under climate change based on InVEST model. J. Hydrol. Reg. Stud. 2022, 41, 101064. [Google Scholar] [CrossRef]
  32. Geng, J.; Yuan, M.; Xu, S.; Bai, T.; Xiao, Y.; Li, X.; Xu, D. Urban expansion was the main driving force for the decline in ecosystem services in hainan island during 1980–2015. Int. J. Environ. Res. Public Health 2022, 19, 15665. [Google Scholar] [CrossRef] [PubMed]
  33. Yin, L.; Zheng, W.; Shi, H.; Ding, D. Ecosystem services assessment and sensitivity analysis based on ANN model and spatial data: A case study in Miaodao Archipelago. Ecol. Indic. 2022, 135, 108511. [Google Scholar] [CrossRef]
  34. Quan, W.; Huang, X.; Xu, G.; Hao, J.; Lv, K.; Jiang, X. Study on the influence mechanism of land use on carbon storage under multiple scenarios: A case study of Wenzhou. Open Geosci. 2024, 16, 20220735. [Google Scholar] [CrossRef]
  35. Zhang, S.; Sun, C.; Zhang, Y.; Hu, M.; Shen, X. Exploring the spatiotemporal changes and driving forces of ecosystem services of Zhejiang coasts, China, under sustainable development goals. Chin. Geogr. Sci. 2024, 34, 647–661. [Google Scholar] [CrossRef]
  36. Cao, W.; Li, R.; Chi, X.; Chen, N.; Chen, J.; Zhang, H.; Zhang, F. Island urbanization and its ecological consequences: A case study in the Zhoushan Island, East China. Ecol. Indic. 2017, 76, 1–14. [Google Scholar] [CrossRef]
  37. Jia, X.; Zhu, J.; Li, Y.; Wu, W.; Hu, X. Analysis of the driving role and impact of road construction on carbon stock. Environ. Sci. Pollut. Res. 2023, 30, 67131–67149. [Google Scholar] [CrossRef]
  38. Wen, J.; Fu, W. Spatial and Temporal Variability of Ecosystem Support Services and Drivers in Metropolitan Areas Based on the Invest Model. ISPRS Ann. Photogramm. Remote Sens. Spat. Inf. Sci. 2022, 10, 29–35. [Google Scholar] [CrossRef]
  39. Wang, B.; Cheng, W. Effects of land use/cover on regional habitat quality under different geomorphic types based on InVEST model. Remote Sens. 2022, 14, 1279. [Google Scholar] [CrossRef]
  40. Luo, X.; Luo, Y.; Le, F.; Zhang, Y.; Zhang, H.; Zhai, J. Spatiotemporal Variation and Prediction Analysis of Land Use/Land Cover and Ecosystem Service Changes in Gannan, China. Sustainability 2024, 16, 1551. [Google Scholar] [CrossRef]
  41. Kim, T.; Song, C.; Lee, W.-K.; Kim, M.; Lim, C.H.; Jeon, S.W.; Kim, J. Habitat quality valuation using InVEST model in Jeju Island. J. Korean Soc. Environ. Restor. Technol. 2015, 18, 1–11. [Google Scholar] [CrossRef]
  42. Chen, Y.; Zhang, F.; Lin, J. Projecting Future Land Use Evolution and Its Effect on Spatiotemporal Patterns of Habitat Quality in China. Appl. Sci. 2025, 15, 1042. [Google Scholar] [CrossRef]
  43. Moreira, M.; Fonseca, C.; Vergílio, M.; Calado, H.; Gil, A. Spatial assessment of habitat conservation status in a Macaronesian island based on the InVEST model: A case study of Pico Island (Azores, Portugal). Land Use Policy 2018, 78, 637–649. [Google Scholar] [CrossRef]
  44. Wei, Q.; Abudureheman, M.; Halike, A.; Yao, K.; Yao, L.; Tang, H.; Tuheti, B. Temporal and spatial variation analysis of habitat quality on the PLUS-InVEST model for Ebinur Lake Basin, China. Ecol. Indic. 2022, 145, 109632. [Google Scholar] [CrossRef]
  45. He, N.; Guo, W.; Wang, H.; Yu, L.; Cheng, S.; Huang, L.; Jiao, X.; Chen, W.; Zhou, H. Temporal and spatial variations in landscape habitat quality under multiple land-use/land-cover scenarios based on the PLUS-InVEST model in the Yangtze River Basin, China. Land 2023, 12, 1338. [Google Scholar] [CrossRef]
  46. Ai, B.; Tian, Y.; Wang, P.; Gan, Y.; Luo, F.; Shi, Q. Vulnerability analysis of coastal zone based on InVEST model in Jiaozhou Bay, China. Sustainability 2022, 14, 6913. [Google Scholar] [CrossRef]
  47. Jian, Z.; Sun, Y.; Wang, F.; Zhou, C.; Pan, F.; Meng, W.; Sui, M. Soil conservation ecosystem service supply-demand and multi scenario simulation in the Loess Plateau, China. Glob. Ecol. Conserv. 2024, 49, e02796. [Google Scholar] [CrossRef]
  48. Wang, X.; Liu, X.; Wu, Y.; Chen, R.; Wang, S. Dynamic assessment and change analysis of ecosystem service value based on physical assessment method in Cili County, China. Forests 2023, 14, 869. [Google Scholar] [CrossRef]
  49. Wenger, A.S.; Atkinson, S.; Santini, T.; Falinski, K.; Hutley, N.; Albert, S.; Horning, N.; Watson, J.E.M.; Mumby, P.J.; Jupiter, S.D. Predicting the impact of logging activities on soil erosion and water quality in steep, forested tropical islands. Environ. Res. Lett. 2018, 13, 044035. [Google Scholar] [CrossRef]
  50. Du, R.; Liu, B.; Chen, Z.; Xu, M. Exploring the multiscale island terrestrial ecosystem service relationships and coastal vulnerability under the influence of coastal ecosystems. Ocean. Coast. Manag. 2024, 256, 107267. [Google Scholar] [CrossRef]
  51. Inácio, M.; Baltranaitė, E.; Bogdzevič, K.; Kalinauskas, M.; Pinto, L.V.; Barceló, D.; Pereira, P. Mapping and assessing the future provision of lake ecosystem services in Lithuania. J. Environ. Manag. 2024, 372, 123349. [Google Scholar] [CrossRef]
  52. Fentaw, G.; Beneberu, G.; Wondie, A.; Eneyew, B.G. Ecosystem services of wetlands in the upper Abbay River basin, Ethiopia. Ecol. Indic. 2025, 171, 113142. [Google Scholar] [CrossRef]
  53. Jolliffe, I.T.; Cadima, J. Principal component analysis: A review and recent developments. Philos. Trans. R. Soc. A Math. Phys. Eng. Sci. 2016, 374, 20150202. [Google Scholar] [CrossRef] [PubMed]
  54. Bai, Y.; Zhuang, C.; Ouyang, Z.; Zheng, H.; Jiang, B. Spatial characteristics between biodiversity and ecosystem services in a human-dominated watershed. Ecol. Complex. 2011, 8, 177–183. [Google Scholar] [CrossRef]
  55. Abdi, H.; Williams, L.J. Principal component analysis. Wiley Interdiscip. Rev. Comput. Stat. 2010, 2, 433–459. [Google Scholar] [CrossRef]
  56. Salata, S.; Grillenzoni, C. A spatial evaluation of multifunctional Ecosystem Service networks using Principal Component Analysis: A case of study in Turin, Italy. Ecol. Indic. 2021, 127, 107758. [Google Scholar] [CrossRef]
  57. Depellegrin, D.; Pereira, P.; Misiunė, I.; Egarter-Vigl, L. Mapping ecosystem services potential in Lithuania. Int. J. Sustain. Dev. World Ecol. 2016, 23, 441–555. [Google Scholar] [CrossRef]
  58. Zou, T.; Yoshino, K. Environmental vulnerability evaluation using a spatial principal components approach in the Daxing’anling region, China. Ecol. Indic. 2017, 78, 405–415. [Google Scholar] [CrossRef]
  59. Seto, K.C.; Sánchez-Rodríguez, R.; Fragkias, M. The new geography of contemporary urbanization and the environment. Annu. Rev. Environ. Resour. 2010, 35, 167–194. [Google Scholar] [CrossRef]
  60. He, C.; Zhang, D.; Huang, Q.; Zhao, Y. Assessing the potential impacts of urban expansion on regional carbon storage by linking the LUSD-urban and InVEST models. Environ. Model. Softw. 2016, 75, 44–58. [Google Scholar] [CrossRef]
  61. Hong, H.-J.; Kim, C.-K.; Lee, H.-W.; Lee, W.-K. Conservation, restoration, and sustainable use of biodiversity based on habitat quality monitoring: A case study on Jeju Island, South Korea (1989–2019). Land 2021, 10, 774. [Google Scholar] [CrossRef]
  62. De Groot, R.S.; Wilson, M.A.; Boumans, R.M. A typology for the classification, description and valuation of ecosystem functions, goods and services. Ecol. Econ. 2002, 41, 393–408. [Google Scholar] [CrossRef]
  63. Li, J.; Liu, Y.; Gani, A.A.; Wu, J.; Dai, Y. Identification of ecological security patterns for the Qiandongnan Ecotourism Area in Southwest China using InVEST and circuit theory. Forests 2023, 14, 1316. [Google Scholar] [CrossRef]
  64. Butsic, V.; Shapero, M.; Moanga, D.; Larson, S. Using InVEST to assess ecosystem services on conserved properties in Sonoma County, CA. Calif. Agric. 2017, 71, 81–89. [Google Scholar] [CrossRef]
  65. Wang, R.; Zhao, J.; Chen, G.; Lin, Y.; Yang, A.; Cheng, J. Coupling PLUS–InVEST model for ecosystem service research in Yunnan Province, China. Sustainability 2022, 15, 271. [Google Scholar] [CrossRef]
  66. Zhang, S.; Zhang, Z.; Wang, J.; Zhang, Y.; Wu, J.; Zhang, X. Effects of ecological control line on habitat connectivity: A case study of Shenzhen, China. Ecol. Indic. 2024, 167, 112583. [Google Scholar] [CrossRef]
  67. Hong, W.; Yang, C.; Chen, L.; Zhang, F.; Shen, S.; Guo, R. Ecological control line: A decade of exploration and an innovative path of ecological land management for megacities in China. J. Environ. Manag. 2017, 191, 116–125. [Google Scholar] [CrossRef]
  68. Arcidiacono, A.; Ronchi, S.; Salata, S. Ecosystem Services assessment using InVEST as a tool to support decision making process: Critical issues and opportunities. In Proceedings of the International Conference on Computational Science and Its Applications, Banff, AB, Canada, 22–25 June 2015; Springer International Publishing: Cham, Switzerland, 2015; Volume 9158, pp. 35–49. [Google Scholar]
Figure 1. Location map of the study area.
Sustainability 17 03913 g001
Figure 2. The research framework used in this study.
Sustainability 17 03913 g002
Figure 3. Spatial distribution of ecosystem services in the study area. (a) Water conservation; (b) carbon storage; (c) habitat quality; (d) soil conservation.
Sustainability 17 03913 g003
Figure 4. Breakdown of ecosystem service statistics. (a) Water conservation; (b) carbon storage; (c) habitat quality; (d) soil conservation.
Sustainability 17 03913 g004
Figure 5. Integrated assessment of ecosystem services in the Zhoushan Archipelago. (a) 2017; (b) 2020; (c) 2023.
Sustainability 17 03913 g005
Table 1. Data source and processing methods.
DataData Source and Processing Method
Land useLand use types for 2017, 2020, and 2023 come from ESRI (https://livingatlas.arcgis.com, accessed on 16 October 2024), with a spatial resolution of 10 m.
PrecipitationData on average rainfall were sourced from the National Meteorological Information Centre (http://data.cma.cn, accessed on 22 March 2025), using data from meteorological stations in the Zhoushan Archipelago and Ningbo City. Seven years of precipitation data were obtained from 2017 to 2023, and 2017, 2020, and 2023 were selected as the characteristic years. To minimize the impact of extreme precipitation events, the average precipitation of the one year preceding and following each representative year was used to derive the characteristic values for each station. For spatial analysis, Kriging interpolation was applied using ArcGIS Spatial Analyst tools. The resulting interpolated data were clipped according to the administrative boundaries of the Zhoushan Archipelago to generate raster precipitation datasets for the three selected years.
Potential
evapotranspiration
Data on average annual temperature and rainfall were sourced from the National Meteorological Information Centre (http://data.cma.cn, accessed on 22 March 2025), calculated by the modified Hargreaves equation. After obtaining the results, Kriging interpolation was carried out for each meteorological station to obtain the reference evapotranspiration raster data for the study area.
Soil dataSoil type data are from the China Soil Database (http://vdb3.soil.csdb.cn/, accessed on 18 September 2024), including soil type, soil texture (%clay, %sand, %silt, %organic carbon), and soil depth, with a spatial resolution of 1000 m.
Digital
elevation model
The Geospatial Data Cloud (https://www.gscloud.cn/, accessed on 18 September 2024) provided the digital elevation model (DEM) data, with a spatial resolution of 30 m.
Topographic indexCalculations were made based on the DEM and soil depth using the spatial analysis tool in ArcGIS.
Soil saturated
hydraulic conductivity
Calculations were made based on soil texture data using the raster calculator tool in ArcGIS.
Percentage slopeCalculations were made based on DEM data using the slope tool in ArcGIS.
Rainfall erosion factorCalculations were made based on precipitation amounts using the Raster Calculator tool in ArcGIS.
Soil erosion factorCalculations were made based on soil texture data using the raster calculator tool in ArcGIS.
Table 2. Biophysical parameter table of water yield module.
LULCKcRoot Depth (mm)
Water1400
Trees13500
Flooded Vegetation0.83500
Crops0.65300
Built Area0.31
Bare Ground0.21
Rangeland0.651500
Table 3. Carbon density parameter table (Unit: t/ha).
LULC C a b o v e C b e l o w C s o i l C d e a d
Water0.685083.9620
Trees68.78121.734132.5728.131
Flooded Vegetation5.745.4777.650
Crops5.9611.27496.6350
Built Area6.51.467.30
Bare Ground0.113075.4310
Rangeland2.63510.043103.010.879
Table 4. Habitat resilience and threat factor susceptibility for the InVEST habitat quality model.
FactorMaximum Threat Range (Kilometers)WeightDistance Decay
Crops40.6Linear
Built Area81Exponential
Bare Ground20.4Linear
Table 5. Features of threat factors for the InVEST habitat quality model.
FactorHabitat ResilienceSusceptibility
CropsBuilt AreaBare Ground
Water0.90.30.50.3
Trees10.650.750.6
Flooded Vegetation0.90.550.70.55
Crops0.40.10.20.1
Built Area0000
Bare Ground0.20.10.20.1
Rangeland0.80.50.60.4
Table 6. Land use classification and CP assignment table for the InVEST SDR model.
LULC C x P x
Water00.2
Trees0.120.7
Flooded Vegetation0.340.2
Crops0.350.29
Built Area0.250.16
Bare Ground0.40.2
Rangeland0.30.5
Table 7. Areas and ratios of the study area classified as important for ecosystem services in 2023.
Ecosystem
Service
Function
ABCDE
Area
/km2
Ratio
/%
Area
/km2
Ratio
/%
Area
/km2
Ratio
/%
Area
/km2
Ratio
/%
Area
/km2
Ratio
/%
Water
Conservation
538.0540.01238.9417.77340.5925.33149.6311.1377.595.77
Carbon
Storage
441.0732.80234.3117.42299.3422.26243.8518.13126.239.39
Habitat
Quality
524.4338.43238.8417.50226.9916.63198.2514.53176.2912.92
Soil
Conservation
744.754.69244.917.99198.1214.55132.129.7041.793.07
Note: In the table, A, B, C, D, and E represent slightly important areas, lightly important areas, moderately important areas, highly important areas, and extremely important areas.
Table 8. The Kruskal–Wallis test results.
Ecosystem
Service
Function
Land UseNM
(P25, P75)
Zp
Water
Conservation
Water1910 (0, 0)1544.516<0.01
Trees74264.07 (59.04, 70.72)
Flooded Vegetation1371.93 (57.95, 87.12)
Crops9293.83 (92.31, 96.18)
Built Area7780 (0, 0)
Bare Ground310 (0, 0)
Rangeland112112.73 (98.79, 116.05)
Carbon
Storage
Water1910.85 (0.75, 0.85)1958.000<0.01
Trees7422.31 (2.31, 2.31)
Flooded Vegetation130.76 (0.75, 0.96)
Crops921.04 (0.75, 1.17)
Built Area7780.75 (0.75, 0.75)
Bare Ground310.75 (0.75, 0.76)
Rangeland1121.17 (0.85, 1.17)
Habitat
Quality
Water1910.96 (0.93, 0.98)1756.408<0.01
Trees7420.79 (0.73, 0.86)
Flooded Vegetation130.91 (0.86, 0.93)
Crops920.3 (0.3, 0.3)
Built Area7780.1 (0.1, 0.1)
Bare Ground310.4 (0.4, 0.4)
Rangeland1120.78 (0.74, 0.87)
Soil
Conservation
Water1910.31 (0.05, 1.34)634.720<0.01
Trees7424.67 (2.22, 7.37)
Flooded Vegetation130.05 (0.04, 0.42)
Crops920.05 (0.04, 0.8)
Built Area7780.75 (0.05, 1.83)
Bare Ground310.05 (0.04, 2.39)
Rangeland1121 (0.05, 2.63)
Table 9. KMO and Bartlett’s test results.
TestStatistic
201720202023
KMO 0.8420.8550.841
Bartlett’s testApprox. Chi-Square27,606.1124,252.9724,252.97
df666
Sig.0.0000.0000.000
Table 10. The results of spatial principal component analysis.
Principal
Component
EigenvaluesPercent of
Eigenvalues/%
Accumulative of
Eigenvalues/%
201713.4185.25185.251
20.3729.3194.561
30.1824.55899.119
40.0350.881100
202013.49787.42387.423
20.3258.11895.541
30.1132.82698.367
40.0651.633100
202313.40185.01485.251
20.3538.83694.561
30.1754.36599.119
40.0711.786100
Table 11. Weights of different ecosystem service indicators.
Ecosystem Service FunctionsWater
Yield
Soil
Conservation
Carbon
Storage
Habitat
Quality
20170.25 0.23 0.26 0.26
20200.23 0.25 0.26 0.26
20230.26 0.23 0.25 0.26
Table 12. Area and ratio of the study area of importance for ecosystem services.
Ecosystem
Service
Functions
ABCDE
Area
/km2
Ratio
/%
Area
/km2
Ratio
/%
Area
/km2
Ratio
/%
Area
/km2
Ratio
/%
Area
/km2
Ratio
/%
2017504.7733.81 299.99 20.09 348.17 23.32 296.47 19.86 43.65 2.92
2020514.5634.44 264.49 17.70 403.64 27.02 272.92 18.27 38.44 2.57
2023538.7536.06 244.61 16.37 417.67 27.96 258.28 17.29 34.75 2.33
Note: In the table, A, B, C, D, and E represent slightly important areas, lightly important areas, moderately important areas, highly important areas, and extremely important areas.
Disclaimer/Publisher’s Note: The statements, opinions and data contained in all publications are solely those of the individual author(s) and contributor(s) and not of MDPI and/or the editor(s). MDPI and/or the editor(s) disclaim responsibility for any injury to people or property resulting from any ideas, methods, instructions or products referred to in the content.

