Article

A Tripartite Evolutionary Game Study on the Carbon Emission Reduction of Shipping Enterprises Considering Government and Shipper Behavior

Department of Transportation Engineering, Dalian Maritime University, Dalian 116026, China
*
Author to whom correspondence should be addressed.
Sustainability 2025, 17(9), 3895; https://doi.org/10.3390/su17093895
Submission received: 17 March 2025 / Revised: 22 April 2025 / Accepted: 23 April 2025 / Published: 25 April 2025

Abstract

This paper constructs a tripartite evolutionary game model involving governments, shipping enterprises, and shippers to analyze the dynamic interactions and strategic decision-making regarding carbon emission reduction within the shipping industry. The model examines how subsidies, penalties, and supervisory mechanisms influence stakeholders’ behavioral trajectories and equilibrium outcomes. The key findings reveal that the government’s active regulatory strategy evolves inversely with the probabilities of proactive emission reduction by enterprises and shipper supervision, while the likelihood of enterprises adopting low-carbon strategies increases with governmental and shipper engagement. Under a single reward-and-penalty framework, only subsidies can guide the studied system toward an evolutionary equilibrium characterized by active regulation, proactive emission reduction, and supervision. In a mixed reward-and-penalty scenario, increasing subsidy levels is crucial to achieving an equilibrium between passive regulation, proactive emission reduction, and supervision. Our sensitivity analysis highlights that subsidies for enterprises and shippers have a greater impact than penalties, although excessive subsidies may strain governmental budgets. Additional emission reduction costs and benefits are also key factors that affect the carbon emission reduction strategies of shipping enterprises.

1. Introduction

As the global ecological and environmental crisis intensifies, environmental protection has become a pressing priority for the international community. The shipping industry, a cornerstone of international trade and a key driver of global economic growth, also constitutes a major source of greenhouse gas emissions. According to the International Maritime Organization (IMO), the sector emits approximately 1 billion tons of carbon dioxide annually, accounting for about 3% of global emissions (Kim et al., 2020) [1]. This substantial contribution to global warming has prompted the implementation of stringent environmental regulations worldwide. In 2023, the IMO introduced a revised strategy targeting at least a 40% reduction in carbon dioxide emissions per voyage by 2030 and net-zero emissions by approximately 2050 (IMO, 2021) [2]. This strategy outlines a clear pathway for the maritime industry’s transition toward sustainability and environmentally responsible practices.
However, shipping enterprises face significant challenges in implementing carbon reduction measures. Developing and implementing low-carbon technologies requires substantial financial investment, thereby increasing operational costs. Consequently, influenced by cost-benefit considerations, some enterprises have been reluctant to invest in emission reduction initiatives, resulting in insufficient motivation to adopt greener practices.
In this context, government regulation serves as a critical external driver of carbon reduction in the shipping industry (Li and Jiang, 2022) [3]. Governments worldwide have implemented strict policies, incentive mechanisms, and penalties to regulate emissions. For instance, several European countries offer tax incentives to shipping enterprises that meet emission standards while imposing substantial fines on non-compliant entities (Schwartz et al., 2020) [4]. These measures have effectively incentivized shipping enterprises to adopt low-carbon practices.
Meanwhile, shippers, as direct consumers of shipping services, are increasingly prioritizing environmental sustainability. With the increasing societal awareness of environmental issues, shippers are placing greater emphasis on the carbon reduction performance of shipping enterprises when selecting partners. A 2024 report by the Boston Consulting Group (BCG) indicated that over 80% of shippers prefer to collaborate with enterprises that demonstrate strong emission reduction performance, with many willing to pay a premium of up to 4% for such services. This shift in market preferences has positioned shipper supervision as an external factor that significantly influences the carbon reduction strategies of shipping enterprises.
Although prior studies have independently examined the influence of government regulations and shipper supervision on the carbon emission reduction initiatives of shipping enterprises, a notable gap remains concerning their synergistic effects when they are considered jointly. Specifically, the interplay between regulatory frameworks and shippers’ supervision has yet to be thoroughly explored, leaving room for a more comprehensive understanding of how these elements collectively shape the environmental strategies adopted by the maritime industry. This research gap underscores the need for integrated studies that offer a holistic perspective on the drivers of sustainable practices in the shipping sector. This study addresses this gap by employing game theory to develop a tripartite model involving governments, shippers, and shipping enterprises. By systematically analyzing the strategic interactions among these stakeholders, this paper aims to offer a robust theoretical foundation for the development of practical and scientifically grounded strategies for carbon reduction by shipping enterprises.
The structure of this paper is as follows: First, it outlines the research background and current state of carbon reduction efforts in the shipping industry, reviewing the relevant literature and developments in the field. Second, it details the assumptions and development of the game model, ensuring its scientific rigor and logical consistency. Third, this study analyzes the stable outcomes of the game across various scenarios, identifying the most effective strategies for all stakeholders. By evaluating the interactions between stakeholders and their decision-making processes, it identifies the conditions under which each stakeholder can achieve optimal outcomes, offering insights into the dynamics of strategic behavior in the given context. Finally, this study proposes targeted strategies to optimize the carbon reduction of shipping enterprises, while acknowledging its limitations and outlining directions for future research. This comprehensive approach not only advances the theoretical understanding of carbon reduction in shipping but also provides actionable insights for industry stakeholders.

2. Literature Review

2.1. Low Carbon Emissions Reduction in Shipping

Driven by the urgent goal of achieving carbon neutrality, the shipping industry’s low-carbon emission reduction efforts have become a major focus of recent research (He et al., 2024) [5]. Previous studies have established a foundation for maritime decarbonization through analyzing regulatory frameworks, technological innovations, and operational optimizations. Currently, various carbon reduction measures have been adopted in the shipping industry. From a regulatory perspective, the International Maritime Organization (IMO) has introduced a series of policies such as the Energy Efficiency Design Index (EEDI) and the Carbon Intensity Indicator (CII), as well as establishing Emission Control Areas (ECAs) to enforce stricter emission standards and improve energy efficiency (Wang et al., 2024; Barreiro et al., 2022) [6,7]. From a technological standpoint, ship electrification (Bei et al., 2024) [8] and the use of streamlined hull designs (Guo et al., 2020) [9] are widely acknowledged as effective approaches to reducing carbon emissions. Alternative fuels, such as green hydrogen and bio-methanol, have also demonstrated significant potential in reducing emissions (Tomos et al., 2024; Wang et al., 2023) [10,11]. Wang and Iris (2025) [12] further validated this perspective and suggested adopting different fuels at various stages of the decarbonization process. Moreover, Sun et al. (2022) [13] highlighted the significance of shore power infrastructure, which contributes to emission reduction while vessels are docked. Furthermore, operational strategies (Xue et al., 2024) [14] such as speed reduction (Sun et al., 2023) [15] and route optimization (Lan et al., 2023) [16] have been shown to enhance the efficiency of emission reduction. Multi-port berth allocation with speed optimization can also boost carbon emission reduction (Venturini et al., 2017) [17]. However, although these studies offer valuable insights into maritime decarbonization, most focus on isolated emission reduction measures and overlook the strategic interactions among key stakeholders within the shipping industry.

2.2. Impact of Government and Shippers on Carbon Reduction

Government regulation is broadly acknowledged as a critical driver of carbon reduction in the shipping industry. Regulatory instruments such as carbon taxes and carbon trading schemes have been extensively analyzed for their effectiveness in guiding corporate emission reduction strategies (Wang et al., 2018; Lin et al., 2022; Gao et al., 2023) [18,19,20]. Studies by Herdzik (2021) [21] and Zhang et al. (2023) [22] emphasize the influence of both global and regional policies on the decision-making of shipping enterprises. To assess the impact of government regulation on shipping enterprises’ carbon reduction strategies, Ye et al. (2024) [23] developed an evolutionary game model involving governments and shipping enterprises. Their findings indicate that carbon pricing mechanisms play a significant role in influencing firms’ investment decisions regarding green technologies. Similarly, Li et al. (2024) [24] demonstrated that government subsidies effectively encourage proactive emission reduction, while Li et al. (2022) [25] found that strict penalties for excessive emissions enhance compliance rates.
In addition to government intervention, the market demand and shipper preferences also play an essential role in influencing corporate environmental behavior (Huang et al., 2023) [26]. Research indicates that shippers are increasingly willing to pay a premium for low-carbon transportation services (Zhou and Zhang, 2022) [27]. McKinnon (2014) [28] found that enterprises investing in green shipping solutions tend to gain a competitive advantage, reinforcing the market-driven nature of carbon reduction. When shippers strongly prefer low-carbon services, they are more inclined to supervise shipping enterprises’ emission reduction efforts to ensure that their environmental expectations are met. However, most existing studies primarily examine static demand preferences, overlooking the dynamic strategic interactions among shippers, enterprises, and regulators. Building on these insights, this study integrates the influence of both government regulation and shipper preferences into a unified evolutionary game framework to provide a more comprehensive understanding of stakeholder interactions and the effectiveness of different policy instruments.

2.3. Game Theory from a Low Carbon Perspective

Game theory has been widely employed to analyze carbon reduction strategies across various industries. In particular, evolutionary game models have proven effective in capturing dynamic strategic interactions among stakeholders (Chen et al., 2021; Xu et al., 2021; Zhang and Feng, 2024) [29,30,31]. For instance, Wu et al. (2021) [32] developed an evolutionary game model involving consumers, governments, and logistics enterprises to explore how carbon taxation and environmental preferences affect corporate emission reduction strategies.
Evolutionary game theory has also been widely applied to the decarbonization of the shipping industry. Xiao and Cui (2023) [33] proposed a multi-stage two-player evolutionary game to analyze how carbon quotas and shipping cycles influence corporate compliance behavior. Meng et al. (2022) [34] extended this framework into a tripartite game involving governments, ports, and shipping enterprises. Zhang and Zhang (2024) [35] further extended this framework to a four-party model, emphasizing the role of government regulation and reputation mechanisms in motivating emission reduction efforts. Leveraging this approach enables researchers to simulate complex interactions and decision-making dynamics among stakeholders, and thereby to provide valuable insights into the development of effective sustainability practices in the shipping industry. However, a major limitation of previous studies is their predominant focus on government regulations and corporate compliance, often overlooking the critical role of shippers in emission reduction. Although Zhang and Feng (2024) [31] introduced a three-party game involving shippers, their study did not provide a comparison of how various policy mechanisms affect equilibrium outcomes.
In summary, although previous research on carbon reduction in the shipping industry has provided valuable insights, several limitations remain. Most studies have focused primarily on the interactions between governments and shipping enterprises, failing to provide a comprehensive analysis of the broader carbon reduction ecosystem. The combined influence of government policies and shipper preferences remains insufficiently explored, despite shippers being direct consumers whose decisions significantly shape shipping enterprises’ low-carbon strategies. To address this gap, this study employs a tripartite evolutionary game framework involving governments, shipping enterprises, and shippers. This framework captures how government regulations, corporate emission reduction efforts, and shipper supervision evolve over time. The existing literature widely acknowledges that higher subsidies or stricter penalties effectively incentivize shipping enterprises to adopt proactive emission reduction measures. Building on this foundation, this paper extends the scope of the existing research by exploring the im-pacts of hybrid reward-and-penalty mechanisms on corporate decarbonization efforts and investigating how market supervision influences the decision-making processes of both governments and shipping enterprises. In addition, most existing studies focus on the impacts of exogenous variables on the emission reduction decisions of shipping enterprises. On this basis, this paper adds an analysis of the impacts of endogenous variables that affect shipping enterprises on their carbon emission reduction strategies, further improving the system of influencing factors that affect shipping enterprises’ emission reduction decisions. This paper not only enhances theoretical understanding but also provides practical guidance for governments, shipping enterprises, and shippers in promoting the sustainable development of the shipping industry. In order to verify the rationality of the analysis method and conclusions, a comparative analysis was conducted between this study and recent scholarly works in the field, with a detailed comparison being provided in Table 1.

3. The Tripartite Evolutionary Game Model

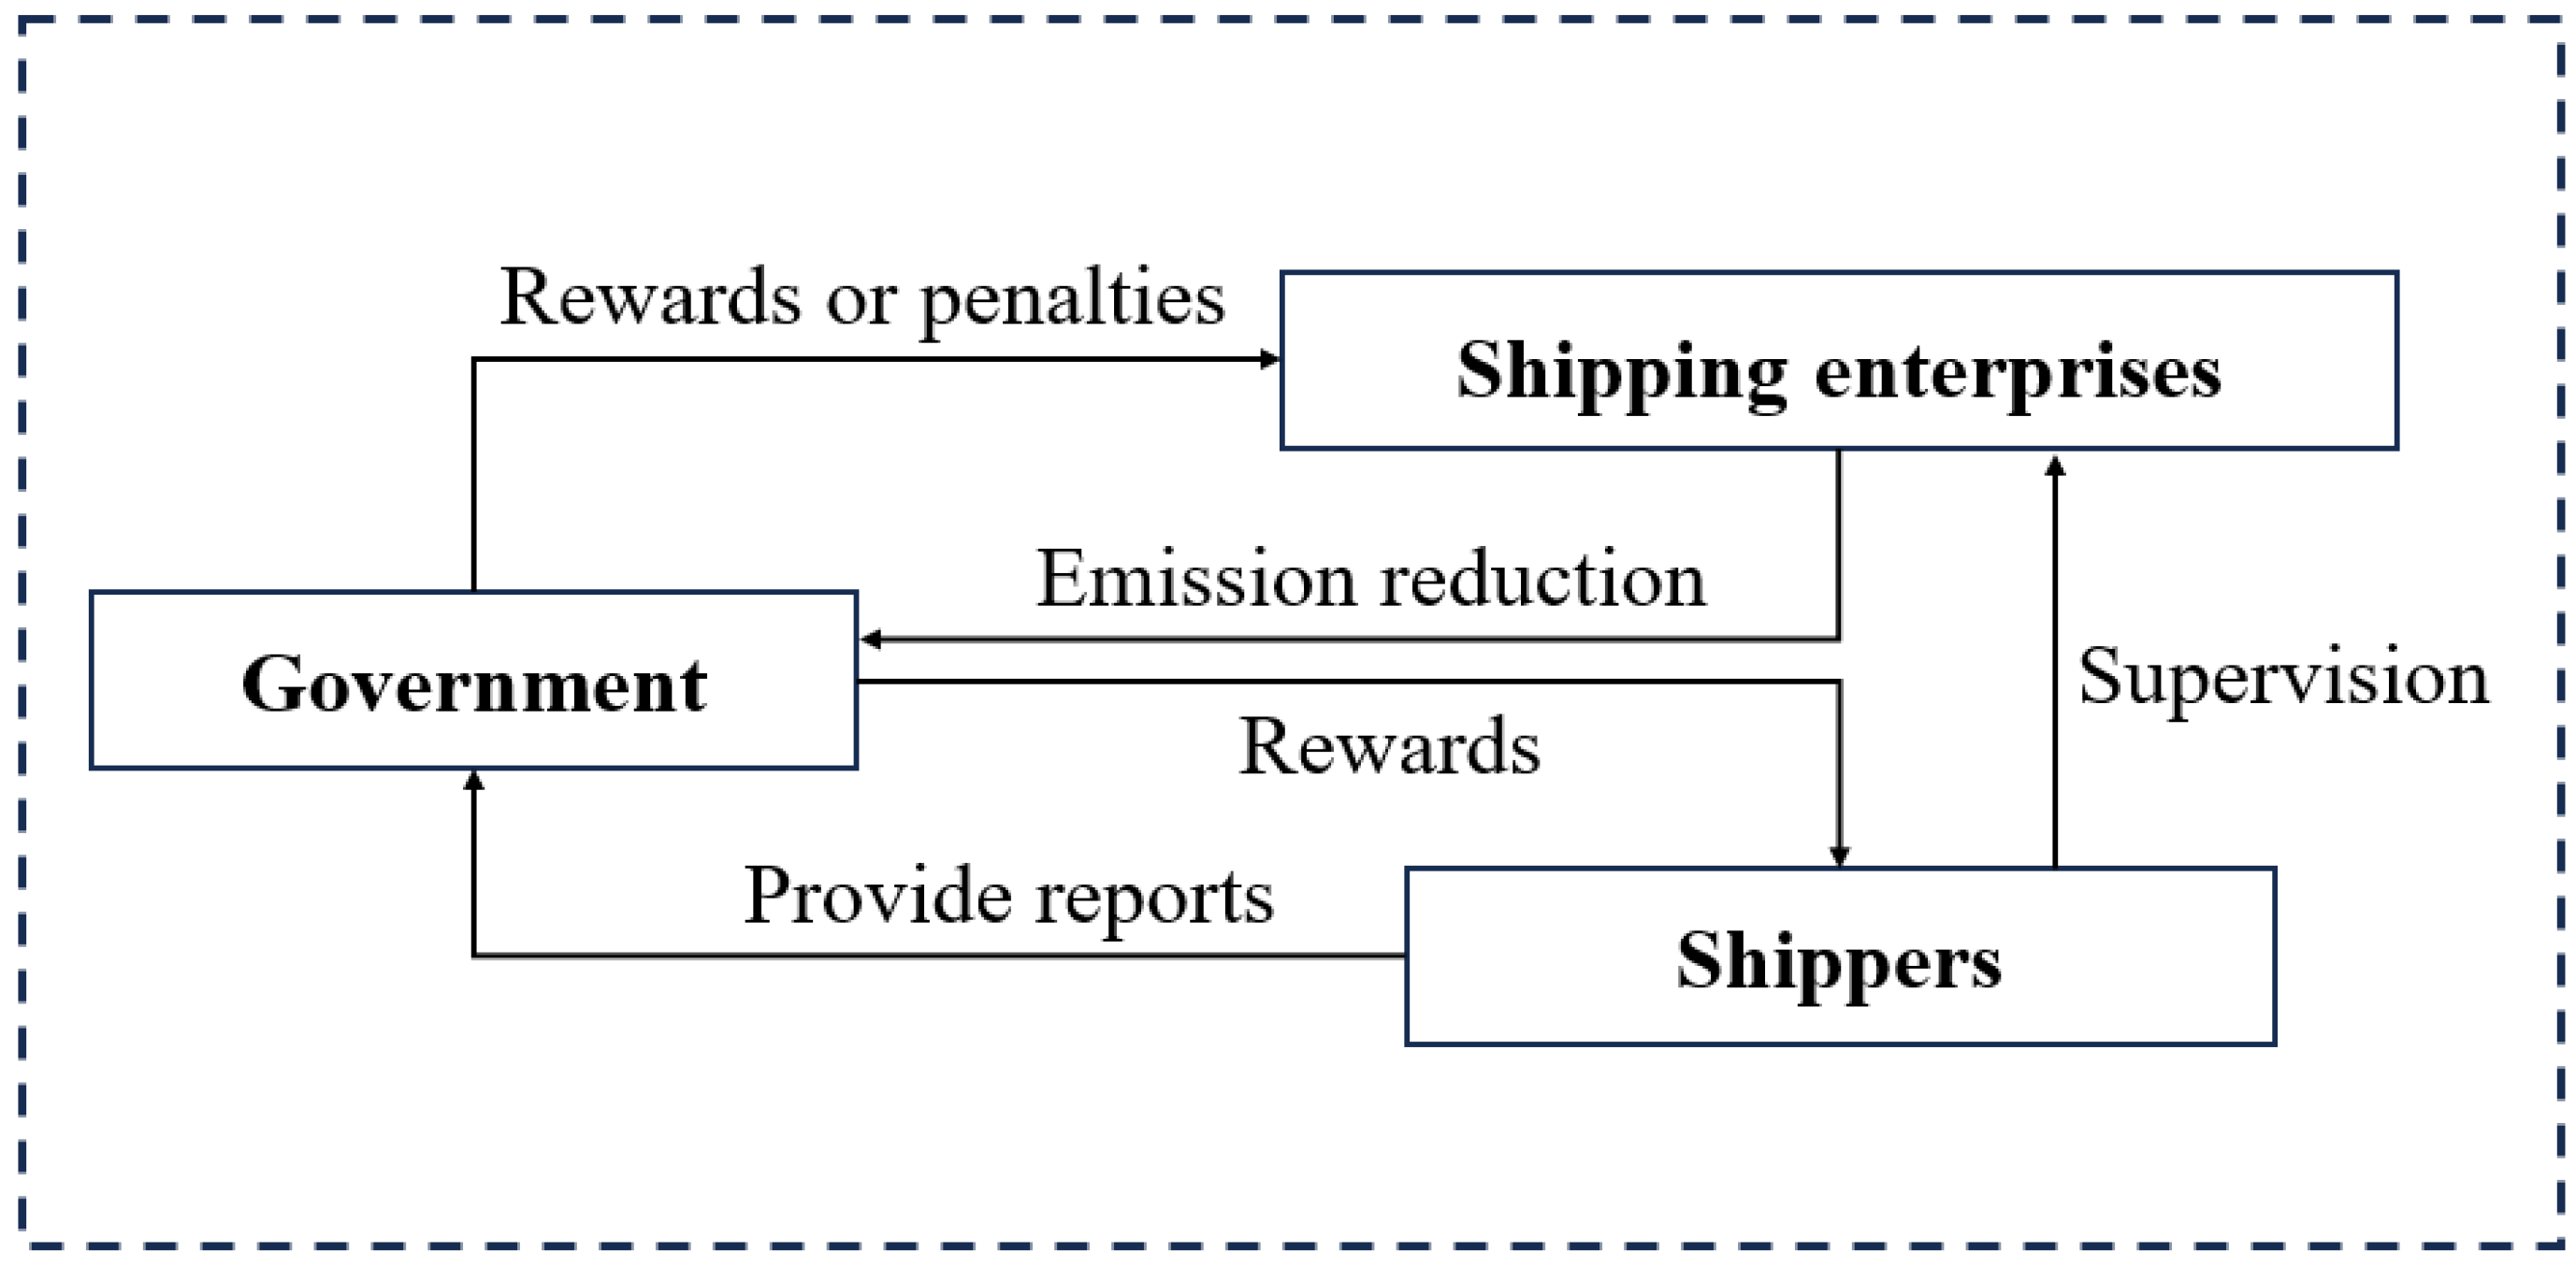
3.1. Problem Description

The public awareness of carbon reduction is steadily increasing. Joint efforts by governments, shipping enterprises, and shippers are collectively fostering momentum toward carbon reduction. Shipping enterprises are adopting clean energy and other strategies to reduce their carbon footprint. Meanwhile, local authorities and cargo owners are pushing these enterprises to actively reduce their emissions through various regulatory and oversight mechanisms. When local governments take an active role in regulation, they bear the associated costs and may implement reward or penalty mechanisms based on the compliance of shipping enterprises and shippers. Governments might also gain social recognition for an active regulatory approach. Under passive regulation, local governments enforce compliance by encouraging shippers to report inadequate emission reduction efforts by shipping enterprises. Shipping enterprises that actively reduce their emissions incur higher costs but receive government incentives and potential returns from their improved environmental performance. Conversely, enterprises that remain passive in emission reduction risk government penalties and being reported by shippers. Shippers who engage in supervision incur costs and additional fees but may receive rewards from actively regulating governments or by reporting non-compliant shipping enterprises to passively regulating governments. If shippers choose not to supervise, they bear only the additional fees without access to potential rewards. The strategic interactions among the three parties are illustrated in Figure 1.

3.2. Basic Assumptions and Parameter Settings

Assumption 1: The key participants in this framework include the government, shipping enterprises, and shippers. In a “natural” environment devoid of additional constraints, all parties involved in the game demonstrate bounded rationality, and information asymmetry exists among the three stakeholders. The interactions within the game are characterized by randomness and interdependence.
Assumption 2: Local governments have two gaming strategies, namely “active regulation” and “passive regulation”, with probabilities of x ( 0 < x < 1 ) and 1 x , respectively. When the government adopts an active regulatory strategy, it incurs an additional regulatory cost C g while gaining an improvement in social evaluation I . Under this regulatory framework, the government provides rewards S c to shipping enterprises that actively engage in emission reduction and grants incentives S s to shippers who actively participate in supervision. Conversely, shipping enterprises that fail to comply with emission reduction requirements are subject to penalties T s . If the active regulatory strategy effectively encourages shipping enterprises to adopt active emission reduction measures, the government can obtain social welfare benefits W . However, if shipping enterprises continue to engage in passive emission reduction behaviors, the government will bear the environmental damage D caused by such inaction. In contrast, under a passive regulatory strategy, the government does not provide subsidies to shipping enterprises. Instead, it implements a regulatory mechanism by offering a reward S to shippers who report the non-compliant behavior of shipping enterprises. Under this framework, shipping enterprises that engage in passive emission reduction will be subject to a penalty T imposed by the government.
Assumption 3: Shipping enterprises have two gaming strategies, “proactive emission reduction” and “passive emission reduction,” with probabilities of y   ( 0 < y < 1 ) and 1 y , respectively. When shipping enterprises actively engage in emission reduction, they need to upgrade their low-carbon technologies, which results in an additional cost C c . In this case, shipping enterprises can offer green transportation services to shippers, thereby generating additional revenue R e and gaining an improvement in their social evaluation A as a result of their proactive emission reduction efforts. Conversely, if shipping enterprises adopt a passive emission reduction strategy, they will face penalties imposed by the government or sanctions resulting from reports made by shippers.
Assumption 4: Shippers have two gaming strategies, “supervision” and “non-supervision,” with probabilities of z   ( 0 < z < 1 ) and 1 z , respectively. Shippers are required to pay the ETS surcharge to support emission reduction. When shippers engage in supervision, they incur a monitoring cost. However, they can receive a reward S s from a government that actively enforces regulations or obtain a reward S for reporting the noncompliant emission reduction behavior of shipping enterprises when the government adopts a passive regulatory strategy. In contrast, if shippers choose not to engage in supervision, they only bear the cost of the ETS surcharge.
Assumption 5: When shipping enterprises adopt proactive emission reduction measures, they contribute positively to societal welfare. On the other hand, passive emission reduction practices by these enterprises lead to environmental harm.
The symbols and explanations of specific parameters are shown in Table 2.

3.3. Payoff Matrix Construction

Based on the above assumptions, eight evolutionary game strategies are formed among the government, shipping enterprises, and shippers. These strategies are as follows: (active regulation, proactive emission reduction, supervision), (active regulation, proactive emission reduction, non-supervision), (active regulation, passive emission reduction, supervision), (active regulation, passive emission reduction, non-supervision), (passive regulation, proactive emission reduction, supervision), (passive regulation, proactive emission reduction, non-supervision), (passive regulation, passive emission reduction, supervision), and (passive regulation, passive emission reduction, non-supervision). The payoff matrix for the government, shipping enterprises, and shippers is presented in Table 3.

4. Evolutionary Game Analysis

4.1. Replication Dynamic Equations

The expected benefits for local governments that choose “active regulation” E x or “passive regulation” E 1 x are influenced by the probabilities of the strategic choices that can be made by shipping enterprises and shippers. These benefits, E x and E 1 x , can be calculated using the payoff matrix.
E x = y z I + W C g S c S s + y 1 z I + W C g S c + 1 y z I + T s C g S s D + 1 y ( 1 z ) ( I + T s C g D )
E 1 x = y z ( W S s ) + y 1 z W + 1 y z T S D S s + 1 y 1 z D
In evolutionary game theory, the average expected payoff is the overall expected value of a participant’s payoff, which is calculated through a mixed strategy that involves a probability distribution over different strategy choices. The mean benefit of the government E ¯ g   can be deduced to be:
E ¯ g = x [ y z ( I + W C g S c S s ) + y 1 z ( I + W C g S c ) + 1 y z ( I + T s C g S s D ) + ( 1 y ) ( 1 z ) ( I + T s C g D ) ] + ( 1 x )   [ y z W + y 1 z ( W S s ) + 1 y z T S D S s + 1 y 1 z D ]
The expected benefits for shipping enterprises that choose “proactive emission reduction” E y or “passive emission reduction” E 1 y are related to the probabilities of the strategic choices that can be made by the government and shippers. The respective formulas are calculated as follows.
E y = x z S c + E C c + R e + A + x 1 z S c + E C c + R e + 1 x z E C c + R e + A + 1 x 1 z E C c + R e
E 1 y = x z E T s + x 1 z E T s + 1 x z E T + ( 1 x ) ( 1 z ) E
The mean benefit of shipping enterprises E ¯ e   can be deduced to be:
E ¯ e = y [ x z S c + E C c + R e + A + x 1 z S c + E C c + R e + 1 x z E C c + R e + A + ( 1 x ) ( 1 z ) ( E C c + R e ) ] + ( 1 y )   [ x z E T s + x 1 z E T s + 1 x z E T + ( 1 x ) ( 1 z ) E ]
The expected benefits for shippers that choose “supervision” E z or “non-supervision” E 1 z are related to the probabilities of the strategic choices that can be made by the government and shipping enterprises. The respective formulas are calculated as follows.
E z = x y S s C s E + x 1 y S s C s E + 1 x y S s C s E + 1 x 1 y S s + S C s E
E 1 z = E
The mean benefit of shippers E ¯ s   can be deduced to be:
E ¯ s = z [ x y S s C s E + x 1 y S s C s E + 1 x y S s C s E + 1 x 1 y S s + S C s E ] + ( 1 z )   ( E )
In the context of evolutionary game theory, when the benefits of a particular strategy chosen by participating agents surpass those of alternative strategies, the system naturally evolves toward that strategy. The outcomes derived from the replication dynamic equations guarantee that evolutionarily stable strategies represent equilibrium states. Building on Equations (1)–(3), the replication dynamic equation for the local government’s strategy selection is formulated as follows.
F x = d x / d t = x E x E ¯ g = x ( 1 x ) [ I + T s C g y S c + T S z T S + y z ( T S ) ]
Similarly, the replication dynamic equations for the strategic choices of shipping enterprises and shippers are obtained as follows.
G y = d y / d t = y E y E ¯ p = y E y E ¯ e = y ( 1 y ) [ R e C c + x S C + T s + z A + T x z T ]
H z = d z / d t = z E z E ¯ s = z 1 z [ S + S s C s x S y S + x y S ]

4.2. Evolution Path Analysis

4.2.1. Analysis of Government Evolutionary Paths

According to the principle of evolutionary stability, for the government to achieve an evolutionarily stable strategy, it needs to satisfy the condition F x = 0 ,   d F ( x ) / d x < 0 . When z = y S c + T s + C g I T S y T S T + S , F x = 0 . Under these conditions, the government’s strategy selection remains stable and does not change over time. When z y S c + T s + C g I T S y T S T + S , taking the derivative of F ( x ) , d F ( x ) / d t = ( 1 2 x ) [ I + T s C g y S c + T S z S s + T S + y z ( T S ) ] is obtained. When y S c + T s + C g I T S y T S S s T + S < z < 1 , d F ( x ) / d x | x = 1 > 0 ,   d F ( x ) / d x | x = 0 < 0 . At this point, x = 0 is the evolutionarily stable strategy point. Similarly, when 0 < z < y S c + T s + C g I T S y T S T + S , d F ( x ) / d x | x = 1 < 0 ,   d F ( x ) / d x | x = 0 > 0 . At this point, x = 1 is the evolutionarily stable strategy point. The evolution trend of the governments’ strategy is shown in Figure 2. Let z 0 = y S c + T s + C g I T S y T S T + S .

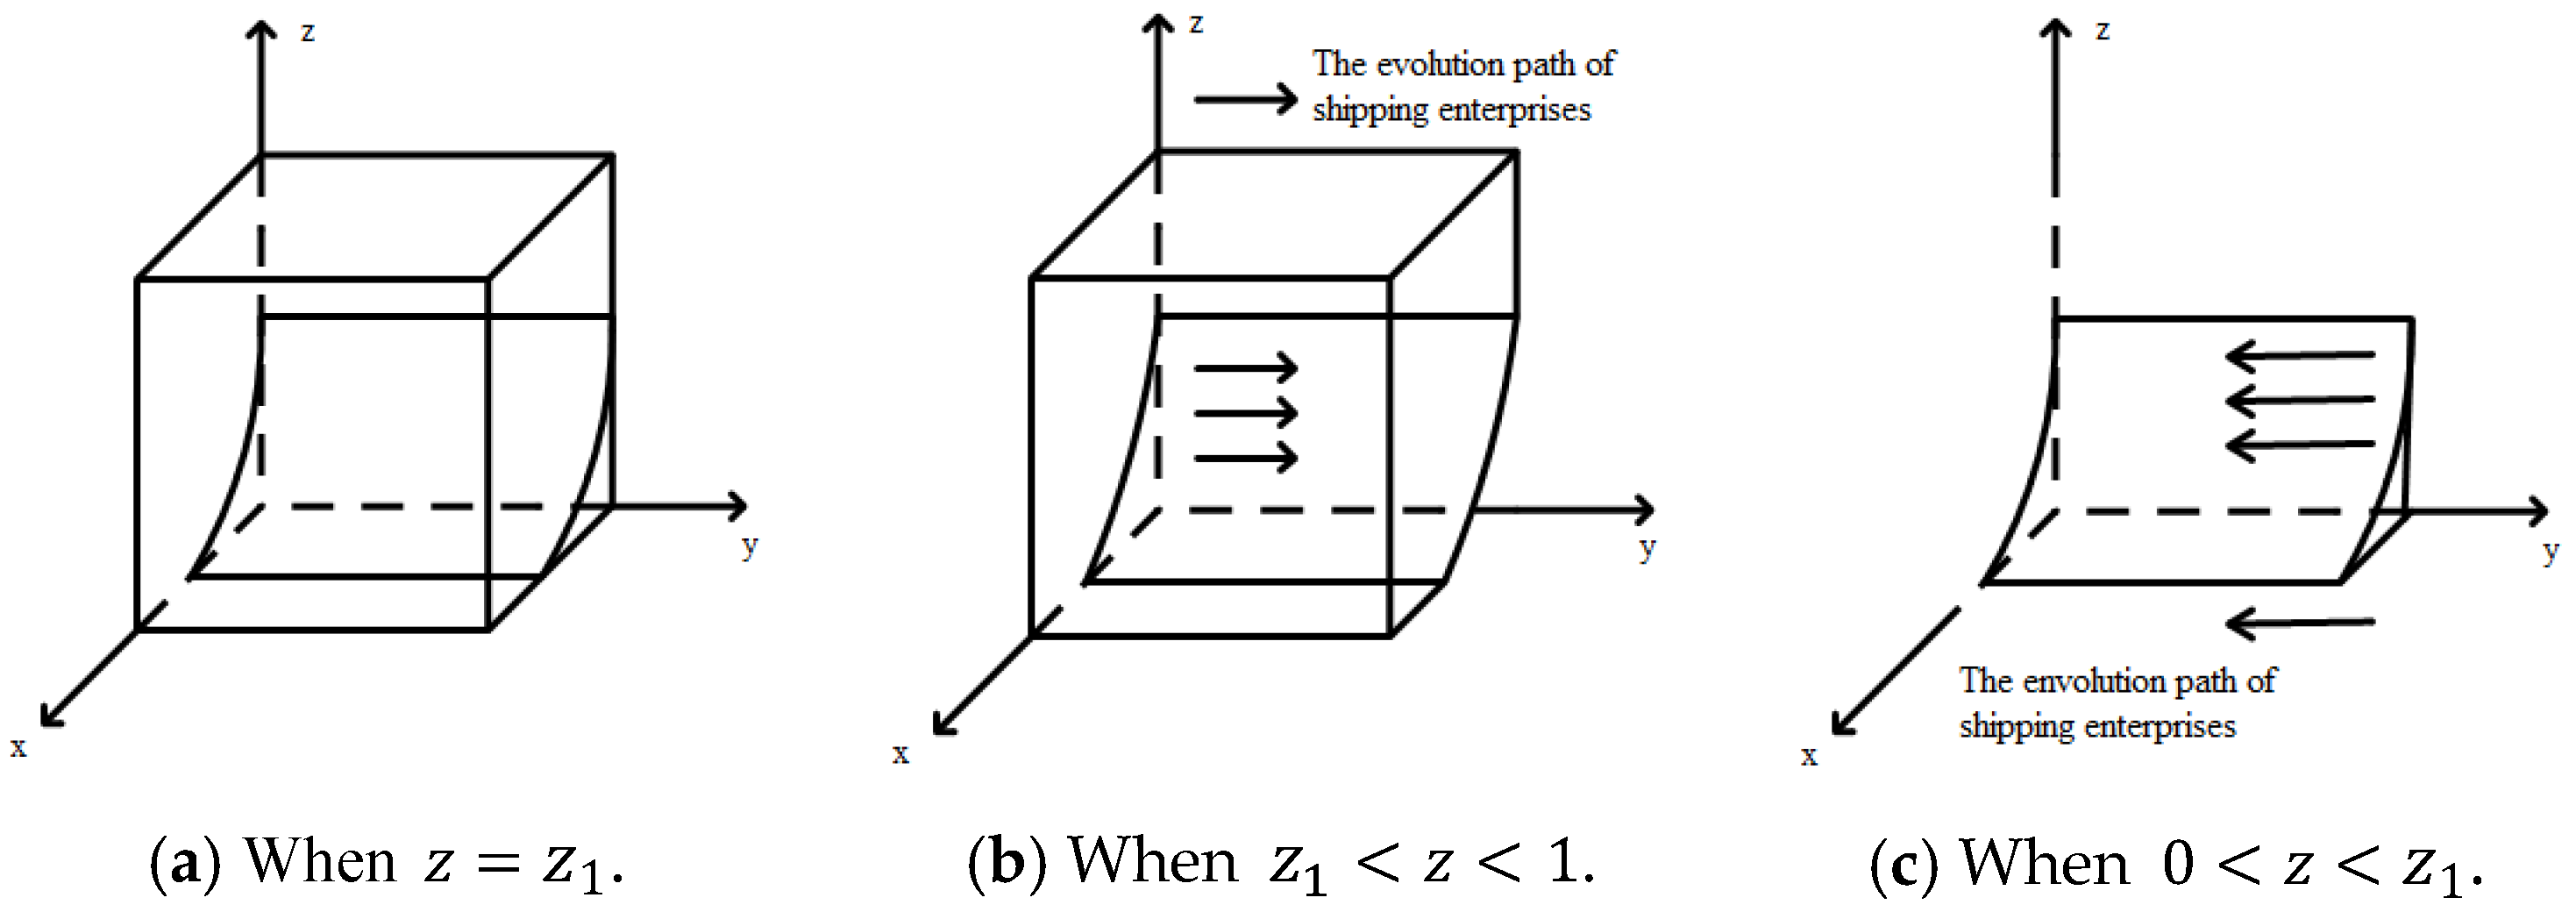
4.2.2. Analysis of Shipping Enterprises Evolutionary Paths

Similarly, for the shipping enterprises to achieve an evolutionarily stable strategy, they need to satisfy the condition G y = 0 ,   d G ( y ) / d y < 0 . When z = c c R e x ( S c + T s ) A + T x T , G y = 0 . Under these conditions, the shipping enterprises’ strategy selection remains stable and does not change over time. When z c c R e x ( S c + T s ) A + T x T , taking the derivative of G y , d G ( y ) / d t = ( 1 2 y ) [ R e C c + x S C + T s + z A + T x z T ] is obtained. When c c R e x ( S c + T s ) A + T x T < z < 1 , d G ( y ) / d y | y = 1 < 0 ,   d G ( y ) / d y | y = 0 > 0 . At this point, x = 0 is the evolutionarily stable strategy point. Similarly, when 0 < z < c c R e x ( S c + T s ) A + T x T , d G ( y ) / d y | y = 1 > 0 ,   d G ( y ) / d y | y = 0 < 0 . At this point, y = 0 is the evolutionarily stable strategy point. The evolution trend of the governments’ strategy is shown in Figure 3. Let z 1 = c c R e x ( S c + T s ) A + T x T .

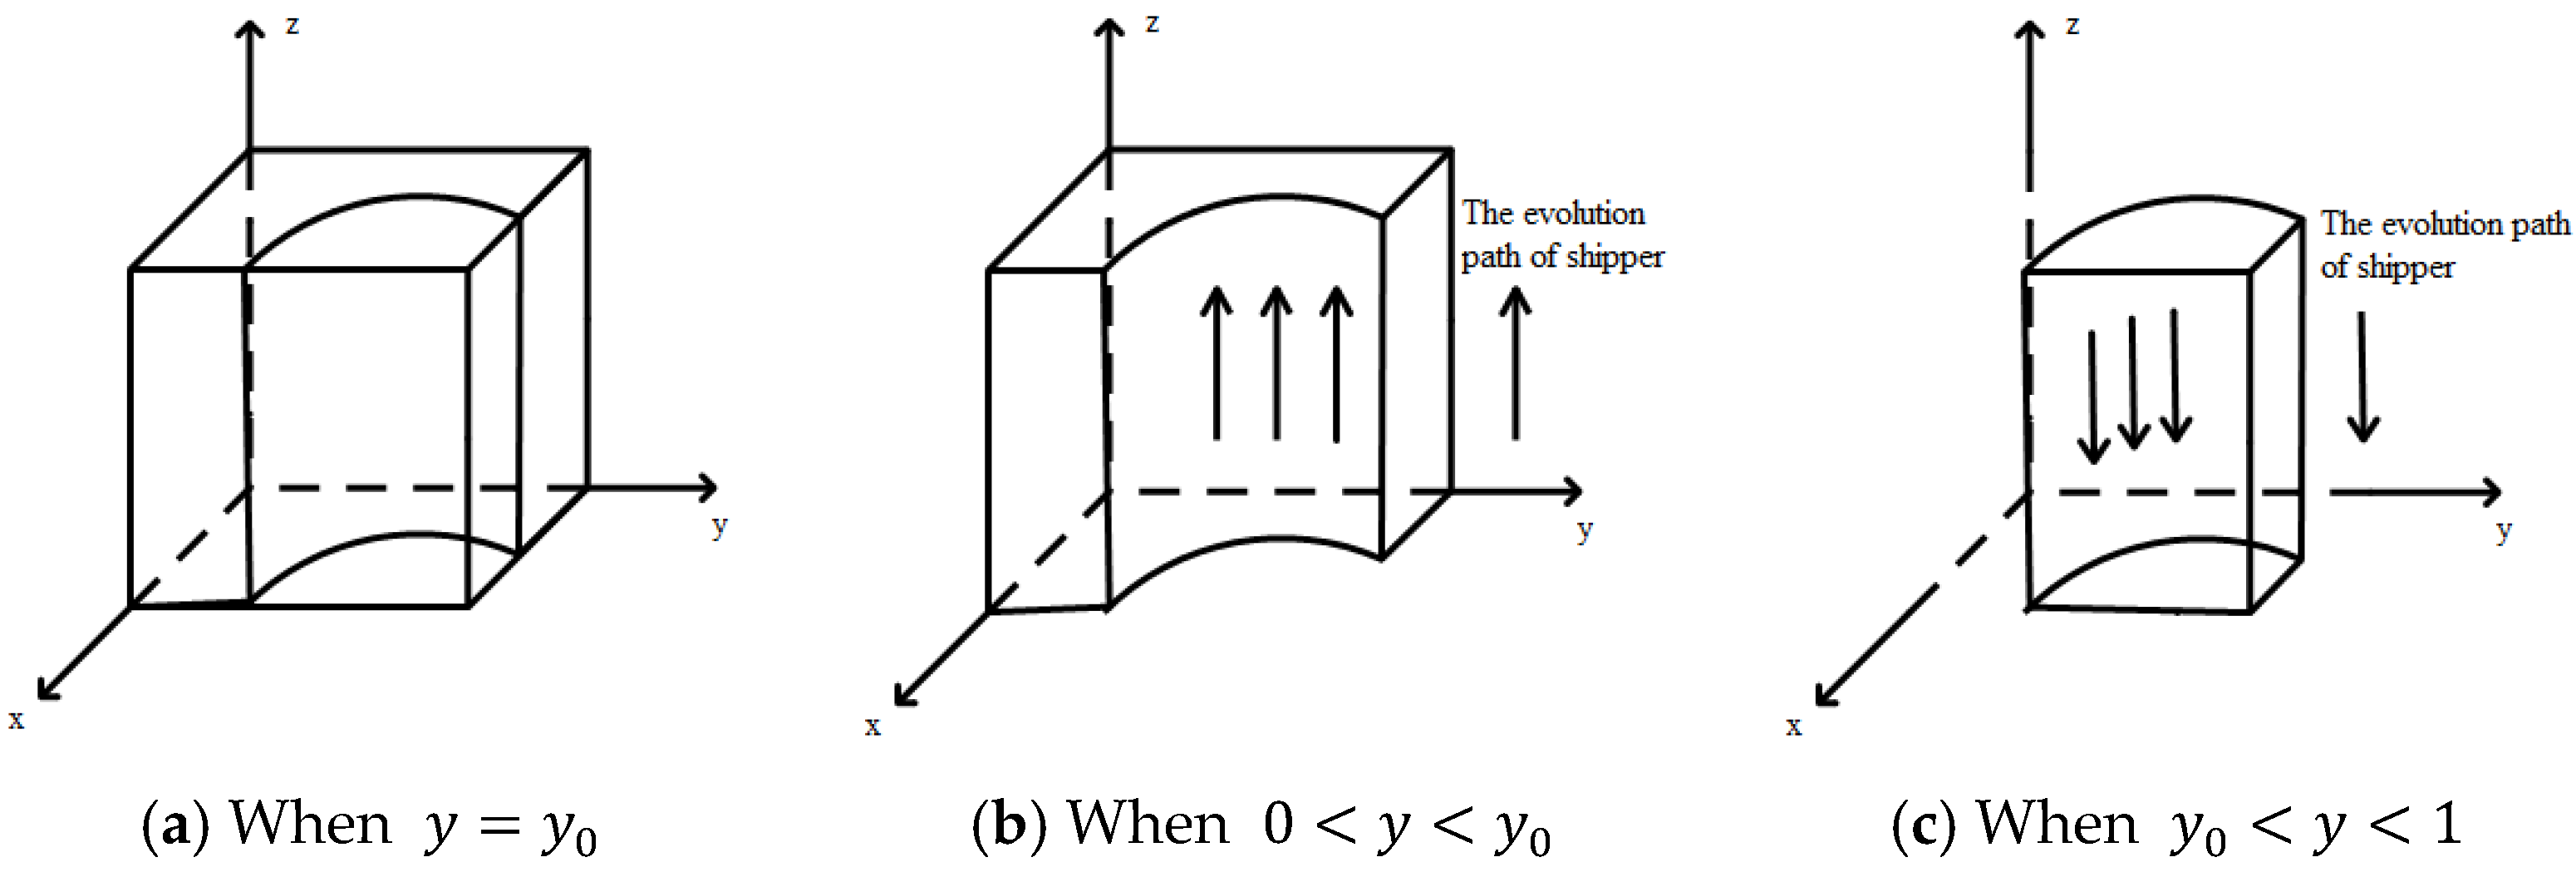
4.2.3. Analysis of Shipper Evolutionary Paths

For the shippers to achieve an evolutionarily stable strategy, they need to satisfy the condition H z = 0 , d H ( z ) / d z < 0 . When y = x S C s + S + S s S x S , H z = 0 . Under these conditions, the shipping enterprises’ strategy selection remains stable and does not change over time. When y x S C s + S + S s S x S , taking the derivative of H z , d H z / d t = ( 1 2 z ) [ S C s + x S s S y S + x y S ] is obtained. When x S C s + S + S s S x S < y < 1 , d H z / d z | z = 1 > 0 ,   d H z / d z | z = 0 < 0 . At this point, y = 1 is the evolutionarily stable strategy point. Similarly, when 0 < y < x S C s + S + S s S x S , d H z / d z | z = 1 < 0 ,   d H z / d z | z = 0 > 0 . At this point, z = 1 is the evolutionarily stable strategy point. The evolution trend of the governments’ strategy is shown in Figure 4. Let y 0 = x S C s + S + S s S x S .

4.3. System Evolution Equilibrium Analysis

When the equations satisfy F x , y , z = 0 ,   G x , y , z = 0 ,   H x , y , z = 0 , eight equilibrium points in the evolutionary dynamic process of local government, shipping enterprises, and shippers are obtained, as shown in Table 3. In the table, E 9 ( x * , y * , z * ) represents the mixed strategy equilibrium in this asymmetric dynamic game, characterized by eigenvalues with opposite signs, which is certainly not an evolutionarily stable point. To assess the asymptotic stability of the evolutionary game system at points E 1 through E 8 , this paper constructs the Jacobian matrix J as follows.
J = F ( x ) x F ( x ) y F ( x ) z G ( y ) x G ( y ) y G ( y ) z H ( z ) x H ( z ) y H ( z ) z = J 11 J 12 J 13 J 21 J 22 J 23 J 31 J 32 J 33
  J 11 = ( 1 2 x ) [ I + T s C g y S c + T S z T S + y z ( T S ) ]
  J 12 = x 1 x [ z ( T S ) S c T s ]
  J 13 = x 1 x [ y T S T + S ]
  J 21 = y 1 y ( z T + S c + T S )
  J 22 = ( 1 2 y )   [ R e C c + x S C + T s + z A + T x z T ]
  J 23 = y 1 y ( x T + A + T )
J 31 = z ( 1 z ) ( y S S )
J 32 = z 1 z ( x S S )
J 33 = ( 1 2 z ) [ S + S s C s x S y S + x y S ]
Lyapunov’s indirect method is utilized to evaluate the stability of the evolutionary game system. An equilibrium point is deemed asymptotically stable if all eigenvalues of the Jacobian matrix for that point are less than zero. The eigenvalues associated with each equilibrium point are determined through the Jacobian matrix, as shown in Table 4. “+” represents that the eigenvalue is greater than zero. “−” represents that the eigenvalue is less than 0. “*” represents that the magnitude of the eigenvalue is uncertain.
Since the equilibrium point E 1 possesses at least one positive eigenvalue, it cannot be classified as a stable point. The stability conditions of the remaining seven equilibrium points are analyzed under two distinct scenarios, leading to the following conclusions:
Scenario 1: inferior stable states.
When the replicator dynamic system converges to equilibrium points E 2 1 , 0 , 0 , E 4 0 , 0 , 1 , and E 6 1 , 0 , 1 , shipping enterprises adopt a passive emission reduction strategy. These points represent inferior stable states in the system.
For equilibrium point E 2 ( 1 , 0 , 0 ) , the system stabilizes when C g < I + T s ,   T s < C c R e S c , and S s < C s . Under these conditions, although the government adopts an active regulatory strategy, the cost of proactive emission reduction remains prohibitively high for shipping enterprises. The available subsidies and penalties fail to offset the cost burden or create sufficient incentive for investment in low-carbon technologies. Consequently, shipping enterprises choose passive emission reduction, while the supervision subsidies offered to shippers do not compensate for their supervision costs, leading to non-participation in monitoring.
For equilibrium point E 4 0 , 0 , 1 , the system stabilizes when I + T s C g < T S ,   T < C c A R e , and C s < S + S s . In this scenario, the perceived benefits of passive government regulation surpass those of active regulation, prompting governments to adopt a passive stance. Simultaneously, shipping enterprises opt for passive reduction when the total cost of proactive reduction outweighs the penalties for non-compliance. Shippers choose to supervise only when the returns from supervision exceed the associated costs.
For equilibrium point E 6 ( 1 , 0 , 1 ) , the system stabilizes when T S < I + T s C g , T s < C c R e S c A , and C s < S s . Here, the government adopts an active regulatory approach, as the net social benefits from such regulation exceed those of passive regulation. However, shipping enterprises still choose passive emission reduction if the marginal benefit of reduction (including government subsidies and enhanced reputation from shipper supervision) remains insufficient relative to its cost. Shippers engage in supervision if the expected subsidy exceeds the incurred supervision cost.
Scenario 2: superior stable states.
Equilibrium points E 3 ( 0 , 1 , 0 ) , E 5 ( 1 , 1 , 0 ) , E 7 ( 0 , 1 , 1 ) , and E 8 ( 1 , 1 , 1 ) correspond to superior stable states, wherein shipping enterprises adopt a proactive emission reduction strategy.
For equilibrium point E 3 ( 0 , 1 , 0 ) , the system stabilizes when I < C g + S c , C c < R e , and S s < C s . Although governmental incentives for emission reduction and supervision are limited, the additional revenue gained from proactive reduction is sufficient to motivate enterprises. If the supervision subsidies are increased to exceed shippers’ costs, the system transitions to equilibrium point E 7 ( 0 , 1 , 1 ) , where both emission reduction and supervision are actively pursued.
For equilibrium point E 5 1 , 1 , 0 , the system stabilizes when C g + S c , C c R e S c < T s , and S s < C s . At this stage, the cost of active government regulation and subsidies is lower than the societal benefits. Therefore, the government will choose active regulation. Shipping enterprises are incentivized to adopt proactive emission reduction due to its cost-benefit advantage compared to incurring penalties, while shippers refrain from supervision due to inadequate subsidies.
For equilibrium point E 8 ( 1 , 1 , 1 ) , the system stabilizes when C g + S c <I, C c A R e S c < T s , and C s < S s . In this scenario, shipping enterprises respond to relatively higher penalties and incentives by adopting proactive strategies, while shippers actively participate in supervision owing to favorable subsidy conditions.
The analysis of these two scenarios reveals that government subsidies and penalties significantly influence the carbon reduction behaviors of shipping enterprises. When the cost of emission reduction is high, it is crucial to maintain subsidies within a reasonable range and strengthen penalties for non-compliance to stimulate proactive measures. For shippers, enhancing supervision subsidies and reward mechanisms can effectively promote their participation in emission monitoring, thereby fostering a more collaborative and efficient carbon reduction environment in the shipping industry.

5. Evolutionary Simulation Analysis

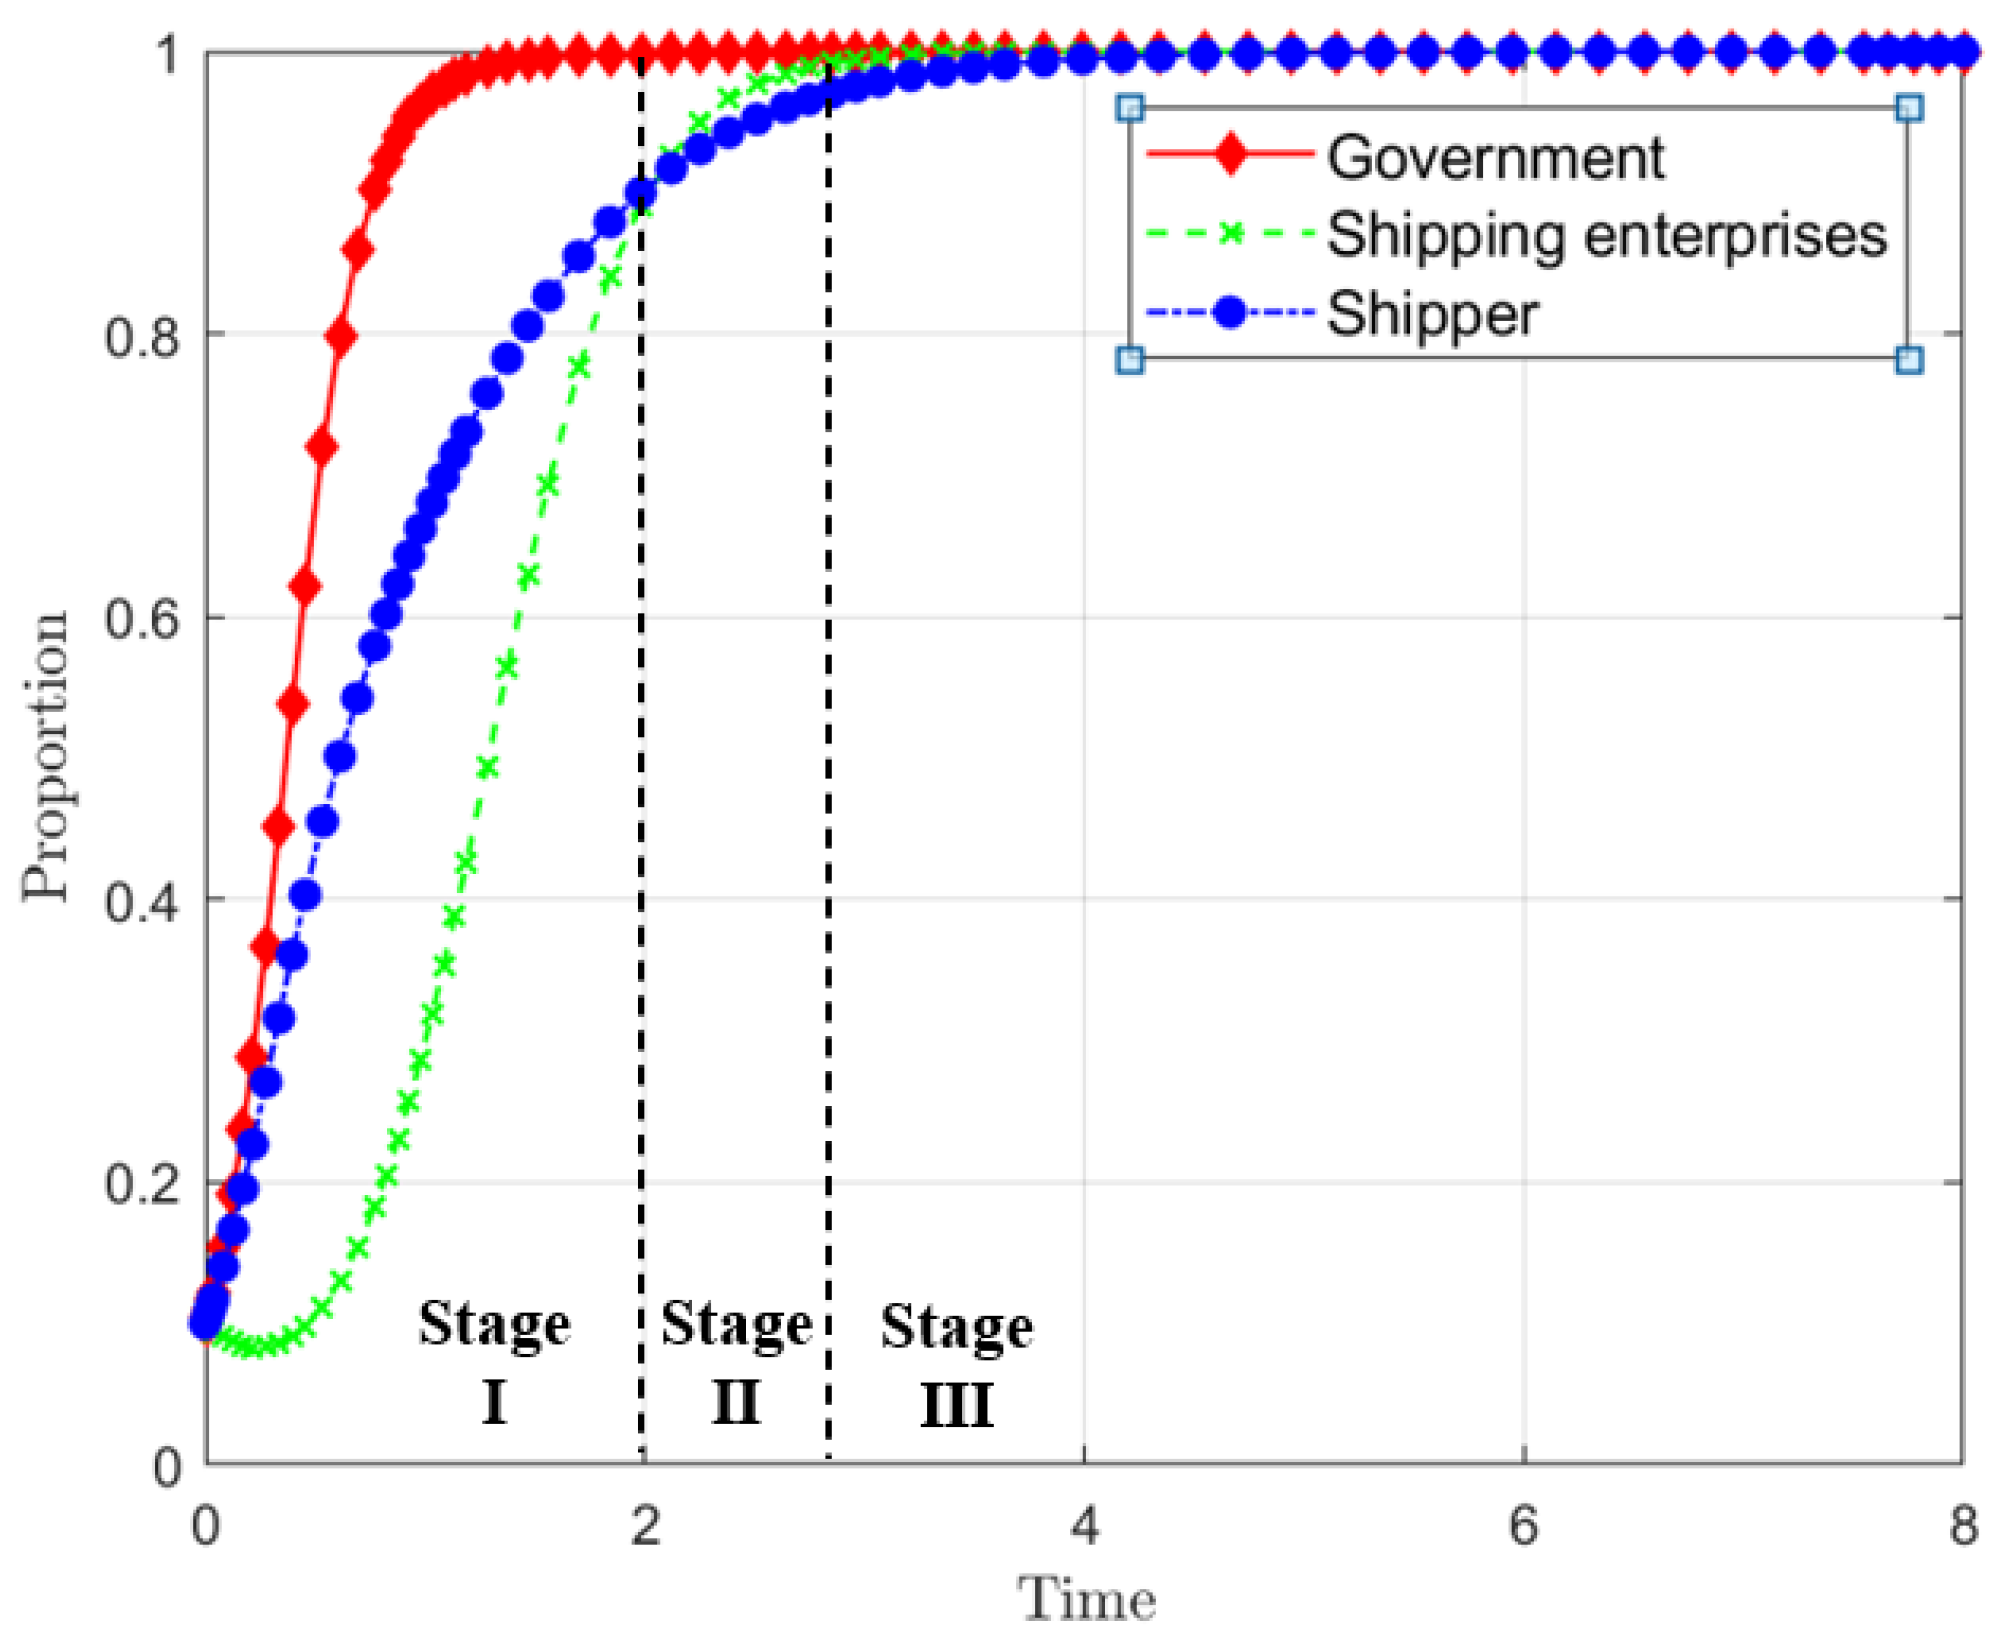
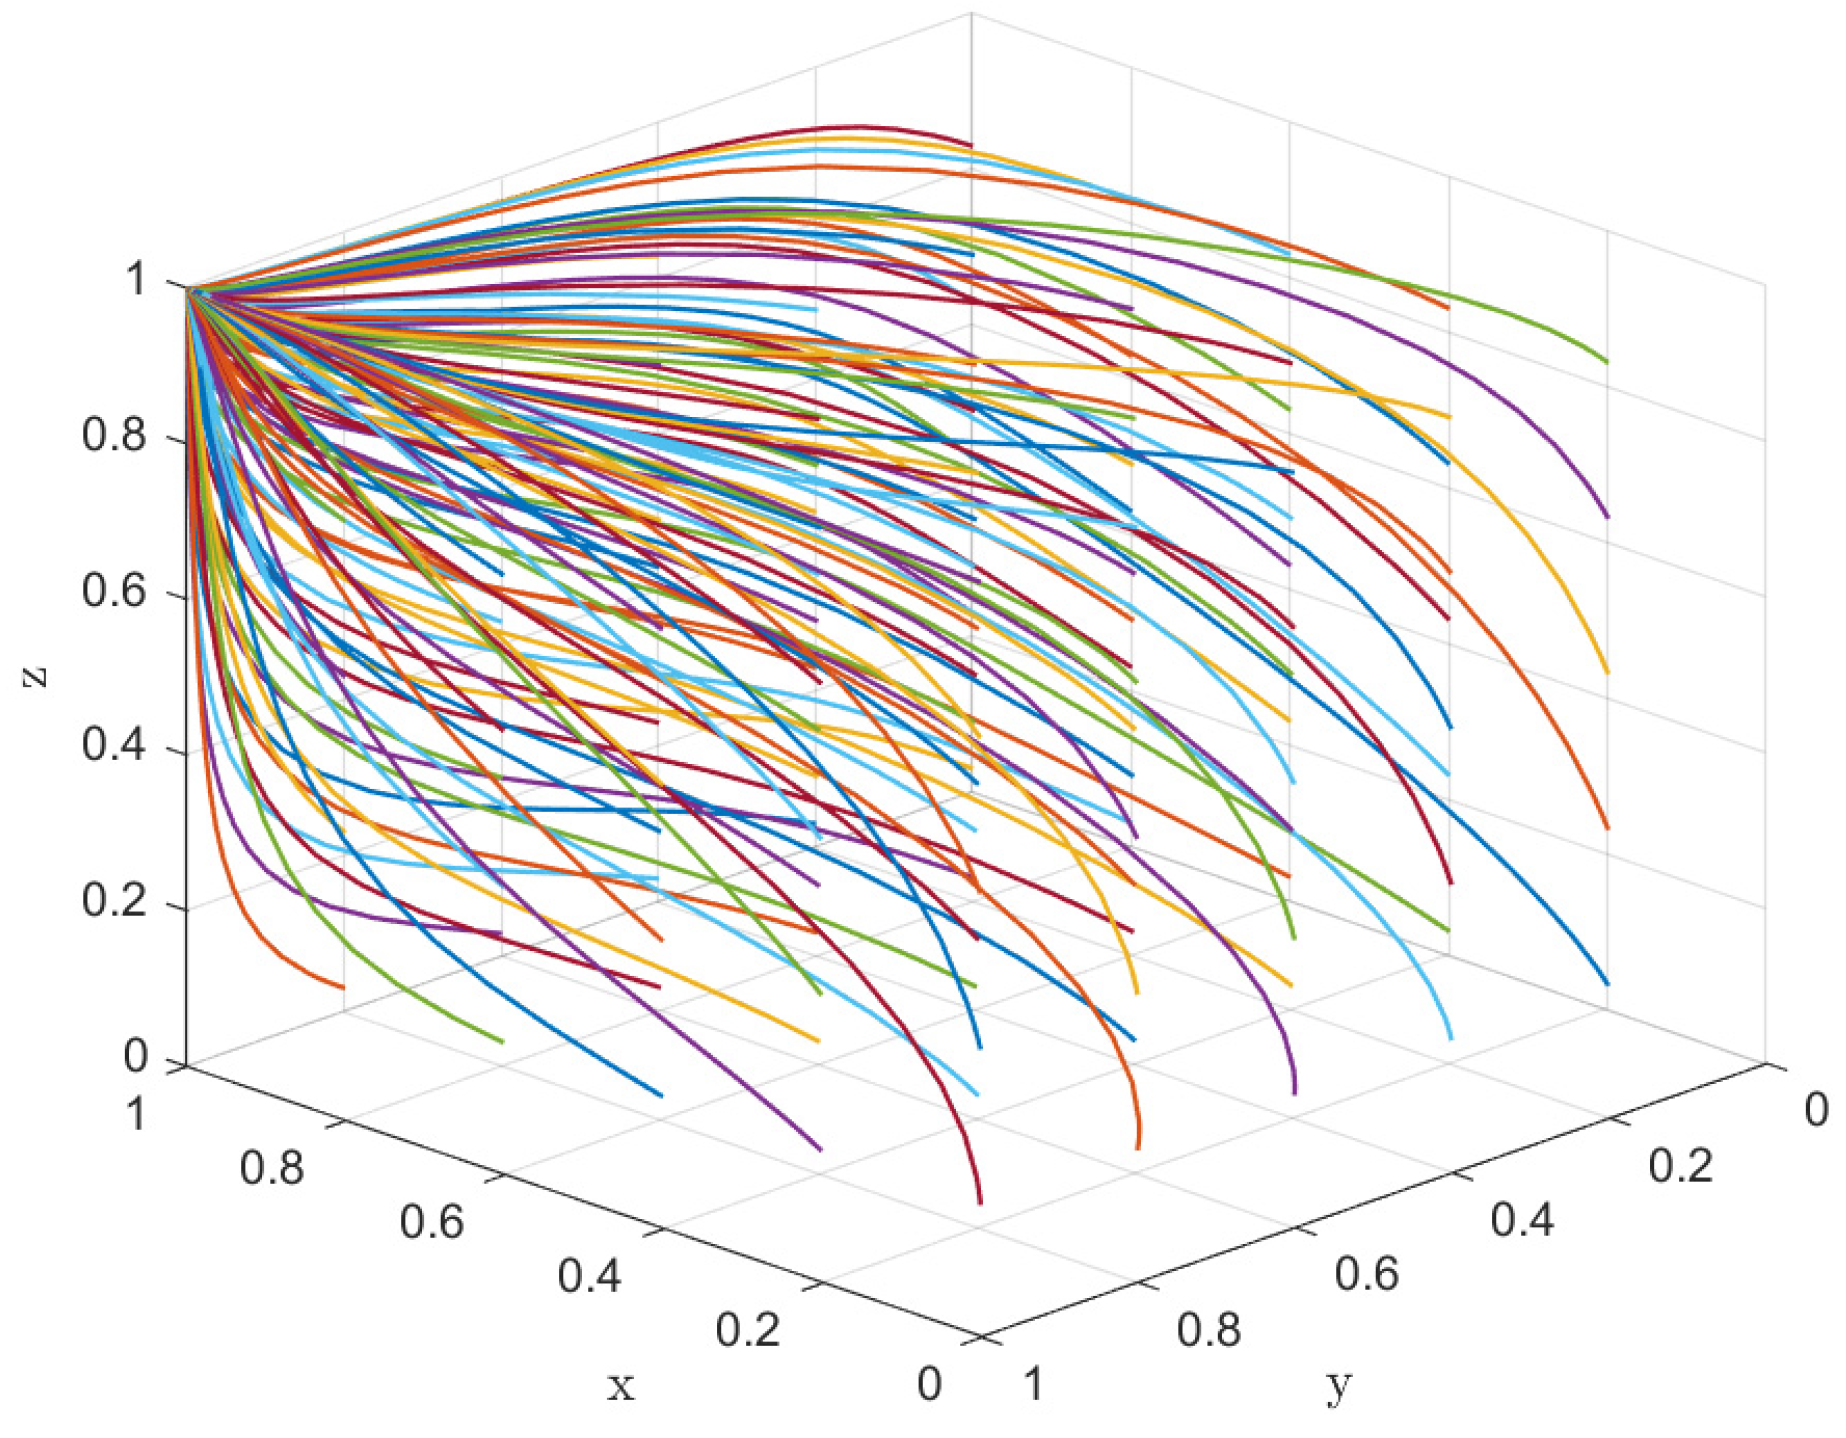
5.1. System Evolution Path Analysis

This study selects the vessel “Guoneng Changjiang 01”, operated by China Energy Company, as the basis for its parameter simulation. This vessel is China’s first 10,000-ton methanol dual-fuel ship. On its maiden voyage, it transported coal from the Changhong Terminal to the Tongling Power Plant, covering a total distance of 179.2 nautical miles. A 10,000-ton vessel typically consumes approximately 5 tons of conventional fuel per 100 km. Given that the energy density of methanol is approximately 50–60% that of conventional marine fuel, an average value of 55% is adopted. Based on this, the methanol fuel consumption of the ship is estimated as being approximately 9.1 tons per 100 km.
Assuming that the vessel operates regularly between the Jiangyin and Tongling terminals, completing three round trips per month, the fuel consumption per round trip is estimated to be approximately 32.6 tons for methanol or 17.9 tons for conventional fuel. With the current market prices of green methanol and conventional marine fuel at 5948 yuan/ton and 5506 yuan/ton, respectively, the monthly additional fuel cost of operating on methanol is calculated to be CNY 286,042. In addition, the cost of the “Guoneng Changjiang 01” vessel exceeds that of a conventional vessel by approximately 6 million yuan. Allocated over the vessel’s operational lifespan, the additional technical cost is estimated to be CNY 15,152 per month. Therefore, C c is CNY 301,194 per month.
According to the Implementation Rules for Subsidies for the Decommissioning and Renewal of Old Operational Vessels in the Transportation Sector, newly built clean, energy-powered, operational vessels are eligible for subsidies. Based on this rule, the total subsidy value for the “Guoneng Changjiang 01” vessel is estimated to be approximately CNY 12.617 million. Furthermore, in accordance with the Opinions on the Implementation of the Mandatory Retirement System for Transport Vessels, the mandatory retirement age for inland bulk cargo vessels is 33 years. Based on this, the estimated subsidy S c is calculated as CNY 31,861per month.
The penalties imposed by the government on shipping enterprises that fail to reduce their emissions are directly correlated with their carbon emissions. The total carbon emissions Q of a vessel can be calculated using the formula Q = m × C F , where m represents the amount of fuel consumed and C F represents the carbon conversion factor of the fuel. The carbon conversion factor for methanol fuel is 1.375, while that for conventional fuel is 3.206. Using this formula, the extra carbon emission reduction achieved by the “Guoneng Changjiang 01” vessel through methanol-fueled transportation is estimated to be 37.7 tons. According to the Interim Regulations on Carbon Emission Trading Management, enterprises that fail to settle their carbon emission allowances will be subject to fines ranging from at least 5 times to at most 10 times the monthly average transaction price in the carbon market. Referring to the Global and China Carbon Market Review and Outlook (2025), the average carbon trading price in China in 2023 was 68.2 yuan/ton. Assuming an eight-fold penalty multiplier, the fine for non-compliance T s is calculated as CNY 20,660. Other parameters are referenced from the relevant literature and determined based on the equilibrium conditions of the model. Additional parameter references are provided in Li et al., 2023; Liang et al., 2024; Zhang and Feng, 2024 [31,36,37], with the final model parameters presented in Table 5.
Given that emission reduction strategies in China’s shipping industry are still in their nascent stages, numerous challenges persist. The initial strategy probabilities for the government, shipping enterprises, and shippers were set at 0.1, leading to a tripartite evolutionarily stable strategy, as depicted in Figure 5.
Figure 5 illustrates the three-stage evolutionary dynamics of the tripartite strategies, ultimately converging to E8(1,1,1). This outcome signifies that the strategy combination of active government regulation, proactive emission reduction by shipping enterprises, and supervision by shippers becomes evolutionarily stable when the collective benefits outweigh the associated costs. In the first stage, the government rapidly shifts toward an active regulatory strategy, which is primarily driven by the intensification of penalties for non-compliance. The shipping enterprises initially exhibit a neutral stance but subsequently accelerate their transition toward proactive emission reduction, outpacing the evolution of the shippers’ supervisory behavior. The latter initially progresses rapidly due to the perceived weak commitment of the enterprises to emission reduction. During the second stage, the shipping enterprises gradually stabilize in their adoption of proactive emission reduction strategies, which is supported by compliance with regulatory policies and the receipt of subsidy incentives. Concurrently, the rate of increase in supervisory behavior among the shippers begins to decelerate as corporate environmental responsibility becomes more pronounced. In the third stage, the strategic choices of both the government and the shipping enterprises reach a stable state. With the continued increase in government subsidies, the shippers are further incentivized to adopt supervisory strategies, ultimately leading to the stabilization of all three strategies at the equilibrium point.
To further investigate the impact of different initial strategy combinations on the overall evolution path of the system, 125 initial strategy combinations were generated by cyclically varying the initial strategy probabilities of the three stakeholders in increments of 0.2. The resulting overall evolutionary paths are depicted in Figure 6. As shown, regardless of the initial strategy distribution, the system consistently converges to the equilibrium point E 8 ( 1 , 1 , 1 ) , corroborating the results of the prior dynamic analysis.

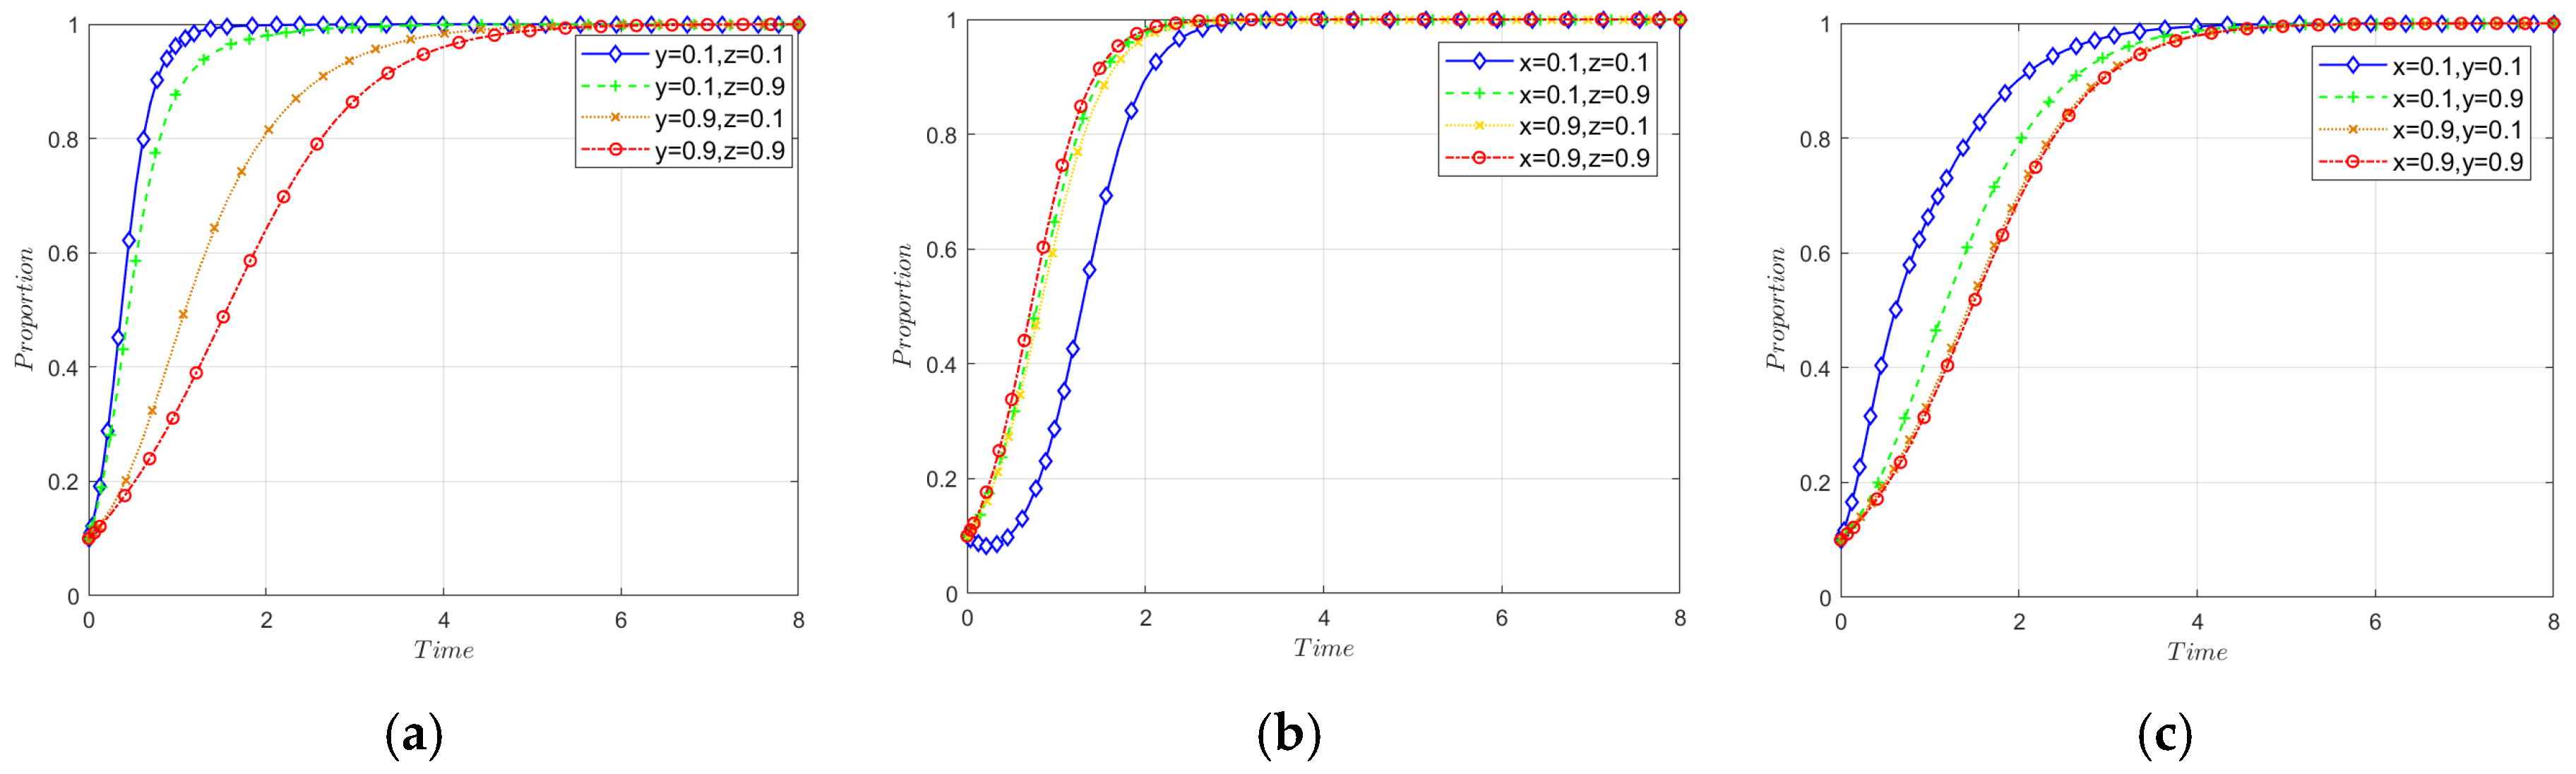
5.2. Impact of Initial Strategies on Evolutionary Stability

By fixing the initial strategy selection probability x of one party at 0.1 and changing the initial probabilities of the other two parties to 0.1 or 0.9, respectively, four sets of simulations are generated. This approach examines the influence of the initial strategic choices of the other two actors on the strategic evolution of the focal party. The aim is to explore how the initial decisions of stakeholders shape the behavioral dynamics and eventual outcomes of the fixed party within the game framework. The results of the strategic evolution for local governments, shipping enterprises, and shippers are presented in Figure 7.
As shown in Figure 7a, the probability of governments adopting an active regulatory strategy ultimately converges to 1. The speed of this evolution is inversely related to the emission reduction efforts of shipping enterprises and the supervision levels of shippers. This indicates that, when shipping enterprises actively reduce their emissions and shippers effectively monitor the shipping enterprises, the adverse environmental impact is mitigated, thereby reducing the urgency for local governments to maintain stringent regulatory intervention.
Figure 7b reveals that the adoption of proactive emission reduction strategies by shipping enterprises is significantly accelerated by either active government regulation or shipper supervision, with the latter playing a particularly prominent role. This underscores the vital role of shippers in incentivizing changes in corporate behavior. Therefore, through appropriate policy instruments that strengthen shipper supervision, governments can further enhance the emission reduction performance of shipping enterprises.
In Figure 7c, it can be seen that, while the initial strategies of governments and shipping enterprises influence the rate at which shippers adopt supervisory behavior, the system ultimately converges to a stable state in which shippers consistently choose to supervise. When both government regulation and corporate emission reduction are weak, shippers tend to increase their supervisory engagement to fill the governance gap. In contrast, under strong government regulation, shippers’ supervisory behavior becomes less dependent on enterprise strategies, as effective governmental oversight reduces the need for complementary supervision.

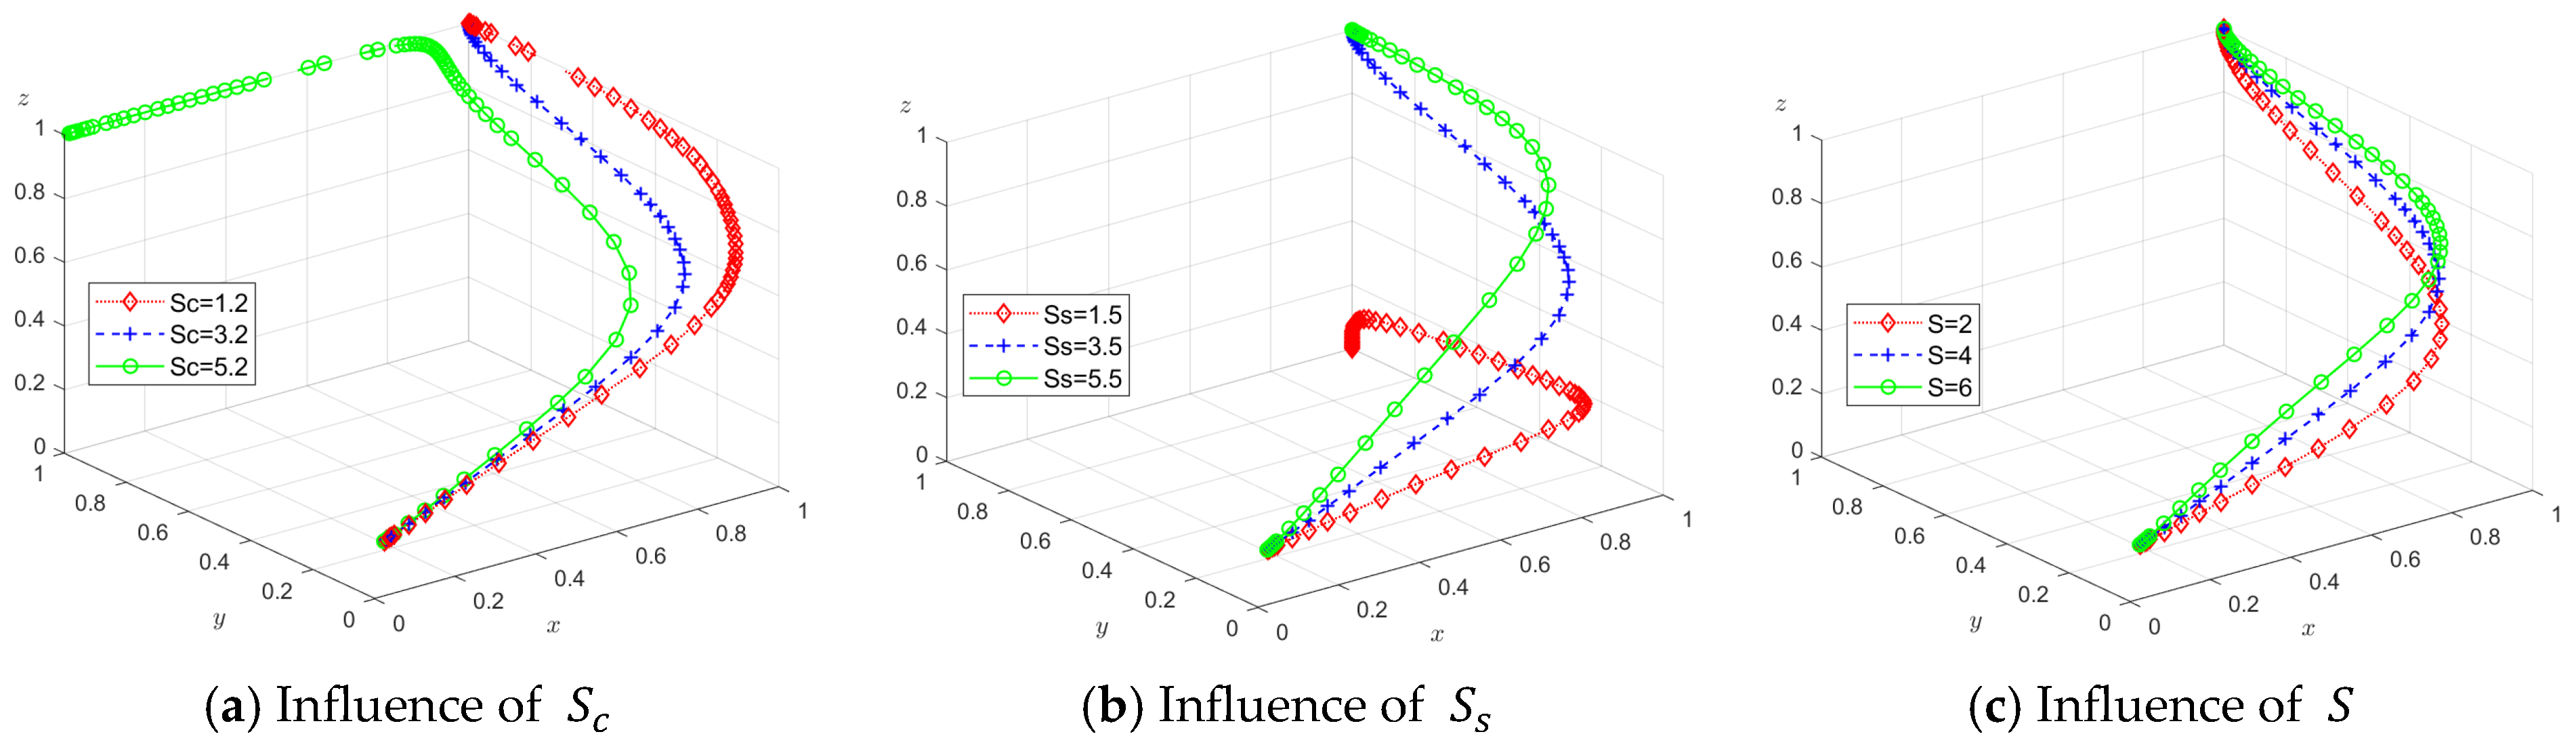
5.3. Analysis of the Impact of Single-Factor Changes on System Evolution

Keeping the other parameters constant, we analyze the individual effects of changes in subsidy or penalty parameters on the evolutionary equilibrium of the strategies taken by the government, shipping enterprises, and shippers.

5.3.1. Impact of Government Subsidies

While keeping the government penalty parameters T S = 2 and T = 5 constant, we set low subsidies: S c = 1 , S s = 1.5 , S = 1 ; moderate subsidies: S c = 2 , S s = 2.5 , S = 3 ; and high subsidies: S c = 3 , S s = 3.5 , S = 5 . We separately analyze the effects of S c , S s , and S on the evolutionary game process and outcomes of the system. The simulation results are shown in Figure 8.
Figure 8a illustrates that increasing emission reduction subsidies S c can shift the system’s equilibrium from E 8 ( 1,1 , 1 ) to E 7 ( 0,1 , 1 ) . At relatively low subsidy levels, stringent government penalties support the stable coexistence of active regulation and proactive emission reduction. However, once the subsidy surpasses a critical threshold, the associated fiscal burden on the government begins to outweigh the social benefits, prompting a transition to passive regulation. Despite this, the enhanced economic attractiveness of proactive emission reduction—driven by the increased subsidies—accelerates its adoption among shipping enterprises. This result highlights that, while subsidies are an effective tool for incentivizing emission reduction, their scale must be carefully balanced to avoid undermining the regulatory willingness and fiscal sustainability of the government.
As depicted in Figure 8b, increasing the supervision subsidies for shippers can shift the equilibrium from E 5 ( 1,1 , 0 ) to E 8 ( 1,1 , 1 ) . When these subsidies are low, the overall governmental expenditure on supervision remains minimal, encouraging the government to quickly adopt an active regulatory stance. However, the supervision costs borne by shippers are not sufficiently offset, leading them to ultimately forgo supervision. As subsidies rise, although the government incurs higher supervision-related costs, the overall benefit still outweighs the expenditure, albeit with a slower rate of policy adoption. Simultaneously, the economic burden on shippers is gradually alleviated. When the subsidies reach a certain level, shippers shift from non-supervision to active supervision. This finding confirms that appropriately increasing the subsidies for shipper supervision can effectively foster their engagement in the emission reduction oversight process.
According to Figure 8c, as the reward for shipper reporting S increases, the system continues to converge to the stable equilibrium E 8 1,1 , 1 , although the pace of convergence changes. For the government, higher rewards raise the cost of active regulation, resulting in a slight decline in the adoption rate of regulatory strategies. Conversely, shippers accelerate their adoption of supervision strategies as the reward increases, driven by greater potential returns. These dynamics suggest that, although increased rewards do not alter the final strategy choice of shippers, they significantly enhance the speed at which shippers transition toward supervision. In essence, targeted financial incentives can serve as a powerful tool to expedite the formation of a cooperative emission reduction environment among all three actors.

5.3.2. The Impact of Government Penalties

Keeping the government subsidy parameters S c = 2 ,   S s = 2.5 , and S = 3 fixed, different penalty settings are applied: low penalty: T S = 1 , T = 3 ; moderate penalty: T S = 2 , T = 5 ; high penalty: T S = 3 , T = 7 . The impacts of T s and T on the evolutionary game process and outcomes of the system are analyzed separately, and the simulation results are presented in Figure 9.
As shown in Figure 9a, with the continuous increase in T S , the evolutionary rates of the government’s adoption of active regulation and the shipping enterprises’ adoption of proactive emission reduction both accelerate, while the evolution rate of the shippers’ adoption of supervision strategies declines. This is because T S represents the penalties imposed by the government for passive emission reduction behavior by shipping enterprises—effectively serving as a potential benefit to the government. As T S increases, the incentives for the government to engage in active regulation are enhanced, thus accelerating the evolution toward this strategy. Simultaneously, the rising penalties raise the cost of passive behavior for shipping enterprises, prompting the faster adoption of proactive emission reduction strategies. However, as the government’s regulatory engagement intensifies, the relative influence of shippers within the emission reduction supervision system diminishes, leading to a slower evolution toward active supervision strategies by shippers.
Figure 9b illustrates that, as the penalty T —which is triggered by shippers’ reports of non-compliant enterprises—increases, the government’s evolution toward active regulation slows, while the rates at which shipping enterprises adopt proactive emission reduction and at which shippers adopt supervision strategies both accelerate. The reason for this is that a higher T makes passive regulation more attractive to the government due to the additional revenue from penalties without the need for proactive enforcement, thereby weakening the motivation for active regulatory behavior. Meanwhile, for shipping enterprises, the increased penalties significantly raise the cost of passive emission strategies, accelerating their shift toward proactive reduction. In turn, as the government’s regulatory role diminishes, the supervisory role of shippers becomes more crucial, driving an increase in their strategy adoption rate.
Comparing Figure 8 and Figure 9 reveals that the influence of a single government subsidy factor on the evolutionary game process and the outcome of the system is greater than that of a single government penalty factor. Specifically, when a single government subsidy factor changes, the government’s strategy choice is most sensitive to S c , while the shippers’ strategy choice is most sensitive to S s . When a single government penalty factor changes, although the evolution rates of the strategies chosen by the three parties may vary, the system ultimately converges to the stable point E 8 1,1 , 1 .

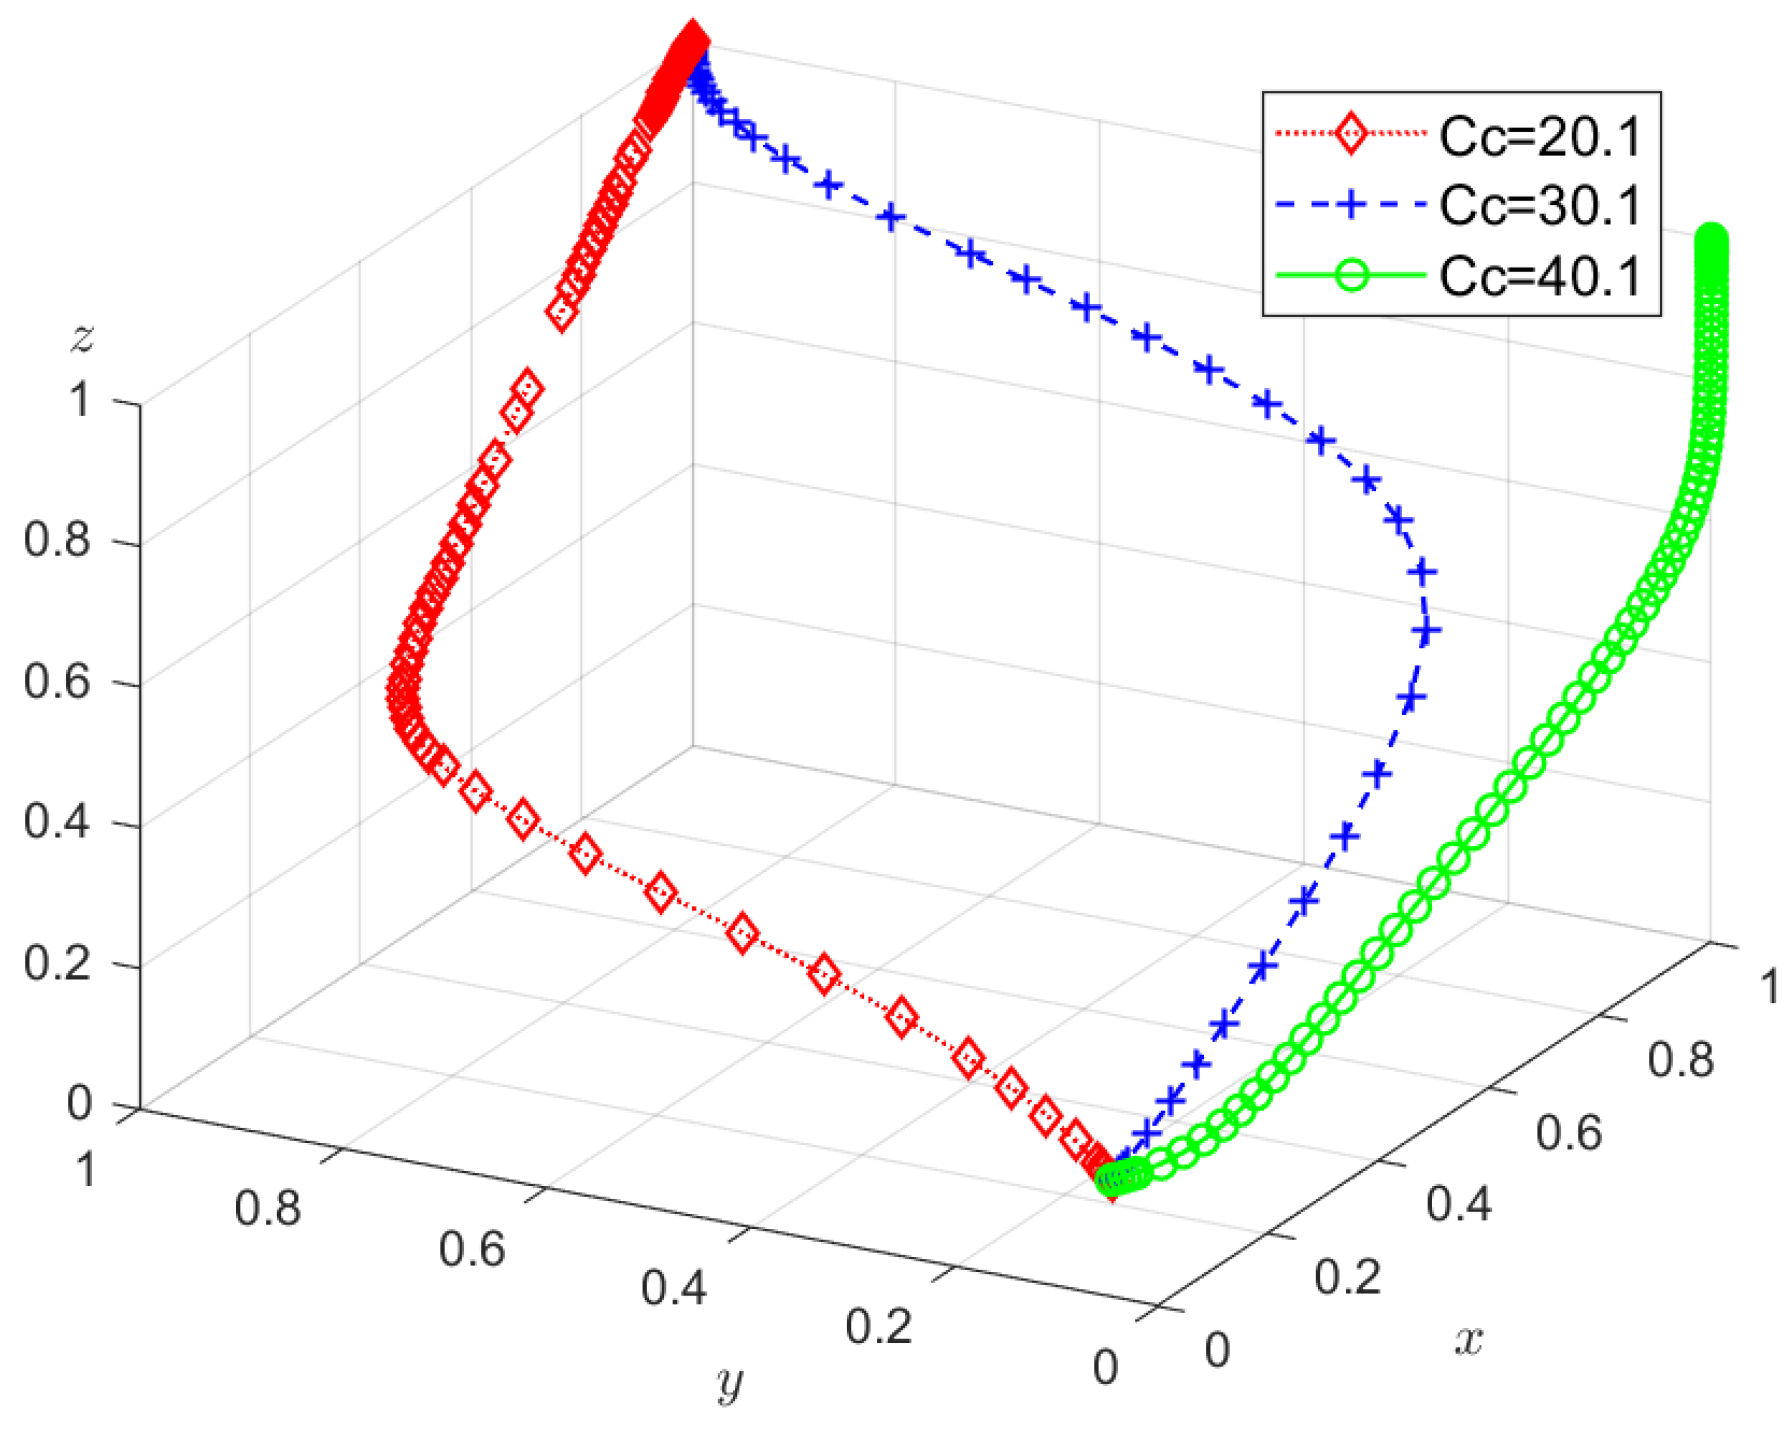
5.3.3. The Impact of Cost-Benefit Factors on Shipping Enterprises

The parameters C c and R e also influence the emission reduction strategies of shipping enterprises. Figure 10 and Figure 11 demonstrate the impacts of C c and R e on the system’s evolutionary path.
Figure 10 indicates that an increase in the additional cost ( C c ) associated with proactive emission reduction by shipping enterprises leads to a rapid shift in their strategies from proactive to passive emission reduction. Given that the low-carbon transition of the shipping industry is still in its early stages, high technological costs discourage some shipping enterprises from voluntarily engaging in emission reduction efforts, making government regulation and shipper supervision crucial.
Figure 11 reveals that the mechanism of additional emission reduction benefits ( R e ) closely mirrors that of C c . From an economic perspective, higher R e values not only offset emission reduction costs but also create additional profit margins, incentivizing enterprises to transition from passive to proactive strategies.
In practice, governments can leverage this pattern through dual approaches. On one hand, the government should compensate shipping enterprises for their emission reduction costs through subsidies, tax incentives, and other policies, alleviating their financial pressure and preventing them from adopting a passive approach to emission reduction due to excessive costs. On the other hand, the government should strengthen low-carbon awareness campaigns to stimulate the growth of consumer preference for low-carbon options. This will encourage shippers to prioritize low-carbon transportation services, thereby creating pressure on shipping enterprises to actively reduce their emissions. Through the power of market choice, the positive incentive effect of R e can be further enhanced. Shipping enterprises themselves should also recognize the long-term benefits of emission reduction and not abandon these efforts solely due to short-term cost pressures. By leveraging government policy support, they can increase investment in technological research and development, gradually lowering the cost of emission reduction technologies and enhancing their overall competitiveness.

5.4. Analysis of the Impact of Multi-Factor Changes on System Evolution

In order to comprehensively compare the effects of subsidies and penalties under different government regulatory strategies on the evolutionary equilibria of shipping enterprises and shippers, and to provide insights for the government to formulate regulatory strategies that align with its own development, the strategic evolution of the system under single- and mixed-incentive mechanisms is analyzed.

5.4.1. Single Regulatory Mechanism

Four types of single regulatory mechanisms are set: type 1 (subsidy, no penalty), type 2 (high subsidy, no penalty), type 3 (no subsidy, penalty), and type 4 (no subsidy, high penalty). The evolutionary paths of the system’s strategies are simulated and analyzed, as shown in Figure 12.
In Figure 12a, it is evident that, regardless of whether the government implements subsidy or penalty strategies, the likelihood of the government selecting an active regulatory strategy converges toward 1. However, when the government adopts a high-subsidy, no-penalty approach, the government initially opts for active regulation. As the system evolves, the probability of the government choosing active regulation gradually declines. This is because, in the short term, the government employs active regulation while providing substantial subsidies to shipping enterprises and shippers to incentivize proactive emission reduction. Over time, however, the financial burden of high subsidies places significant strain on the government, diminishing its inclination toward active regulation and resulting in a reduced probability of adopting such a strategy.
Figure 12b shows that the government’s subsidy mechanism effectively promotes emission reduction among shipping enterprises, with higher subsidy levels accelerating the adoption of proactive emission reduction strategies by these enterprises. However, when the government relies solely on a penalty strategy without adjusting the intensity of the penalties, the likelihood of shipping enterprises choosing proactive emission reduction strategies approaches zero. This demonstrates that a subsidy mechanism is more effective than a penalty mechanism. If a penalty-only approach is adopted, the government must enhance the penalty intensity to incentivize shipping enterprises to adopt proactive emission reduction measures.
Figure 12c illustrates that, for shippers, if the government relies solely on penalties for regulation, the likelihood of shippers adopting a supervision strategy rapidly approaches zero, regardless of the penalty intensity. Implementing high subsidies, however, can alter the supervision strategy of shippers. Moreover, the rate at which shippers adopt a supervision strategy is directly proportional to the level of subsidy that is provided.

5.4.2. Mixed Regulatory Mechanism

A deeper examination of how hybrid regulatory approaches influence the development and adaptation of system strategies provides critical insights into the dynamics of policy effectiveness and stakeholder behavior. By exploring the interplay between different regulatory mechanisms, this analysis highlights their combined effects on the evolution of strategic decision-making within the studied system. Four types of mixed regulatory mechanisms are considered: type 1 (low subsidy, low penalty), type 2 (high subsidy, low penalty), type 3 (low subsidy, high penalty), and type 4 (high subsidy, high penalty). The results of their impact on the system’s evolutionary path are shown in Figure 13.
Based on the results depicted in Figure 13, it can be observed that, when government subsidies are at a higher level, the system evolution stabilizes at E 7 ( 0,1 , 1 ) . Conversely, when government subsidies are at a lower level, high-level government penalties lead the system to stabilize at E 5 ( 1,1 , 0 ) , while low-level government penalties result in system stabilization at E 2 ( 1,0 , 0 ) . Combining the preceding analyses, it is evident that the strategy choices of the government and shippers are primarily influenced by the subsidy values, whereas the strategy choice of shipping enterprises is more affected by the penalty values. Furthermore, it is noted that neither high nor low levels of subsidies and penalties can achieve stability at E 8 ( 1,1 , 1 ) . Since E8 represents a state of full stakeholder alignment (active regulation, proactive emission reduction, and supervision), which ensures sustained greenhouse gas reductions through synergistic incentives, it is critical to adjust the subsidies and penalties to stabilize the system at the optimal equilibrium point E 8 . While emission reductions may occur under other equilibria, E 8 institutionalizes a self-reinforcing system where penalties and subsidies mutually enhance compliance and market-driven supervision, minimizing the long-term enforcement risks. Consequently, under active government regulation, appropriately reducing subsidies and increasing penalties can promote proactive emission reduction by shipping enterprises. If the government aims to enhance the effectiveness of shippers in the supervision system, it should consider increasing subsidies, particularly those provided to shippers, to stimulate their supervision of shipping enterprises in order to actively reduce emissions.

6. Conclusions and Prospects

6.1. Conclusions

This paper develops a tripartite evolutionary game model to analyze the strategic interactions among governments, shipping enterprises, and shippers regarding carbon reduction efforts. The findings offer valuable insights into the dynamic equilibrium of stakeholder strategies and provide practical recommendations for advancing maritime decarbonization. The main conclusions and policy recommendations of this study are as follows.
(1)
The strategic decisions made by shipping enterprises, governments, and shippers are strongly influenced by the initial probability distributions of the choices made by other stakeholders. Government regulation and shipper supervision play pivotal roles in fostering the commitment of shipping enterprises to reduce emissions. However, increased supervision by shippers diminishes the regulatory pressure on the government, leading to a gradual relaxation of governmental oversight.
(2)
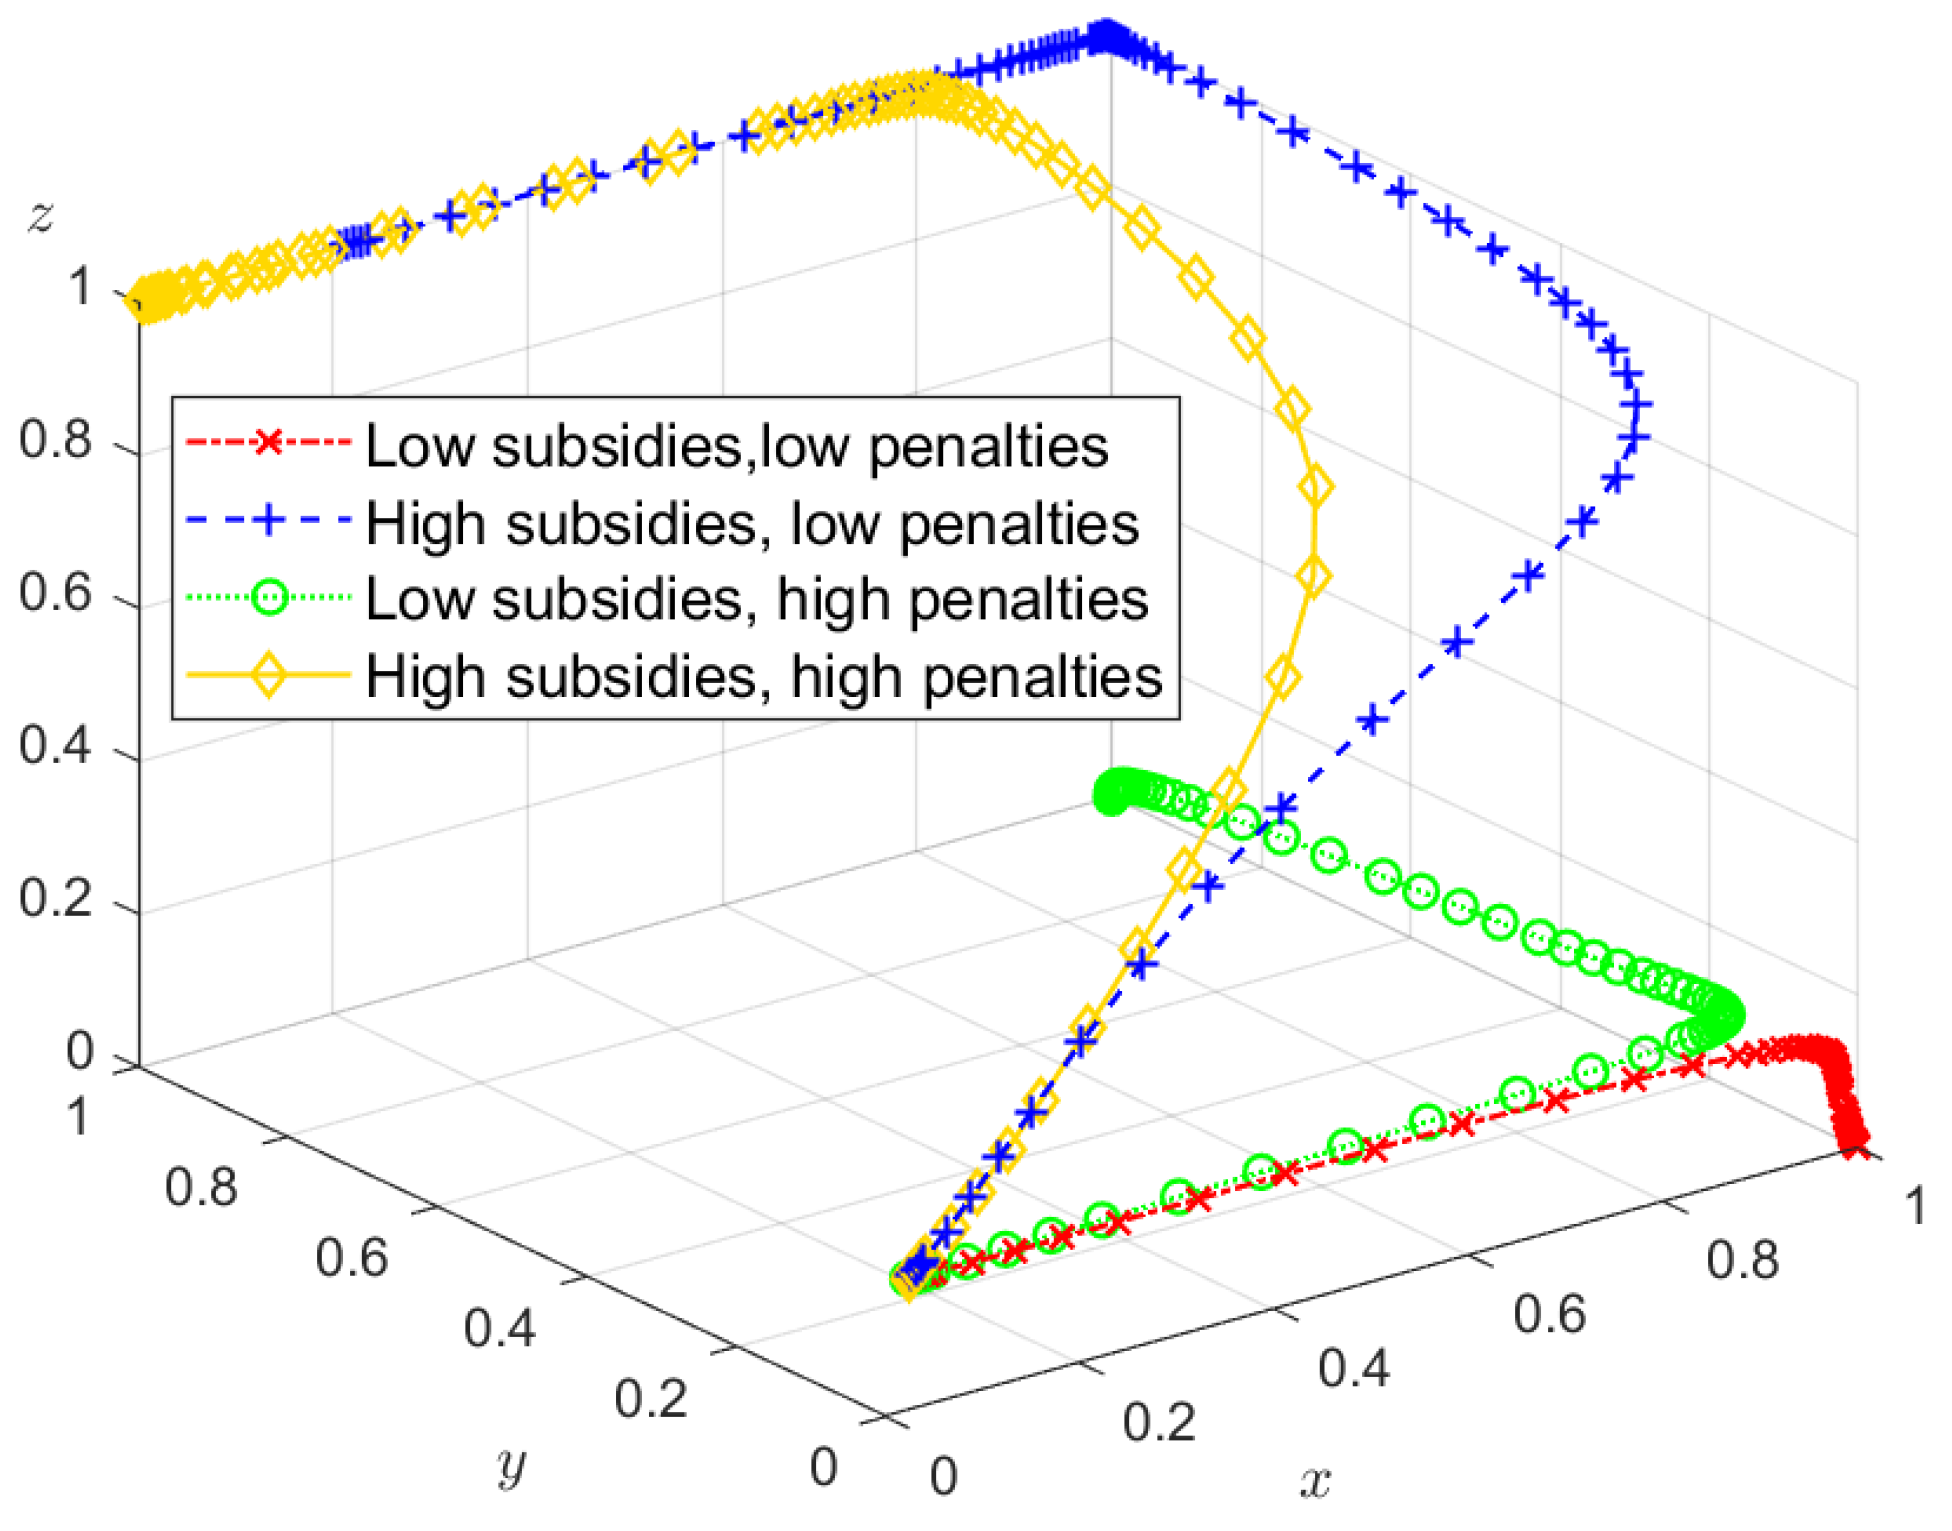
The proactive emission reduction strategies of shipping enterprises are driven by a combination of subsidies and penalties. When applied independently, either subsidies or penalties alone result in suboptimal outcomes. However, a hybrid reward-and-penalty mechanism facilitates the attainment of an optimal system equilibrium. The success of shipper supervision is contingent upon the government’s incentives. Insufficient subsidies undermine shipper engagement, thus diminishing the overall effectiveness of emission reductions. Conversely, excessively high subsidy values can impose a heavy financial burden on the government, consequently reducing its enthusiasm for regulation.
(3)
Additional emission reduction costs and potential benefits are key factors that influence shipping enterprises’ carbon emission reduction strategies. In the initial stages of the shipping industry’s low-carbon transition, the high costs of technological innovation to allow for low-carbon solutions result in limited motivation regarding emission reduction. Lowering the costs of emission reduction and increasing the revenue linked to emission reduction can incentivize shipping enterprises to adopt proactive carbon reduction strategies.

6.2. Managerial Insights

Based on the above analysis, we demonstrate the following policy implications and recommendations to improve sustainable development:
(1)
The government could implement a phased regulatory approach. Initially, it should actively regulate and provide subsidies to incentivize shipping enterprises to invest in emission reduction. As the industry advances in its low-carbon transition, the regulatory strategy should gradually shift towards a market-driven model, placing greater emphasis on shipper supervision and corporate self-regulation.
(2)
The government should balance fiscal constraints and regulatory effectiveness by implementing a hybrid incentive policy. This should involve moderate increases in penalties for shipping enterprises, as well as enhanced incentives for shippers to sustain long-term emission reduction efforts. For example, a tiered subsidy-and-penalty system could be adopted to dynamically adjust the intensity of incentives based on actual emission reductions. Furthermore, bolstering financial incentives for shippers can increase their willingness to supervise, thereby encouraging proactive emission reduction from shipping enterprises.
(3)
Shipping enterprises may adopt a phased approach. In the short term, they should prioritize the transition to cleaner fuels. Additionally, ship captains ought to familiarize themselves with the emission regulations in target regions, select low-carbon routes, and optimize their sailing speeds. In the long term, shipping enterprises could apply for government subsidies to support technological innovations, such as shore power installations and energy-efficient ship designs, to achieve long-term cost savings.
(4)
The government can introduce a green shipping label system, incorporating carbon footprint certification and low-carbon awareness campaigns, to encourage shippers to prioritize low-carbon transportation services, thereby generating demand-driven incentives for shipping enterprises to adopt more sustainable practices.
This study offers valuable insights for carbon reduction policymaking in the shipping industry; however, certain limitations persist. Factors such as the scale of shipping enterprises and regional policy variations significantly influence corporate emission reduction strategies. Moreover, the cost structure of emission reduction differs, encompassing fuel costs, technological upgrade expenses, and operational costs, each of which has distinct impacts on corporate decision-making. Future research could integrate variables such as enterprise scale and regional policy enforcement levels, further refining the analysis of how various types of emission reduction costs influence the decision-making processes of shipping enterprises.

Author Contributions

Software, Y.D.; Validation, Y.D.; Formal analysis, J.L. and Y.D.; Investigation, Y.S.; Resources, Y.S.; Data curation, Y.S.; Writing—original draft, J.L. and Y.D.; Writing—review & editing, Y.S.; Visualization, J.L.; Supervision, J.L. All authors have read and agreed to the published version of the manuscript.

Funding

This research received no external funding.

Data Availability Statement

No new data were created or analyzed in this study. Data sharing is not applicable to this article.

Conflicts of Interest

The authors declare no conflict of interest.

References

  1. Kim, H.; Koo, K.Y.; Joung, T.-H. A study on the necessity of integrated evaluation of alternative marine fuels. J. Int. Marit. Safety Environ. Aff. Shipp. 2020, 4, 26–31. [Google Scholar] [CrossRef]
  2. IMO. Working Group Agrees Guidelines to Support New GHG Measures. 2021. Available online: https://www.imo.org/en/MediaCentre/PressBriefings/pages/ISWG-GHG-8.aspx (accessed on 17 December 2024).
  3. Li, J.-M.; Jiang, S.-S. How can governance strategies be developed for marine ecological environment pollution caused by sea-using enterprises?—A study based on evolutionary game theory. Ocean Coast. Manag. 2022, 232, 106447. [Google Scholar] [CrossRef]
  4. Schwartz, H.; Gustafsson, M.; Spohr, J. Emission abatement in shipping–Is it possible to reduce carbon dioxide emissions profitably? J. Clean. Prod. 2020, 254, 120069. [Google Scholar] [CrossRef]
  5. He, Z.; Wang, D.; Li, J.; Fang, W.; Yang, Y.; Ji, M. An Evolutionary Stability Study of Zero-Carbon Transition for Shipping Enterprises Considering Dynamic Penalty and Carbon Quota Trading Mechanisms. Sustainability 2024, 16, 10684. [Google Scholar] [CrossRef]
  6. Barreiro, J.; Zaragoza, S.; Diaz-Casas, V. Review of ship energy efficiency. Ocean Eng. 2022, 257, 111594. [Google Scholar] [CrossRef]
  7. Wang, Z.; Dong, B.; Li, M.; Ji, Y.; Han, F. Configuration of Low-Carbon fuels green marine power systems in diverse ship types and Applications. Energy Convers. Manag. 2024, 302, 118139. [Google Scholar] [CrossRef]
  8. Bei, Z.; Wang, J.; Li, Y.; Wang, H.; Li, M.; Qian, F.; Xu, W. Challenges and Solutions of Ship Power System Electrification. Energies 2024, 17, 3311. [Google Scholar] [CrossRef]
  9. Guo, H.; Li, J.; Yang, B.; Mao, X.; Zhou, Q. Green scheduling optimization of ship plane block flow line considering carbon emission and noise. Comput. Ind. Eng. 2020, 148, 106680. [Google Scholar] [CrossRef]
  10. Tomos, B.A.D.; Stamford, L.; Welfle, A.; Larkin, A. Decarbonising international shipping–A life cycle perspective on alternative fuel options. Energy Convers. Manag. 2023, 299, 117848. [Google Scholar] [CrossRef]
  11. Wang, Z.; Zhao, F.; Dong, B.; Wang, D.; Ji, Y.; Cai, W.; Han, F. Life cycle framework construction and quantitative assessment for the hydrogen fuelled ships: A case study. Ocean Eng. 2023, 28, 114740. [Google Scholar] [CrossRef]
  12. Wang, Y.; Iris, Ç. Transition to near-zero emission shipping fleet powered by alternative fuels under uncertainty. Transp. Res. Part D Transp. Environ. 2025, 142, 104689. [Google Scholar] [CrossRef]
  13. Sun, L.; Ding, P.; Xiong, Y.; Liu, W.; Hu, Z. Carbon emission reduction of shore power from power energy structure in China. Front. Mar. Sci. 2022, 9, 1077289. [Google Scholar] [CrossRef]
  14. Xue, Y.; Lai, K.-H.; Wang, C. How to invest decarbonization technology in shipping operations? Evidence from a game-theoretic investigation. Ocean Coast. Manag. 2024, 251, 107076. [Google Scholar] [CrossRef]
  15. Sun, L.; Wang, X.; Lu, Y.; Hu, Z. Assessment of ship speed, operational carbon intensity indicator penalty and charterer profit of time charter ships. Heliyon 2023, 9, e20719. [Google Scholar] [CrossRef]
  16. Lan, X.; Tao, Q.; Wu, X. Liner-Shipping Network Design with Emission Control Areas: A Real Case Study. Sustainability 2023, 15, 3734. [Google Scholar] [CrossRef]
  17. Venturini, G.; Iris, Ç.; Kontovas, C.A.; Larsen, A. The multi-port berth allocation problem with speed optimization and emission considerations. Transp. Res. Part D Transp. Environ. 2017, 54, 142–159. [Google Scholar] [CrossRef]
  18. Gao, X.; Zhu, A.; Yu, Q. Exploring the Carbon Abatement Strategies in Shipping Using System Dynamics Approach. Sustainability 2023, 15, 13907. [Google Scholar] [CrossRef]
  19. Lin, B.; Huang, C. Analysis of emission reduction effects of carbon trading: Market mechanism or government intervention? Sustain. Prod. Consum. 2022, 33, 28–37. [Google Scholar] [CrossRef]
  20. Wang, T.; Wang, X.; Meng, Q. Joint berth allocation and quay crane assignment under different carbon taxation policies. Transp. Res. Part B Methodol. 2018, 117, 18–36. [Google Scholar] [CrossRef]
  21. Herdzik, J. Decarbonization of Marine Fuels—The Future of Shipping. Energies 2021, 14, 4311. [Google Scholar] [CrossRef]
  22. Zhang, Q.; Chen, C.; Zheng, J.; Chen, L. Quantitative evaluation of China’s shipping decarbonization policies: The PMC-Index approach. Front. Mar. Sci. 2023, 10, 1119663. [Google Scholar] [CrossRef]
  23. Ye, J.; Chen, J.; Shi, J.; Jiang, X.; Zhou, S. Novel synergy mechanism for carbon emissions abatement in shipping decarbonization. Transp. Res. Part D Transp. Environ. 2024, 127, 104059. [Google Scholar] [CrossRef]
  24. Li, M.; Luan, J.; Li, X.; Jia, P. An Analysis of the Impact of Government Subsidies on Emission Reduction Technology Investment Strategies in Low-Carbon Port Operations. Systems 2024, 12, 134. [Google Scholar] [CrossRef]
  25. Li, S.; Dong, C.; Yang, L.; Gao, X.; Wei, W.; Zhao, M.; Xia, W. Research on Evolutionary Game Strategy Selection and Simulation Research of Carbon Emission Reduction of Government and Enterprises under the “Dual Carbon” Goal. Sustainability 2022, 14, 12647. [Google Scholar] [CrossRef]
  26. Huang, X.; Liu, G.; Zheng, P. Dynamic analysis of a low-carbon maritime supply chain considering government policies and social preferences. Ocean Coast. Manag. 2023, 239, 106564. [Google Scholar] [CrossRef]
  27. Zhou, H.; Zhang, W. Choice of Emission Control Technology in Port Areas with Customers’ Low-Carbon Preference. Sustainability 2022, 14, 13816. [Google Scholar] [CrossRef]
  28. McKinnon, A. The possible influence of the shipper on carbon emissions from deep-sea container supply chains: An empirical analysis. Marit. Econ. Logist. 2014, 16, 1–19. [Google Scholar] [CrossRef]
  29. Chen, J.; Xiong, W.; Xu, L.; Di, Z. Evolutionary game analysis on supply side of the implement shore-to-ship electricity. Ocean Coast. Manag. 2021, 215, 105926. [Google Scholar] [CrossRef]
  30. Xu, L.; Di, Z.; Chen, J. Evolutionary game of inland shipping pollution control under government co-supervision. Mar. Pollut. Bull. 2021, 171, 112730. [Google Scholar] [CrossRef]
  31. Zhang, S.; Feng, C. Evolutionary game model for decarbonization of shipping under green shipping corridor. Int. J. Low-Carbon Technol. 2024, 19, 2502–2511. [Google Scholar] [CrossRef]
  32. Wu, X.; Liu, P.; Wei, Q. Analysis on Evolutionary Stability Strategies of Carbon Emission of Logistics Enterprises Based on Carbon Tax. Math. Probl. Eng. 2021, 2021, 9941243. [Google Scholar] [CrossRef]
  33. Xiao, G.; Cui, W. Evolutionary game between government and shipping enterprises based on shipping cycle and carbon quota. Front. Mar. Sci. 2023, 10, 1132174. [Google Scholar] [CrossRef]
  34. Meng, L.; Liu, K.; He, J.; Han, C.; Liu, P. Carbon emission reduction behavior strategies in the shipping industry under government regulation: A tripartite evolutionary game analysis. J. Clean. Prod. 2022, 378, 134556. [Google Scholar] [CrossRef]
  35. Zhang, S.; Zhang, W. A four-party evolutionary game analysis of carbon emission reduction behavioral strategies in the shipping industry. International J. Low-Carbon Technol. 2024, 19, 1561–1578. [Google Scholar] [CrossRef]
  36. Li, X.; Kuang, H.; He, H. Research on the Evolution Game of Emission Reduction in Port and Shipping Systems under Government Environmental Regulations. Transp. Syst. Eng. Inf. 2023, 23, 17–29. [Google Scholar] [CrossRef]
  37. Liang, J.; Zhang, L.; Dou, Y. Evolutionary game analysis of emission reduction strategies between port and shipping enterprises and shippers under carbon trading mechanism. Int. J. Shipp. Transp. Logist. 2024, 19, 505–524. [Google Scholar] [CrossRef]
Figure 1. Stakeholders’ relationships in the emission reduction evolutionary game.
Sustainability 17 03895 g001
Figure 2. Replication dynamic phase diagram of government.
Sustainability 17 03895 g002
Figure 3. Replication dynamic phase diagram of shipping enterprises.
Sustainability 17 03895 g003
Figure 4. Replication dynamic phase diagram of shippers.
Sustainability 17 03895 g004
Figure 5. Evolutionary trajectory with an initial probability of 0.1.
Sustainability 17 03895 g005
Figure 6. Tripartite evolutionary trajectory with random initial probabilities.
Sustainability 17 03895 g006
Figure 7. Evolutionary strategies of tripartite entities. (a) The influence of the initial probabilities of y and z on x, (b) The influence of the initial probabilities of x and z on y, (c) The influence of the initial probabilities of x and y on z.
Sustainability 17 03895 g007
Figure 8. Influence of government subsidies.
Sustainability 17 03895 g008
Figure 9. The influence of government penalties.
Sustainability 17 03895 g009
Figure 10. The influence of C c .
Sustainability 17 03895 g010
Figure 11. The influence of R e .
Sustainability 17 03895 g011
Figure 12. The impact of single regulatory mechanism on system strategy evolution.
Sustainability 17 03895 g012
Figure 13. The influence of mixed regulatory mechanisms on system strategies evolution.
Sustainability 17 03895 g013
Table 1. Comparative analysis.
LiteraturesAnalytical MethodAnalysis
Perspective
Theoretical Contribution
Meng et al.
(2022) [34]
Tripartite
evolutionary
game
This paper analyzes the interaction of carbon emission reduction strategies among the government, port enterprises, and shipping enterprises.
(1)
Subsidies can encourage shipping enterprises to reduce emissions.
(2)
The emission reduction strategies of ports and shipping enterprises are influenced by their own cost-benefit factors.
Xue et al. (2024) [14]Stackelberg game modelDrawing on mental accounting theory, this paper integrates operational accounts and carbon asset accounts into the model to examine the decarbonization technology investment strategies of ports and shipping companies.
(1)
Carbon accounts are more conducive to strengthening decarbonization investment decisions than operational accounts.
(2)
As the cooperation share of shipping companies increases, single-party investment by ports can maximize benefits.
He et al.
(2024) [5]
Bilateral
evolutionary game model
This paper analyzes the strategic interactions between governments and shipping enterprises in zero-carbon transition and key influencing factors under the carbon trading mechanism.
(1)
The dynamic penalty mechanism can better promote the convergence of strategies between the two sides of the game to a stable equilibrium than the static mechanism.
(2)
There is a threshold effect between carbon trading prices and emission reduction intensity, and the adjustment of government regulatory strategies lags behind changes in enterprise behaviors.
This paperTripartite evolutionary gameThis paper analyzes the interaction of carbon emission reduction strategies among the government, shipping enterprises and shippers.See Section 6
Table 2. Parameter settings.
ParameterDefinition
I Enhanced social approval received by local governments during active regulation.
W Social welfare benefits generated by shipping enterprises’ proactive emission reduction.
D Environmental damage caused by shipping enterprises’ passive emission reduction.
A Improved customer evaluation received by shipping enterprises engaging in proactive emission reduction.
C g Additional regulatory costs incurred by local governments during active regulation.
C c Additional costs borne by shipping enterprises for engaging in proactive emission reduction.
C s Costs incurred by shippers for diligently supervising shipping enterprises’ emission reduction.
S c Rewards from local governments to shipping enterprises for proactive emission reduction.
S s Rewards from the government to shippers engaging in active supervision.
S Rewards from the government to shippers for reporting instances of passive emission reduction behavior by shipping enterprises.
T Penalties imposed by the government on shipping enterprises for reported instances of passive emission reduction.
T s Penalties imposed by local governments on shipping enterprises for passive emission reduction under active regulation.
R e Additional revenue obtained by shipping enterprises due to proactive emission reduction.
E ETS surcharges paid by shippers to shipping enterprises.
Table 3. The tripartite payoff matrix.
GovernmentShipping EnterprisesShipper
Supervision ( z )Non-Supervision ( 1 z )
Active regulation ( x )Proactive emission reduction ( y ) I + W C g S c S s
S c + E C c + R e + A
S s C s E
I + W C g S c
S c + E C c + R e
E
Passive emission reduction ( 1 y ) I + T s C g S s D
E T s
S s C s E
I + T s C g D
E T s
E
Passive regulation ( 1 x )Proactive emission reduction ( y ) W S s
E C c + R e + A
S s C s E
W
E C c + R e
E
Passive emission reduction ( 1 y ) T S D S s
E T
S s + S C s E
D
E
E
Table 4. Eigenvalues of the Jacobian matrix.
Equilibrium PointEigenvalue λ 1 Eigenvalue λ 2 Eigenvalue λ 3 SymbolStability
E 1 ( 0 , 0 , 0 ) I C g + T s R e C c S C s + S s (+,*,*)Unstable fixed
E 2 ( 1 , 0 , 0 ) C g I T s R e C c + S c + T s S s C s (−,*,*)Uncertain
E 3 ( 0 , 1 , 0 ) I C g S c C c R e S s C s (*,*,*)Uncertain
E 4 ( 0 , 0 , 1 ) I C g + S T + T s A C c + R e + T C s S S s (*,*,*)Uncertain
E 5 ( 1 , 1 , 0 ) C g I + S c C c R e S c T s S s C s (*,*,*)Uncertain
E 6 ( 1 , 0 , 1 ) C g I S + T T s A C c + R e + S c + T s C s S s (*,*,*)Uncertain
E 7 ( 0 , 1 , 1 ) I C g S c C c A R e T C s S s (*,*,*)Uncertain
E 8 ( 1 , 1 , 1 ) C g I + S c C c A R e S c T s C s S s (*,*,*)Uncertain
Table 5. Parameter values.
Parameter I A C g C c C s S c S s S T T s R e
Value (ten thousand)80.43.530.123.23.5452.128
Disclaimer/Publisher’s Note: The statements, opinions and data contained in all publications are solely those of the individual author(s) and contributor(s) and not of MDPI and/or the editor(s). MDPI and/or the editor(s) disclaim responsibility for any injury to people or property resulting from any ideas, methods, instructions or products referred to in the content.

