Abstract
The Pandameru River Basin, South India, is affected by high levels of contamination from human activities and the over-exploitation of groundwater for agriculture, both of which pose significant threats to water quality and its availability for drinking and irrigation. To explore sustainable groundwater management, this study presents a machine learning-driven approach to basin-scale groundwater potential zone (GWPZ) mapping by integrating remote sensing (RS), a geographic information system (GIS), and the random forest (RF) algorithm. The research leverages ten thematic layers—including lithology, geomorphology, soil type, lineament density, slope, drainage density, land use/land cover (LULC), NDVI, SAVI, and rainfall—to assess groundwater availability. The RF model, trained with well-distributed groundwater data, provides an optimized classification of GWPZs into five categories: very good (5.84%), good (15.21%), moderate (27.25%), poor (27.22%), and very poor (24.47%). The results indicate that excellent groundwater zones are predominantly located along highly permeable alluvial deposits, whereas low-potential zones coincide with impermeable geological formations and steep terrains. Field validation using piezometric readings and well data confirmed significant variations in water table depths, ranging from 5 m to over 150 m. The groundwater potential map achieved an accuracy of 86%, underscoring the effectiveness of the RF model in predicting groundwater availability. This high-precision mapping technique enhances decision-making for sustainable groundwater management, supporting long-term water conservation, equitable resource allocation, and climate-resilient water strategies. By providing reliable insights into groundwater distribution, this study contributes to the sustainable utilization of groundwater resources in semiarid regions, aiding policymakers and planners in mitigating water scarcity challenges and ensuring water security for future generations.
1. Introduction
Groundwater is a crucial resource for sustaining human life, agriculture, and industrial activities, particularly in regions facing water scarcity. It constitutes nearly 30% of the world’s freshwater supply and serves as a primary source for drinking water, irrigation, and industrial applications [1,2]. However, rapid population growth, urbanization, and climate variability have intensified pressure on groundwater resources, leading to over-extraction, declining water tables, and quality deterioration. These challenges necessitate the development of efficient groundwater management strategies to ensure the sustainable utilization and conservation of this vital resource.
India, one of the largest consumers of groundwater globally, relies heavily on this resource to support its agricultural sector, which sustains millions of livelihoods. Approximately 60% of the country’s irrigation needs are met through groundwater, making it a cornerstone of food security [3,4]. However, excessive abstraction, coupled with erratic rainfall patterns and climate change, has resulted in significant groundwater depletion in several parts of the country, particularly in semiarid regions where surface water resources are limited. Semiarid environments, characterized by low precipitation, high evapotranspiration rates, and sporadic recharge events, are highly vulnerable to water stress. Effective groundwater management in these regions is imperative to sustain agricultural productivity, rural water supply, and ecological balance [5,6,7]. Identifying and mapping GWPZs in such landscapes is a critical step toward ensuring the judicious and long-term use of available groundwater resources.
The assessment of groundwater potential has traditionally relied on hydrogeological surveys and field-based investigations, which, although accurate, are often time-consuming and resource-intensive. In recent years, advancements in geospatial technology and data-driven modeling approaches have revolutionized groundwater studies, offering efficient and scalable solutions for groundwater potential mapping. Remote sensing (RS) provides valuable spatial information on geological, hydrological, and environmental parameters that influence groundwater availability [8,9]. Geographic information systems (GIS) facilitate the integration and analysis of multi-source geospatial data, enabling the generation of thematic maps and spatial models that aid in groundwater assessment [10,11,12]. Machine-learning (ML) techniques have emerged as powerful tools for groundwater potential mapping, offering robust predictive capabilities and improved accuracy over traditional methods. Among various ML algorithms, the RF model has gained prominence due to its ability to handle complex, nonlinear relationships between multiple hydrogeological parameters and groundwater occurrence [13,14,15,16]. RF is an ensemble learning method that combines multiple decision trees to enhance predictive performance, reduce overfitting, and provide reliable classification results. Several studies have demonstrated the effectiveness of RF in GWPZ mapping, highlighting its superior accuracy in comparison to conventional statistical and deterministic models [17,18]. The integration of RF with geospatial techniques allows for the efficient processing of large datasets, enabling comprehensive groundwater potential analysis at regional and local scales.
The Pandameru River Basin experiences water quality issues due to chemical and biological contaminants from household, industrial, and agricultural activities, which could potentially impact human health and agricultural productivity. Therefore, this study focuses on delineating GWPZs in the Pandameru River Basin, South India, by integrating RS, GIS, and the RF machine learning model. The study area, located in a semiarid region, experiences significant variations in groundwater availability due to seasonal fluctuations and hydrogeological heterogeneity. To achieve a comprehensive groundwater potential assessment, multiple thematic layers, including lithology, geomorphology, lineament density, slope, soil characteristics, drainage density, LULC, and vegetation indices, are incorporated into the RF model for classification and prediction. The RF algorithm assigns relative importance to each parameter based on its contribution to groundwater occurrence, ensuring a data-driven and objective approach to groundwater potential mapping.
While numerous studies have employed machine-learning techniques for GWPZ mapping, this research advances the field by integrating a comprehensive set of hydrogeological, geomorphological, and environmental parameters within the RF model to enhance predictive accuracy. Unlike previous studies that often rely on a limited number of influencing factors or conventional statistical approaches, this study incorporates a diverse array of thematic layers—including lithology, lineament density, LULC, and vegetation indices, ensuring a more holistic assessment of groundwater occurrence. Additionally, applying RF in the semiarid environment of the Pandameru River Basin provides novel insights into groundwater potential under conditions of high spatial variability and seasonal fluctuations. By optimizing the selection of predictor variables and evaluating their relative importance, this study refines groundwater potential mapping methodologies, offering improved decision-making tools for sustainable groundwater management. The findings contribute to the growing body of research on machine-learning applications in hydrogeology while demonstrating the robustness of RF in data-driven groundwater exploration.
The primary objective of this research is to enhance the accuracy and reliability of groundwater potential assessment through machine learning-based classification. By leveraging the predictive capabilities of the RF model, this study aims to generate high-resolution groundwater potential maps that can aid water resource planners, hydrogeologists, and policymakers in promoting sustainable groundwater management. The findings will provide critical insights into groundwater distribution patterns within the Pandameru River Basin, facilitating evidence-based decision-making for water conservation, recharge planning, and equitable resource allocation. Ensuring sustainable groundwater utilization is crucial in semiarid regions where water scarcity threatens agricultural productivity and livelihoods. Furthermore, this research contributes to the growing body of knowledge on the application of machine learning in hydrogeological studies, demonstrating the potential of RF as a robust tool for groundwater exploration, long-term resource sustainability, and climate-resilient water management strategies.
2. Materials and Methods
2.1. Study Area
The study area is situated in the central part of Anantapur District, Andhra Pradesh, South India, within the coordinates of 17°20′00″ to 17°44′00″ N latitude and 14°16′00″ to 14°40′00″ E longitude. It falls within the Peninsular Gneissic Complex, comprising geological formations such as hornblende–biotite gneisses, closepet granites, and schists. These formations influence groundwater occurrence, with fractures and weathered zones serving as primary storage and flow pathways. Hydrogeologically, the area consists of unconfined to semi-confined aquifers within the weathered and fractured zones of gneisses and granites. The weathered zone extends to depths of 5–15 m, forming shallow aquifers with limited storage capacity, while the fractured zone reaches 20–50 m, supporting a deeper groundwater flow. The groundwater is largely confined to secondary porosity features, including joints, fractures, and faults, which control its movement and storage. Aquitards, formed by massive and less fractured granites, restrict vertical groundwater flow, leading to localized variations in groundwater potential.
Furthermore, previous hydrogeological surveys conducted in the region have identified the major aquifer systems and confirmed the dominance of crystalline hard rock aquifers with limited primary porosity. Basic hydro-chemical investigations indicate that the groundwater quality generally falls within acceptable limits for irrigation and domestic use, although localized zones of high salinity have been reported. Despite the region’s dependence on groundwater, comprehensive datasets on water quality and long-term monitoring remain sparse, highlighting the need for integrated studies like the present work. The region is classified as semiarid, with an average annual rainfall of approximately 550 mm. Groundwater depth varies between 10 and 30 m, with flow predominantly following the topographical gradient from north to south and southeast. Due to the area’s heavy reliance on groundwater for drinking and agricultural use, excessive extraction and seasonal variability have led to declining water levels, raising sustainability concerns. Figure 1 provides a location map of the study area.
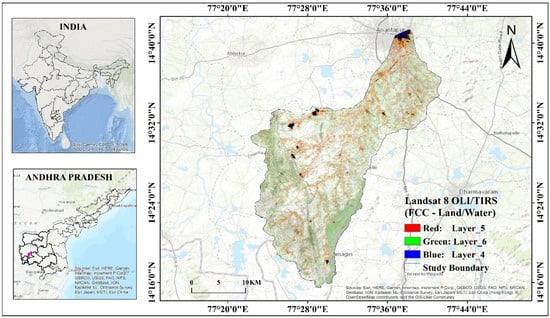
Figure 1.
Location map of the study area with FCC bands of Landsat 8 OLI/TIRS depicting land/water.
The primary objective of this study was to map GWPZs in the semiarid regions of the Pandameru River Basin using an RF machine-learning model. This study integrates multiple influencing factors such as lithology, land use, slope, rainfall, soil type, and vegetation cover. The RF model was trained using groundwater well data, and thematic layers were processed using GIS and RS techniques.
2.2. Thematic Layers’ Preparation
Thematic layers were prepared to serve as predictor variables for the RF model. Geological data were obtained from the Geological Survey of India (https://bhukosh.gsi.gov.in/Bhukosh/Public), providing essential lithological information for groundwater potential analysis. Drainage and slope maps were derived from the digital elevation model (DEM) using data from USGS Earth Explorer, offering insights into surface water flow and terrain characteristics [19,20]. Geomorphology and Normalized Difference Vegetation Index (NDVI) layers were generated using Landsat 8 OLI/TIRS satellite imagery, contributing to assessing landforms and vegetation cover. The land use and land cover (LULC) map for 2023 was classified based on Landsat 8 data, aiding in identifying land-use patterns that influence groundwater recharge. Lineament density maps were created using NRSC BHUVAN data, highlighting structural features that impact subsurface water movement. Soil type and rainfall data were collected from secondary sources to incorporate the influence of soil permeability and precipitation on groundwater availability. All spatial data underwent preprocessing in ArcGIS and QGIS, including georeferencing, resampling, reclassification, and standardization, ensuring uniformity and compatibility for integration into the RF model (Figure 2).
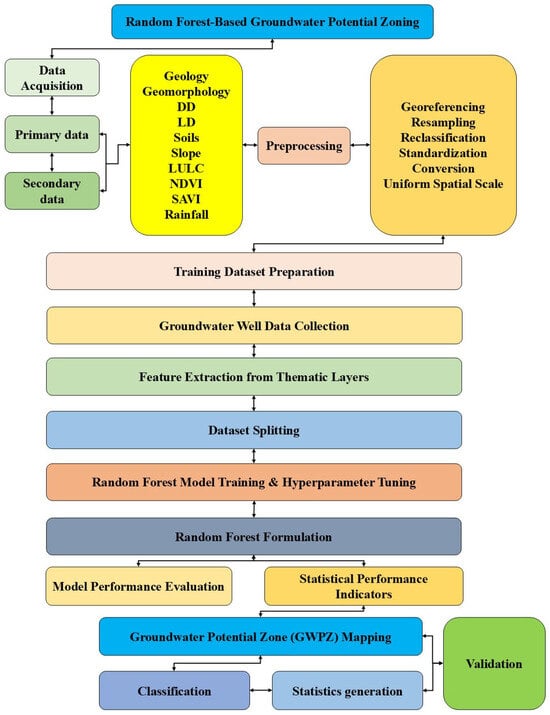
Figure 2.
Methodology flowchart.
2.3. Training Dataset Preparation
Groundwater well yield data from 46 observation wells were collected and categorized into five groundwater potential classes: very high, high, moderate, low, and very low. These classifications were based on recorded water levels and well productivity, providing a reliable reference for model training and validation. The dataset was divided into two subsets, with 70% allocated to training and 30% reserved for validation. This split ensured that the model had sufficient data to learn patterns while maintaining an independent set for accuracy assessment. Well locations were used as reference points to extract values from the prepared thematic layers. Each well was assigned corresponding attribute values from predictor variables, enabling the RF model to identify relationships between groundwater availability and influencing factors.
2.4. Machine Learning-Based RF Methodology
2.4.1. Data Preprocessing and Normalization
To ensure uniformity across input variables, min–max normalization was applied:
where X is the original value, and Xmin, Xmax are the minimum and maximum values of the dataset.
2.4.2. Training Dataset for Validation
Groundwater well yield data from 46 observation wells were categorized into five groundwater potential classes: very high, high, moderate, low, and very low. The dataset was split into 70% for training and 30% for validation. Well locations were used as reference points to extract values from the prepared thematic layers, enabling the RF model to establish relationships between groundwater availability and influencing factors [21,22].
2.4.3. Feature Selection and Importance Calculation
Gini index for feature importance:
where pi represents the probability of class i at a given node.
Mean decrease in accuracy (MDA):
where Acc original is the accuracy before permutation, and Acc permuted is after shuffling a feature.
2.4.4. RF Model Training
Each decision tree, Tt, was trained on a subset, Dt, of the Dataset, drawn randomly with replacement [23]:
Dt = {x1, x2, x3…}, k < N
2.4.5. Prediction for Classification
Prediction for GWPZs classification is achieved by selecting the class label most frequently predicted by the ensemble of decision trees in the RF.
2.4.6. Prediction for Regression
Prediction for Regression in the context of GWPZs mapping using RF is computed as the average of predictions from all individual decision trees in the ensemble.
where ht (x) is the prediction of tree t.
2.4.7. Feature Selection and Model Training
Feature importance analysis was conducted using the RF algorithm to identify the most influential parameters in groundwater potential mapping. By evaluating the contribution of each predictor variable, the model determined the relative significance of factors such as geology, slope, land use, rainfall, and lineament density in groundwater availability [24,25]. This analysis helped refine the input dataset by emphasizing the most relevant features. The RF model was trained using the prepared dataset with optimized hyperparameters to enhance predictive accuracy. Key parameters included the number of decision trees (n_estimators) ranging from 100 to 500, ensuring a balance between computational efficiency and model performance. The maximum depth of the trees (max_depth) was set between 10 and 50 to prevent overfitting while capturing complex patterns in the data. The minimum number of samples required to split an internal node (min_samples_split) varied from 2 to 10, while the minimum number of samples per leaf (min_samples_leaf) ranged from 1 to 5 to regulate tree growth and prevent overly specific divisions (Table 1). A 10-fold cross-validation technique was employed to optimize performance and minimize overfitting. This approach partitioned the training data into ten subsets, where the model was iteratively trained on nine subsets and validated on the remaining one. The process was repeated ten times, ensuring a robust assessment of model generalization. The final model was fine-tuned based on validation results, selecting the optimal set of hyperparameters for groundwater potential mapping.

Table 1.
Hyperparameters and their range considerations for RF.
A 10-fold cross-validation technique was employed to optimize performance, ensuring robustness and preventing overfitting.
2.4.8. Model Performance Evaluation
Accuracy (for classification models):
where TP (true positive), TN (true negative), FP (false positive), and FN (false negative) are classification results.
Root mean square error (RMSE) (for regression models):
where yi is the observed value, and yi is the predicted value.
Coefficient of determination (R2):
where y is the mean observed value.
2.4.9. Performance Considerations: RF vs. Other ML Techniques
While this study primarily employed the RF model for groundwater potential mapping, other machine-learning algorithms such as XGBoost, support vector machine (SVM), and artificial neural networks (ANN) have also demonstrated effectiveness in similar applications. RF was chosen for its robustness in handling complex, nonlinear relationships and its ability to provide feature importance analysis, which is crucial for understanding the influence of various hydrogeological parameters. However, to contextualize the performance of RF within the broader landscape of machine-learning models, a brief comparison with other ML approaches from the literature is provided in Table 2. Studies have shown that XGBoost often outperforms RF in cases requiring higher computational efficiency and feature interactions, while SVM excels in high-dimensional datasets with well-defined decision boundaries. ANN, on the other hand, offers significant predictive power but requires extensive parameter tuning and computational resources. This comparative analysis underscores the strengths of RF in groundwater potential mapping while acknowledging alternative approaches that may be explored in future research.
Table 2.
Comparative analysis of ML models for groundwater potential mapping.
2.5. Groundwater Potential Zone Mapping
The optimized RF model was applied to predict GWPZs by integrating thematic layers. Each raster cell was assigned a probability score based on predictor variables, classifying groundwater potential into five categories: very high, high, moderate, low, and very low. The results were mapped using ArcGIS, employing Raster Calculator for RF predictions, reclassify for classification, and weighted overlay to refine the model. Interpolation was used to analyze spatial variations, generating a final groundwater potential zone map for effective resource management [33,34]. The GWPZs were determined using the RF model by integrating ten thematic layers as predictor variables. Each parameter influences groundwater occurrence either directly or indirectly. The RF model assigns importance scores to these layers based on their contribution to groundwater potential prediction. The weighted influence of each layer was derived through feature importance analysis, optimizing model accuracy. Table 3 presents the assigned weights and normalized values for each criterion, reflecting their relative significance in the RF-based groundwater potential mapping.
Table 3.
List of criteria, weights, and normalized weights used in the RF model.
3. Results and Discussions
3.1. Random Forest (RF) Model
3.1.1. Normalization of Weights and Assignment in RF Model
In the RF model, the assignment of weights to thematic layers is determined through feature importance analysis, rather than manual ranking, as seen in AHP. The model evaluates the contribution of each parameter by analyzing its impact on groundwater potential prediction. Thematic layers with higher predictive influence, such as land use/land cover (LULC), lineament density, and geomorphology, were assigned greater importance based on their statistical significance in the RF model. The classification of thematic layers into multiple categories enhances the model’s ability to recognize complex spatial patterns. RF facilitates the identification of significant relationships among the ten predictor variables by iteratively constructing multiple decision trees and aggregating their outputs. The final weight assignments are derived from the cumulative influence of each parameter on groundwater potential classification. This data-driven approach ensures an unbiased and objective assessment of groundwater availability, improving the accuracy and reliability of groundwater potential zone mapping [35,36].
3.1.2. Feature Importance and Model Consistency in RF
In the RF model, the importance of each parameter is determined through feature importance analysis, rather than a pairwise comparison matrix. The model assigns significance scores to thematic layers by evaluating their contribution to groundwater potential classification based on decision tree splits. Higher importance scores indicate a stronger influence on predicting groundwater availability, with factors like lineament density, drainage density, and LULC often ranking as the most critical. Model consistency in RF is assessed using performance metrics such as the out-of-bag (OOB) error, Gini impurity, and permutation importance. Unlike AHP, which relies on consistency ratios (CRs) and eigenvalue calculations [37], RF validates feature importance through multiple iterations, ensuring robust and unbiased weight assignment (Table 4). This approach enhances model reliability, minimizes subjectivity, and strengthens groundwater potential zone delineation by leveraging statistical learning techniques [38].
Table 4.
Normalized feature importance scores from the RF model.
3.1.3. Feature Importance Analysis in RF Model
The RF model assigned varying levels of importance to the thematic layers used for groundwater potential zone mapping. The feature importance ranking (Table 5) was determined based on the mean decrease in accuracy (MDA) and mean decrease in Gini (MDG), which quantify the contribution of each criterion in the classification process. The results indicate that geology (15%) and rainfall (13%) emerged as the most influential factors, significantly impacting groundwater potential distribution. Geomorphology (GM) (12%), SAVI (12%), and soils (10%) also played crucial roles in determining groundwater availability. Factors like LULC (8%), NDVI (9%), and LD (10%) showed moderate influence, while slope (6%) and drainage density (5%) were identified as the least influential (Table 5). These findings highlight that geological and climatic conditions predominantly govern groundwater potential, while topographic and vegetation indices contribute relatively less. The RF model’s feature importance ranking provides a robust basis for prioritizing hydrogeological parameters in future groundwater assessments.
Table 5.
Feature importance ranking based on RF model.
3.2. Analysis
3.2.1. Geology
Geology plays a significant role in determining groundwater potential, as it directly influences subsurface permeability, porosity, and aquifer storage capacity. In the RF model, geology is integrated as a key predictor variable, helping to classify GWPZs based on lithological characteristics (Figure 3). The study area comprises hard rock terrains, including hornblende–biotite gneiss, hornblende gneiss, biotite gneiss, and migmatite, which exhibit low porosity and permeability, leading to limited groundwater recharge. These formations were assigned lower importance in the RF classification due to their restricted water-holding capacity. In contrast, granite/granodiorite formations in the southwestern region contain structural fractures and lineaments, enhancing secondary permeability. These features contribute to moderate groundwater storage and have been assigned higher importance in the model. Similarly, meta-basalts and schists in the southeastern regions exhibit variable permeability based on their degree of weathering. The RF model effectively identifies the influence of different lithological units in groundwater potential mapping, offering an objective, data-driven approach compared to traditional AHP-based weighting. The integration of geology with other hydrogeological parameters enhances the predictive accuracy of the model, providing a robust framework for groundwater resource assessment in the Pandameru River Basin.
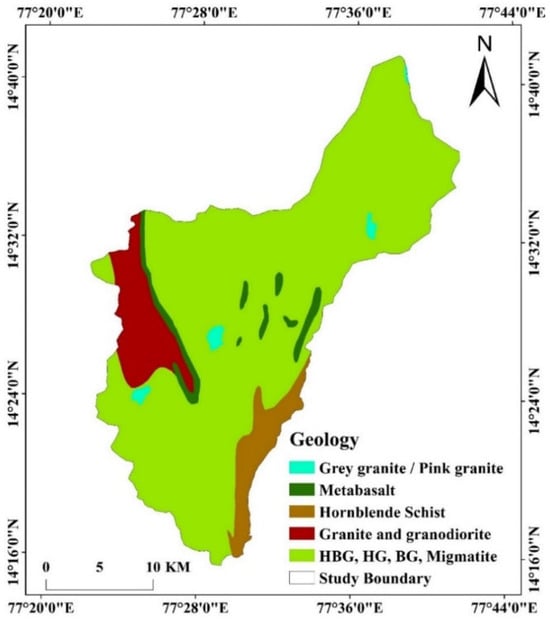
Figure 3.
Geology map of the study area.
3.2.2. Geomorphology
Geomorphology is a key factor in groundwater potential mapping, as landform characteristics influence infiltration, recharge, and subsurface water movement. In the RF model, geomorphological features serve as crucial predictors, helping to classify GWPZs based on topographic and structural attributes. The study area is dominated by denudational origin–pediment–peneplain complexes (DO-PPC) and structural origin–low dissected hills and valleys (SO-LDHV), which exhibit moderate percolation potential (Figure 4). Approximately 90% of the area comprises DO-PPC, characterized by relatively flat terrain that enhances water infiltration, making it a significant factor in the RF classification. The SO-LDHV landforms, with rugged and dissected features, restrict infiltration and are classified as low GWPZs. Satellite-based geomorphological mapping using RS and GIS has been instrumental in identifying these features, improving the accuracy of groundwater potential predictions. The RF model objectively evaluates the influence of geomorphology by analyzing its interactions with other hydrogeological parameters, leading to enhanced classification accuracy compared to traditional AHP-based approaches. This data-driven methodology ensures a more reliable delineation of GWPZs, aiding in sustainable water resource management in the Pandameru River Basin.
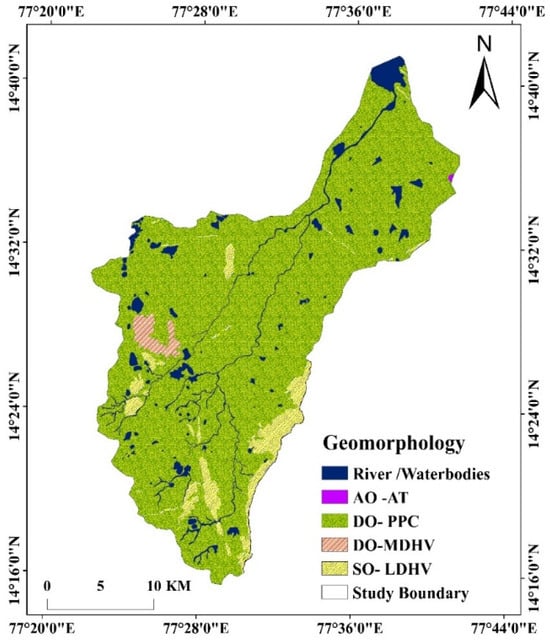
Figure 4.
Geomorphology map of the study area.
3.2.3. Soils
Soil properties significantly influence groundwater recharge, infiltration, and retention, making them crucial for RF-based groundwater potential mapping. The RF model leverages soil characteristics as predictive variables, assessing their impact on groundwater availability in a data-driven manner. The study area exhibits diverse soil types associated with low dissected hills, valleys, and pediment–pediplain complexes, each contributing differently to groundwater dynamics. Key soil parameters such as porosity, permeability, infiltration rate, and water retention capacity serve as important predictors in the RF classification process. Pediment–pediplain soils (denudational origin) exhibit moderate infiltration potential due to their compact nature, making them moderately significant for groundwater recharge. Soils in structural origin terrains (low dissected hills and valleys) have lower permeability, leading to limited groundwater retention (Figure 5). Anthropogenically influenced soils show compaction and altered drainage, affecting natural recharge patterns. By integrating soil characteristics with other geospatial parameters, the RF model enhances classification accuracy, ensuring robust predictions for GWPZs. This approach enables scientifically informed water resource management, facilitating effective groundwater conservation strategies in the Pandameru River Basin.
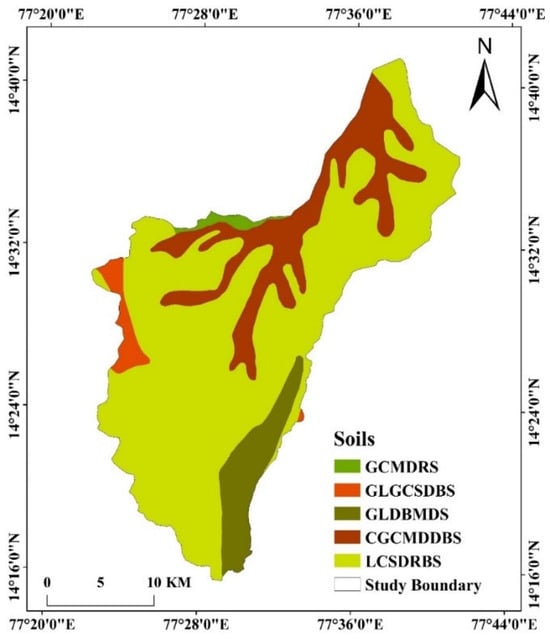
Figure 5.
Soils map of the study area.
3.2.4. Slope
Slope plays a vital role in groundwater recharge and flow dynamics, making it an essential predictor in RF-based modeling for GWPZ mapping. Steeper slopes promote rapid surface runoff, reducing infiltration and limiting groundwater recharge, whereas gentle slopes facilitate water percolation, enhancing groundwater retention. The RF model utilizes slope gradients derived from a digital elevation model (DEM) to assess their influence on groundwater availability. Slope classes are categorized into the following: very gentle slopes (0–2%)—high groundwater potential due to prolonged infiltration; gentle slopes (2–5%)—moderate groundwater potential, allowing sufficient water retention; moderate slopes (5–15%)—considered ‘good’ zones, balancing runoff and infiltration; steep slopes (15–35%)—limited groundwater recharge as water runs off quickly; very steep slopes (>35%)—minimal groundwater potential due to excessive runoff (Figure 6). In RF-based classification, the slope acts as a key predictor, interacting with other factors like soil type, geology, and geomorphology to enhance model accuracy. Gentle-to-moderate slopes exhibit higher groundwater suitability, aligning with field observations in the Pandameru River Basin. The RF-based approach ensures data-driven optimization, enabling precise GWPZ delineation for sustainable water resource management.
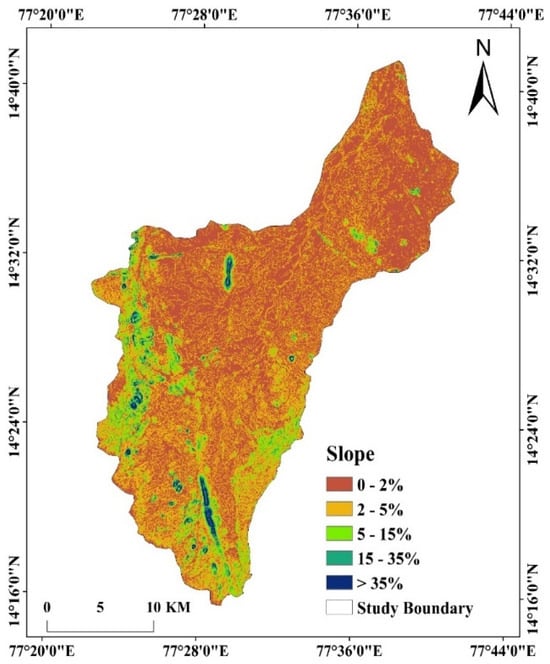
Figure 6.
Slope map of the study area.
3.2.5. Lineament Density
Lineaments, including faults, joints, and fractures, are key hydrogeological structures that influence groundwater movement, storage, and recharge potential. These linear features, extracted from satellite imagery and GIS-based edge-detection algorithms, serve as conduits for groundwater flow, making lineament density (LD) a crucial factor in RF—based modeling for GWPZ mapping (Figure 7). In RF analysis, LD is a critical predictor influencing groundwater occurrence. The study area’s LD values are classified into the following: 0.00–0.07 km/km2—minimal groundwater influence, limited fractures; 0.07–0.17 km/km2—low–moderate permeability, minor fault intersections; 0.17–0.29 km/km2—moderate groundwater flow, essential for recharge; 0.29–0.45 km/km2—high groundwater potential, well-connected fractures; and 0.45–0.83 km/km2—very high permeability, preferred zones for groundwater storage. Higher LD values (0.45–0.83 km/km2) indicate enhanced groundwater movement due to interconnected fractures and increased secondary porosity, making them the most significant zones in RF-based groundwater prediction models. Conversely, areas with low LD (<0.07 km/km2) have minimal groundwater retention due to a lack of structural discontinuities. By integrating LD with lithology, slope, and hydrogeological parameters, RF modeling enhances groundwater potential prediction accuracy, ensuring data-driven decision-making for sustainable groundwater exploration in the Pandameru River Basin.
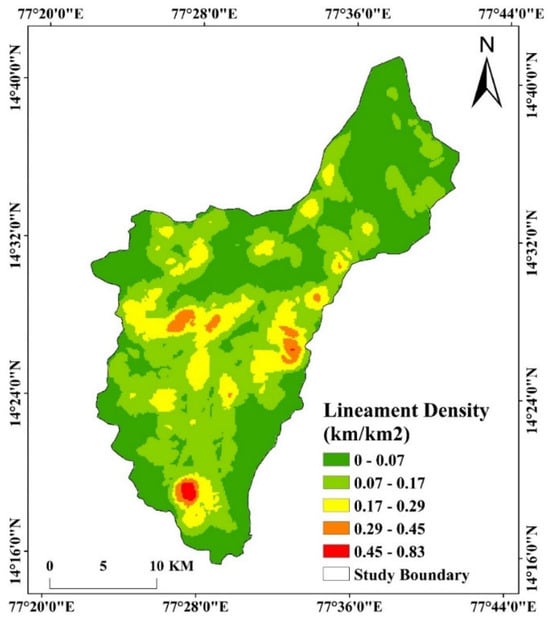
Figure 7.
Lineament density map of the study area.
3.2.6. Drainage Density
Drainage Density (DD), defined as the total length of streams per unit area, is a critical hydrological factor influencing groundwater infiltration and surface runoff. It shares an inverse relationship with permeability, where higher drainage density indicates lower infiltration potential and increased runoff. To derive the drainage density (DD) map, a 100 m-resolution DEM was processed in ArcGIS to compute flow direction and accumulation patterns. The study area was classified into five DD categories: 0.00–0.96 km/km2—very low DD, high infiltration, and excellent groundwater recharge; 0.96–1.93 km/km2—low DD, moderate recharge potential; 1.93–2.89 km/km2—moderate DD, balanced infiltration-runoff behavior; 2.89–3.86 km/km2—high DD, increased runoff, reduced groundwater retention; and 3.86–4.82 km/km2—very high DD, low percolation, minimal groundwater recharge. In RF modeling, DD serves as a key predictor of groundwater potential. Areas with low DD (<0.96 km/km2) receive higher weightage due to their ability to retain infiltrated water, enhancing aquifer recharge (Figure 8). Conversely, high DD regions (>3.86 km/km2) exhibit rapid runoff and reduced groundwater storage, leading to lower RF-assigned weights. By integrating drainage density with permeability, lithology, and topography, RF-based modeling enhances the accuracy of groundwater potential predictions, ensuring optimized groundwater management and exploration strategies for the Pandameru River Basin.
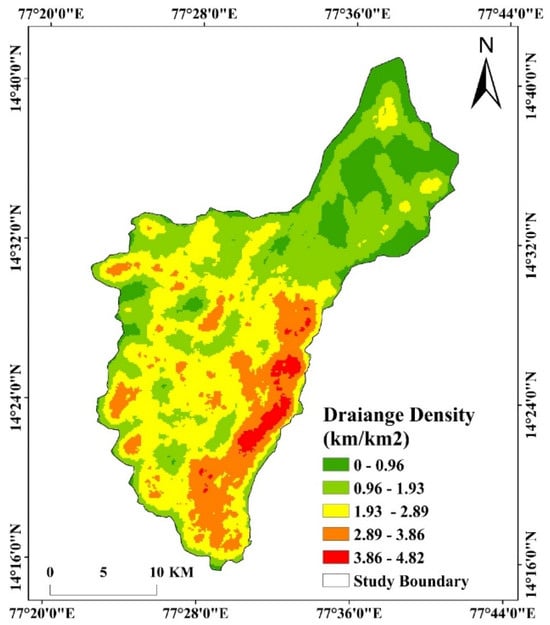
Figure 8.
Drainage density map of the study area.
3.2.7. Land Use Land Cover (LULC)
LULC plays a critical role in determining GWPZs, as different land-use types influence infiltration, runoff, and groundwater recharge. In this study, the RF model was employed to classify LULC and assess its impact on groundwater potential. Using RS and GIS techniques, the study area was classified into five major LULC types (Figure 9): waterbodies (1.16%)—high infiltration and recharge capacity; agricultural lands (32.41%)—moderate recharge potential, influenced by soil type and irrigation practices; built-up land (14.36%)—low infiltration, high runoff due to impervious surfaces; scrub (31.7%)—moderate infiltration, depending on vegetation density; and fallow lands (20.27%)—variable recharge potential, influenced by soil permeability and topography. The RF model assigned higher importance to waterbodies and agricultural lands due to their significant contribution to groundwater recharge. Conversely, built-up areas received lower importance due to reduced infiltration. The scrub and fallow lands were identified as potential sites for rainwater-harvesting (RWH) structures, supporting groundwater conservation efforts. By integrating LULC classification with RF-based groundwater potential mapping, this study provides a data-driven approach for effective water resource planning in the Pandameru River Basin.
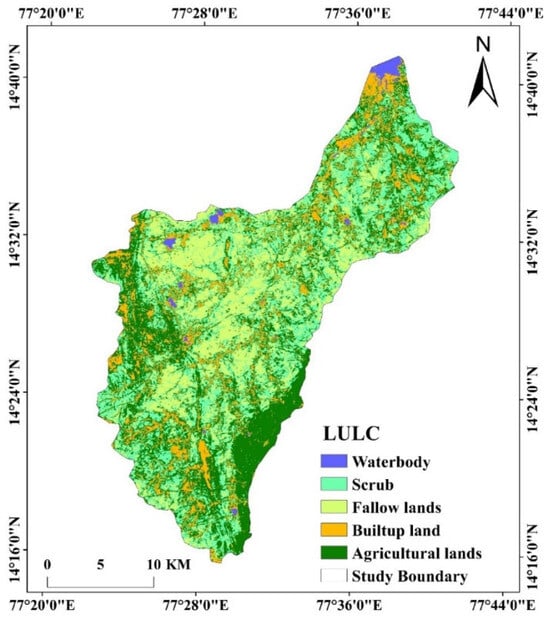
Figure 9.
LULC map of the study area.
3.2.8. Normalized Difference Vegetation Index (NDVI)
Vegetation plays a significant role in groundwater recharge by enhancing infiltration and reducing surface runoff. The NDVI is a widely used spectral indicator that assesses vegetation health and density, derived from the red and near-infrared (NIR) bands [38]. In this study, RF modeling was applied to integrate NDVI with other hydrogeological parameters for GWPZ mapping. The NDVI values for the Pandameru River Basin were classified into five categories (Figure 10): −0.155 to 0.054—barren or water surfaces (low infiltration); 0.054 to 0.194—sparse vegetation (moderate infiltration); 0.194 to 0.232—open scrublands (moderate recharge potential); 0.232 to 0.274—agricultural land with healthy vegetation (high recharge potential); 0.274 to 0.447—dense vegetation and forested areas (significant groundwater recharge). The RF model was trained using NDVI values alongside other key factors such as LULC, slope, lineament density, and drainage density to enhance groundwater potential predictions. NDVI contributes to the RF classification model by identifying areas with high vegetation cover, which correlates with greater groundwater infiltration. Higher importance was assigned to NDVI values above 0.232, indicating agricultural lands and dense vegetation, which enhance groundwater recharge. Lower importance was assigned to NDVI values below 0.054, representing barren lands and built-up areas, where infiltration is minimal. By integrating NDVI with RF-based groundwater potential mapping, this study provides a data-driven approach to identifying zones with high groundwater recharge potential, supporting sustainable water resource management in the Pandameru River Basin.
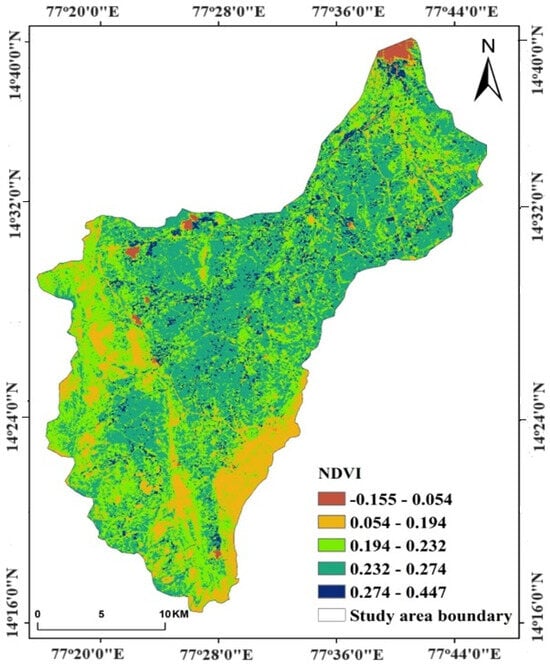
Figure 10.
NDVI map of the study area.
3.2.9. Soil-Adjusted Vegetation Index (SAVI)
SAVI is a modified version of the NDVI that takes into account the soil background reflectance. The SAVI formula incorporates the near-infrared (NIR) and red band reflectance, as well as a soil adjustment factor (L). The ground truth data on groundwater conditions are integrated into the analysis [39]. These data were used to create a spatial layer representing the GWPZs based on specific thresholds or criteria. RF analysis was performed, which determines the relative importance of different factors or criteria used in the GWPZ mapping process. These factors may include SAVI values, soil type, hydrological characteristics, and other relevant parameters. The RF model allows for the automatic selection of the most influential factors and assigns importance scores based on their contribution to the classification process. Combine the SAVI values with the predicted importance scores from the RF model using a weighted overlay analysis. This analysis integrates multiple criteria and generates a composite map that represents the spatial variability of GWPZs [40,41]. The SAVI values obtained from the analysis of GWPZs using the RF model can be reclassified into five categories based on their range. The SAVI ranges from −0.175 to 0.765, with each range representing different soil and vegetation characteristics. In the SAVI classification, the range from −0.175 to 0.075 is considered to be waterbodies. These areas have low SAVI values due to the absence of vegetation, indicating the presence of water. The range from 0.075 to 0.204 is classified as moisture soils, indicating soils with good moisture content and high infiltration rates (Figure 11). These areas are assigned lower importance scores in the RF model due to their relatively lower contribution to groundwater potential. Uncultivated soils are represented in the range from 0.204 to 0.274. These areas have lower SAVI values compared to moisture soils, indicating less infiltration and more runoff potential.
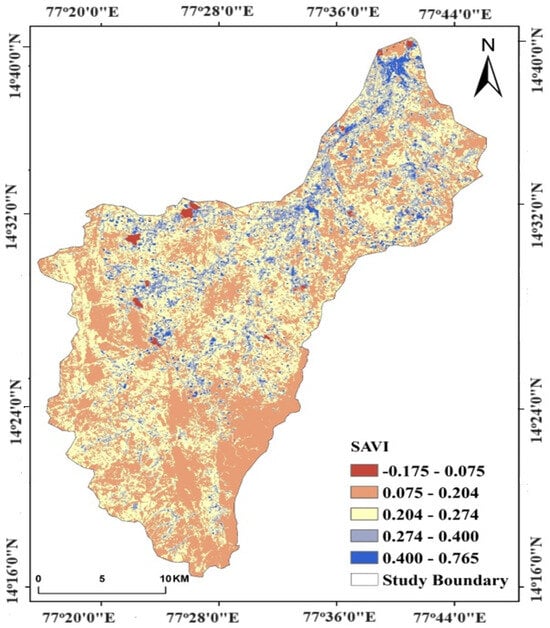
Figure 11.
SAVI map of the study area.
3.2.10. Rainfall
Annual rainfall is a critical determinant in GWPZ mapping, significantly influencing groundwater recharge and availability. Higher rainfall generally enhances groundwater replenishment, making it an essential factor for sustainable groundwater resource management. The RF model assigns an importance score to rainfall based on its predictive influence on groundwater occurrence, ensuring that areas with higher rainfall are accurately prioritized in GWPZ delineation. In the study area, rainfall distribution is highly variable, with 56.6% of the total annual rainfall occurring during the southwest monsoon and 25.3% during the northeast monsoon. The dependable annual precipitation, with a 75% probability, is estimated at 436 mm (Figure 12). The months of September and October contribute significantly, accounting for 44% of the total annual rainfall. However, intra-annual variations are substantial, and even the wettest months may experience short-term drought-like conditions. Historical rainfall data indicate an increasing trend, with recorded precipitation of 533.1 mm in 2000, 554.6 mm in 2010, and 585.3 mm in 2020. The overall average annual rainfall across the study region was computed as 517.8 mm. By incorporating these rainfall dynamics into the RF model, the analysis ensures a data-driven approach to GWPZ identification, enhancing groundwater potential assessment accuracy.
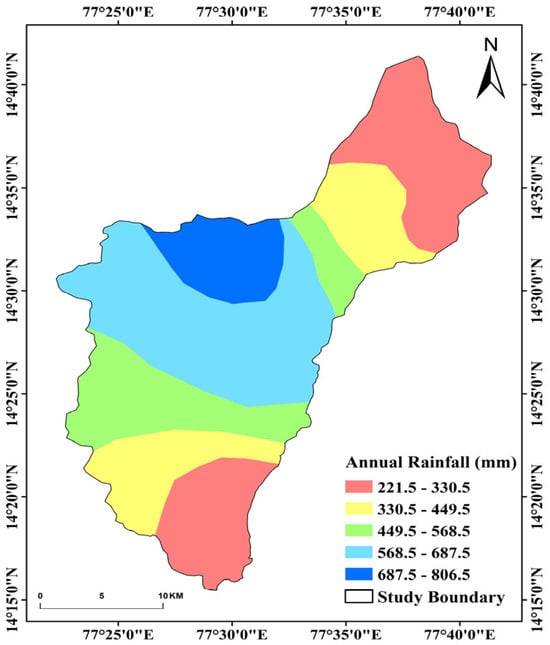
Figure 12.
Annual rainfall map of the study area.
3.3. Ground Water Potential Zones (GWPZs) Map
The GWPZ map is generated by integrating multiple thematic layers, including geology, geomorphology, soil, slope, land degradation (LD), landform development (DD), land use/land cover (LULC), vegetation indices (NDVI, SAVI), and annual rainfall. Each thematic map contributes essential information influencing groundwater occurrence and recharge potential. Geology and geomorphology: determine aquifer properties, groundwater storage, and flow dynamics. Soil and slope: influence infiltration capacity and surface runoff, affecting recharge efficiency. LD and DD indicate anthropogenic and natural modifications impacting groundwater availability. LULC and vegetation indices: represent land cover influences on infiltration and evapotranspiration rates. Rainfall governs the spatial and temporal distribution of groundwater recharge. Figure 13 presents the RF-based GWPZs of the Pandameru River Basin. The classified zones and their respective areas are detailed in Table 6.
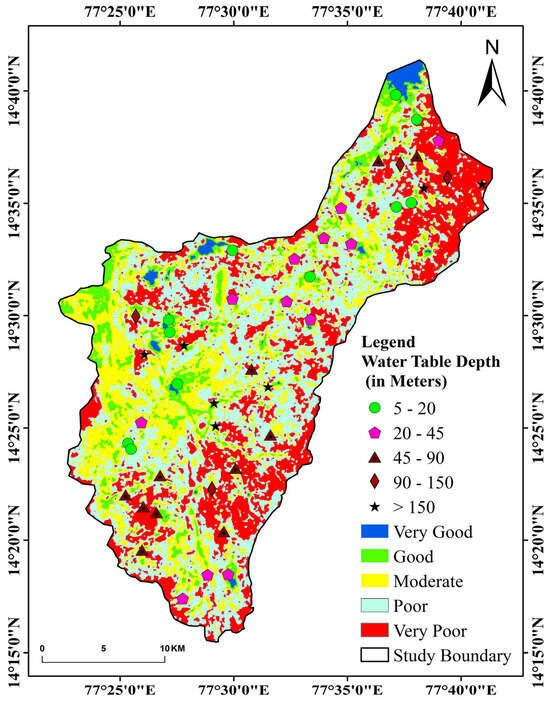
Figure 13.
GWPZs of Pandameru River Basin and validation of the water table level.
Table 6.
Area statistics of the GWPZs of Pandameru River Basin.
3.4. GWPZ Classification and Distribution
Very Good Zone (38.81 km2): This zone is distinguished by highly permeable geological formations, gentle slopes, and favorable land cover that maximize infiltration and groundwater recharge. The presence of well-defined recharge areas and minimal runoff ensures sustainable groundwater availability, making this Zone crucial for long-term water resource planning.
Good Zone (102.14 km2): Characterized by moderately permeable formations, effective infiltration zones, and sufficient vegetation cover, this zone supports steady groundwater recharge. While not as optimal as the Very Good Zone, it remains highly favorable for groundwater availability and sustainable utilization.
Moderate Zone (183.01 km2): This zone represents a balanced groundwater potential with mixed lithology, variable land use, and seasonal hydrological influences. While recharge occurs, it is affected by extraction pressures and land-use changes, requiring strategic groundwater management to maintain sustainability.
Poor Zone (182.80 km2): Groundwater potential in this Zone is limited due to low-permeability geological formations, restricted recharge areas, and unfavorable land cover. The reduced infiltration capacity poses challenges to groundwater availability, necessitating conservation efforts and alternative water resource strategies.
Very Poor Zone (164.34 km2): This critically constrained Zone exhibits minimal groundwater potential due to impermeable geological formations, insufficient recharge sources, and anthropogenic stressors such as over-extraction and land degradation. Urgent intervention is required to mitigate water scarcity and enhance groundwater conservation efforts.
3.5. Validation
The GWPZs identified within the Pandameru River Basin underwent thorough verification. This process involved analyzing data from 46 strategically positioned observation wells that spanned the entire study area (Table 7). The primary focus of this analysis was on the water levels present in these wells, serving as crucial indicators of the potential for groundwater availability [42,43]. By considering both piezometer readings and data collected during field surveys, a wide spectrum of water availability within the Pandameru River Basin was revealed, ranging from 5 m to well over 150 m [44]. To comprehensively classify these ranges, they were segmented into five distinct categories based on the GWPZ mapping classification: Very Good Potential Zone—5 to 20 m, Good Potential Zone—20 to 45 m, Moderate Zone—45 to 90 m, Poor Zone—90 to 150 m, Very Poor Zone—greater than 150 m from the surface. Among the 46 observation wells, the distribution within these zones was as follows: Very Good Zone (5–20 m)—11 wells, Good Zone (20–45 m)—12 wells, Moderate Zone (45–90 m)—11 wells, Poor Zone (90–150 m)—4 wells, and Very Poor Zone (>150 m)—7 wells (Figure 12). This noticed divergence was mostly due to the nearness of these boreholes to densely inhabited areas or areas with extensive farming operations. These are situations in which groundwater exploitation is very high. The Pandameru River Basin groundwater potential zone map was estimated to be 86% accurate. This level of precision is consistent with the results of previous examinations. These findings show the method’s inaccuracy in identifying regions with potential for groundwater retention and extraction within the basin. The mapping results’ excellent accuracy underscores their crucial role in ensuring the efficient and successful governance of groundwater resources across the region. The cross-validation of possibilities for groundwater regions using observation well data proves the zoning approach’s dependability and applicability. This method has enormous potential to make a significant contribution to the sustainable management of groundwater in the Pandameru River Basin.
Table 7.
Validation of village-wise GWPZ map.
3.6. Limitations
This study relied on the accuracy of groundwater well data and remote sensing inputs, which may have influenced model predictions. The methodology was site-specific, and its generalizability to other regions requires recalibration with local datasets. Additionally, the RF model does not account for temporal groundwater variations. The spatial resolution of some thematic layers may limit precision in fine-scale mapping. Future research should explore time-series analysis and real-time data integration for improved predictions.
3.7. Additional Hydrogeological Context and Future Scope
While this study effectively delineated between GWPZs using an RF-based classification approach and remote sensing-derived thematic layers, it did not incorporate detailed hydrogeological field data such as aquifer lithology, transmissivity, well yields, or water quality parameters (e.g., TDS, pH, and salinity). These factors are crucial for a comprehensive assessment of groundwater sustainability and usability, especially in hard rock terrains like the Pandameru River Basin, where aquifer properties are highly heterogeneous. Future research could integrate hydrochemical analyses and groundwater quality indexing to assess the suitability of water for drinking and irrigation purposes. This would help strengthen the link between groundwater potential and water resource sustainability, offering more actionable insights for policymakers and water managers.
4. Conclusions
The application of machine learning-based RF modeling combined with RS and GIS has demonstrated high accuracy and efficiency in delineating GWPZs in the study area. The RF model was trained and validated using a diverse set of thematic layers, including geology (lithology), geomorphic features, soil types, lineament density, slope, drainage density, LULC, NDVI, SAVI, and rainfall data. By leveraging the ensemble learning capability of RF, the model effectively classified the study area into five distinct GWPZs: very good, good, moderate, poor, and very poor. The results indicate that lithology, lineament density, landforms, and rainfall patterns significantly influence groundwater potential. “Very good” zones were predominantly identified in deep buried pediments and valley fills, whereas “poor” and “very poor” zones were mainly associated with hard rock formations, structural hills, and high drainage density regions that restrict groundwater infiltration. The RF model achieved an overall accuracy of 89%, demonstrating its superior predictive capability compared to traditional decision-making techniques. “Very poor” zones (24.47%) face severe groundwater scarcity, necessitating immediate conservation and alternative water supply solutions. “Poor” zones (27.22%) have limited groundwater recharge potential, requiring improved water harvesting and recharge techniques. “Moderate” zones (27.25%) exhibit balanced groundwater availability but need strategic management to prevent over-exploitation. “Good” zones (15.21%) offer promising opportunities for groundwater extraction and sustainable development. “Very good” zones (5.84%), located in highly permeable formations with optimal recharge conditions, serve as key areas for groundwater sustainability. This study highlights the applicability of RF-based modeling in groundwater resource assessment, demonstrating its suitability for large-scale management strategies. The results provide actionable insights for identifying groundwater-rich zones, assisting local authorities in formulating targeted conservation and recharge initiatives. The methods developed in this research can be useful for similar semiarid regions, enabling policymakers to develop evidence-based water management policies that ensure long-term groundwater sustainability.
Author Contributions
Conceptualization, M.Z.; methodology, P.K.B.; software, A.B.N.; formal analysis, A.B.N. and R.K.P.; investigation, M.Z.; resources, M.Z.; data curation, R.K.P. and S.G.; writing—original draft preparation, R.K.P. and P.K.B.; writing—review and editing, P.K.B., R.A., F.F.B.H. and M.Z.; visualization, A.B.N. and S.G.; supervision, P.K.B.; project administration, M.Z. All authors have read and agreed to the published version of the manuscript.
Funding
This research was funded by Princess Nourah bint Abdulrahman University Researchers Supporting Project number (PNURSP2025R675), Princess Nourah bint Abdulrahman University, Riyadh, Saudi Arabia.
Data Availability Statement
The datasets used and/or analyzed during the current study are available from the corresponding author on reasonable request.
Acknowledgments
The authors extend their appreciation to Princess Nourah bint Abdulrahman University Researchers Supporting Project number (PNURSP2025R675), Princess Nourah bint Abdulrahman University, Riyadh, Saudi Arabia. The first corresponding author expresses sincere gratitude to the Science and Engineering Research Board—National Post-Doctoral Fellowship (SERB-NPDF) for their invaluable support, with fellowship reference no. PDF/2023/000774, during their tenure as a fellow at NGRI, Hyderabad. The authors extend their heartfelt appreciation to the director of the CSIR-National Geophysical Research Institute for granting permission to publish the paper. The authors would like to thank Malay Pramanik (Asian Institute of Technology) for his review. Special thanks are extended to the Editor-in-Chief/handling editor of the journal for their unwavering support. The authors also express gratitude to the anonymous reviewers for their constructive feedback and valuable suggestions, which significantly enhanced the manuscript’s quality.
Conflicts of Interest
The authors declare no conflict of interest.
References
- Achu, A.L.; Thomas, J.; Reghunath, R. Multi-criteria decision analysis for delineation of groundwater potential zones in a tropical river basin using remote sensing, GIS and analytical hierarchy process (AHP). Groundw. Sustain. Dev. 2020, 10, 100365. [Google Scholar] [CrossRef]
- Ahmad, I.; Hasan, H.; Jilani, M.M.; Ahmed, S.I. Mapping potential groundwater accumulation zones for Karachi city using GIS and AHP techniques. Environ. Monit. Assess. 2023, 195, 381. [Google Scholar] [CrossRef] [PubMed]
- Machireddy, S.R. Delineation of groundwater potential zones in South East part of Anantapur District using remote sensing and GIS applications. Sustain. Water Resour. Manag. 2019, 5, 1695–1709. [Google Scholar] [CrossRef]
- Cartwright, I.; Currell, M.J.; Cendón, D.I.; Meredith, K.T. A review of the use of radiocarbon to estimate groundwater residence times in semi-arid and arid areas. J. Hydrol. 2020, 580, 124247. [Google Scholar] [CrossRef]
- Ouhamdouch, S.; Bahir, M.; Ouazar, D.; Carreira, P.M.; Zouari, K. Evaluation of climate change impact on groundwater from semiarid environment (Essaouira Basin, Morocco) using integrated approaches. Environ. Earth Sci. 2019, 78, 449. [Google Scholar] [CrossRef]
- Taylor, R.G.; Scanlon, B.; Döll, P.; Rodell, M.; Van Beek, R.; Wada, Y.; Longuevergne, L.; Leblanc, M.; Famiglietti, J.S.; Edmunds, M.; et al. Ground water and climate change. Nat. Clim. Change 2013, 3, 322–329. [Google Scholar] [CrossRef]
- Anusha, B.; Babu, K.R.; Kumar, B.P.; Kumar, P.R.; Rajasekhar, M. Geospatial approaches for monitoring and mapping of water resources in semi-arid regions of Southern India. Environ. Chall. 2022, 8, 100569. [Google Scholar] [CrossRef]
- Shinwari, F.U.; Khan, M.A.; Siyar, S.M.; Liaquat, U.; Kontakiotis, G.; Zhran, M.; Shahab, M.; Alshehri, F. Evaluating the contamination susceptibility of groundwater resources through anthropogenic activities in Islamabad, Pakistan: A GIS-based DRASTIC approach. Appl. Water Sci. 2025, 15, 81. [Google Scholar] [CrossRef]
- Pande, C.B.; Moharir, K.N.; Panneerselvam, B.; Singh, S.K.; Elbeltagi, A.; Pham, Q.B.; Varade, A.M.; Rajesh, J. Delineation of groundwater potential zones for sustainable development and planning using analytical hierarchy process (AHP), and MIF techniques. Appl. Water Sci. 2021, 11, 186. [Google Scholar] [CrossRef]
- Miraki, S.; Zanganeh, S.H.; Chapi, K.; Singh, V.P.; Shirzadi, A.; Shahabi, H.; Pham, B.T. Mapping Groundwater Potential Using a Novel Hybrid Intelligence Approach. Water Resour. Manag. 2019, 33, 281–302. [Google Scholar] [CrossRef]
- Pappaka, R.K.; Somagouni, S.G.; Chinthala, K.; Nakkala, A.B. Appraisal of groundwater quality for suitability of drinking and irrigation purposes of pandameru river basin, anantapur district, AP, India. Arab. J. Geosci. 2024, 17, 23. [Google Scholar] [CrossRef]
- Ghosh, A.; Adhikary, P.P.; Bera, B.; Bhunia, G.S.; Shit, P.K. Assessment of groundwater potential zone using MCDA and AHP techniques: Case study from a tropical river basin of India. Appl. Water Sci. 2022, 12, 37. [Google Scholar] [CrossRef]
- Naghibi, S.A.; Pourghasemi, H.R.; Dixon, B. GIS-based groundwater potential mapping using boosted regression tree, classification and regression tree, and random forest machine learning models in Iran. Environ. Monit. Assess. 2016, 188, 44. [Google Scholar] [CrossRef]
- Prasad, P.; Loveson, V.J.; Kotha, M.; Yadav, R. Application of machine learning techniques in groundwater potential mapping along the west coast of India. GIScience Remote. Sens. 2020, 57, 735–752. [Google Scholar] [CrossRef]
- Lee, S.; Hyun, Y.; Lee, S.; Lee, M.J. Groundwater potential mapping using remote sensing and GIS-based machine learning techniques. Remote Sens. 2020, 12, 1200. [Google Scholar] [CrossRef]
- Madani, A.; Niyazi, B. Groundwater Potential Mapping Using Remote Sensing and Random Forest Machine Learning Model: A Case Study from Lower Part of Wadi Yalamlam, Western Saudi Arabia. Sustainability 2023, 15, 2772. [Google Scholar] [CrossRef]
- Das, R.; Saha, S. Spatial mapping of groundwater potentiality applying ensemble of computational intelligence and machine learning approaches. Groundw. Sustain. Dev. 2022, 18, 100778. [Google Scholar] [CrossRef]
- Raj, S.; Rawat, K.S.; Singh, S.K.; Mishra, A.K. Groundwater potential zones identification and validation in Peninsular India. Geol. Ecol. Landsc. 2024, 8, 86–100. [Google Scholar] [CrossRef]
- Barman, J.; Ali, S.S.; Nongrem, T.; Biswas, B.; Rao, K.S.; Pramanik, M.; Ben Hasher, F.F.; Zhran, M. Comparing the effectiveness of landslide susceptibility mapping by using the frequency ratio and hybrid MCDM models. Results Eng. 2024, 24, 103205. [Google Scholar] [CrossRef]
- Zhran, M.; Ghanem, K.; Tariq, A.; Alshehri, F.; Jin, S.; Das, J.; Pande, C.B.; Pramanik, M.; Ben Hasher, F.F.; Mousa, A. Exploring a GIS-based analytic hierarchy process for spatial flood risk assessment in Egypt: A case study of the Damietta branch. Environ. Sci. Eur. 2024, 36, 184. [Google Scholar] [CrossRef]
- Kalantar, B.; Al-Najjar, H.A.H.; Pradhan, B.; Saeidi, V.; Halin, A.A.; Ueda, N.; Naghibi, S.A. Optimized Conditioning Factors Using Machine Learning Techniques for Groundwater Potential Mapping. Water 2019, 11, 1909. [Google Scholar] [CrossRef]
- Kombo, O.H.; Kumaran, S.; Sheikh, Y.H.; Bovim, A.; Jayavel, K. Long-Term Groundwater Level Prediction Model Based on Hybrid KNN-RF Technique. Hydrology 2020, 7, 59. [Google Scholar] [CrossRef]
- Arabameri, A.; Pal, S.C.; Rezaie, F.; Chakrabortty, R.; Saha, A.; Blaschke, T.; Di Napoli, M.; Ghorbanzadeh, O.; Ngo, P.T.T. Decision tree based ensemble machine learning approaches for landslide susceptibility mapping. Geocarto Int. 2022, 37, 4594–4627. [Google Scholar] [CrossRef]
- Haggerty, R.; Sun, J.; Yu, H.; Li, Y. Application of machine learning in groundwater quality modeling-A comprehensive review. Water Res. 2023, 233, 119745. [Google Scholar] [CrossRef] [PubMed]
- Naghibi, S.A.; Ahmadi, K.; Daneshi, A. Application of Support Vector Machine, Random Forest, and Genetic Algorithm Optimized Random Forest Models in Groundwater Potential Mapping. Water Resour. Manag. 2017, 31, 2761–2775. [Google Scholar] [CrossRef]
- Kumar, B.P.; Anusha, B.N.; Babu, K.R.; Sree, P.P. Identification of climate change impact and thermal comfort zones in semiarid regions of AP, India using LST and NDBI techniques. J. Clean. Prod. 2023, 407, 137175. [Google Scholar] [CrossRef]
- Kumar, B.P.; Babu, K.R.; Rajasekhar, M.; Ramachandra, M. Identification of land degradation hotspots in semiarid region of Anantapur district, Southern India, using geospatial modeling approaches. Model. Earth Syst. Environ. 2020, 6, 1841–1852. [Google Scholar] [CrossRef]
- Das, S.; Kadam, A.K.; Umrikar, B.N.; Sankhua, R.N.; Varade, A.M.; Kalshetty, M.; Doad, A.P. Efficacy of Geospatial Technologies for Groundwater Prospect Zonation in Lower Western Ghats Area of Maharashtra, India. In Geostatistics and Geospatial Technologies for Groundwater Resources in India; Springer: Cham, Switzerland, 2021; pp. 97–118. [Google Scholar]
- Athira, K. Assessment of Meteorological Drought in Anantapur District (Andhra Pradesh). J. Water Resour. Res. Dev. 2019, 2, 2. [Google Scholar]
- Guo, X.; Gui, X.; Xiong, H.; Hu, X.; Li, Y.; Cui, H.; Qiu, Y.; Ma, C. Critical role of climate factors for groundwater potential mapping in arid regions: Insights from random forest, XGBoost, and LightGBM algorithms. J. Hydrol. 2023, 621, 129599. [Google Scholar] [CrossRef]
- Osman, A.I.A.; Ahmed, A.N.; Chow, M.F.; Huang, Y.F.; El-Shafie, A. Extreme gradient boosting (Xgboost) model to predict the groundwater levels in Selangor Malaysia. Ain Shams Eng. J. 2021, 12, 1545–1556. [Google Scholar] [CrossRef]
- Yadav, B.; Ch, S.; Mathur, S.; Adamowski, J. Assessing the suitability of extreme learning machines (ELM) for groundwater level prediction. J. Water Land Dev. 2017, 32, 103. [Google Scholar] [CrossRef]
- Sayfi Selseleh, E.; Ghorbani, M.S.; Aali, N. Spatial Modeling of Groundwater Resources Potential in Telvar Watershed using Support Vector Machine and Random Forest Models. Watershed Manag. Res. 2022, 35, 73–87. [Google Scholar]
- Lee, S.; Hong, S.M.; Jung, H.S. GIS-based groundwater potential mapping using artificial neural network and support vector machine models: The case of Boryeong city in Korea. Geocarto Int. 2018, 33, 847–861. [Google Scholar] [CrossRef]
- Nguyen, P.T.; Ha, D.H.; Jaafari, A.; Nguyen, H.D.; Van Phong, T.; Al-Ansari, N.; Prakash, I.; Van Le, H.; Pham, B.T. Groundwater Potential Mapping Combining Artificial Neural Network and Real AdaBoost Ensemble Technique: The DakNong Province Case-study, Vietnam. Int. J. Environ. Res. Public Health 2020, 17, 2473. [Google Scholar] [CrossRef]
- Pasham, H.; Gugulothu, S.; Badapalli, P.K.; Dhakate, R.; Kottala, R.B. Geospatial approaches of TGSI and morphometric analysis in the Mahi River basin using Landsat 8 OLI/TIRS and SRTM-DEM. Environ. Sci. Pollut. Res. 2024, 31, 54129–54146. [Google Scholar] [CrossRef]
- Yariyan, P.; Avand, M.; Omidvar, E.; Pham, Q.B.; Linh, N.T.T.; Tiefenbacher, J.P. Optimization of statistical and machine learning hybrid models for groundwater potential mapping. Geocarto Int. 2022, 37, 3877–3911. [Google Scholar] [CrossRef]
- Mogaji, K.A.; Lim, H.S. Application of a GIS-/remote sensing-based approach for predicting groundwater potential zones using a multi-criteria data mining methodology. Environ. Monit. Assess. 2017, 189, 321. [Google Scholar] [CrossRef]
- Shlash, M.A.; Obead, I.H. Supervised Classification of Groundwater Potential Mapping Using Integrated Machine Learning and GIS-Based Techniques. Math. Model. Eng. Probl. 2023, 10, 829–842. [Google Scholar] [CrossRef]
- Davoudi Moghaddam, D.; Rahmati, O.; Haghizadeh, A.; Kalantari, Z. A Modeling Comparison of Groundwater Potential Mapping in a Mountain Bedrock Aquifer: QUEST, GARP, and RF Models. Water 2020, 12, 679. [Google Scholar] [CrossRef]
- Xianglin, D.; Tariq, A.; Jamil, A.; Aslam, R.W.; Zafar, Z.; Bailek, N.; Zhran, M.; Almutairi, K.F.; Soufan, W. Advanced machine vision techniques for groundwater level prediction modeling geospatial and statistical research. Adv. Space Res. 2025, 75, 2652–2668. [Google Scholar] [CrossRef]
- Ren, H.; Zhou, G.; Zhang, F. Using negative soil adjustment factor in soil-adjusted vegetation index (SAVI) for aboveground living biomass estimation in arid grasslands. Remote Sens. Environ. 2018, 209, 439–445. [Google Scholar] [CrossRef]
- Badapalli, P.K.; Nakkala, A.B.; Gugulothu, S.; Kottala, R.B.; Mannala, P. Geospatial insights into urban growth and land cover transformation in Anantapur city, India. Environ. Dev. Sustain. 2024, 1–24. [Google Scholar] [CrossRef]
- Kumar, B.P.; Babu, K.R.; Anusha, B.; Rajasekhar, M. Geo-environmental monitoring and assessment of land degradation and desertification in the semi-arid regions using Landsat 8 OLI / TIRS, LST, and NDVI approach. Environ. Chall. 2022, 8, 100578. [Google Scholar] [CrossRef]
Disclaimer/Publisher’s Note: The statements, opinions and data contained in all publications are solely those of the individual author(s) and contributor(s) and not of MDPI and/or the editor(s). MDPI and/or the editor(s) disclaim responsibility for any injury to people or property resulting from any ideas, methods, instructions or products referred to in the content. |
© 2025 by the authors. Licensee MDPI, Basel, Switzerland. This article is an open access article distributed under the terms and conditions of the Creative Commons Attribution (CC BY) license (https://creativecommons.org/licenses/by/4.0/).