
Benchmarking Efficiency, Sustainability, and Corporate Responsibility in Maritime Logistics: An Entropy-GRA Model with Sensitivity Analysis


Abstract
1. Introduction
2. Literature Review
2.1. Sustainability in the Shipping Industry
2.2. CSR in the Container Shipping Industry
2.3. Sustainability and CSR in the Container Shipping Industry
3. Methodology
3.1. Grey Relational Analysis (GRA)
3.1.1. Grey Relational Generation
- J is an attribute whose value is expected to be the larger the better:
- J is an attribute whose value is expected to be the smaller the better:
- J is an attribute whose value is expected to be as close to the desired value as possible:
3.1.2. Reference Sequence Definition
3.1.3. Grey Relational Coefficient Calculation
3.1.4. Grey Relational Grade Calculation
3.2. Entropy Weighting Method
3.2.1. Normalization of the Decision Matrix:
3.2.2. Entropy Calculation:
3.2.3. Degree of Diversification:
3.2.4. Weight Calculation:
4. Data Collection and Variable Selection
4.1. Data Collection
4.2. Variable Selection
- SOx (in ‘000 tons) + SOx scrubber (in % of vessels): Sulfur dioxide (SO2) and sulfur trioxide (SO3), also emitted from shipping activities, can cause acid rains that destroy vegetation and buildings and have a negative impact on human health [41]. As IMO’s regulation on sulfur limits went into effect in 2020, shipping lines have to fit their vessels with exhaust gas cleaning systems (also known as “scrubbers”) for compliance [50].
- NOx (in ‘000 tons): Nitrogen oxide (NO) and nitrogen dioxide (NO2), produced by fossil fuel combustion, are responsible for ozone thinning, photochemical smog, and acid rain. Excessive NO2 in residential areas is also linked to respiratory and cardiovascular diseases and mortality [51].
- Ballast water treatment technology (in % of vessels): Ballast water is the water pumped into a ship’s ballast tanks at the initial port to provide stability and maneuverability during voyage. As part of operations, it can be released at the next port-of-call and introduce non-native organisms that may contain bio-invaders to the water bodies there. Thus, ballast water poses significant environmental threats and was required to be strictly managed by IMO since 2017 [52].
- Training hours per employee: Training days (or hours) per officer is a human resources KPI that represents the shipping line’s commitment to the continuous maintenance and improvement of employee abilities. The commitment extends to incorporating new skills into the team, increasing staff motivation, promoting awareness of CSR, and elevating the overall quality of work within the organization [53,54]. This KPI is usually reported across CSLs in number of training hours per year.
- Schedule reliability (on-time rate, %): Punctual delivery is essential in creating a positive experience for customers and is an important characteristic for a CSL to be recognized as a reliable logistics provider. As on-time delivery cultivates higher customer satisfaction through fulfilling the CSL’s responsibility to customers’ needs, it crucially affects the growth of the CSL’s customer base and is an all-time important index all CSLs strive for.
- Female employee in management (%): Previous studies indicated that a higher percentage of women in the board can have a positive impact on company performance, which is explained by diversity being introduced to the team and decreased level of conflict [55,56,57]. Nonetheless, women in management is still notably an underrepresented group, despite several calls for maritime companies to increase their presence in the board of management [58,59]. To solve this, in recent years, major CSLs have been implementing numerous actions to raise the proportion of women in their management, and some even plan to accelerate this dynamic up to the top level [60]. This remains an important KPI and an on-going initiative for CSLs until they reach a desired equality and inclusiveness target committed to stakeholders.
- Total services (number of routes): Owning a large global network is an indicator of a CSL’s high serving capacity to satisfy customers’ needs. The high number of shipping lanes, coupled with high reliability, facilitates timely and efficient transportation solutions, adding up to customer’s trust and confidence in the CSL’s ability to provide them with comprehensive, reliable, and adaptable services. In addition, a well-established global network aids the CSL in reaching its CSR goals through improved routing optimization and vessel utilization, resulting in the reduction of fuel consumption, total emissions, and other environmental impacts per unit of cargo transported. As customers are looking to conduct business with CSR-minded companies, this variable contributes directly to CSR objectives, and therefore, it is a must-have in this article’s benchmarking model.
- Total fleet capacity—TEUs in ‘000 (input): the sum of both chartered and owned in-fleet capacity, representing the shipping line’s total shipping ability.
- Total energy consumption—tetra Joules (input): fuel for vessel operations from different sources, all converted to Joules and added up.
- Number of employees (input): full-time employees directly working in shipping operations are counted. Those who work part-time or indirectly at other inland ports, warehouses, distribution centers, or in other logistics services are not included.
- Operating cost—USD million (input).
- Revenue—USD million (output).
- Transported volume—TEUs in ‘000 (output).
5. Empirical Study
5.1. Entropy Weight and Grey Relational Grade Calculations
5.2. Sensitivity Analysis
6. Managerial Implications and Research Limitations
6.1. Managerial Implications
6.2. Research Limitations and Future Research Directions
7. Conclusions
Author Contributions
Funding
Institutional Review Board Statement
Informed Consent Statement
Data Availability Statement
Conflicts of Interest
References
- Shaban, H. Amazon, Ikea and Other Big Companies Commit to Zero-Emission Shipping by 2040. Available online: https://www.washingtonpost.com/business/2021/10/19/zero-carbon-fuel-shipping-amazon-ikea/ (accessed on 13 April 2024).
- Shin, Y.; Van Thai, V.; Grewal, D.; Kim, Y. Do Corporate Sustainable Management Activities Improve Customer Satisfaction, Word of Mouth Intention and Repurchase Intention? Empirical Evidence from the Shipping Industry. Int. J. Logist. Manag. 2017, 28, 555–570. [Google Scholar] [CrossRef]
- Lai, K.-H.; Lun, V.Y.H.; Wong, C.W.Y.; Cheng, T.C.E. Green Shipping Practices in the Shipping Industry: Conceptualization, Adoption, and Implications. Resour. Conserv. Recycl. 2011, 55, 631–638. [Google Scholar] [CrossRef]
- Wu, X.; Zhang, L.; Luo, M. Current Strategic Planning for Sustainability in International Shipping. Environ. Dev. Sustain. 2020, 22, 1729–1747. [Google Scholar] [CrossRef]
- Narula, K. Emerging Trends in the Shipping Industry—Transitioning Towards Sustainability. Marit. Aff. J. Natl. Marit. Found. India 2014, 10, 113–138. [Google Scholar] [CrossRef]
- Wang, X.; Wong, Y.D.; Li, K.X.; Yuen, K.F. Shipping Industry’s Sustainability Communications to Public in Social Media: A Longitudinal Analysis. Transp. Policy 2021, 110, 123–134. [Google Scholar] [CrossRef]
- Psaraftis, H.N. (Ed.) Sustainable Shipping; Springer International Publishing: Cham, Switzerland, 2019; ISBN 978-3-030-04329-2. [Google Scholar]
- Wu, X.; Zhang, L.; Luo, M. Discerning Sustainability Approaches in Shipping. Environ. Dev. Sustain. 2020, 22, 5169–5184. [Google Scholar] [CrossRef]
- Andersson, K.; Baldi, F.; Brynolf, S.; Lindgren, J.F.; Granhag, L.; Svensson, E. Shipping and the Environment. In Shipping and the Environment; Springer: Berlin/Heidelberg, Germany, 2016; pp. 3–27. [Google Scholar]
- Lirn, T.-C.; Lin, H.-W.; Shang, K.-C. Green Shipping Management Capability and Firm Performance in the Container Shipping Industry. Marit. Policy Manag. 2014, 41, 159–175. [Google Scholar] [CrossRef]
- Giannakopoulou, E.N.; Thalassinos, E.I.; Stamatopoulos, T.V. Corporate Governance in Shipping: An Overview. Marit. Policy Manag. 2016, 43, 19–38. [Google Scholar] [CrossRef]
- Tsatsaronis, M.; Syriopoulos, T.; Gavalas, D.; Boura, G.; Trakadas, P.; Gkorila, M. The Impact of Corporate Social Responsibility on Corporate Financial Performance: An Empirical Study on Shipping. Marit. Policy Manag. 2022, 51, 226–239. [Google Scholar] [CrossRef]
- Akkan, E. CSR Activities in Maritime and Shipping Industries. In Cases on Corporate Social Responsibility and Contemporary Issues in Organizations; IGI Global Scientific Publishing: New York, NY, USA, 2019; pp. 276–298. [Google Scholar]
- Pawlik, T.; Gaffron, P.; Drewes, P.A. Corporate Social Responsibility in Maritime Logistics. In Maritime Logistics; Emerald Group Publishing Limited: Leeds, UK, 2012; pp. 205–226. [Google Scholar]
- Tang, L.; Gekara, V. The Importance of Customer Expectations: An Analysis of CSR in Container Shipping. J. Bus. Ethics 2020, 165, 383–393. [Google Scholar] [CrossRef]
- Lu, C.-S.; Lin, C.-C.; Tu, C.-J. Corporate Social Responsibility and Organisational Performance in Container Shipping. Int. J. Logist. Res. Appl. 2009, 12, 119–132. [Google Scholar] [CrossRef]
- Lund-Thomsen, P.; Poulsen, R.T.; Ackrill, R. Corporate Social Responsibility in the International Shipping Industry: State-of-the-Art, Current Challenges and Future Directions. J. Sustain. Mobil. 2016, 3, 3–13. [Google Scholar] [CrossRef]
- Fasoulis, I. Advancing Aspects of Social Sustainability Dimension in Shipping: Exploring the Role of Corporate Social Responsibility in Supporting the Seafarer Human Sustainability Declaration Framework. Aust. J. Marit. Ocean Aff. 2023, 15, 518–538. [Google Scholar] [CrossRef]
- Yuen, K.F.; Lim, J.M. Barriers to the Implementation of Strategic Corporate Social Responsibility in Shipping. Asian J. Shipp. Logist. 2016, 32, 49–57. [Google Scholar] [CrossRef]
- Fasoulis, I. Understanding CSR and Sustainability Integration Patterns into the Corporate Governance and Organisational Processes of a Ship Management Company: A Case Study. World Rev. Intermodal Transp. Res. 2021, 10, 245–268. [Google Scholar] [CrossRef]
- Fasoulis, I.; Kurt, R.E.; Poutos, E.I. A Quantitative Study into Perceptions and Attitudes of Corporate Social Responsibility and Sustainability Developments in International Shipping. In Proceedings of the 8th International Maritime Science Conference, Kotor, Montenegro, 11–12 April 2019; pp. 161–174. [Google Scholar]
- Rehman, A.U.; AlFaify, A.Y. Evaluating Industry 4.0 Manufacturing Configurations: An Entropy-Based Grey Relational Analysis Approach. Processes 2023, 11, 3151. [Google Scholar] [CrossRef]
- Ma, X.; Wang, Y. Application of Grey Relational Entropy Weight Method in DRG Performance Evaluation of Inpatient Departments. Contrast Media Mol. Imaging 2022, 2022, 7348985. [Google Scholar] [CrossRef]
- Wu, D.; Wang, N.; Yang, Z.; Li, C.; Yang, Y. Comprehensive Evaluation of Coal-Fired Power Units Using Grey Relational Analysis and a Hybrid Entropy-Based Weighting Method. Entropy 2018, 20, 215. [Google Scholar] [CrossRef]
- Vatansever, K.; Akgűl, Y. Performance Evaluation of Websites Using Entropy and Grey Relational Analysis Methods: The Case of Airline Companies. Decis. Sci. Lett. 2018, 7, 119–130. [Google Scholar] [CrossRef]
- You, M.-L.; Shu, C.-M.; Chen, W.-T.; Shyu, M.-L. Analysis of Cardinal Grey Relational Grade and Grey Entropy on Achievement of Air Pollution Reduction by Evaluating Air Quality Trend in Japan. J. Clean. Prod. 2017, 142, 3883–3889. [Google Scholar] [CrossRef]
- Esangbedo, M.O.; Wei, J. Grey Hybrid Normalization with Period Based Entropy Weighting and Relational Analysis for Cities Rankings. Sci. Rep. 2023, 13, 13797. [Google Scholar] [CrossRef]
- Malek, A.; Ebrahimnejad, S.; Tavakkoli-Moghaddam, R. An Improved Hybrid Grey Relational Analysis Approach for Green Resilient Supply Chain Network Assessment. Sustainability 2017, 9, 1433. [Google Scholar] [CrossRef]
- Wang, Q.; Wu, C.; Sun, Y. Evaluating Corporate Social Responsibility of Airlines Using Entropy Weight and Grey Relation Analysis. J. Air Transp. Manag. 2015, 42, 55–62. [Google Scholar] [CrossRef]
- United Nations. Report of the World Commission on Environment and Development; United Nations: New York, NY, USA, 1987. [Google Scholar]
- McGuire, C.; Perivier, H. The Nonexistence of Sustainability in International Maritime Shipping: Issues For Consideration. J. Sustain. Dev. 2011, 4, 72. [Google Scholar] [CrossRef]
- Monios, J. Environmental Governance in Shipping and Ports: Sustainability and Scale Challenges. In Maritime Transport and Regional Sustainability; Elsevier: Amsterdam, The Netherlands, 2020; pp. 13–29. [Google Scholar]
- Lee, P.; Kwon, O.; Ruan, X. Sustainability Challenges in Maritime Transport and Logistics Industry and Its Way Ahead. Sustainability 2019, 11, 1331. [Google Scholar] [CrossRef]
- Cabezas-Basurko, O.; Mesbahi, E.; Moloney, S.R. Methodology for Sustainability Analysis of Ships. Ships Offshore Struct. 2008, 3, 1–11. [Google Scholar] [CrossRef]
- Qahtan, S.; Alsattar, H.A.; Zaidan, A.A.; Deveci, M.; Pamucar, D.; Delen, D. Performance Assessment of Sustainable Transportation in the Shipping Industry Using a Q-Rung Orthopair Fuzzy Rough Sets-Based Decision Making Methodology. Expert Syst. Appl. 2023, 223, 119958. [Google Scholar] [CrossRef]
- Bernacki, D. Assessing the Link between Vessel Size and Maritime Supply Chain Sustainable Performance. Energies 2021, 14, 2979. [Google Scholar] [CrossRef]
- Parthibaraj, C.S.; Subramanian, N.; Palaniappan, P.L.K.; Lai, K. Sustainable Decision Model for Liner Shipping Industry. Comput. Oper. Res. 2018, 89, 213–229. [Google Scholar] [CrossRef]
- Oloruntobi, O.; Mokhtar, K.; Gohari, A.; Asif, S.; Chuah, L.F. Sustainable Transition towards Greener and Cleaner Seaborne Shipping Industry: Challenges and Opportunities. Clean. Eng. Technol. 2023, 13, 100628. [Google Scholar] [CrossRef]
- Di Vaio, A.; Zaffar, A.; Balsalobre-Lorente, D.; Garofalo, A. Decarbonization Technology Responsibility to Gender Equality in the Shipping Industry: A Systematic Literature Review and New Avenues Ahead. J. Shipp. Trade 2023, 8, 9. [Google Scholar] [CrossRef]
- Cariou, P. Is Slow Steaming a Sustainable Means of Reducing CO2 Emissions from Container Shipping? Transp. Res. Part D Transp. Environ. 2011, 16, 260–264. [Google Scholar] [CrossRef]
- Czermański, E.; Cirella, G.T.; Oniszczuk-Jastrząbek, A.; Pawłowska, B.; Notteboom, T. An Energy Consumption Approach to Estimate Air Emission Reductions in Container Shipping. Energies 2021, 14, 278. [Google Scholar] [CrossRef]
- Zhou, Y.; Wang, X.; Yuen, K.F. Sustainability Disclosure for Container Shipping: A Text-Mining Approach. Transp. Policy 2021, 110, 465–477. [Google Scholar] [CrossRef]
- Zhou, Y.; Li, X.; Wang, X.; Yuen, K.F. Intelligent Container Shipping Sustainability Disclosure via Stakeholder Sentiment Views on Social Media. Mar. Policy 2022, 135, 104853. [Google Scholar] [CrossRef]
- Oikonomou, I.; Pastra, A.; Visvikis, I. A Financial Business Case for Corporate Social Responsibility. In Corporate Social Responsibility in the Maritime Industry; Springer: Berlin/Heidelberg, Germany, 2018; pp. 219–236. [Google Scholar]
- Grewal, D. The Growth of CSR and Its Acceptance in the Maritime Industry. In Corporate Social Responsibility in the Maritime Industry; Springer: Berlin/Heidelberg, Germany, 2018; pp. 25–42. [Google Scholar]
- Yuen, K.F.; Thai, V.V.; Wong, Y.D.; Wang, X. Interaction Impacts of Corporate Social Responsibility and Service Quality on Shipping Firms’ Performance. Transp. Res. Part A Policy Pract. 2018, 113, 397–409. [Google Scholar] [CrossRef]
- Parviainen, T.; Lehikoinen, A.; Kuikka, S.; Haapasaari, P. How Can Stakeholders Promote Environmental and Social Responsibility in the Shipping Industry? WMU J. Marit. Aff. 2018, 17, 49–70. [Google Scholar] [CrossRef]
- Yang, A.S.; Mekrangsiman, S. Corporate Social Responsibility as Sustainability Management: International Shipping Firms and Financial Performance. Int. J. Shipp. Transp. Logist. 2023, 16, 120. [Google Scholar] [CrossRef]
- Kuo, Y.; Yang, T.; Huang, G.-W. The Use of Grey Relational Analysis in Solving Multiple Attribute Decision-Making Problems. Comput. Ind. Eng. 2008, 55, 80–93. [Google Scholar] [CrossRef]
- International Maritime Organization. IMO’s Response to Current Environmental Challenges IMO and the Environment 2; International Maritime Organization: London, UK, 2011. [Google Scholar]
- Comer, B.; McCabe, S.; Carr, E.W.; Elling, M.; Sturrup, E.; Knudsen, B.; Beecken, J.; Winebrake, J.J. Real-World NOx Emissions from Ships and Implications for Future Regulations; International Council on Clean Transportation: Washington, DC, USA, 2023. [Google Scholar]
- International Maritime Organization Ballast Water Management. Available online: https://www.imo.org/en/ourwork/environment/pages/ballastwatermanagement.aspx#:~:text=The%20Convention%20requires%20all%20ships,procedures%20to%20a%20given%20standard (accessed on 8 March 2024).
- Panayides, P.M. Fundamentals of Ship Management. In Shipping Operations Management; Springer: Berlin/Heidelberg, Germany, 2017; pp. 1–23. [Google Scholar]
- Ren, J.; Lützen, M.; Rasmussen, H.B. Identification of Success Factors for Green Shipping with Measurement of Greenness Based on ANP and ISM. In Multi-Criteria Decision Making in Maritime Studies and Logistics; Springer: Berlin/Heidelberg, Germany, 2018; pp. 79–103. [Google Scholar]
- Nielsen, S.; Huse, M. The Contribution of Women on Boards of Directors: Going beyond the Surface. Corp. Gov. Int. Rev. 2010, 18, 136–148. [Google Scholar] [CrossRef]
- Campbell, K.; Mínguez-Vera, A. Gender Diversity in the Boardroom and Firm Financial Performance. J. Bus. Ethics 2008, 83, 435–451. [Google Scholar] [CrossRef]
- Erhardt, N.L.; Werbel, J.D.; Shrader, C.B. Board of Director Diversity and Firm Financial Performance. Corp. Gov. Int. Rev. 2003, 11, 102–111. [Google Scholar] [CrossRef]
- Pastra, A.; Gkliatis, I.; Koufopoulos, D.N. Organisational Behaviour in Shipping. In Shipping Operations Management; Springer: Cham, Switzerland, 2017; Volume 4, pp. 25–46. [Google Scholar]
- Pastra, A.S.; Koufopoulos, D.N.; Gkliatis, I.P. Board Characteristics and the Presence of Women on the Board of Directors: The Case of the Greek Shipping Sector. In Maritime Women: Global Leadership; Springer: Berlin/Heidelberg, Germany, 2015; Volume 3, pp. 35–54. [Google Scholar]
- CMA CGM. Sustainable Development Report; CMA CGM: Marseilles, France, 2020. [Google Scholar]
- Panayides, P.M.; Lambertides, N.; Savva, C.S. The Relative Efficiency of Shipping Companies. Transp. Res. Part E Logist. Transp. Rev. 2011, 47, 681–694. [Google Scholar] [CrossRef]
- Lun, V.Y.H.; Marlow, P. The Impact of Capacity on Firm Performance: A Study of the Liner Shipping Industry. Int. J. Shipp. Transp. Logist. 2011, 3, 57. [Google Scholar] [CrossRef]
- Bang, H.-S.; Kang, H.-W.; Martin, J.; Woo, S.-H. The Impact of Operational and Strategic Management on Liner Shipping Efficiency: A Two-Stage DEA Approach. Marit. Policy Manag. 2012, 39, 653–672. [Google Scholar] [CrossRef]
- Gutiérrez, E.; Lozano, S.; Furió, S. Evaluating Efficiency of International Container Shipping Lines: A Bootstrap DEA Approach. Marit. Econ. Logist. 2014, 16, 55–71. [Google Scholar] [CrossRef]
- Hsieh, H.P.; Kuo, K.C.; Le, M.H.; Lu, W.M. Exploring the Cargo and Eco-Efficiencies of International Container Shipping Companies: A Network-Based Ranking Approach. Manag. Decis. Econ. 2021, 42, 45–60. [Google Scholar] [CrossRef]


| Shipping Line | Total Fleet Capacity (TEUs in ‘000) | No. of Training Hours per Employee | Transported Volume (TEUs in ‘000) | Revenue (USD Million) | International Routes (Total Services) | Ratio of Female Employees in Management | (%) Vessels with Ballast Water Treatment + SOx Rubber | On-Time Rate | No. of Employees (Shipping Lines) | Total Energy Consumption (TJ) | Operating Cost (USD Million) | tCO2e (in ‘000 tons) | SO2 (in ‘000 tons) | NO2 (in ‘000 tons) |
|---|---|---|---|---|---|---|---|---|---|---|---|---|---|---|
| CMA CGM | 3186 | 35 | 21,740 | 58,950 | 333 | 32% | 79% | 67.3% | 87,714 | 320,549 | 27,310 | 30,110 | 71 | 575 |
| COSCO | 2890 | 31 | 24,410 | 58,150 | 287 | 38% | 39% | 65.8% | 31,510 | 259,785 | 32,415 | 20,778 | 242 | 496 |
| Evergreen | 1663 | 49 | 7646 | 21,076 | 150 | 20% | 60% | 68.2% | 3121 | 106,288 | 7689 | 8144 | 18 | 121 |
| Hapag-Lloyd | 1797 | 20 | 11,843 | 36,401 | 119 | 17% | 73% | 61.0% | 4106 | 166,408 | 18,441 | 15,676 | 31 | 176 |
| HMM | 816 | 34 | 3679 | 13,844 | 60 | 6% | 90% | 52.6% | 1785 | 65,934 | 5954 | 5348 | 10 | 92 |
| Maersk | 4221 | 37 | 23,848 | 64,299 | 343 | 26% | 73% | 73.5% | 104,260 | 447,345 | 30,589 | 77,957 | 99 | 604 |
| Wan Hai | 440 | 12 | 4460 | 8700 | 80 | 37% | 91% | 70.9% | 4989 | 73,214 | 4452 | 5372 | 15 | 97 |
| Yang Ming | 731 | 33 | 4510 | 12,630 | 101 | 45% | 86% | 54.0% | 3186 | 51,639 | 4895 | 4693 | 11 | 110 |
| ZIM | 549 | 41 | 3379 | 12,740 | 95 | 40% | 77% | 59.0% | 4830 | 75,170 | 5999 | 7572 | 21 | 138 |
| ONE | 1548 | 12 | 11,081 | 29,282 | 166 | 35% | 73% | 57.1% | 8816 | 121,128 | 14,285 | 9389 | 26 | 221 |
| Shipping Line | Total Fleet Capacity (TEUs in ‘000) | No. of Training Hours per Employee | Transported Volume (TEUs in ‘000) | Revenue (USD Million) | International Routes (Total Services) | Ratio of Female Employees in Management | (%) Vessels with Ballast Water Treatment + SOx Rubber | On-Time Rate | No. of Employees (Shipping Lines) | Total Energy Consumption (TJ) | Operating Cost (USD Million) | tCO2e (in ‘000 tons) | SO2 (in ‘000 tons) | NO2 (in ‘000 tons) |
|---|---|---|---|---|---|---|---|---|---|---|---|---|---|---|
| CMA CGM | −0.3076 | −0.2474 | −0.3132 | −0.3132 | −0.3169 | −0.2404 | −0.2391 | −0.2391 | −0.3671 | −0.3155 | −0.3084 | −0.2955 | −0.2656 | −0.3324 |
| COSCO | −0.2949 | −0.2330 | −0.3274 | −0.3115 | −0.2977 | −0.2634 | −0.1561 | −0.2361 | −0.2587 | −0.2881 | −0.3295 | −0.2455 | −0.3604 | −0.3146 |
| Evergreen | −0.2212 | −0.2944 | −0.1787 | −0.1806 | −0.2117 | −0.1819 | −0.2034 | −0.2409 | −0.0540 | −0.1741 | −0.1509 | −0.1375 | −0.1127 | −0.1417 |
| Hapag-Lloyd | −0.2312 | −0.1792 | −0.2323 | −0.2489 | −0.1839 | −0.1640 | −0.2282 | −0.2261 | −0.0666 | −0.2284 | −0.2559 | −0.2091 | −0.1647 | −0.1810 |
| HMM | −0.1411 | −0.2452 | −0.1091 | −0.1370 | −0.1164 | −0.0790 | −0.2559 | −0.2074 | −0.0348 | −0.1267 | −0.1269 | −0.1024 | −0.0734 | −0.1173 |
| Maersk | −0.3410 | −0.2565 | −0.3246 | −0.3239 | −0.3205 | −0.2135 | −0.2282 | −0.2508 | −0.3656 | −0.3520 | −0.3226 | −0.3642 | −0.3100 | −0.3379 |
| Wan Hai | −0.0913 | −0.1277 | −0.1248 | −0.0989 | −0.1419 | −0.2598 | −0.2574 | −0.2461 | −0.0771 | −0.1361 | −0.1034 | −0.1028 | −0.0990 | −0.1217 |
| Yang Ming | −0.1309 | −0.2412 | −0.1258 | −0.1287 | −0.1656 | −0.2872 | −0.2498 | −0.2107 | −0.0549 | −0.1067 | −0.1106 | −0.0932 | −0.0788 | −0.1328 |
| ZIM | −0.1071 | −0.2704 | −0.1026 | −0.1294 | −0.1591 | −0.2703 | −0.2351 | −0.2218 | −0.0753 | −0.1386 | −0.1276 | −0.1308 | −0.1256 | −0.1547 |
| ONE | −0.2121 | −0.1277 | −0.2237 | −0.2204 | −0.2246 | −0.2523 | −0.2282 | −0.2177 | −0.1165 | −0.1891 | −0.2222 | −0.1513 | −0.1453 | −0.2081 |
| Σ | −2.0784 | −2.2228 | −2.0621 | −2.0925 | −2.1384 | −2.2117 | −2.2813 | −2.2966 | −1.4707 | −2.0553 | −2.0580 | −1.8322 | −1.7355 | −2.0420 |
| 0.9027 | 0.9653 | 0.8956 | 0.9088 | 0.9287 | 0.9605 | 0.9908 | 0.9974 | 0.6387 | 0.8926 | 0.8938 | 0.7957 | 0.7537 | 0.8868 | |
| 0.0973 | 0.0347 | 0.1044 | 0.0912 | 0.0713 | 0.0395 | 0.0092 | 0.0026 | 0.3613 | 0.1074 | 0.1062 | 0.2043 | 0.2463 | 0.1132 | |
| 0.0613 | 0.0218 | 0.0657 | 0.0574 | 0.0449 | 0.0248 | 0.0058 | 0.0016 | 0.2274 | 0.0676 | 0.0668 | 0.1286 | 0.1550 | 0.0712 | |
| Rank of importance | 8 | 12 | 7 | 9 | 10 | 11 | 13 | 14 | 1 | 5 | 6 | 3 | 2 | 4 |
| Shipping Line | Total Fleet Capacity (TEUs in ‘000) | No. of Training Hours per Employee | Transported Volume (TEUs in ‘000) | Revenue (USD Million) | International Routes (Total Services) | Ratio of Female Employees in Management | (%) Vessels with Ballast Water Treatment + SOx Rubber | On-Time Rate | No. of Employees (Shipping Lines) | Total Energy Consumption (TJ) | Operating Cost (USD Million) | tCO2e (in ‘000 tons) | SO2 (in ‘000 tons) | NO2 (in ‘000 tons) |
|---|---|---|---|---|---|---|---|---|---|---|---|---|---|---|
| CMA CGM | 0.7263 | 0.6097 | 0.8730 | 0.9038 | 0.9647 | 0.6612 | 0.7744 | 0.3103 | 0.1615 | 0.3204 | 0.1826 | 0.6531 | 0.7371 | 0.0566 |
| COSCO | 0.6480 | 0.5135 | 1.0000 | 0.8894 | 0.8021 | 0.8138 | 0.0000 | 0.2785 | 0.7099 | 0.4740 | 0.0000 | 0.7805 | 0.0000 | 0.2109 |
| Evergreen | 0.3235 | 1.0000 | 0.2029 | 0.2226 | 0.3180 | 0.3560 | 0.3984 | 0.3297 | 0.9870 | 0.8619 | 0.8843 | 0.9529 | 0.9655 | 0.9434 |
| Hapag-Lloyd | 0.3589 | 0.2162 | 0.4025 | 0.4982 | 0.2085 | 0.2797 | 0.6507 | 0.1769 | 0.9774 | 0.7100 | 0.4997 | 0.8501 | 0.9075 | 0.8359 |
| HMM | 0.0994 | 0.5946 | 0.0143 | 0.0925 | 0.0000 | 0.0000 | 0.9806 | 0.0000 | 1.0000 | 0.9639 | 0.9463 | 0.9911 | 1.0000 | 1.0000 |
| Maersk | 1.0000 | 0.6757 | 0.9733 | 1.0000 | 1.0000 | 0.5086 | 0.6507 | 0.4406 | 0.0000 | 0.0000 | 0.0653 | 0.0000 | 0.6164 | 0.0000 |
| Wan Hai | 0.0000 | 0.0000 | 0.0514 | 0.0000 | 0.0707 | 0.7884 | 1.0000 | 0.3874 | 0.9687 | 0.9455 | 1.0000 | 0.9907 | 0.9784 | 0.9902 |
| Yang Ming | 0.0770 | 0.5676 | 0.0538 | 0.0707 | 0.1449 | 1.0000 | 0.9030 | 0.0304 | 0.9863 | 1.0000 | 0.9842 | 1.0000 | 0.9957 | 0.9648 |
| ZIM | 0.0288 | 0.7838 | 0.0000 | 0.0726 | 0.1237 | 0.8647 | 0.7283 | 0.1347 | 0.9703 | 0.9405 | 0.9447 | 0.9607 | 0.9526 | 0.9102 |
| ONE | 0.2930 | 0.0000 | 0.3662 | 0.3702 | 0.3746 | 0.7375 | 0.6507 | 0.0946 | 0.9314 | 0.8244 | 0.6484 | 0.9359 | 0.9310 | 0.7480 |
| = 0.1 | = 0.3 | = 0.5 | = 0.7 | = 0.9 | ||||||
|---|---|---|---|---|---|---|---|---|---|---|
| Grade | Rank | Grade | Rank | Grade | Rank | Grade | Rank | Grade | Rank | |
| CMA CGM | 0.2384 | 10 | 0.4448 | 10 | 0.5550 | 9 | 0.6264 | 9 | 0.6773 | 9 |
| COSCO Shipping Lines | 0.2722 | 9 | 0.4736 | 8 | 0.5804 | 8 | 0.6488 | 8 | 0.6971 | 8 |
| Evergreen | 0.5623 | 4 | 0.7211 | 4 | 0.7842 | 4 | 0.8216 | 4 | 0.8473 | 3 |
| Hapag-Lloyd | 0.4120 | 6 | 0.6129 | 7 | 0.7026 | 7 | 0.7566 | 7 | 0.7934 | 7 |
| HMM | 0.6983 | 2 | 0.7716 | 2 | 0.8091 | 2 | 0.8348 | 2 | 0.8541 | 2 |
| Maersk | 0.3098 | 8 | 0.4455 | 9 | 0.5318 | 10 | 0.5937 | 10 | 0.6405 | 10 |
| Wan Hai | 0.6313 | 3 | 0.7483 | 3 | 0.7957 | 3 | 0.8255 | 3 | 0.8469 | 4 |
| Yang Ming | 0.7098 | 1 | 0.7887 | 1 | 0.8253 | 1 | 0.8498 | 1 | 0.8678 | 1 |
| ZIM | 0.5367 | 5 | 0.7104 | 5 | 0.7747 | 5 | 0.8121 | 5 | 0.8378 | 5 |
| ONE | 0.4054 | 7 | 0.6230 | 6 | 0.7140 | 6 | 0.7674 | 6 | 0.8032 | 6 |
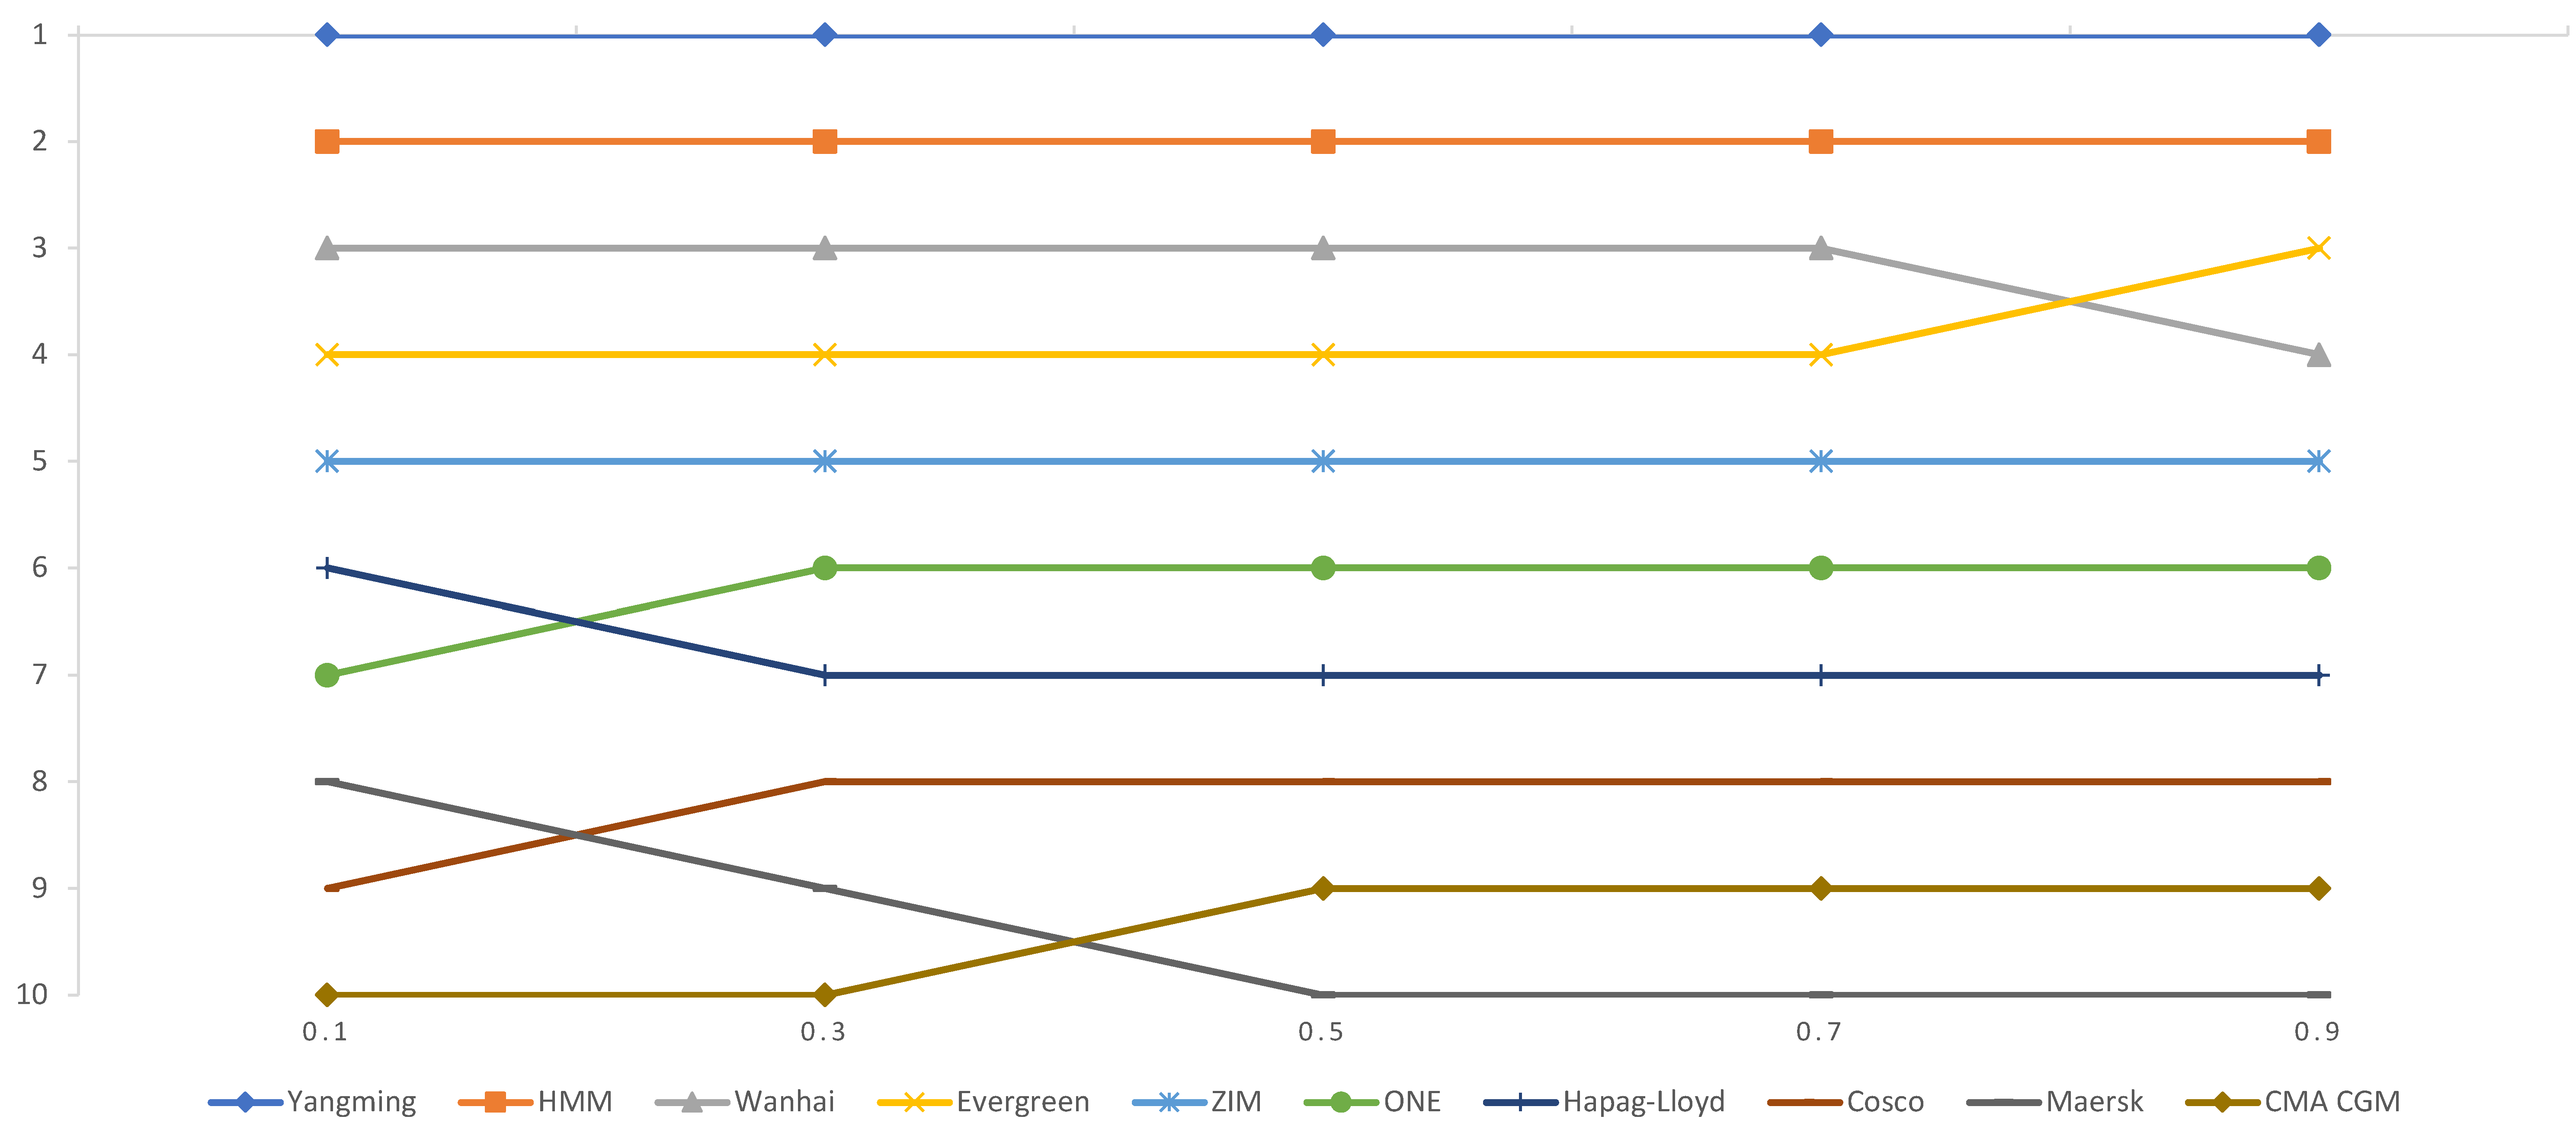
| CSL | = 0.1 | = 0.3 | = 0.5 | = 0.7 | = 0.9 | Range | Stdv. |
|---|---|---|---|---|---|---|---|
| Yang Ming | 1 | 1 | 1 | 1 | 1 | 0 | 0.00 |
| HMM | 2 | 2 | 2 | 2 | 2 | 0 | 0.00 |
| Wan Hai | 3 | 3 | 3 | 3 | 4 | 1 | 0.45 |
| Evergreen | 4 | 4 | 4 | 4 | 3 | 1 | 0.45 |
| ZIM | 5 | 5 | 5 | 5 | 5 | 0 | 0.00 |
| ONE | 7 | 6 | 6 | 6 | 6 | 1 | 0.45 |
| Hapag-Lloyd | 6 | 7 | 7 | 7 | 7 | 1 | 0.45 |
| COSCO | 9 | 8 | 8 | 8 | 8 | 1 | 0.45 |
| Maersk | 8 | 9 | 10 | 10 | 10 | 2 | 0.89 |
| CMA CGM | 10 | 10 | 9 | 9 | 9 | 1 | 0.55 |
Disclaimer/Publisher’s Note: The statements, opinions and data contained in all publications are solely those of the individual author(s) and contributor(s) and not of MDPI and/or the editor(s). MDPI and/or the editor(s) disclaim responsibility for any injury to people or property resulting from any ideas, methods, instructions or products referred to in the content. |
© 2025 by the authors. Licensee MDPI, Basel, Switzerland. This article is an open access article distributed under the terms and conditions of the Creative Commons Attribution (CC BY) license (https://creativecommons.org/licenses/by/4.0/).
Share and Cite
Wang, C.-N.; Quang, B.X.; Nguyen, T.T.T. Benchmarking Efficiency, Sustainability, and Corporate Responsibility in Maritime Logistics: An Entropy-GRA Model with Sensitivity Analysis. Sustainability 2025, 17, 3813. https://doi.org/10.3390/su17093813
Wang C-N, Quang BX, Nguyen TTT. Benchmarking Efficiency, Sustainability, and Corporate Responsibility in Maritime Logistics: An Entropy-GRA Model with Sensitivity Analysis. Sustainability. 2025; 17(9):3813. https://doi.org/10.3390/su17093813
Chicago/Turabian StyleWang, Chia-Nan, Bach Xuan Quang, and Thi Thanh Tam Nguyen. 2025. "Benchmarking Efficiency, Sustainability, and Corporate Responsibility in Maritime Logistics: An Entropy-GRA Model with Sensitivity Analysis" Sustainability 17, no. 9: 3813. https://doi.org/10.3390/su17093813
APA StyleWang, C.-N., Quang, B. X., & Nguyen, T. T. T. (2025). Benchmarking Efficiency, Sustainability, and Corporate Responsibility in Maritime Logistics: An Entropy-GRA Model with Sensitivity Analysis. Sustainability, 17(9), 3813. https://doi.org/10.3390/su17093813