Article

Trade-Off Analysis of Ecosystem Services in Regulated River Areas: Supporting, Regulating, and Cultural Services

1
NEXUS Ecological Design Group, Uiwang-si 16006, Republic of Korea
2
Division of Environmental Science and Ecological Engineering, Korea University, Seoul 02841, Republic of Korea
*
Author to whom correspondence should be addressed.
Sustainability 2025, 17(9), 3788; https://doi.org/10.3390/su17093788
Submission received: 5 March 2025 / Revised: 9 April 2025 / Accepted: 20 April 2025 / Published: 23 April 2025

Abstract

This study evaluates ecosystem services (ESs) in 10 municipalities within the Han River Basin, analyzes trade-offs, and proposes measures to enhance synergies in areas with ES imbalances. The research focuses on: (1) evaluating ESs in Namyangju and Yongin; (2) identifying vulnerable areas through conservation value assessment; (3) analyzing trade-offs in vulnerable and regulated areas; and (4) developing scenarios to mitigate imbalances, comparing ES evaluations before and after implementation. To enhance synergies, three scenarios were developed, focusing on mixed forest planting and integrating ecological tourism and recreational facilities. These were applied to vulnerable and regulated areas in Namyangju and Yongin. We utilized the InVEST (Integrated Valuation of Ecosystem Services and Tradeoffs) Habitat Quality (HQ) model, InVEST Carbon model, ES evaluation methodology. Synergies were considered improved if all ES indicators showed positive changes post-implementation. The optimal proportions of mixed forest planting and tourism facilities varied by trade-off type and land cover characteristics, as determined by ES evaluation scores. This study provides a comprehensive analysis of ESs in water source protection areas, highlighting trade-offs and offering practical solutions to mitigate imbalances. By focusing on municipalities in the Han River Basin, it presents a novel approach to ES evaluation at the administrative district level and addresses sustainable river land management and key environmental management challenges.

1. Introduction

Ecosystem services (ESs) refer to the benefits that humans derive from ecosystems. They are categorized into provisioning services, such as food, water, timber, and fiber; regulating services, which influence climate, floods, diseases, waste, and water quality; cultural services, which provide recreational, aesthetic, and spiritual benefits; and supporting services, which include processes like soil formation, photosynthesis, and nutrient cycling [1]. ESs have been recognized as a critical framework for assessing and quantifying the value of ecosystems [1,2,3]. Globally, it is increasingly important to develop spatial plans based on trade-off analyses of ESs at regional levels to promote balanced national development. In recent years, developed countries have focused on mapping ESs to understand the spatial structures and functions of biodiversity and ESs, thereby supporting evidence-based decision-making processes [4,5,6].
The ecosystem service value (ESV) quantitatively or qualitatively evaluates the complex relationships, including synergies and trade-offs, within the framework of Social-Ecological Systems (SES). ESV integrates diverse social, economic, cultural, and intrinsic values of regions, along with their spatial attributes, making it a crucial component of mapping efforts [2,7,8]. Additionally, Mapping Ecosystem Services (MES) involves steps such as selecting ES evaluation indicators, assessing ecosystem functions and values, generating spatial data, and sharing, utilizing, and storing these data. MSE serves as a key analytical tool for understanding synergies and trade-offs to support informed decision-making processes [8,9].
In Korea, ESs are assessed and mapped at the national scale, encompassing diverse domains such as the entire territory, rivers, and national parks [10]. However, current evaluations of ES primarily depend on GIS-based scoring and overlapping assessments, such as conservation value evaluations. This approach has significant limitations, as regions with the same overlapping evaluation score are treated as having similar ecosystem service values, which prevents detailed analysis of trade-offs and synergies among specific services within a given area.
The trade-off analysis method offers important advantages over traditional overlapping evaluation approaches. When applied to MES, trade-off analysis can identify variations in offset phenomena even among areas with identical overlapping evaluation scores, enabling a more precise selection of areas requiring ecosystem service management. This approach allows for targeted interventions that address specific ES imbalances rather than applying uniform management strategies to areas with similar conservation values.
Therefore, this study employs a two-stage approach: first, selecting vulnerable areas using the existing overlapping evaluation method, and then applying the trade-off analysis as a second stage for specific ecosystem service evaluation to identify areas requiring targeted ecosystem service management. This combined methodology enhances the precision of ecosystem service assessment and management planning.
In Korea, water source protection areas are designated to enhance water quality and preserve biodiversity. These areas are categorized into water source protection zones, riparian zones, and special countermeasure areas, with regulations limiting development and activities within them. To address regional disparities among municipalities in these zones, the Ministry of Environment has implemented resident-based projects—such as land purchases and the establishment of riparian ecological belts—financed through the watershed management fund since 1999. These protection areas are vital for conserving and maintaining ESs across the national territory [11,12].
The waterfront area located within the 50 m section of the river is preferentially purchased to remove pollutants, after which a waterfront green area is created to preserve and restore the river’s water ecosystem. Since 2003, Korea has been carrying out these projects, and as of 2025, it intends to evaluate the value of ecosystem services value of these initiatives. Applying the concept of ecosystem services to evaluate the effects of the waterfront ecological belt project, which has not been quantified thus far, and establishing the management direction of river areas is one of the most important projects at the national level.
However, no studies to date have assessed the ES value of water source protection areas, particularly in terms of evaluating and proposing scenarios to mitigate trade-offs from regulatory measures. Most researchers have confined their investigations of water source protection areas primarily to water quality aspects within regulating services. Therefore, it is necessary to study the evaluation system of ecosystem services in water source management areas from a comprehensive perspective that includes supporting services, regulating services, and cultural services.
In particular, within the context of the Global Biodiversity Framework (GBF), a recent international initiative, it is necessary to select ecosystem service evaluation criteria and analyze effects to improve biodiversity expansion, carbon sequestration and storage functions, and ecotourism potential in water source management areas.
This study distinguished itself from previous research by focusing specifically on supporting services, regulating services, and cultural services among the four ecosystem services categories.
This study aims to assess ESs in 10 municipalities within the water source protection areas of the Han River Basin, including the Seoul metropolitan region, analyze trade-off relationships among evaluation criteria, and propose measures to enhance synergies in regions where ES imbalances arise due to trade-offs.
Specifically, the study focuses on the following objectives: (1) evaluate ESs at the administrative district level by selecting representative indicators from supporting, regulating, and cultural services for two municipalities, Namyangju and Yongin, in the Han River Basin; (2) conduct a conservation value assessment to identify vulnerable areas by overlaying ES evaluation results; (3) analyze trade-off relationships among ES evaluation criteria in vulnerable and regulated areas; and (4) develop scenarios to address trade-offs in imbalanced regions and propose improvement measures by comparing ES evaluations before and after scenario implementation to establish sustainable ecosystem service management approaches in regulated river areas.

2. Literature Review

2.1. Trends in Ecosystem Service Research

This study examines recent research trends in ecosystem services by utilizing EVIS to review literature assessing ecosystem services in Korea, focusing on rivers. EVIS is a system managed by the Korea Environment Institute, a highly credible institution in Korea, and continuously updates its database on ecosystem services (http://evis.kei.re.kr/, accessed on 2 April 2025). Among a total of 525 research papers, 61 were identified as related to rivers.
Research on ecosystem services related to rivers accounts for only 11.62% of Korea’s ecosystem services studies. Furthermore, as of December 2024, none of the 525 studies in the EVIS database focused on ecosystem services in “Water Source Protection Areas”. Given the increasing emphasis on the importance of ecosystem service valuation in Water Source Protection Areas, there is a pressing need to conduct research evaluating ecosystem services in these areas in Korea (Table 1).
Meanwhile, the GBF, a key international issue, envisions “a world living in harmony with nature”, where biodiversity is valued, conserved, restored, and wisely used to sustain ecosystem services, maintain a healthy planet, and provide essential benefits to all people by 2050 (Ministry of Environment, 2023) [13].
GBF emphasizes the appropriate balance among the four categories of ecosystem services: regulating services, cultural services, supporting services, and provisioning services. It highlights the importance of not only provisioning services, which provide tangible resources such as food, water, and timber, but also regulating services, which include air purification, carbon sequestration, climate regulation, and disaster prevention. Additionally, it underscores supporting services, which maintain biodiversity and species diversity, as well as cultural services, which offer aesthetic and recreational benefits.
From the perspective of the GBF, which is a crucial global issue, research is needed to establish evaluation criteria and analyze the effectiveness of ecosystem services in Water Source Protection Areas, particularly concerning biodiversity, carbon sequestration and storage functions, and ecotourism. However, most studies on Water Source Protection Areas have focused on water quality in the context of provisioning services [14,15]. At a time when the valuation of ecosystem services in Korea’s Water Source Protection Areas is becoming increasingly important, research should be conducted to develop a comprehensive assessment framework that integrates supporting services, provisioning services, and cultural services.
Therefore, this study aims to differentiate itself from previous studies by focusing on supporting, regulating, and cultural services in the evaluation of Water Source Protection Areas.

2.2. Trends in Ecosystem Service Evaluation Indicators Research

Ecosystem service evaluation indicators vary depending on the type of ecosystem and spatial scale, alignment with management and policy objectives, the stakeholders utilizing the assessment, and specific needs and requirements [16]. Therefore, before establishing ecosystem service evaluation indicators, this study examined the commonly used indicators in the assessment of river, freshwater, and wetland ecosystem services in Korea.
The Millennium Development Goals (MDGs) [1] provided a foundational classification method for ESs, identifying supporting services as soil formation, photosynthesis, primary production, nutrient cycling, and water cycling; regulating services such as air quality, climate regulation, water regulation, erosion control, water purification and waste treatment, disease regulation, pest management, pollination, and natural hazard mitigation; and cultural services such as spiritual and religious values, knowledge systems, educational values, aesthetic values, social relations, sense of place, cultural heritage values, and recreation and ecotourism. Ref. [17] collected ES indicators evaluated across various scales and countries to improve policymakers’ access to these indicators. Their findings include regulating services like air quality and climate regulation, while cultural services focused primarily on aesthetics. Although supporting services were less commonly used in global evaluations (e.g., SGAs and MA), ref. [17] emphasized their importance and suggested nutrient cycling and primary production as key indicators. Korea’s National Institute of Ecology has continuously updated ES indicators since 2014 to assess national ES values and conservation measures. In 2017, a comprehensive database of indicators was created by analyzing 22 international documents, including MA, UK-NEA, TEEB, and IPBES reports, as well as Korean reports. Indicators tailored to Korea’s context were developed using the Analytic Hierarchy Process (AHP). Supporting services were categorized as nutrient cycling, soil formation, primary production, and habitat; regulating services such as air quality, greenhouse gas regulation, water regulation, natural hazard regulation, and erosion regulation; and cultural services as recreation and ecotourism, landscape aesthetics, education, and heritage [4].
However, some indicators, despite their high evaluation importance, remain incomplete due to data limitations and rely on substitute metrics [18]. Therefore, it is necessary to strike a balance between evaluating all individual indicators, which can lead to confusion, and conducting overly simplified evaluations using only a few indicators [19]. When assessing national biodiversity and ecosystem services, State and Flow indicators should be utilized, whereas Performance and stock indicators are more appropriate for evaluating sustainability [20]. This study thoroughly reviewed whether the selected indicators adequately represent supporting, regulating, and cultural services reflect the characteristics of Korea’s Water Source Protection Areas, and allow for scenario analysis using baseline data and land use information.
Indicators were selected based on the following criteria: the indicator type must be either state or flow, the representativeness must be high, and the measurability must be robust to ensure a valid evaluation. Among the previously presented evaluation items for supporting, regulating, and cultural services, a thorough review was conducted to determine whether each item effectively represents its service category, reflects current global ES issues, has sufficient baseline data, and is suitable for scenario analysis using land use. Ultimately, the following indicators were selected: habitat quality (2017); carbon storage and sequestration for regulating services to evaluate the ecosystem’s response to climate change issues [21,22] and recreation and ecotourism for cultural services to assess recreational value [4,23]; Table 2 summarizes the literature review classification of ES evaluation indicators across various studies.
Ecosystem service indicators are categorized based on their evaluation purpose. When assessing national biodiversity and ecosystem services, State and Flow indicators should be utilized, whereas Performance and Stock indicators are more appropriate for evaluating sustainability [20]. Additionally, this study thoroughly reviewed whether the selected indicators adequately represent supporting, regulating, and cultural services, reflect the characteristics of Korea’s Water Source Protection Areas, and allow for scenario analysis using baseline data and land use information.
Accordingly, indicators were selected based on the following criteria: the Indicator Type must be either State or Flow, the representativeness must be representative, and the measurability must be high to ensure a robust evaluation. Among the previously presented evaluation items for supporting, regulating, and cultural services, a thorough review was conducted to determine whether each item effectively represents its service category, reflects current global ES issues, has sufficient baseline data, and is suitable for scenario analysis using land use.
Ultimately, the following indicators were selected: habitat for supporting services to assess environmental conditions for living organisms [4,24]; greenhouse gas regulation for regulating services to evaluate the ecosystem’s carbon storage function in response to climate change issues [4,21,22,24] and recreation and ecotourism for cultural services to assess recreational value [4,23].

2.3. Methods of Ecosystem Service Analysis

Recent research on MES has increasingly utilized analytical tools such as InVEST, SoLVES, TESSA, and EcoServ. Among these, InVEST is widely recognized for its versatility in mapping and its ability to quantitatively assess ESV across multiple scales [26,27].
In particular, InVEST offers specific models for 19 items, such as carbon storage and habitat quality, making it a convenient choice for setting ES indicators based on evaluation and mapping objectives. In Korea, public institutions such as the National Institute of Ecology and the National Parks Service have conducted ES studies tailored to the country’s unique ecological characteristics, using InVEST Habitat to assess supporting services (such as habitat quality) and InVEST Carbon to evaluate regulating services (such as carbon storage) [16,20]. Furthermore, the InVEST Habitat and InVEST Carbon models allow for scenario-based predictions by simulating changes in land use. This functionality makes InVEST a valuable tool for prioritizing development sites or minimizing ESV losses in regional planning [28]. In addition, conservation value assessments, which overlay the results of individual evaluation items using GIS programs, are commonly employed to map ESs based on comprehensive scores) [16,20]. This study also adopts conservation value assessments to analyze ES overlaps but distinguishes its approach by integrating ES trade-off evaluations into the mapping analysis.

2.4. Trends in Trade-Off Analysis Research
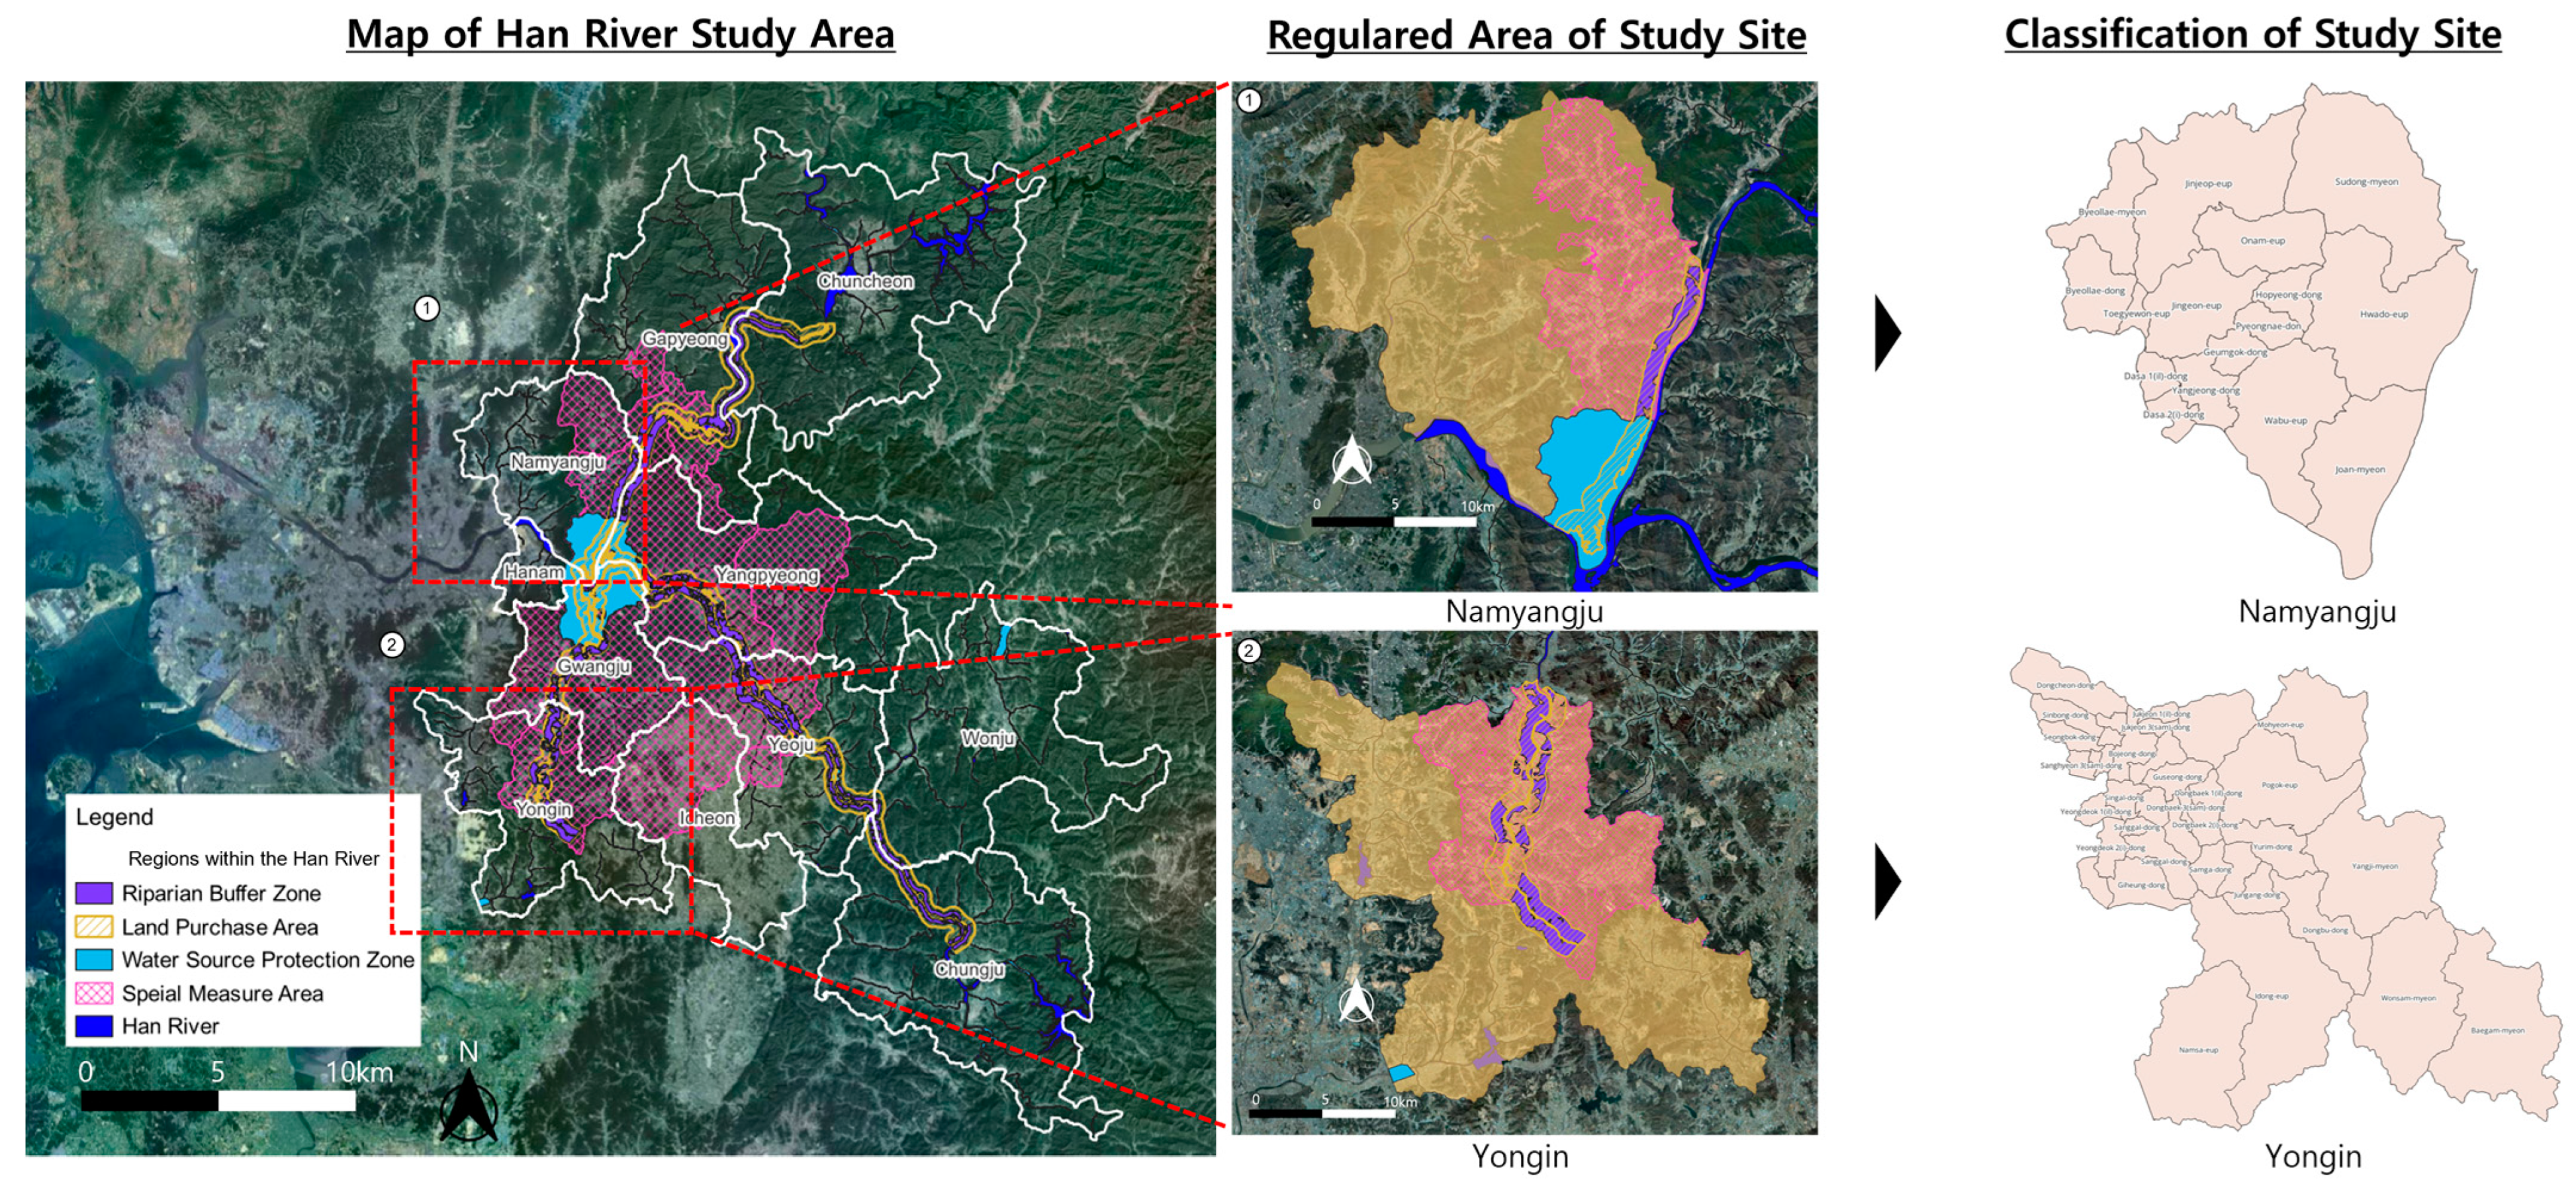
A trade-off refers to a situation in which gaining one benefit results in the loss of another, often analyzed in terms of economic costs and benefits. In ecological restoration, trade-off analysis evaluates the interrelationships among ES and assesses opportunity costs through various decision-making processes. In essence, it is a prerequisite step for assessing the opportunity costs of policy decisions. Interrelationship analyses among ES generally include trade-offs, synergies, and bundled relationships [29]. Previous studies on trade-off analysis in ES have primarily focused on evaluating trade-offs and synergies [30] conducted a review of ES studies from 2009 to 2017, revealing that over 26% of these studies focused on conflicts related to land use/land cover changes, as well as land management [31,32]. Analyzing trade-offs caused by land cover changes enables time-series assessments of trade-offs, which many researchers have adopted as a preferred method [33]. In the existing trade-off analysis studies, it is common to study a land cover map for 5 or 10 years as baseline data to examine changes in trade-off over time. However, this approach has limitations as it often concludes by simply determining whether offset effects have occurred over time. For establishing plans and management direction to improve the ecosystem service in specific areas, it is necessary to analyze the trade-off at the current point in time to identify areas where the offset phenomenon occurs. Furthermore, it is important to present appropriate improvement strategies that can enhance the synergistic effects by applying a scenario to mitigate the offset phenomenon. This study considers land cover changes to analyze the trade-off and synergies and establish scenario-based strategies to mitigate the extent of trade-offs within the study area. Specifically, it analyzes the trade-offs in a regulated area within the Han River basin at present, identifies vulnerable regions, and develops improvement measures through scenario application.

3. Study Scope

This study examined municipalities located within the water source protection areas of the Han River Basin in Korea. The Han River Basin includes legally designated regulated areas aimed at protecting the water quality of Paldang Lake and preserving the surrounding environment. These areas impose restrictions on land use and development. Accordingly, compared to other regions, the economic value of land designated as a Water Source Protection Area tends to decline, and regulated land faces challenges related to urban growth boundaries [34]. In selecting study sites, this research aimed to minimize the impact of regional characteristics resulting from regulatory designations on ecosystem service evaluation outcomes by choosing two areas where the proportion of Water Source Protection Areas relative to the total administrative area is similar. This approach helps reduce potential analytical errors.
This study examined the proportion of Water Source Protection Areas across ten cities within the Han River watershed. The Natural Breaks classification method was employed to group administrative districts with similar proportions of Water Source Protection Areas for comparative analysis.
Among the regulated areas of the 10 cities in the Han River Basin, the proportions and areas of riparian zones, special countermeasure areas, water source protection zones, and land acquisition target zones are detailed in Table 3. The Natural Breaks classification method was employed to group administrative districts with similar the proportions of Water Source Protection Areas for comparative analysis. Among the regulated areas of the 10 cities in Han River Basin, the proportions and areas of riparian zones, special countermeasure areas, water source protection zones, and land acquisition target zones are detailed in Table 3. The natural breaks method was used to classify the proportion of water source protection areas into five clusters. Group 1 had a Regulated Area proportion ranging from 1.67% to 2.15%, Group 2 ranged from 5.00% to 18.84%, Group 3 ranged from 31.56% to 36.23%, Group 4 ranged from 42.49% to 53.41%, and Group 5 had a Regulated Area proportion of 100%.
This study focused on areas belonging to the middle group (Group 3) where the Regulated Area proportion is around the median value. Consequently, Namyangju City and Yongin City, where the proportion of Regulated Areas ranges from 31.56% to 36.23%, were selected as study sites (Figure 1).

4. Research Methods and Procedures

4.1. Research Methods

4.1.1. InVEST Habitat Quality (HQ)

InVEST HQ (KNPS-ES_v2.5, Korea National Park Research Institute) is a model that spatially represents biodiversity based on land use/land cover (LULC). This model evaluates habitat quality on a scale from 0 to 1, with a value closer to 1 indicating better habitat quality. Habitat quality (HQ) is calculated using three factors: (1) the relative impact of each threat factor and the maximum impact distance, (2) the relative sensitivity of each habitat type to each threat, and (3) the distance between habitats and sources of threats. InVEST HQ first assesses initial habitat quality based on land cover and then evaluates the final habitat quality by considering impacts of threat factors that contribute to habitat degradation [8,16].
The influence of threat factors on habitat quality is related to their distance, defined by the “distance-decay” function, where influence decreases as distance between habitats and threat factors increases. The effect of threat factors is calculated based on their characteristics, classified as either linear (Equation (1)), where influence decreases at a constant rate, or exponential (Equation (2)), where influence decreases more rapidly with increased distance. Here, i r x y represents the impact of threat factor r from pixel y on pixel x, d x y represents the linear distance between pixels x and y, and d r   m a x represents the maximum impact distance of threat factor r.
i r x y = l d x y d r   m a x
i r x y = e x p ( ( 2.99 d r   m a x ) × d x r )
Based on this, the total threat level to the habitat is calculated by incorporating the relative influence (weight) and sensitivity of each threat factor (Equation (3)). In this equation, D x j represents the total threat level of pixel x classified as LULC j, i r x y represents the impact of threat factor r from pixel y on pixel x, β x represents the legal, institutional, social, or physical protection level of pixel x ( β x [ 1 ,   0 ] ), and S j r represents the sensitivity of land cover j to threat factor r. ( S j r [ 1 ,   0 ] ),
D x j = r = 1 R y = 1 Y r ( w r r = 1 R w r ) × r y × i r x y × β x × S j r
The final habitat quality, which reflects the calculated threat level, is determined using Equation (4). Here, H j represents the habitat quality of LULC without reflecting the threat levels, z is the scaling factor of 2.5, and k is the half-saturation constant of 0.5.
Q x j = H j × ( 1 ( D x j z D x j z + k z ) )
To perform this analysis, the maximum impact distance (Max_Distance) of the threat factors, their influence (weight), and the sensitivity of each habitat type to the threat factors must be defined. Baseline data from the Ministry of Environment’s LULC datasets were used. Based on the LULC of Namyangju City and Yongin City, identified threat factors include urban land, industrial land, railways, roads, and agricultural land. Specific values for maximum impact distance, weights, and sensitivities were assigned using data from the National Institute of Ecology, which has been developing ecosystem service (ES) indicators tailored to Korea’s characteristics since 2014. These indicators are considered suitable for the composite ecosystem evaluation of both cities. The maximum impact distances and weights of the threat factors are presented in Table 4, while sensitivities are outlined in Table 5.

4.1.2. InVEST Carbon

Carbon storage for regulating services was assessed using the InVEST Carbon model (KNPS-ES_v2.5, Korea National Park Research Institute). This model calculates carbon storage based on the carbon density of different land cover types within the study area. Carbon density varies depending on the storage location, including aboveground ( C A b o v e ), belowground ( C B e l o w ), soil carbon ( C S o i l ), and dead organic matter ( C D e a d ) [35]. The carbon density data utilized Korea’s Ministry of Environment LULC data and figures from the National Institute of Ecology (see Table 5). The carbon storage per unit area by land type is calculated using Equation (5), and the total carbon storage is calculated using Equation (6) [35]. In Equation (6), A i represents the area of each land type (Table 6).
C i = C A b o v e + C B e l o w + C S o i l + C D e a d
C T o t a l = C i × A i

4.1.3. Recreation and Ecotourism

Human activities directly influence land use and alter landscape patterns [8]. Therefore, in addition to InVEST model analysis, cultural services, specifically recreation and ecotourism, were evaluated by analyzing LULC data. The LULC data provided by Korea’s Ministry of Environment include a category for “Culture, Sports, and Recreation Facilities Land”, with specific classification criteria outlined in Table 7. All areas classified under this category were considered tourism resources. Municipalities with a higher ratio of tourism resource area to total administrative district area were considered to have higher cultural service values.

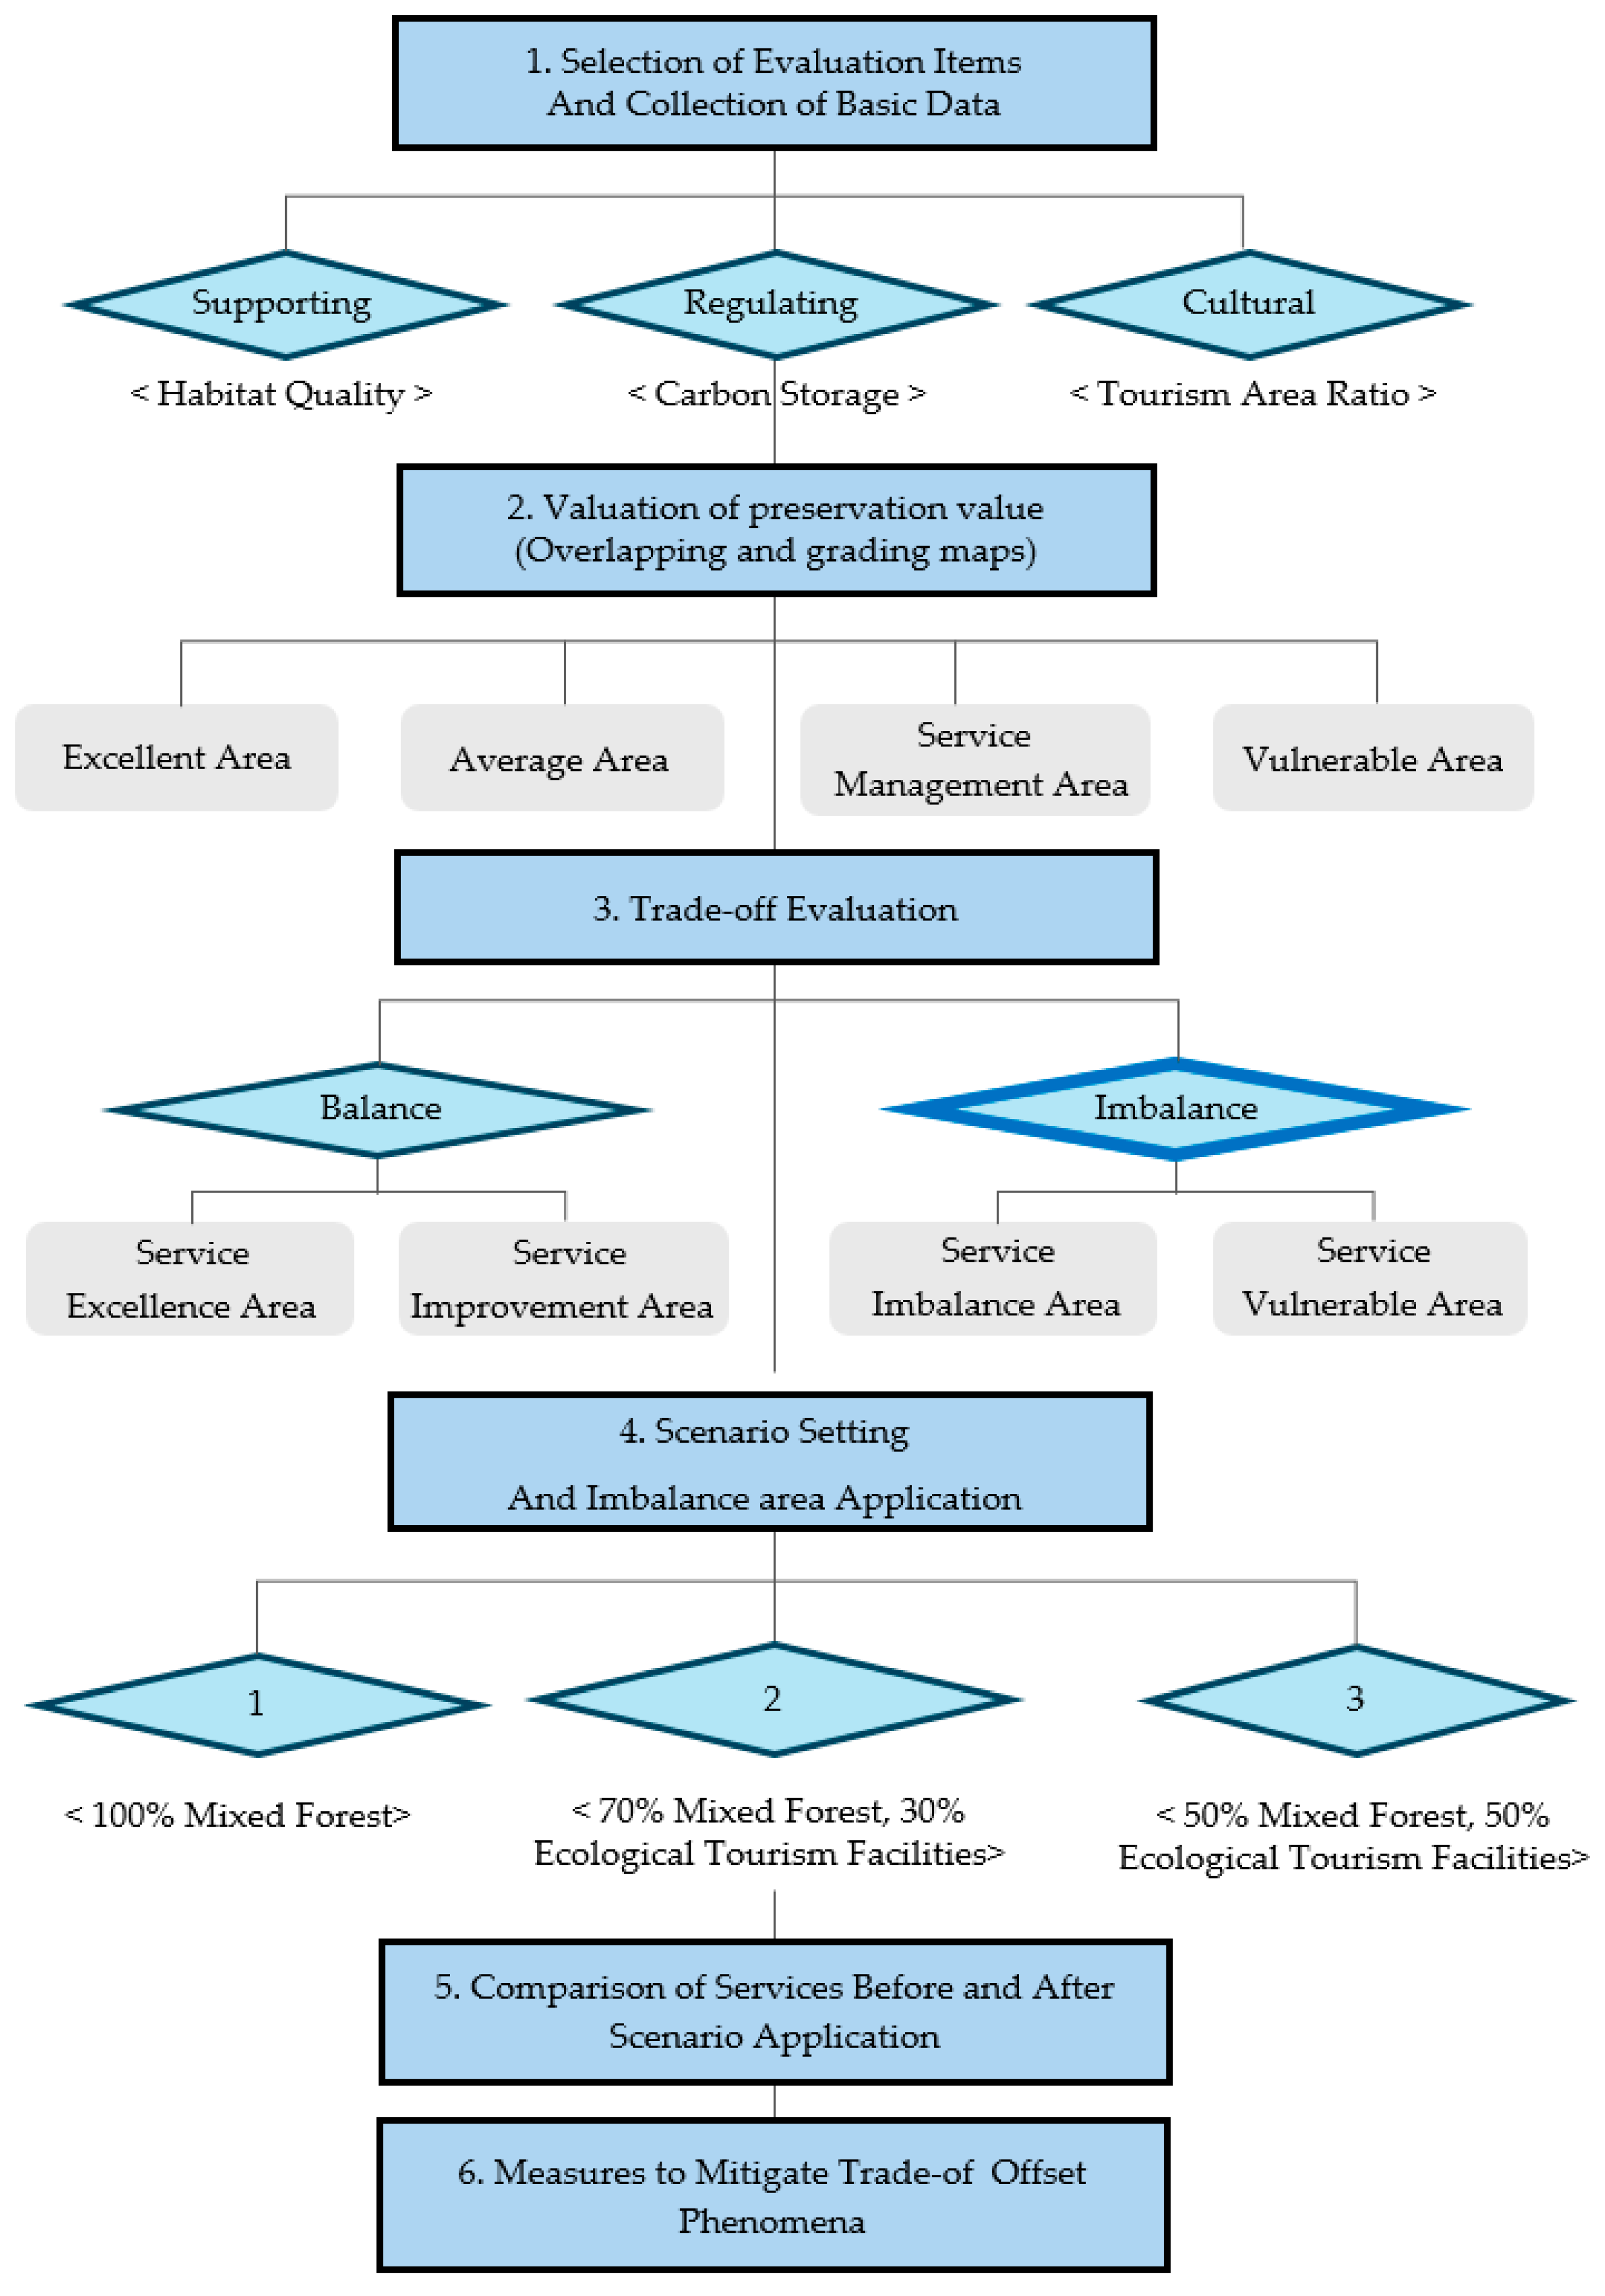
4.2. Research Procedures

The research procedures are outlined in Figure 2. First, evaluation items were selected that are applicable and representative in the water source management areas across by supporting, regulating, and cultural service, current status data were constructed. Supporting services were represented by habitat quality, regulating services by carbon storage, and cultural services by the tourism area ratio.
Second, conservation value evaluation was applied and mapped using the GIS. The ecosystem service evaluation score was graded after overlapping data for each evaluation item. According to these grades, areas were divided into four types—excellent area, average area, service management areas, and a vulnerable area—and expressed as a map.
Third, trade-off evaluation was conducted and mapped. Using the evaluation scores, the ecosystem service balance area and the imbalance area were identified according to the degree of offset and synergy occurring between services.
Fourth, three scenarios were developed based on the waterfront ecological belt project, which supports regulated areas in the water supply management area. The degree of change in evaluation results for each ecosystem service before and after scenario application was analyzed for areas with ecosystem service imbalances, which were deemed to be priority management. Finally, the research results were synthesized to analyze the causes of trade-off phenomenon in two local governments containing water source management areas in Korea, and to suggest improvement measures for creating synergies that mitigate offset effects between ecosystem services.

5. Results

5.1. Grading Results of Ecosystem Service Evaluation Items

5.1.1. Supporting Services (Habitat Quality)

For habitat quality evaluation, grading criteria were established as follows: Grade 1 (0.51–0.62), Grade 2 (0.41–0.50), Grade 3 (0.31–0.40), Grade 4 (0.21–0.30), and Grade 5 (0.05–0.20). Regions with habitat quality values closer to 1 were considered to possess excellent ES. In Namyangju City, habitat quality evaluation at the legal administrative district level revealed that Grade 1 regions included Joan-myeon, Sudong-myeon, Wabu-eup, Onam-eup, and Byeollae-myeon (five districts); Grade 2 regions included Hwado-eup, Hopyeong-dong, Pyeongnae-dong, Jinjeop-eup, and Byeollae-dong (five districts); Grade 3 regions included Jingeon-eup, Toegyewon-myeon, and Geumgok-dong (three districts); Grade 4 regions included Yangjeong-dong and Dasan 2-dong (two districts); and Grade 5 regions included Dasan 1-dong (one district).
In Yongin City, the habitat quality evaluation at the legal administrative district level showed that Grade 2 regions included Mohyeop-eup, Pogok-eup, Yangji-myeon, Dongbu-dong, Wonsam-myeon, Idong-eup, Dongcheon-dong, and Sinbong-dong (8 districts); Grade 3 regions included Baegam-myeon, Namsa-myeon, Seongbuk-dong, Sanghyeon 1-dong, Jukjeon 2-dong, Mabuk-dong, Guseong-dong, Dongbaek 1-dong, Dongbaek 2-dong, Yurim-dong, Yeoksam-dong, Jungang-dong, Sangha-dong, Bora-dong, Giheung-dong, and Yeongdeok 2-dong (16 districts); Grade 4 regions included Jukjeon 1-dong, Pungdeokcheon 1-dong, Bojeong-dong, Sanghyeon 2-dong, Singal-dong, Gugaldong, Dongbaek 3-dong, Yeongdeok 1-dong, and Sanggal-dong (9 districts); and Grade 5 regions included Pungdeokcheon 2-dong, Seonong-dong, Sanghyeon 1-dong, and Jukjeon 2-dong (4 districts). The grading results and scores based on supporting services by region are as follows (Figure 3).

5.1.2. Regulating Services (Carbon Storage)

For carbon storage evaluation, grading criteria were established as follows: Grade 1 (>98.57), Grade 2 (75.12–98.57), Grade 3 (51.67–75.12), Grade 4 (28.23–51.67), and Grade 5 (4.78–28.23). Regions with higher carbon storage values were considered to have excellent ES. In Namyangju City, the results of the carbon storage evaluation conducted at the legal administrative district level showed that Grade 1 regions included Joan-myeon, Sudong-myeon, Byeollae-myeon, Onam-eup, Wabu-eup, Hopyeong-dong, and Jinjeop-eup (five districts). Grade 2 regions included Hwado-eup, Hopyeong-dong, Pyeongnae-dong, Jinjeop-eup, and Byeollae-dong (five districts); Grade 3 regions included Jingeon-eup, Toegyewon-myeon, and Geumgok-dong (three districts); Grade 4 regions included Yangjeong-dong and Dasan 2-dong (two districts); and Grade 5 included Dasan 1-dong (one district). In Yongin City, the results of the carbon storage evaluation at the legal administrative district level showed that Grade 1 regions included Idong-eup, Yangji-myeon, Dongbu-dong, and Dongcheon-dong (four districts); and Grade 5 regions included Pungdeokcheon 2-dong, Sanghyeon 1-dong, and Jukjeon 2-dong (three districts). The grading results and scores based on regulating services by region are as follows (Figure 4).

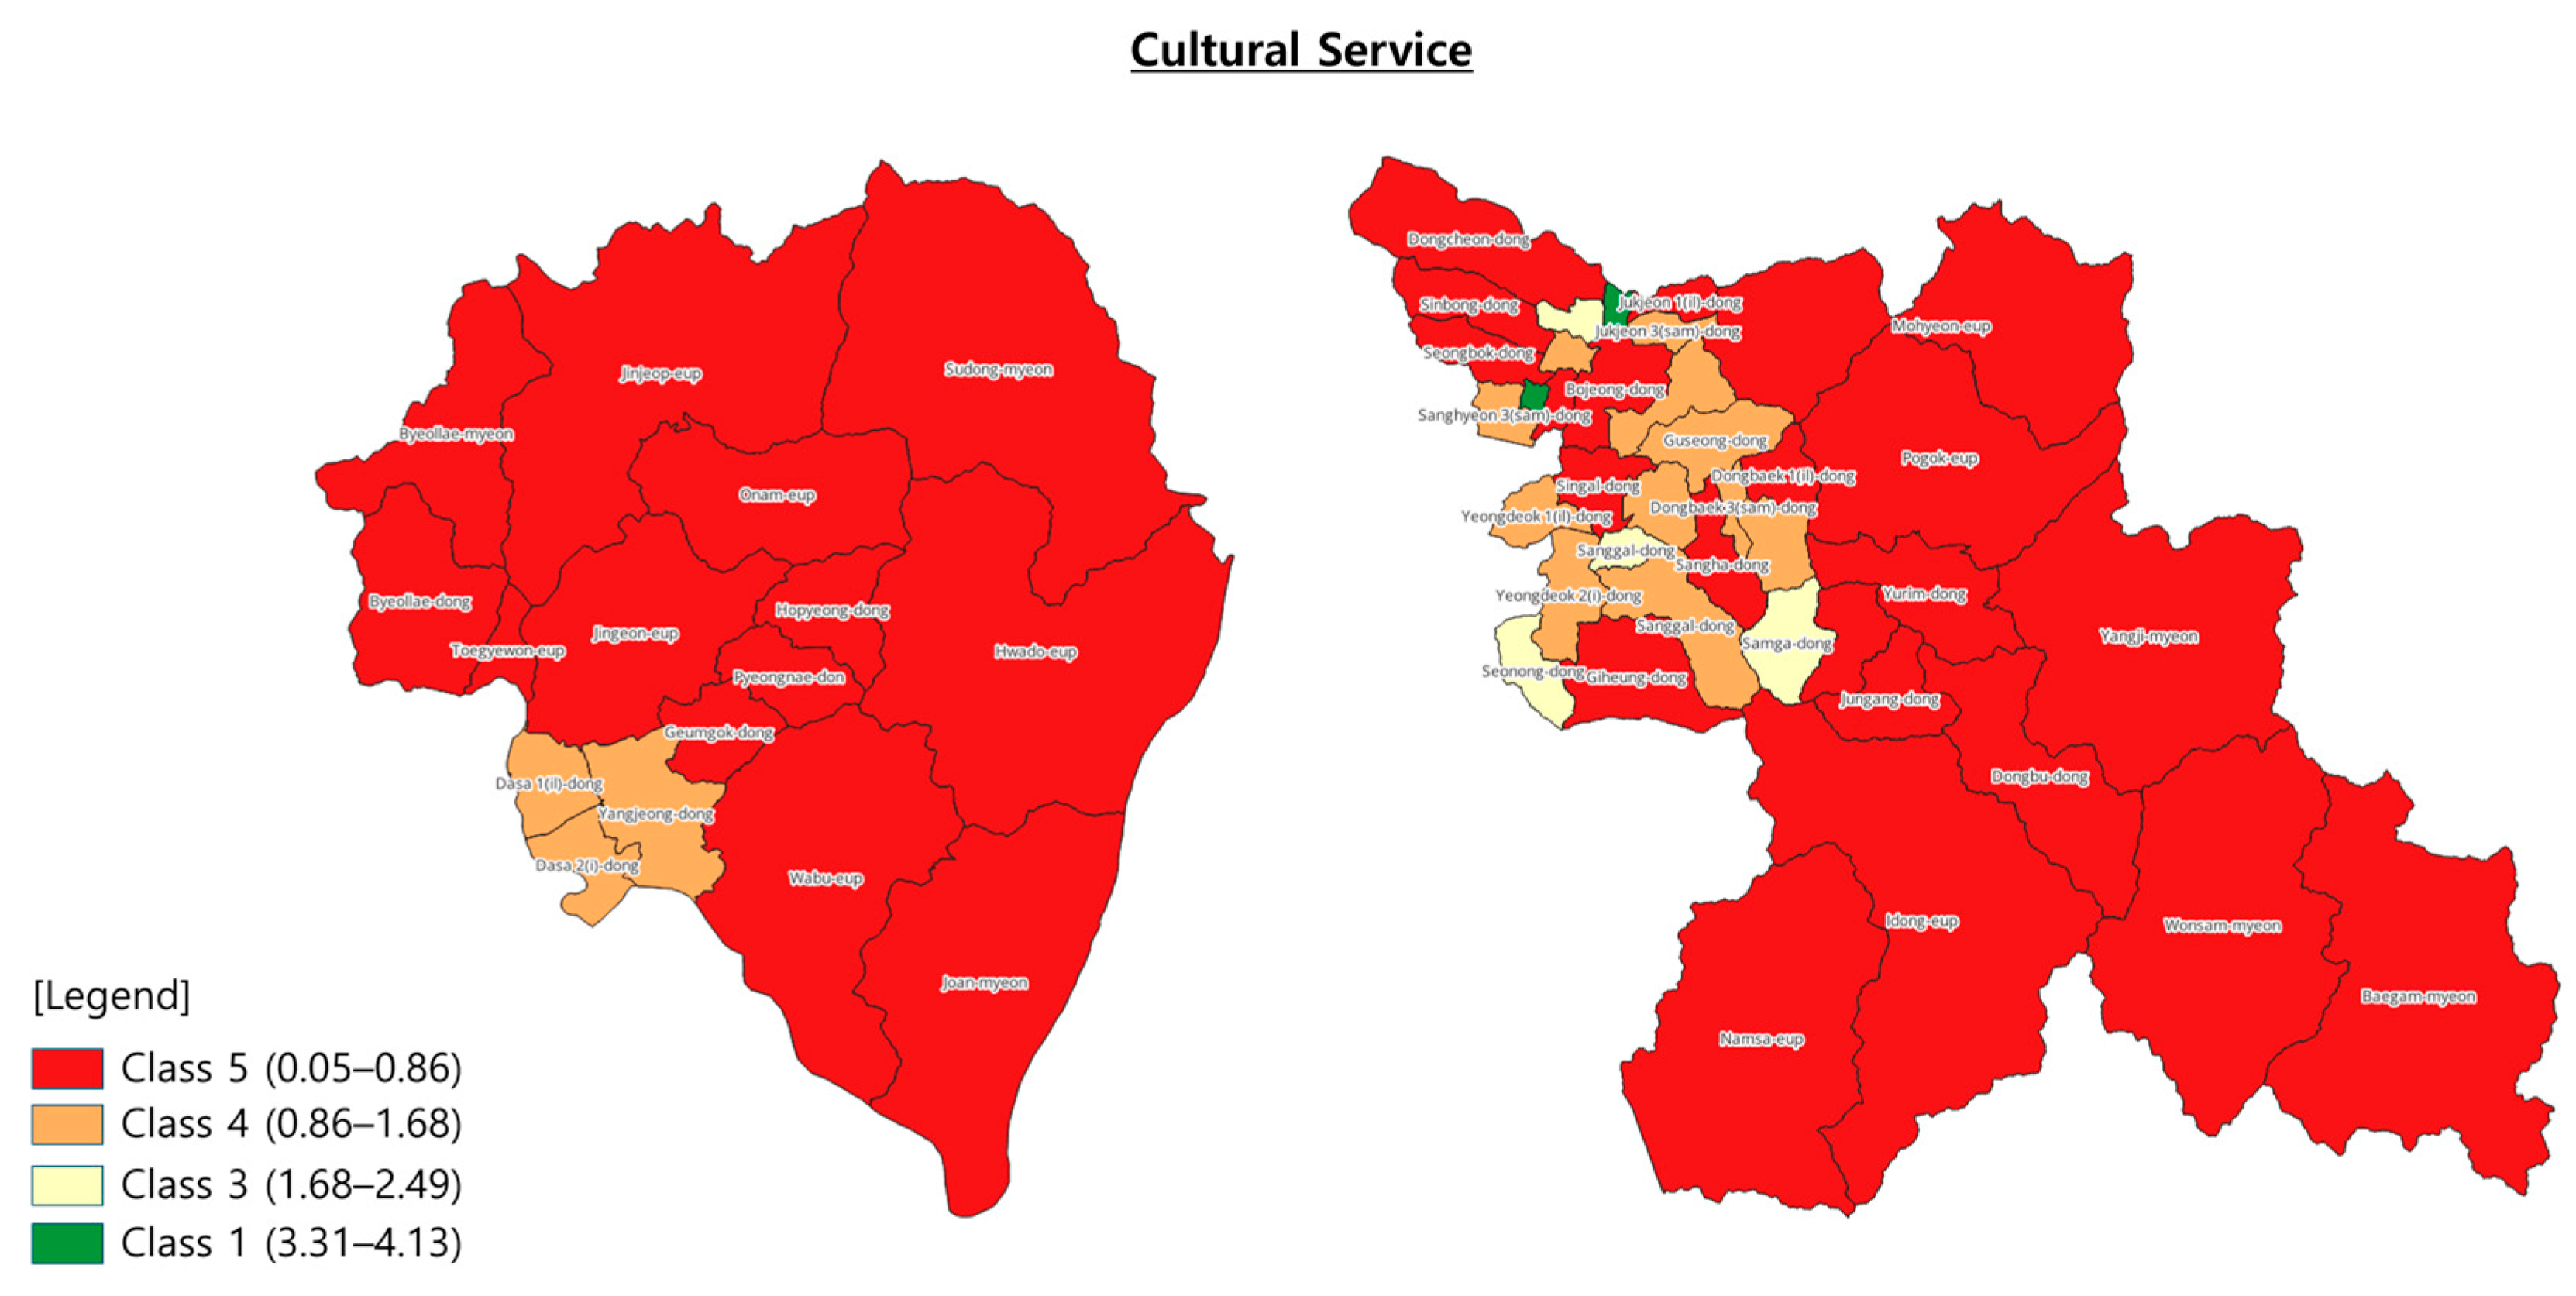
5.1.3. Cultural Services

For tourism area ratio, grading criteria were established as follows: Grade 1 (3.31–4.13), Grade 2 (2.49–3.31), Grade 3 (1.68–2.49), Grade 4 (0.86–1.68), and Grade 5 (0.04–0.86). Regions with a higher ratio of tourism area to administrative district area were considered to have excellent ES. In Namyangju City, only Grade 4 and Grade 5 regions were identified for cultural services. Grade 4 regions included Dasan 1-dong, Dasan 2-dong, and Yangjeong-dong (three districts). In Yongin City, Grade 1 regions included Jukjeon 2-dong; Grade 2 regions included Sanghyeon 1-dong; and Grade 3 regions included Seonong-dong, Sanggal-dong, Pungdeokcheon 1-dong, and Samga-dong (four districts). All other regions were classified as Grade 4 or Grade 5 (Figure 5).

5.2. Results of Ecosystem Service Conservation Value Assessment

5.2.1. Conservation Value Assessment Criteria

The ES evaluation results were overlaid on maps to calculate composite scores and classify regions into four categories. Composite scores ranged from 3 to 15 points, with classification as excellent areas those having 3–6 points, those scoring 7–9 points as average, service management areas as 10–12 points, and vulnerable areas as 13–15 points [11]. These classifications were mapped at the legal administrative district level, with particularly focus on regions classified as vulnerable and those overlapping with regulated areas (Figure 6) (Table 8).

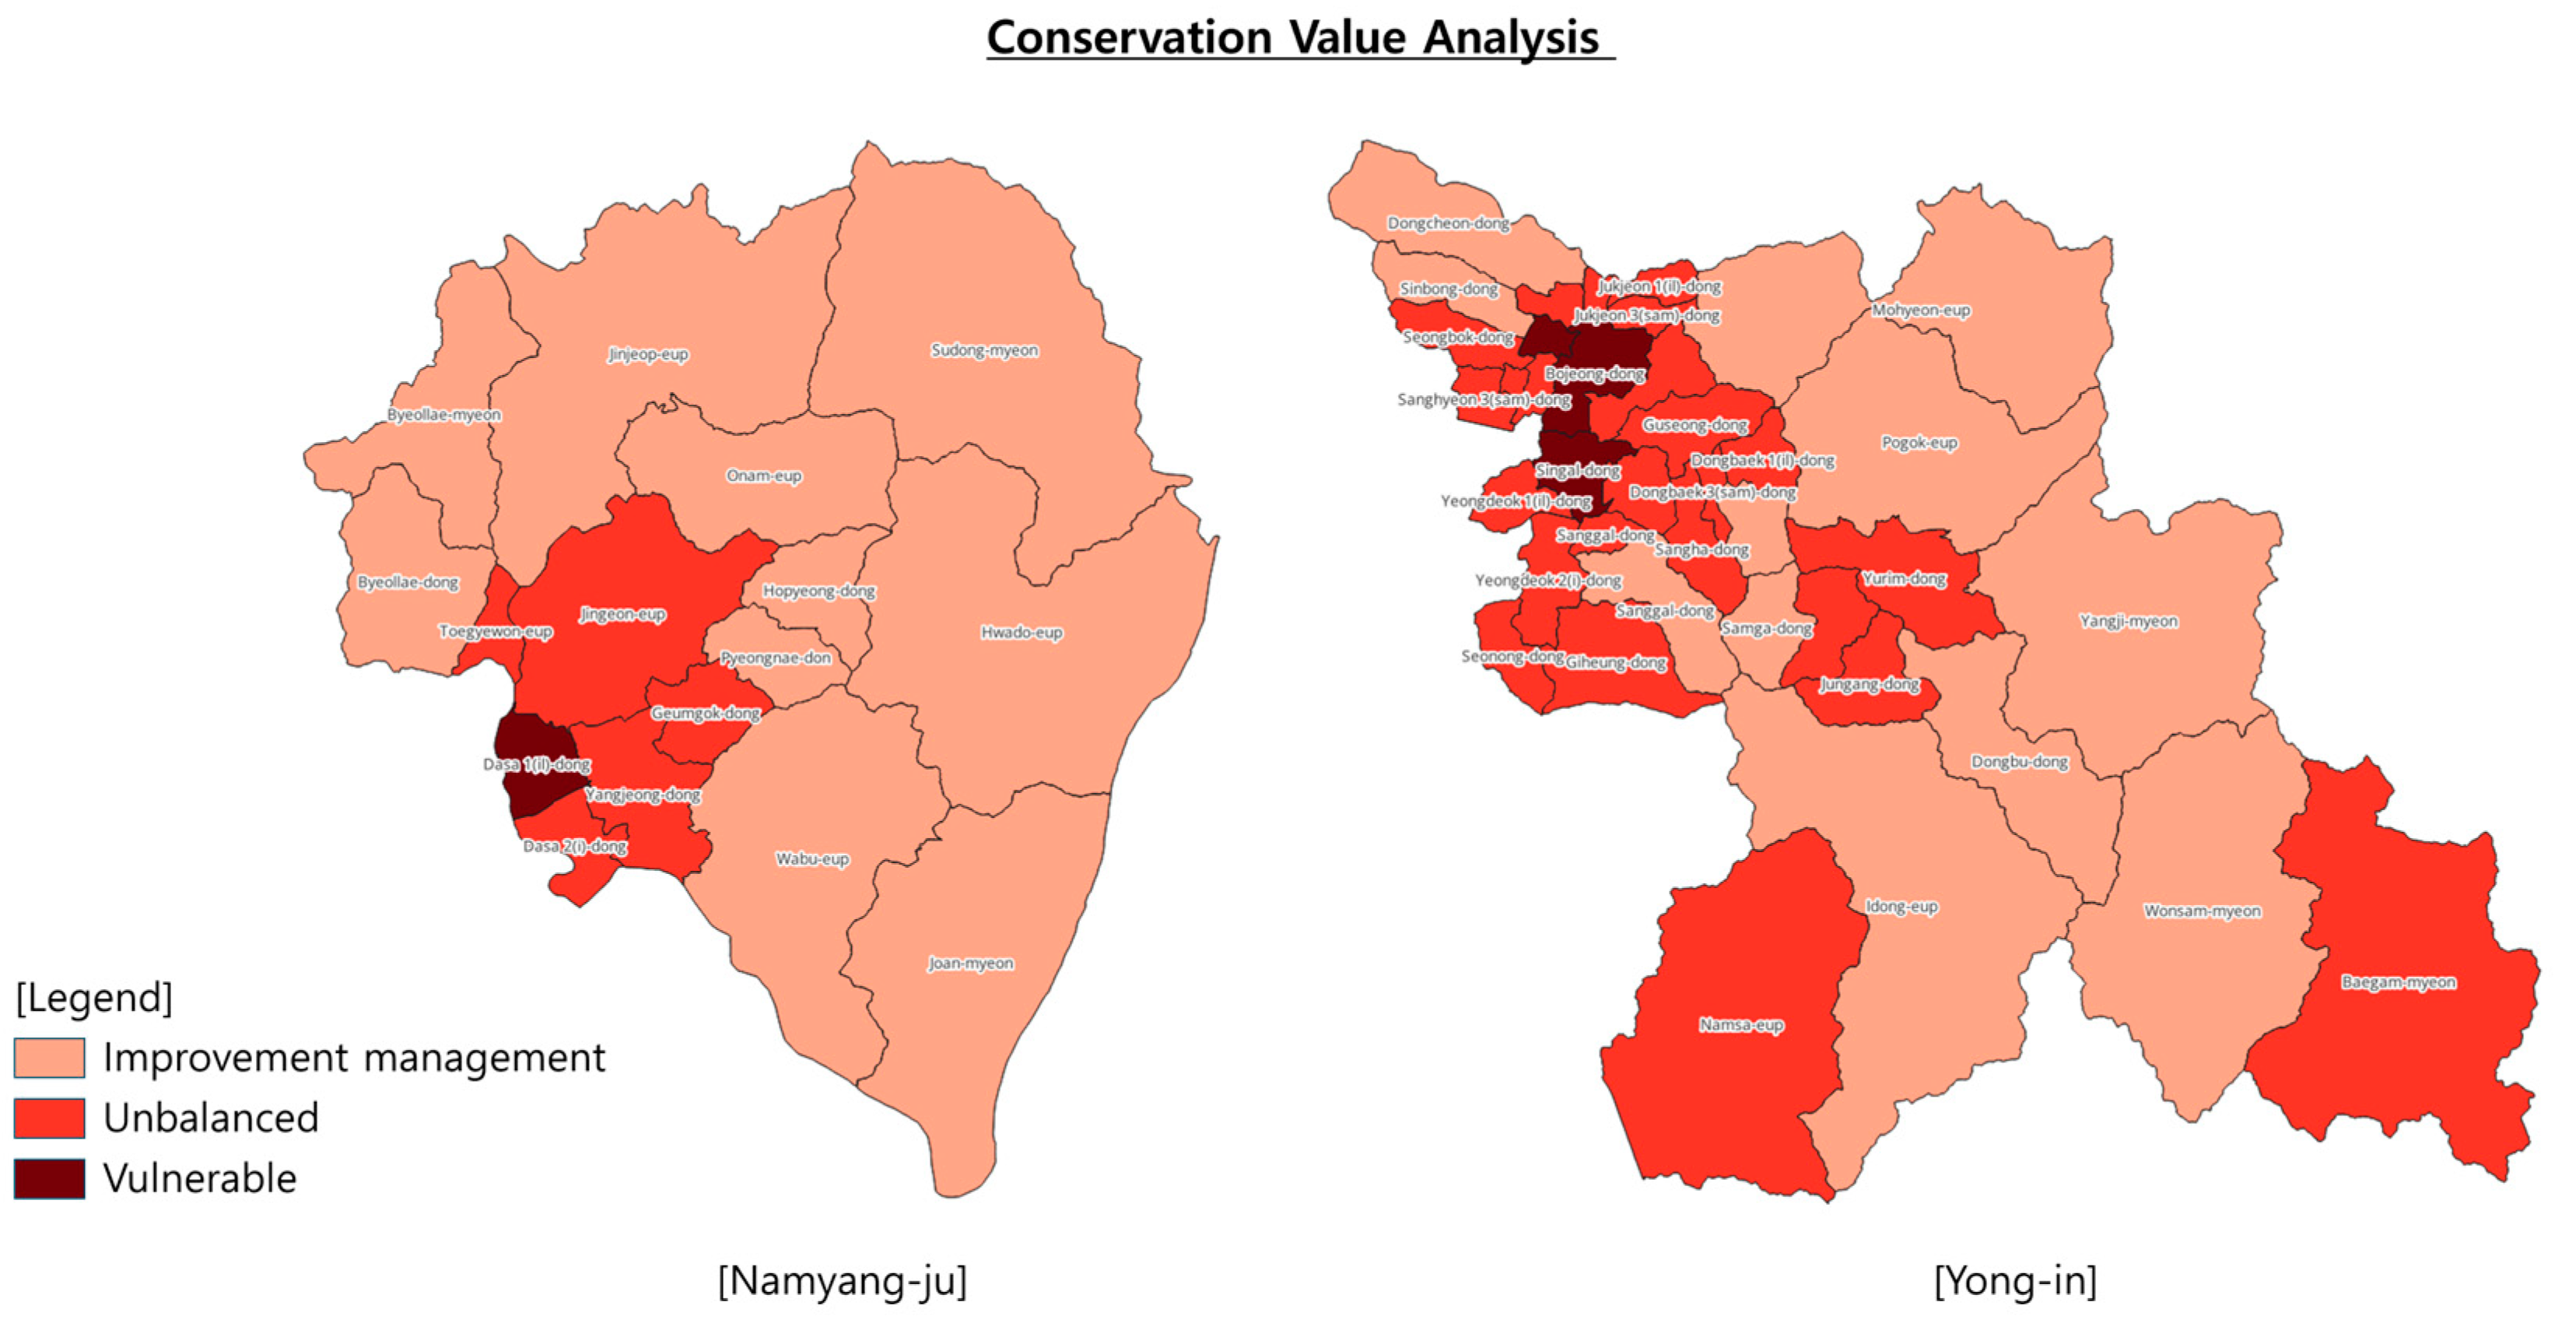
5.2.2. Results of Conservation Value Mapping

In Namyangju City, the conservation value assessment results showed that among 16 administrative districts, two were identified as vulnerable areas, nine as service management areas, and five as average areas. The vulnerable areas—Dasan 1-dong and Dasan 2-dong—had composite scores of 12–14 points. These areas exhibited low scores of Grades 4 or 5 in supporting and regulating services and Grade 4 in cultural services. In water source protection areas overlapping with regulated zones, such as Joan-myeon, Sudong-myeon, and Hwado-eup, conservation value assessment grades ranged from seven to nine points, classifying them as average areas based on the conservation value assessment criteria (Table 9).
In Yongin City, the conservation value assessment results showed that of the 38 administrative districts, 3 were vulnerable areas, 25 were service management areas, and 10 were average areas. Among regions overlapping with water source protection zones, seven were regulated areas, including four management areas and three average areas (Table 10).
This study aimed to evaluate the ES values of regions classified as vulnerable or regulated within water source protection zones, based on results of conservation value assessments, and to propose improvement measures for enhancing these values. However, conservation value assessment results alone may not provide.
While conservation value assessments provide insights into regions with high or low ES values, they may not fully capture the dynamic relationships between different services. Therefore, a trade-off evaluation was conducted to analyze trade-off phenomena among the evaluation items and identify regions with ES imbalances.

5.3. Trade-Off Evaluation

5.3.1. Trade-Off Evaluation Criteria

The criteria for analyzing trade-off phenomena were established based on the differences in ES evaluation scores. Regions were classified into four subcategories within two major categories (Table 11):

5.3.2. Results of Trade-Off Mapping

Trade-offs were analyzed based on conservation value assessment results, and the types of trade-off phenomena were classified and mapped (Figure 7). In Namyangju, regions evaluated as vulnerable in the conservation value assessment (Dasan 1-dong and Dasan 2-dong), and regulated areas (Joan-myeon, Sudong-myeon, and Hwado-eup (evaluated as average), were all identified as ES imbalance areas. A notable characteristic in Namyangju’s regulated areas was that supporting and regulating services scored high, while cultural service scores were lower, leading to intensified trade-offs. These regions, characterized by high habitat quality and carbon storage but low cultural services, would benefit from targeted improvements like establishing ecological education centers and implementing ecological programs.
Vulnerable regions like Dasan 1-dong and Dasan 2-dong, exhibited low grades across all services due to high proportions of residential areas resulting from urban development. These areas require comprehensive enhancement of habitat quality, carbon storage, and tourism areas ratio. Planting mixed forests in multilayer structures near existing green spaces could enhance ecological diversity and increase carbon storage.
In Yongin, regions evaluated as vulnerable (Bojeong-dong, Singal-dong, and Pungdeokcheon 2-dong), regulated areas, (Idong-eup, Mohyeon-eup, Dongbu-dong evaluated as average), Namsa-eup, Yeokbuk-dong, Yurim-dong, and Jungang-dong evaluated as management), were all identified as ES imbalance areas. A notable finding was that imbalanced regions included not only vulnerable areas but also those classified as average and management areas according to the composite score results. This highlights the need for detailed analysis of individual ES item scores to develop specific plans for reducing trade-off phenomena and enhancing synergies.

5.4. Comparison of Ecosystem Service Evaluation Results Before and After Scenario Application

Three scenarios were developed based on Korea’s riparian ecological belt project, a key initiative within water source protection areas. This project involves acquiring land within protection areas and planting trees to enhance carbon storage, water purification, and habitat quality. Large-scale riparian ecological belts may also include facilities and ecological experience learning centers. The scenarios were defined as: (1) change target area codes to 100% mixed forest; (2) change target area codes to 70% mixed forest and 30% recreation and ecotourism; (3) change target area codes to 50% mixed forest and 50% recreation and ecotourism. The details are provided in Table 12.
Scenario implementation involved modifying specific LULC codes to recalculate habitat quality, carbon storage, and recreation and ecotourism according to each scenario’s proportions. Target areas for code changes were determined according to the Basic Plan for Riparian Zone Management of the Geum River Basin [12], using non-point pollution sources for BOD, T-N, and T-P load analysis. These target areas included various land use types such as Paddy Field (Leveled), Paddy Field (Unleveled), Upland Field (Leveled), Upland Field (Unleveled), Orchard, Single-Family Residential Area, Multi-Family Residential Area, Industrial Facility, Airport, Port, Railway, Road, Other Transportation and Communication Facilities, Commercial and Business Facilities, and Mixed-Use Area. Code conversion was performed using the “Case when” statement in QGIS 3.34.
The scope of scenario application focused on regions identified as having ES imbalances, particularly vulnerable and regulated areas. By comparing ES evaluation results before and after applying the scenarios, recommendations were made for appropriate proportions of riparian green spaces, ecotourism areas, and ecological experience facilities to mitigate trade-off effects and enhance synergies.

5.4.1. Results After Scenario Application—Namyangju

For vulnerable areas in Namyangju (Dasan 1-dong and Dasan 2-dong) all values for habitat quality, carbon storage, and the tourism area ratio increased after applying Scenario 2. This suggests that this scenario could improve synergies among services. The recommendation is to plant 70% of non-point pollution source areas with mixed forests and establish eco-friendly experience facilities in up to 30% of the area. For regulated areas, Scenario 3 should be applied to Joan-myeon and Sudong-myeon, while Scenario 1 should be implemented in Hwado-eup to enhance ES synergies (Table 13).

5.4.2. Results After Scenario Application—Yongin

In Yongin, the application of different scenarios yielded varied outcomes across vulnerable and regulated. In vulnerable regions such as Bojeong-dong, Singal-dong, and Pungdeokcheon 2-dong, Scenario 2 (70% mixed forest/30% tourism facilities) resulted in increased values for habitat quality, carbon storage, and tourism area ratio, enhancing synergies among ecosystem services. Conversely, Scenario 3 (50%/50% distribution) demonstrated a decreasing trend in supporting and regulating services evaluation values. For regulated areas such as Idong-eup, Scenario 3 proved optimal for enhancing ES synergies, while Scenario 2 was more appropriate for other regulated areas to achieve similar improvements (Table 14).

6. Conclusions and Limitations

This study conducted a comprehensive trade-off analysis of ecosystem services for two municipalities in Korea (Namyangju and Yongin) containing regulated areas within water source protection zones. We established scenarios designed to enhance synergies for offsetting trade-off phenomena, proposing specific proportions for riparian green spaces (mixed forests) and ecological tourism facilities based on existing land cover patterns.
Our key findings are as follows: First, the evaluation of ES in water source protection areas focused on three major service categories: supporting, regulating, and cultural services, with representative subcategories identified for each. Supporting services were evaluated based on habitat quality, regulating services based on carbon storage, and cultural services on the ratio of tourism area to administrative district area. Using GIS tools, we graded these evaluation items and mapped ES distributions. We then categorized regions into four types—excellent, average, service management, and vulnerable areas—based on composite ES evaluation scores. In Namyangju, of the sixteen administrative districts, two were classified as vulnerable areas, and three regulated areas were identified as average areas. In Yongin, among thirty-eight administrative districts, three were classified as vulnerable areas, while seven regulated areas comprised three average areas and four management areas. To develop targeted enhancement plans, we analyzed trade-off relationships and classified regions into balanced and imbalanced areas.
To enhance synergies in ES imbalance areas, we developed three scenarios with varying proportion of mixed forest planting and the integration of ecological tourism and recreational facilities. These scenarios were systematically applied to vulnerable and regulated areas in both municipalities. We considered synergies to have improved when all ES evaluation metrics showed positive changes after the scenario application. Our results demonstrate that optimal proportions of mixed forest planting and ecological tourism facility introduction vary significantly depending on the trade-off type and specific land cover characteristics of each region, as determined by the ES evaluation scores.
This study has several limitations. First, we selected only three representative evaluation metrics applicable to water source protection areas based on prior research, excluding a broader range of potential evaluation criteria. However, this research serves as a foundational framework, and the ES evaluation procedures proposed here can be expanded to include diverse evaluation metrics in future studies.
Second, due to data constraints, we limited our investigation of two local governments within Korea’s water source management areas. Future research should apply the trade-off analysis methodology proposed in this study to various domestic and international cases to further validate and refine the through additional verification procedures.
The methodology proposed in this study offers several advantages. Notably, it introduces a trade-off analysis evaluation framework that improves the limitations of conventional GIS-based preservation value assessments. Through our step-by-step analysis procedure, it becomes possible to identify target areas requiring scenario application and present appropriate interventions. By presenting structured research procedures and evaluation criteria for each step, our methodology enables sequential ecosystem services evaluation. Conversely, the proposed trade-off research methodology comprises five stages, making the scenario analysis somewhat time intensive. Additionally, the methodologies employed at each require specialized skills such as InVest model and GIS expertise, along with statistical data from trusted institutions for robust ecosystem service analysis. These limitations could be addressed in future research by developing a simplified trade-off analysis methodology.
This study distinguishes itself by presenting a procedure for evaluating and mapping ES that accounts for trade-off relationships at the administrative district level. The conservation value assessment criteria and trade-off classification standards proposed in this study offer valuable tools for future ES research and planning efforts. While previous studies on ES using conservation value assessments have effectively identified areas with high or low ES values, they lacked the ability to address the trade-off between specific ecosystem services. Therefore, for targeted ES planning, the analytical procedures outlined in this study provide a crucial framework for assessing trade-off phenomena among ecosystem service evaluation components.

Author Contributions

Conceptualization, H.R.; methodology, H.R. and J.C.; software, J.P.; formal analysis, H.R. and J.P.; investigation, H.R and J.P.; writing—original draft preparation, H.R; writing—review and editing, H.R., J.P., and J.C.; visualization, H.R and J.P. All authors have read and agreed to the published version of the manuscript.

Funding

This work was supported by Korea Environmental Industry and Technology Institute through Wetland Ecosystem Value Evaluation and Carbon Absorption Value Promotion Technology Development Project, funded by Korea Ministry of Environment (MOE) (2022003630001).

Institutional Review Board Statement

Not applicable.

Informed Consent Statement

Not applicable.

Data Availability Statement

The original contributions presented in the study are included in the article; further inquiries can be directed to the corresponding author.

Acknowledgments

The authors would like to thank the anonymous reviewers for their valuable comments.

Conflicts of Interest

Authors Heeyoung Roh and Jinsil Park were employed by the company NEXUS Ecological Design Group. The remaining author declares that the research was conducted in the absence of any commercial or financial relationships that could be construed as a potential conflict of interest.

References

  1. Reid, W.V.; Mooney, H.A.; Cropper, A.; Capistrano, D.; Carpenter, S.R.; Chopra, K.; Dasgupta, P.; Dietz, T.; Duraiappah, A.K.; Hassan, R.; et al. Ecosystems and Human Well-Being-Synthesis: A Report of the Millennium Ecosystem Assessment; Island Press: Washington, DC, USA, 2005. [Google Scholar]
  2. Costanza, R.; De Groot, R.; Sutton, P.; Van der Ploeg, S.; Anderson, S.J.; Kubiszewski, I.; Farber, S.; Turner, R.K. Changes in the global value of ecosystem services. Glob. Environ. Change 2014, 26, 152–158. [Google Scholar] [CrossRef]
  3. De Groot, R.S.; Alkemade, R.; Braat, L.; Hein, L.; Willemen, L. Challenges in integrating the concept of ecosystem services and values in landscape planning, management and decision making. Ecol. Complex. 2010, 7, 260–272. [Google Scholar] [CrossRef]
  4. Joo, W.Y.; Kwon, H.S.; Jang, I.Y.; Bae, H.J.; Jung, P.M.; Bang, E.J.; Kim, J.I.; Kim, M.H.; Kim, M.Y.; Park, E.; et al. Establishment of Ecosystem Services Assessment Framework at National Level; National Institute of Korea: Seochun, Republic of Korea, 2017. [Google Scholar]
  5. Maes, J.; Egoh, B.; Willemen, L.; Liquete, C.; Vihervaara, P.; Schägner, J.P.; Grizzetti, B.; Drakou, E.G.; La Notte, A.; Zulian, G.; et al. Mapping ecosystem services for policy support and decision making in the European Union. Ecosyst. Serv. 2012, 1, 31–39. [Google Scholar] [CrossRef]
  6. Pickard, B.R.; Daniel, J.; Mehaffey, M.; Jackson, L.E.; Neale, A. EnviroAtlas: A new geospatial tool to foster ecosystem services science and resource management. Ecosyst. Serv. 2015, 14, 45–55. [Google Scholar] [CrossRef]
  7. Yi, H.; Güneralp, B.; Kreuter, U.P.; Güneralp, İ.; Filippi, A.M. Spatial and temporal changes in biodiversity and ecosystem services in the San Antonio River Basin, Texas, from 1984 to 2010. Sci. Total Environ. 2018, 619, 1259–1271. [Google Scholar] [CrossRef]
  8. Xu, L.; Chen, S.S.; Xu, Y.; Li, G.; Su, W. Impacts of land-use change on habitat quality during 1985–2015 in the Taihu Lake Basin. Sustainability 2019, 11, 3513. [Google Scholar] [CrossRef]
  9. Yi, H. Ecosystem services valuation and research methodology for mapping ecosystem services: Concepts, trends, issues, and applications. J. Korean Geogr. Soc. 2022, 57, 189–208. [Google Scholar]
  10. Jang, J.E.; Kwon, H.Y.; Shin, H.S.; Lee, S.C.; Yu, B.H.; Jang, J.; Choi, S.H. Habitat Quality Analysis and Evaluation of InVEST Model Using QGIS-Conducted in 21 National Parks of Korea. Korean J. Environ. Ecol. 2022, 36, 102–111. [Google Scholar] [CrossRef]
  11. Ministry of Environment. A Basic Plan for the Management of the Second Waterfront Area of the Yeongsangang—Seamjin River Water System; Ministry of Environment: Sejong-si, Republic of Korea, 2013. [Google Scholar]
  12. Geumgang River Basin Environmental Office. Study on the Establishment of the 4th Basic Plan for Riparian Zone Management in the Geumgang River Basin; Geumgang River Basin Environmental Office: Jeonju-si, Republic of Korea, 2018. [Google Scholar]
  13. Ministry of Environment of Korea. Fifth National Biodiversity Strategy (2024~2028); Ministry of Environment of Korea: Seoul, Republic of Korea, 2023. [Google Scholar]
  14. Jung, P.M.; Cheon, G.S.; Kim, J.S.; Kwon, H. Identify Influencing Factors through Time Series Analysis of Water Supply and Demand in the Han River Watershed Area. Landsc. Geogr. 2023, 33, 13–27. [Google Scholar]
  15. Koun, H.J. Improved Water Institutional System to Secure Efficient Management and Water Quality in Paldang Basin. Legis. Policy 2013, 5, 149–169. [Google Scholar]
  16. Kwon, H.; Lee, Y.; Chun, G.; Jung, D. Ecosystem Services Assessment Mapping Manual; National Institute of Ecology: Seocheon, Republic of Korea, 2022. [Google Scholar]
  17. Layke, C.; Mapendembe, A.; Brown, C.; Walpole, M.; Winn, J. Indicators from the global and sub-global Millennium Ecosystem Assessments: An analysis and next steps. Ecol. Indic. 2012, 17, 77–87. [Google Scholar] [CrossRef]
  18. Walpole, M.; Almond, R.E.; Besançon, C.; Butchart, S.H.; Campbell-Lendrum, D.; Carr, G.M.; Collen, B.; Collette, L.; Davidson, N.C.; Dulloo, E.; et al. Tracking progress toward the 2010 biodiversity target and beyond. Science 2009, 325, 1503–1504. [Google Scholar] [CrossRef] [PubMed]
  19. Mace, G.M.; Baillie, J.E. The 2010 biodiversity indicators: Challenges for science and policy. Conserv. Biol. 2007, 21, 1406–1413. [Google Scholar] [CrossRef] [PubMed]
  20. Korea National Park Research Institute. 2023 Study on Ecosystem Services Valuation of National Parks: Focusing on 21 National Parks; Korea National Park Research Institute: Gangwon-do, Republic of Korea, 2023. [Google Scholar]
  21. Nelson, E.; Mendoza, G.; Regetz, J.; Polasky, S.; Tallis, H.; Cameron, D.; Chan, K.M.; Daily, G.C.; Goldstein, J.; Kareiva, P.M.; et al. Modeling multiple ecosystem services, biodiversity conservation, commodity production, and tradeoffs at landscape scales. Front. Ecol. Environ. 2009, 7, 4–11. [Google Scholar] [CrossRef]
  22. Schimel, D.; Melillo, J.; Tian, H.; McGuire, A.D.; Kicklighter, D.; Kittel, T.; Rosenbloom, N.; Running, S.; Thornton, P.; Ojima, D.; et al. Contribution of increasing CO2 and climate to carbon storage by ecosystems in the United States. Science 2000, 287, 2004–2006. [Google Scholar] [CrossRef]
  23. The Millennium Development Goals Report; United Nations: New York, NY, USA, 2005.
  24. Polasky, S.; Nelson, E.; Pennington, D.; Johnson, K.A. The impact of land-use change on ecosystem services, biodiversity and returns to landowners: A case study in the state of Minnesota. Environ. Resour. Econ. 2011, 48, 219–242. [Google Scholar] [CrossRef]
  25. Cochard, R. Natural hazards mitigation services of carbon-rich ecosystems. In Ecosystem Services and Carbon Sequestration in the Biosphere; Springer: Dordrecht, The Netherlands, 2013; pp. 221–293. [Google Scholar]
  26. Bagstad, K.J.; Semmens, D.J.; Waage, S.; Winthrop, R. A comparative assessment of decision-support tools for ecosystem services quantification and valuation. Ecosyst. Serv. 2013, 5, 27–39. [Google Scholar] [CrossRef]
  27. Neugarten, R.A.; Langhammer, P.F.; Osipova, E.; Bagstad, K.J.; Bhagabati, N.; Butchart, S.H.; Dudley, N.; Elliott, V.; Gerber, L.R.; Arrellano, C.G.; et al. Tools for Measuring, Modelling, and Valuing Ecosystem Services; International Union for Conservation of Nature: Gland, Switzerland, 2018. [Google Scholar]
  28. Isely, E.S.; Isely, P.; Seedang, S.; Mulder, K.; Thompson, K.; Steinman, A.D. Addressing the Information Gaps Associated with Valuing Green Infrastructure in West Michigan: Integrated Valuation of Ecosystem Services Tool (INVEST). J. Great Lakes Res. 2010, 36, 448–457. [Google Scholar] [CrossRef]
  29. Ament, J.M.; Moore, C.A.; Herbst, M.; Cumming, G.S. Cultural ecosystem services in protected areas: Understanding bundles, trade-offs, and synergies. Conserv. Lett. 2017, 10, 440–450. [Google Scholar] [CrossRef]
  30. Dade, M.C.; Mitchell, M.G.; McAlpine, C.A.; Rhodes, J.R. Assessing ecosystem service trade-offs and synergies: The need for a more mechanistic approach. Ambio 2019, 48, 1116–1128. [Google Scholar] [CrossRef]
  31. Turner, K.G.; Odgaard, M.V.; Bøcher, P.K.; Dalgaard, T.; Svenning, J.C. Bundling ecosystem services in Denmark: Trade-offs and synergies in a cultural landscape. Landsc. Urban Plan. 2014, 125, 89–104. [Google Scholar] [CrossRef]
  32. Yang, S.; Zhao, W.; Liu, Y.; Wang, S.; Wang, J.; Zhai, R. Influence of land use change on the ecosystem serice trade-offs in the ecological restoration area: Dynamics and scenarios in the Yanhe watershed, China. Sci. Total Environ. 2018, 644, 556–566. [Google Scholar] [CrossRef] [PubMed]
  33. Park, Y.S.; Song, Y.K. Trade-off Analysis Between National Ecosystem Services Due to Long-term Land Cover Changes. Korean J. Environ. Ecol. 2024, 38, 204–216. [Google Scholar] [CrossRef]
  34. Kim, D.H.; Jung, J.C. The Evaluation of Land Use Regulation Policy in Water Conservation Zone: Focused on the Case of Hanam City. Korea Local Adm. Rev. 2011, 25, 383–402. [Google Scholar]
  35. Hwang, J.H.; Jang, R.I.; Jeon, S.W. A Study on the Estimation Method of Carbon Storage Using Environmental Spatial Information and InVEST Carbon Model: Focusing on Sejong Special Self-Governing City-Using Ecological and Natural Map. Environmental Conservation Value Assessment Map, and Urban Ecological Map-. J. Korea Soc. Environ. Restor. Technol. 2022, 25, 15–27. [Google Scholar]
Figure 1. Map of the Han River study area.
Sustainability 17 03788 g001
Figure 2. Research process diagram.
Sustainability 17 03788 g002
Figure 3. Evaluation of supporting services in Yongin and Namyangju.
Sustainability 17 03788 g003
Figure 4. Evaluation of regulating services in Yongin and Namyangju.
Sustainability 17 03788 g004
Figure 5. Evaluation of cultural services in Yongin and Namyangju.
Sustainability 17 03788 g005
Figure 6. Results of overlapping evaluation.
Sustainability 17 03788 g006
Figure 7. Results of Trade-off evaluation.
Sustainability 17 03788 g007
Table 1. Number of literature reviews on ES in Korea according to ecosystem type.
Ecosystem CategoryNumber of StudiesRatio of Literature (%)
Agricultural509.52
Agricultural, Urban10.19
Agricultural, River50.95
Agricultural, Coastal10.19
Other122.29
Freshwater8716.57
Freshwater, River366.86
Freshwater, River, Marine10.19
Urban499.33
Urban, Freshwater50.95
Forest12223.24
Forest, Urban81.52
Forest, Coastal112.10
Forest, Coastal, River10.19
Forest, Marine30.57
River173.24
Grassland81.52
Coastal489.14
Coastal, Marine244.57
Coastal, Freshwater, Marine20.38
Coastal, Freshwater, River10.19
Coastal, Coastal101.90
Marine234.38
Total525100.00
Table 2. The literature review classification of ES evaluation indicators.
Service CategoryES Evaluation IndicatorsLiterature
Supporting
service
Soil formation, Photosynthesis, Primary production, Nutrient cycling, Water cycling[23]
Nutrient cycling, Primary production [17]
Nutrient cycling, Soil Formation,
Primary production, Habitat
[4]
soil conservation, biodiversity conservation[21]
Habitat quality[24]
Regulating
service
Air quality, Climate regulation, Water regulation, Erosion regulation, Water purification and waste treatment, Disease regulation, Pest regulation, Pollination, Natural hazard regulation [23]
Air quality, Climate regulation [17]
Air quality, Greenhouse gas regulation, Water regulation, Natural hazard regulation, Erosion regulation [4]
hydrological services (water quality and storm peak mitigation), carbon sequestration [21]
carbon storage[24]
carbon storage[22,25]
Cultural
service
Spiritual and religious values, Knowledge systems, Educational values, Aesthetic values, Social relations, Sense of place, Cultural heritage values, Recreation and ecotourism [23]
Aesthetic [17]
Recreation and ecotourism, Landscape aesthetics, Educational, Heritage [4]
Urban Development[21]
Table 3. Regulated areas in the Han River Basin, South Korea (unit: ha (%)) (including Land Acquisition Target Areas).
GroupNameUnitTotal AreaLand Purchase Area (a) Riparian Buffer Zone (b)Water Source Protection Zone (c)Special Measure Area (d)Total Regulated Area (a + b + c + d)
(e)
Overlapping Area (f)Regulated Area
(e − f)
1Chuncheonha111,583.44 4376.94 1570.74 175.33 0.00 6123.01 4263.48 1859.54
%100.00 3.92 1.41 0.16 0.00 5.49 1.41 1.67
Wonjuha86,656.50 1256.18 533.82 603.36 0.00 2393.35 533.82 1859.54
%100.00 1.45 0.62 0.70 0.00 2.76 0.62 2.15
2Chungjuha98,209.13 4533.34 2056.34 379.02 0.00 6968.71 2056.34 4912.36
%100.00 4.62 2.09 0.39 0.00 7.10 2.09 5.00
Hanamha9281.34 215.60 0.00 706.26 0.00 921.87 215.60 706.26
%100.00 2.32 0.00 7.61 0.00 9.93 2.32 7.61
Gapyeongha84,089.76 6605.45 2625.58 0.00 9238.52 18,469.54 2625.58 15,843.96
%100.00 7.86 3.12 0.00 10.99 21.96 3.12 18.84
3Yonginha59,174.27 5030.07 2646.14 153.75 18,522.55 26,352.52 7676.21 18,676.30
%100.00 8.50 4.47 0.26 31.30 44.53 12.97 31.56
Namyangjuha45,961.66 2361.16 807.81 4271.85 16,650.22 24,091.04 7440.82 16,650.22
%100.00 5.14 1.76 9.29 36.23 52.42 16.19 36.23
4Yangpyeongha87,688.80 6540.16 3295.85 2386.41 37,258.64 49,481.06 12,222.42 37,258.64
%100.00 7.46 3.76 2.72 42.49 56.43 13.94 42.49
Yeojha60,739.77 7638.46 4536.26 234.13 24,711.86 37,120.71 4679.62 32,441.08
%100.00 12.58 7.47 0.39 40.68 61.11 7.70 53.41
5Yangpyeongha42,984.06 5839.12 961.75 8311.78 42,984.06 58,096.71 15,112.65 42,984.06
%100.00 13.58 2.24 19.34 100.00 135.16 35.16 100.00
Table 4. Threat factors, maximum impact distances (Unit: m), weights, and decay types.
Threat Max_Distance (m) Weight Decay Type
Urban Land 80000.90Exponential
Industrial Land 60000.48Linear
Rail 20000.52Linear
Road 30000.75Linear
Agricultural Land 30000.65Linear
Table 5. Sensitivity of Land Use/Land Cover (LULC) to habitat threat factors.
LULC Habitat Suitability Urban Land Industrial Land Rail Road Agricultural Land
Used Area 000.00.00.00.0
Agricultural Land 0.30.70.70.60.60.0
Forest0.90.90.70.80.80.7
Grass 0.350.60.50.50.50.5
Wet land 0.40.50.20.40.40.3
Barren00.00.00.00.00.0
Water11.00.90.70.80.8
Table 6. Carbon pool of Land Use/Land Cover (LULC) (unit: Mg of C/ha/yr).
LULC C Above C Below C Soil C Dead
Used Area 0000
Agricultural Land 14.978579.98571439.942864.992857
Forest53.7789510.7557961.8457926.88947
Grass 1.4358331.43583314.358330
Wet land 69.5142934.75714139.02860
Barren0.0550.0550.550
Water0000
Table 7. Classification criteria for culture, sports, and recreation facilities land.
LULC Classification Type of LULCSpecific Classification Criteria
Culture, Sports, and Recreation Facilities Culture(1) Includes performance facilities (such as concert halls, theaters, and music halls, excluding movie theaters), and exhibition facilities (such as museums, art galleries, memorial halls, exhibition halls, and galleries).
(2) Includes cultural centers (such as cultural halls), fishing sites, riding clubs, observatories, cable cars, and English villages.
Sports(3) Includes stadium facilities such as sports fields, horse racing tracks, bicycle racing tracks, car racing tracks, and boat racing tracks.
Recreation Facilities(4) Includes recreational facilities such as amusement parks, resorts, sports parks, and pensions.
(5) Includes locations equipped with the essential facilities for filming movies, TV dramas, and other productions.
(6) Includes youth training centers, campgrounds, shelters, rest areas, and recreational forests.
(7) Includes accommodation within resorts, such as hotels and motels.
(8) Includes golf practice ranges (both indoor and outdoor) and facilities within golf clubs (such as clubhouses).
Other(9) Nets of golf practice ranges are classified as parking lots if they are used for parking; otherwise, they are classified as culture, sports, and recreation facilities.
(10) Includes artificial waterfalls, fountains, and similar structures.
Table 8. Scoring criteria for conservation value assessment.
Type Description Scoring Range
Excellent Areas Regions with high evaluation grades across services, with high supporting, regulating,
and cultural service values, making them superior to other regions.
3–6
Average Areas Regions with moderate evaluation grades across services,
requiring management for potential ES improvements.
7–9
Service Management Areas Regions with relatively low evaluation grades, requiring partial improvement
in ES grades to ensure service management.
10–12
Vulnerable Areas Regions with low evaluation grades across services,
where significant improvements in ESV are needed.
13–15
Table 9. Ecosystem service composite scores in Namyangju (vulnerable and regulated areas).
Administrative District Supporting Services Grade Regulating Services Grade Cultural Services Grade Composite Score Remarks
Dasan 1-dong 0.12513.5851.214Vulnerable (14) -
Dasan 2-dong 0.25435.9740.944Vulnerable (12) -
Joan-myeon 0.621110.6110.055Average (7) Regulated
Sudong-myeon 0.561122.0110.085Average (7) Regulated
Hwado-eup 0.46295.5420.255Average (9) Regulated
Table 10. Ecosystem service composite scores in Yongin (vulnerable and regulated areas).
Administrative District Supporting Services Grade Regulating Services Grade Cultural Services Grade Composite Score Remarks
Bojeong-dong 0.26449.3340.385Vulnerable (13) -
Singal-dong 0.22436.9340.675Vulnerable (13) -
Pungdeokcheon 2-dong 0.19434.1341.743Vulnerable (11) -
Idong-eup 0.47298.6510.145Average (8) Regulated
Mohyeon-eup 0.43289.3420.215Average (9) Regulated
Dongbu-dong 0.492105.5810.225Average (8) Regulated
Namsa-eup 0.38386.9820.145Management (10) Regulated
Yeokbuk-dong 0.37386.9820.165Management (10) Regulated
Yurim-dong 0.33372.4830.345Management (11) Regulated
Jungang-dong 0.34369.3030.715Management (11) Regulated
Table 11. Scoring criteria for conservation trade-off evaluation.
Major Category Description Subcategory Description
Balanced Area Regions with low levels of trade-off phenomena and synergies that balance the supply and demand of services. Service Excellence Area Regions with high evaluation grades for all ES
(conservation value assessment grades of 1–2 for all items).
Service Management Area Regions with moderate evaluation grades for ES,
requiring management for improvement (grades of 3–4).
Imbalanced Area Regions with high levels of trade-off phenomena, resulting in an imbalance between the supply and demand of services. Service Imbalance Area Regions where only one service has a high or low grade, leading to trade-off phenomena.
Service Vulnerable Area Regions with low evaluation grades for all ES
(conservation value assessment grades of 4–5 for all items).
Table 12. Scenario criteria for ecosystem service evaluation.
Category Description Riparian Green Spaces (%) Recreation and Ecotourism (%)
Scenario 1 Change target area codes to 100% mixed forest 100-
Scenario 2 Change target area codes to 70% mixed forest and 30% recreation and ecotourism 7030
Scenario 3 Change target area codes to 50% mixed forest and 50% recreation and ecotourism 5050
Table 13. Ecosystem service evaluation results after scenario application (Namyangju).
Administrative District Service Scenario 1 (100%) Scenario 2 (70%/30%) Scenario 3 (50%/50%)
Before After Change Before After Change Before After Change
Dasan 1-dong Supporting 0.120.420.300.120.250.130.120.160.04
Regulating 13.5892.0878.5013.5846.5833.0013.5818.394.81
Cultural 1.211.21- 1.2130.7829.571.2121.5120.30
Dasan 2-dong Supporting 0.250.450.200.250.380.130.250.320.07
Regulating 35.9793.2757.3035.9775.2739.3035.9747.4311.46
Cultural 0.940.94- 0.9412.6211.680.9413.8712.93
Joan-myeon Supporting 0.620.60−0.020.620.60−0.020.620.670.05
Regulating 110.61121.0910.48110.61121.0910.48110.61111.340.73
Cultural 0.050.045−0.010.050.05- 0.056.406.35
Sudong-myeon Supporting 0.560.630.070.560.630.070.560.630.07
Regulating 122.01135.4313.42122.01135.4213.41122.01123.991.98
Cultural 0.080.081- 0.080.08- 0.087.547.46
Hwado-eup Supporting 0.460.620.160.460.46- 0.460.42−0.04
Regulating 95.54122.9327.3995.5490.95−4.5995.5477.67−17.87
Cultural 0.250.25- 0.2521.1120.860.2511.6911.44
Table 14. Ecosystem service evaluation results after scenario application (Yongin).
Administrative District Service Scenario 1 (100%) Scenario 2 (70%/30%) Scenario 3 (50%/50%)
Before After Change Before After Change Before After Change
Bojeong-dong Supporting 0.260.570.310.260.560.300.260.280.02
Regulating 49.33111.2561.9249.33108.2358.9049.3344.68−4.65
Cultural 0.380.38- 0.382.351.970.3836.0735.69
Singal-dong Supporting 0.220.510.290.220.510.290.220.20−0.02
Regulating 36.93107.9571.0236.93107.7370.8036.9327.22−9.71
Cultural 0.670.67- 0.670.790.120.6720.5119.84
Pungdeokcheon 2-dong Supporting 0.130.550.420.130.560.430.130.12−0.01
Regulating 15.75107.9592.2015.75107.4091.6515.7511.98−3.77
Cultural 1.631.63- 1.632.000.371.6316.3014.67
Idong-eup Supporting 0.470.600.130.470.600.130.470.550.08
Regulating 98.65119.8521.2098.65119.7221.0798.65101.622.97
Cultural 0.140.14- 0.140.14- 0.1411.611.46
Mohyeon-eup Supporting 0.430.540.110.430.500.070.430.41−0.02
Regulating 89.34116.0026.6689.34107.4818.1489.3476.46−12.88
Cultural 0.210.21- 0.215.725.510.2110.9210.71
Dongbu-dong Supporting 0.490.600.110.490.570.080.490.32−0.17
Regulating 105.58125.8920.31105.58120.6015.02105.5865.46−40.12
Cultural 0.220.22- 0.223.673.450.2212.3412.12
Namsa-eup Supporting 0.380.560.180.380.490.110.380.440.06
Regulating 86.98121.0934.1186.98107.6520.6786.9884.13−2.85
Cultural 0.140.160.020.148.878.730.1419.2619.12
Yeokbuk-dong Supporting 0.370.580.210.370.580.210.370.14−0.23
Regulating 86.98119.7832.8086.98119.7732.7986.9822.45−64.53
Cultural 0.160.250.090.160.260.100.1619.4319.27
Yurim-dong Supporting 0.330.560.230.330.560.230.330.24−0.09
Regulating 72.48114.4942.0172.48114.4942.0172.4845.24−27.24
Cultural 0.340.34- 0.340.34- 0.3416.3716.03
Jungang-dong Supporting 0.340.570.230.340.570.230.340.350.01
Regulating 69.30116.4847.1869.30116.4747.1769.3067.76−1.54
Cultural 0.710.71- 0.710.720.010.7116.5315.82
Disclaimer/Publisher’s Note: The statements, opinions and data contained in all publications are solely those of the individual author(s) and contributor(s) and not of MDPI and/or the editor(s). MDPI and/or the editor(s) disclaim responsibility for any injury to people or property resulting from any ideas, methods, instructions or products referred to in the content.

