
Sustainable Competitiveness and Applicative Comparative Analysis of Wine Production Through the Lens of Triple Bottom Line, Robotics, and Industry 5.0 Strategies


 ,
,
Abstract
1. Introduction
1.1. Romania, a Profile of the Country and Its Wine Industry
1.2. Portugal, Conditions and Development of the Wine Industry
2. Materials and Methods
3. Results
3.1. TBL—Romanian Wine Industry
- The TBL strategy focuses on enhancing competitiveness and operational efficiency in Romanian wine production. European funds have been used to modernize infrastructure and improve product quality, enhancing Romanian wines’ global presence. Special attention is given to promoting indigenous grape varieties like Fetească Neagră and Fetească Albă, thereby enhancing the value added of Romanian wines [41].
- Romanian wine producers face environmental sustainability challenges, especially in climate change and natural resource management. They are adopting sustainable practices like reducing pesticide use, water conservation, and organic agriculture. Organic viticulture is gaining popularity, preserving biodiversity and soil health. Renewable energy sources and innovative waste management practices are also being adopted [42]. Organic wine production in Romania is regulated by European Union legislation and national standards, ensuring strict sustainability practices. Organic wine production in Romania is aligned with EU organic farming legislation, particularly Regulation (EU) No. 2018/848, which sets out the criteria for organic agricultural practices. Key components of this framework include the following:
- -
- Accredited bodies like ECOCERT or Austria Bio Garantie certify vineyards to EU organic standards. A three-year conversion period prohibits synthetic chemicals and replaces them with natural alternatives, ensuring full organic certification.
- -
- Organic viticulture in Romania prioritizes soil health, enhancing biodiversity, and maintaining fertility. Vineyards use natural composts, organic fertilizers, and cover crops, prohibiting synthetic chemical inputs. Natural pest control methods, including natural predators and plant-based treatments, prevent vine diseases.
- -
- Organic winemaking strictly regulates additive use, minimizes sulfur dioxide, and avoids enzymes and flavor enhancers. Fermentation with natural yeasts enhances wine’s authenticity, and filtration and clarification use natural materials [43].
- -
- Romania’s organic wine production prioritizes water conservation, energy reduction, and carbon footprint reduction. Some producers use biodynamic practices, following natural cycles, to optimize vine growth and wine quality [44].
- -
- Romania’s organic wine production prioritizes sustainability and eco-friendliness, using organic certifications and biodynamic labels as marketing tools to gain a competitive edge in the international market.
- c.
- The TBL strategy emphasizes social responsibility and preserving viticultural traditions in Romania. The wine industry, particularly in rural areas, provides jobs and contributes to economic development. Producers invest in improving working conditions and training, ensuring social sustainability. Wine tourism attracts international visitors and promotes wine regions like Dealu Mare and Murfatlar as tourist destinations, contributing to economic growth and cultural preservation.
3.2. TBL—Portugal Wine Industry
- The economic sustainability of the Portuguese wine industry is driven by its contribution to the country’s GDP and its robust export market. Wine exports, particularly from regions like the Douro Valley, Alentejo, and Vinho Verde, have been steadily growing, reaching EUR 925 million in 2021 [46]. To maintain this momentum, Portuguese wineries are focusing on producing high-quality wines, diversifying into organic and premium wine markets, and increasing value added through branding and international market access. Additionally, the Portuguese wine sector benefits from EU funds, which support the modernization of winemaking processes and infrastructure, ensuring that wineries can continue to meet global demand while maintaining efficiency [47].
- Sustainability in the Portuguese wine industry is closely tied to environmental practices that preserve the natural resources vital to viticulture. Key environmental strategies include the following:
- -
- Many wineries, such as those in Alentejo and Douro, have embraced organic and biodynamic farming practices. These approaches reduce the use of synthetic chemicals, improve soil health, and promote biodiversity.
- -
- Efficient water usage is critical in regions affected by climate change, particularly in the hotter areas of Alentejo. Vineyards are employing water conservation techniques like drip irrigation and rainwater harvesting to reduce their environmental impact [48].
- -
- Several wineries have integrated solar panels and other renewable energy sources to lower their carbon footprint while also adopting sustainable packaging to further reduce environmental impact.
- -
- In regions like Alentejo, biodynamic viticulture goes beyond organic farming by aligning vineyard activities with lunar cycles and natural ecosystems to enhance both the environmental and qualitative aspects of wine production [49].
- c.
- The social impact of the Portuguese wine industry is rooted in its role as a key contributor to rural development and employment. The sector provides jobs for thousands of people, particularly in rural regions where other economic opportunities may be limited. Key social sustainability initiatives include the following:
- -
- Fair labor practices: Many wineries are committed to ensuring fair wages, safe working conditions, and long-term employment for vineyard workers, particularly during the grape harvest season [52].
- -
- Cultural preservation: The Portuguese wine industry plays a critical role in preserving traditional winemaking practices and protecting indigenous grape varieties, such as Touriga Nacional and Arinto, which contribute to the country’s unique wine identity. Wine tourism has become a significant factor in sustaining local communities, attracting visitors to experience Portuguese wine culture in regions like Douro and Alentejo [53].
Construct Reliability and Validity
4. Discussion
4.1. Economic Impact
- Lack of strong associations to negotiate serious contracts and enter the external value chain (supermarkets, specialized stores);
- The lack of wines (country brand) such as Bordeaux, Chianti, Portuguese Porto, and, more recently, Mateus, which attract buyers to other products of the country;
- Non-synchronization of producers in promoting themselves properly. I perform different campaigns, and the messages are often different. They are not united on a country brand;
- Lack of export strategy at the level of authorities.
- -
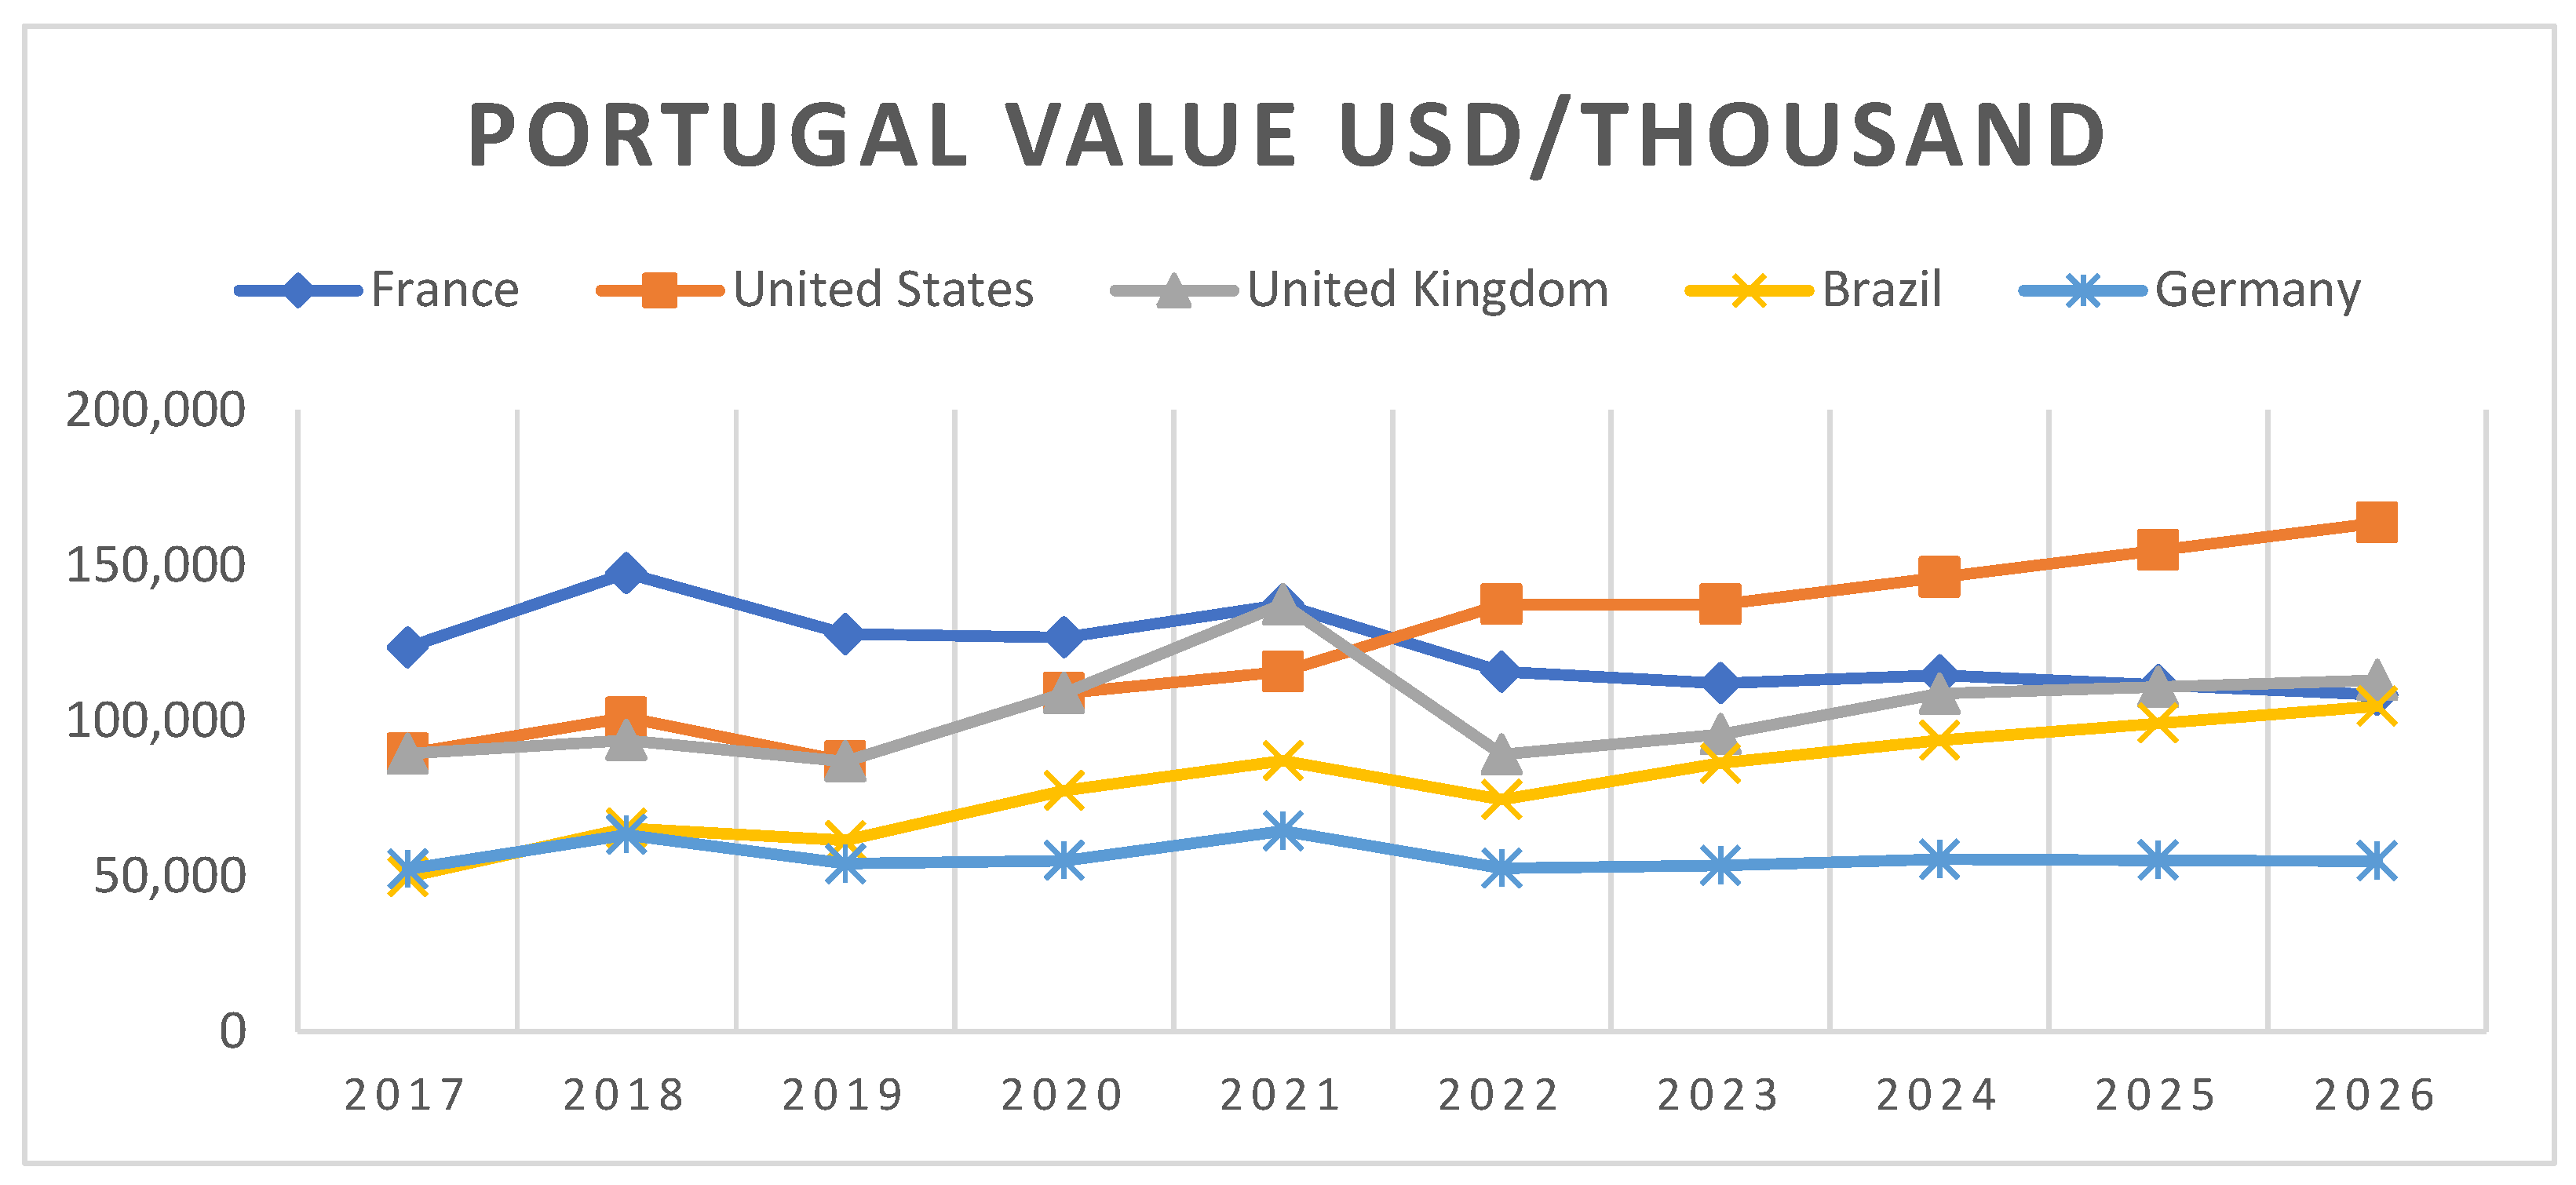
- Supply-Side Factors: Higher production volume leads to increased availability of surplus wine, which must be sold in foreign markets if domestic consumption is saturated. Portugal’s higher export value is not solely due to vineyard area but rather its efficient production systems, branding, and international demand.
- -
- Demand-Side Factors: A strong domestic consumption culture increases international recognition of a country’s wines. Countries like France, Italy, and Portugal have strong domestic markets, reinforcing brand reputation abroad.
4.2. Environmental Issues—Personal Contribution
- -
- Adhere to the principles of agroecology, including basic principles, objectives, and recommendations;
- -
- Document and implement good practices in agriculture, including soil, water, and biodiversity conservation practices;
- -
- Ensure transparency and traceability in the production, processing, and marketing of products;
- -
- Obtain organic certification before applying the standard.
- -
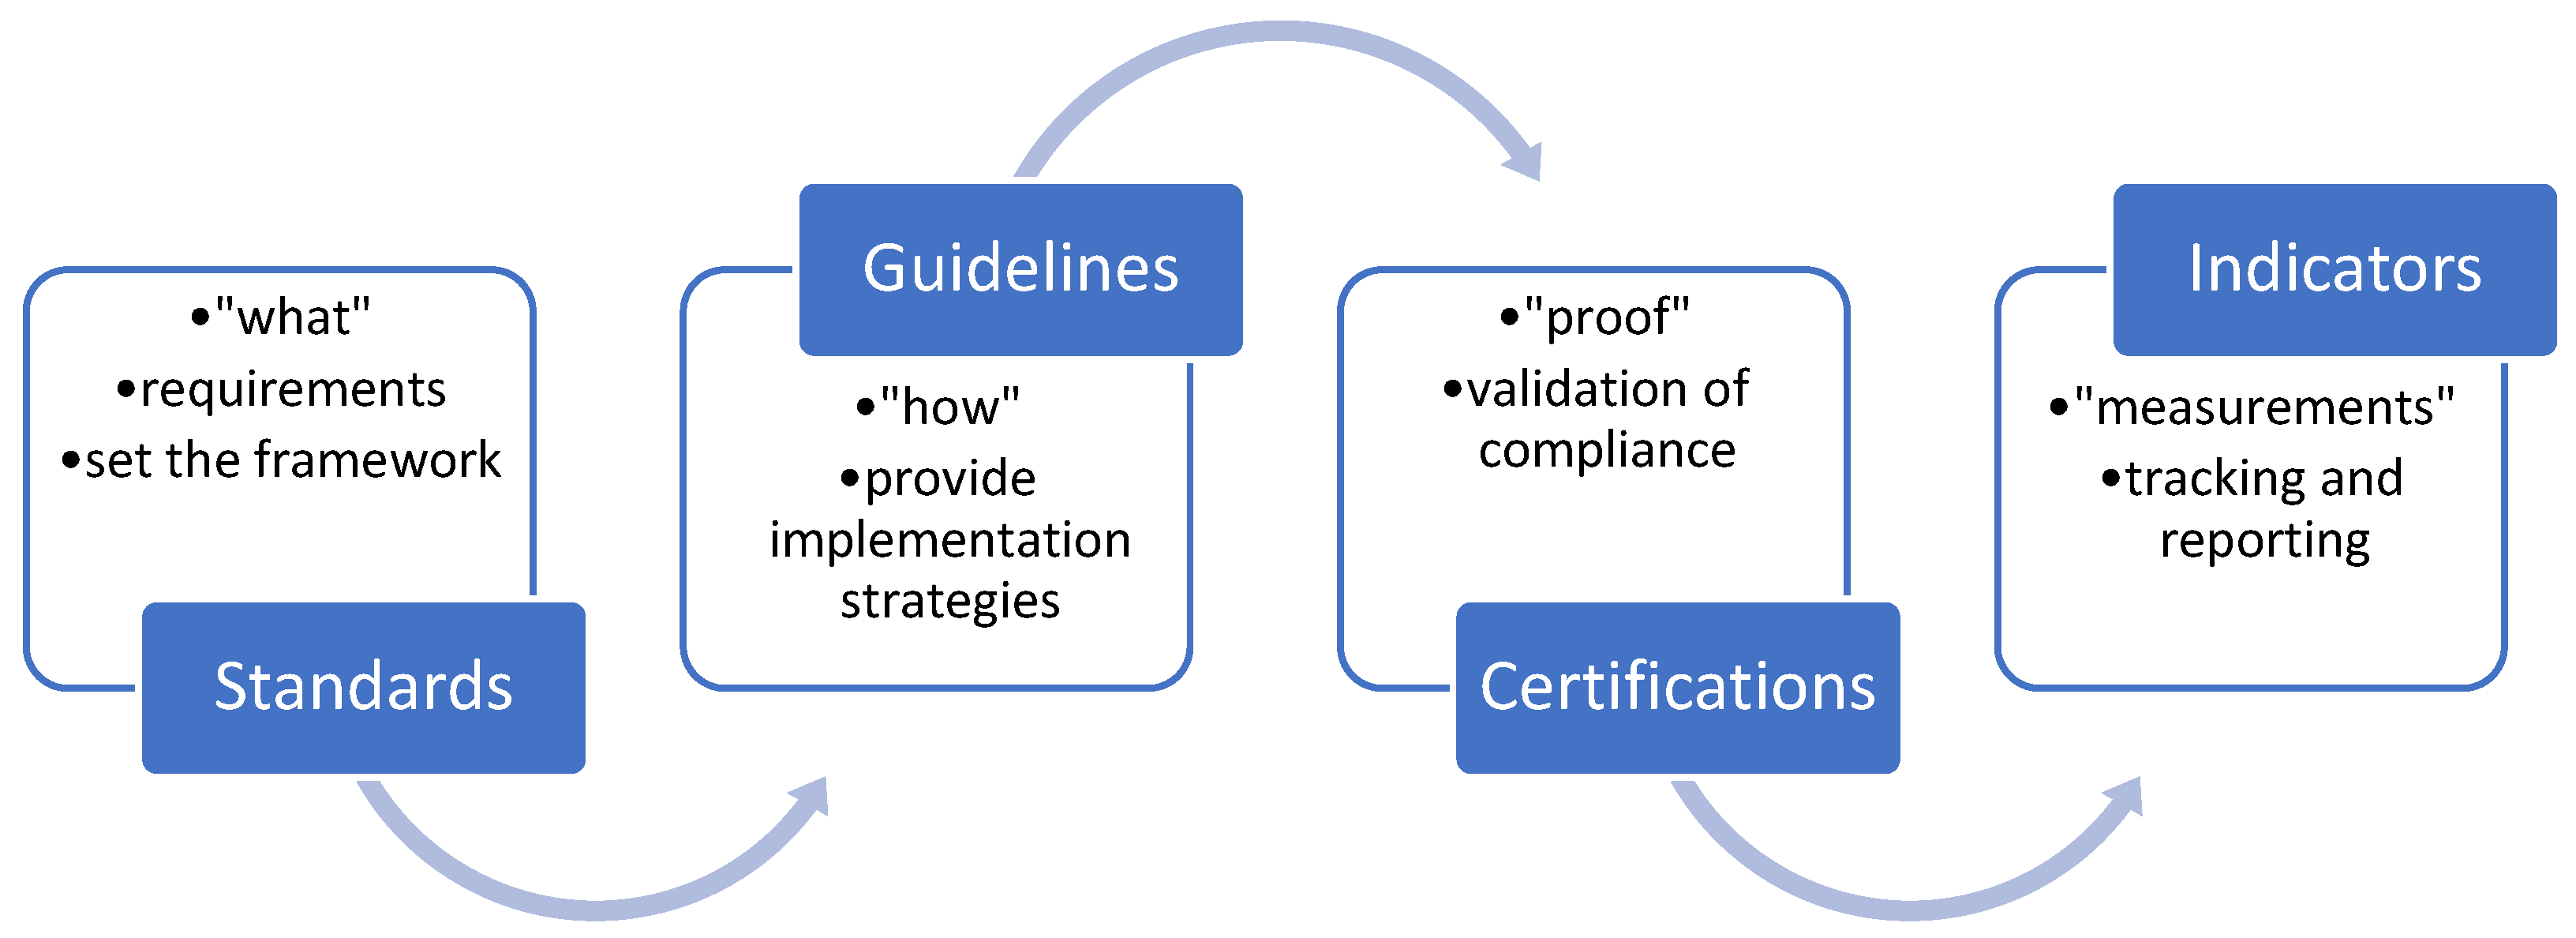
- It simplifies the implementation work and establishes a minimum level of evidence necessary to meet the requirements;
- -
- It ensures transparency and traceability in the production, processing, and marketing of products;
- -
- It provides a guarantee that the products are produced in accordance with the principles of agroecology and the requirements of the standard.
4.3. Techno-Social Implications
5. Conclusions
Author Contributions
Funding
Institutional Review Board Statement
Informed Consent Statement
Data Availability Statement
Conflicts of Interest
Appendix A
Appendix A.1
Appendix A.2
Appendix A.3

| Ha (mii) | 2016 | 2017 | 2018 | 2019 | 2020 | 2021 | 2022 | 2023 | 2020/2019 %var | 2020 %world | 2021 | 2021/2020 %var | 2021 %world |
|---|---|---|---|---|---|---|---|---|---|---|---|---|---|
| Portugal | 195 | 194 | 192 | 195 | 194 | 194 | 194 | 182 | −0.2% | 2.7% | 194 | −0.2% | 2.7% |
| Romania | 191 | 191 | 191 | 191 | 190 | 190 | 188 | 187 | −0.4% | 2.6% | 189 | −0.7% | 2.6% |
| 1000 hl | 2016 | 2017 | 2018 | 2019 | 2020 | 2021 | 2022 | 2023 |
|---|---|---|---|---|---|---|---|---|
| Portugal | 6010 | 6737 | 6060 | 6527 | 6418 | 7359 | 6848 | 7521 |
| Romania | 3267 | 4317 | 5088 | 3808 | 3829 | 4451 | 3788 | 4590 |
| 1000 hl | 2016 | 2017 | 2018 | 2019 | 2020 | 2021 | 2022 | 2023 |
|---|---|---|---|---|---|---|---|---|
| Portugal | 4686 | 5273 | 5073 | 5390 | 4374 | 5269 | 6058 | 5500 |
| Romania | 3818 | 4140 | 3899 | 2243 | 2558 | 3709 | 2498 | 3000 |
| Indicator | UM | Year | Portugal | Romania |
|---|---|---|---|---|
| Volume | (mhl) | 2016 | 2778 | 129 |
| Value | (USD/mil) | 2016 | 801,146 | 22,716 |
| Volume | (mhl) | 2017 | 2993 | 162 |
| Value | (USD/mil) | 2017 | 878,452 | 27,690 |
| Volume | (mhl) | 2018 | 2951 | 199 |
| Value | (USD/mil) | 2018 | 1,014,760 | 35,986 |
| Volume | (mhl) | 2019 | 2963 | 236 |
| Value | (USD/mil) | 2019 | 917,374 | 34,574 |
| Volume | (mhl) | 2020 | 3151 | 210 |
| Value | (USD/mil) | 2020 | 977,936 | 35,203 |
| Volume | (mhl) | 2021 | 3288 | 190 |
| Value | (USD/mil) | 2021 | 1,096,917 | 40,443 |
| Volume | (mhl) | 2022 | 3254 | 180 |
| Value | (USD/mil) | 2022 | 988,774 | 37,382 |
| Volume | (mhl) | 2023 | 3195 | 146 |
| Value | (USD/mil) | 2023 | 1,003,481 | 38,743 |
| Volume (mhl) 2017 | Volume (mhl) 2018 | Volume (mhl) 2019 | Volume (mhl) 2020 | Volume (mhl) 2021 | 2022 | 2023 | |
|---|---|---|---|---|---|---|---|
| Germany | 2872 | 3733 | 4253 | 4443 | 5236 | 4311 | 4057 |
| Netherlands | 1506 | 2099 | 2472 | 3708 | 4398 | 5541 | not reported |
| United Kingdom | 3202 | 4439 | 3070 | 2115 | 2796 | 2516 | 2049 |
| United States | 680 | 519 | 810 | 750 | 742 | 543 | 622 |
| Belgium | 136 | 152 | 172 | 297 | 374 | 355 | 357 |
| Value USD/mil 2017 | Value USD/mil 2018 | Value USD/mil 2019 | Value USD/mil 2020 | Value USD/mil 2021 | 2022 | 2023 | |
|---|---|---|---|---|---|---|---|
| Germany | 4258 | 6464 | 7015 | 7779 | 9482 | 7505 | 8019 |
| Netherlands | 3105 | 4148 | 4468 | 6740 | 8477 | 10,026 | 10,988 |
| United Kingdom | 5837 | 9022 | 5807 | 4405 | 6469 | 5756 | 5119 |
| Spain | 2899 | 2437 | 2407 | 3670 | 2062 | 1220 | 1274 |
| United States | 1382 | 1158 | 1592 | 1719 | 1767 | 1262 | 1716 |
| Volume (mhl) 2017 | Volume (mhl) 2018 | Volume (mhl) 2019 | Volume (mhl) 2020 | Volume (mhl) 2021 | 2022 | 2023 | |
|---|---|---|---|---|---|---|---|
| France | 38,894 | 46,930 | 42,058 | 40,954 | 42,323 | 39,580 | 34,625 |
| United Kingdom | 22,001 | 23,244 | 21,878 | 29,269 | 27,639 | 23,876 | 23,405 |
| United States | 20,216 | 22,080 | 22,743 | 25,797 | 27,558 | 24,800 | 23,373 |
| Brazil | 17,094 | 19,236 | 19,975 | 25,243 | 26,648 | 25,836 | |
| Germany | 25,080 | 28,135 | 22,947 | 19,346 | 21,491 | 20,239 | 19,619 |
| Value USD/mil 2017 | Value USD/mil 2018 | Value USD/mil 2019 | Value USD/mil 2020 | Value USD/mil 2021 | 2022 | 2023 | |
|---|---|---|---|---|---|---|---|
| France | 123,675 | 147,524 | 127,938 | 126,935 | 137,548 | 115,824 | 112,101 |
| United States | 89,174 | 101,123 | 100,179 | 105,524 | 123,381 | 111,612 | 108,266 |
| United Kingdom | 89,492 | 93,846 | 87,044 | 109,017 | 115,844 | 89,250 | 95,752 |
| Brazil | 49,917 | 65,533 | 61,570 | 77,667 | 87,254 | 74,753 | 86,410 |
| Germany | 52,397 | 63,410 | 54,111 | 55,122 | 64,663 | 52,666 | 53,598 |
| Categories | 2016 | 2017 | 2018 | 2019 | 2020 | |
|---|---|---|---|---|---|---|
| Total area cultivated with vines for wine | Ha (mii) | 171.2 | 170.3 | 171.1 | 167.3 | 173.7 |
| Total wine production | Mii hl | 3303.7 | 4264.1 | 5088.1 | 3808.3 | 3959.7 |
| Noble Wine—Mii hl | |||
|---|---|---|---|
| Total, of Which | White Wine | Rosé Wine | Vin Roșu |
| 2382.03 | 1385.89 | 245.04 | 751.10 |
| The Wine Variety | Area (ha) | (%) |
|---|---|---|
| Fetească regală | 13,634 | 15.52 |
| Merlot | 12,010 | 13.68 |
| Fetească Albă | 9241 | 10.52 |
| Amestec soiuri nobile | 5008 | 5.7 |
| Riesling Italian | 6488 | 7.39 |
| Aligote | 4149 | 4.72 |
| Sauvignon | 5478 | 6.24 |
| Cabernet Sauvignon | 5387 | 6.13 |
| Muscat Ottonel | 4294 | 4.89 |
| Băbească Neagră | 2613 | 2.98 |
| Fetească Neagră | 3028 | 3.45 |
| Roșioară | 1944 | 2.21 |
| Altele | 14,547 | 16.57 |
| Total | 87,821 | 100 |
Appendix A.4
References
- Carayannis, E.G.; Morawska-Jancelewicz, J. The Futures of Europe: Society 5.0 and Industry 5.0 as Driving Forces of Future Universities. J. Knowl. Econ. 2022, 13, 3445–3471. [Google Scholar] [CrossRef]
- Tieber, A.; Manolache, D.; Gheorghe, M. Development of Key Performance Indicators Modules for Small and Medium-Sized Enterprises in the Production Industry. IOP Conf. Ser. Mater. Sci. Eng. 2019, 682, 012020. [Google Scholar] [CrossRef]
- Gheorghe, M.; Moritz, M.; Tarara, A. Development of a KPI Evaluation Application for Small and Medium-Sized Companies. UPB Sci. Bull. Ser. C 2019, 81, 41–50. [Google Scholar]
- Chen, L.F.; Shen, Q.T.S.; Yu, X.L.; Chen, X.H. Knowledge Spillovers Along the Sustainable Supply Chain of China’s Listed Companies: The Role of Long-Term Orientation. J. Innov. Knowl. 2024, 9, 100478. [Google Scholar] [CrossRef]
- Payer, R.C.; Quelhas, O.L.G.; Bergiante, N.C.R. Framework to Supporting Monitoring the Circular Economy in the Context of Industry 5.0: A Proposal Considering Circularity Indicators, Digital Transformation, and Sustainability. J. Clean. Prod. 2024, 466, 142850. [Google Scholar] [CrossRef]
- Babkin, A.; Shkarupeta, E.; Malevskaia-Malevich, E.; Pogrebinskaya, E.; Batukova, L. Managing Circularity in Industrial Ecosystems: Introducing the Concept of Circular Maturity and Its Application in NLMK Group. Int. J. Technol. 2024, 14, 1769–1778. [Google Scholar] [CrossRef]
- Vukelić, Z.; Cajner, H.; Barić, G. Research Model of the Degree of Technological Humanism in Manufacturing Companies in the Transformation towards Industry 5.0. Teh. Glas. Tech. J. 2024, 18, 410–417. [Google Scholar] [CrossRef]
- Pereira, A.C.; de Graaf, R.; Lin, F.Y. Sustainable Floating City Production Systems-Moving Towards Industry 5.0. In Proceedings of the 3rd World Conference on Floating Solutions (WCFS 2023); Springer: Berlin/Heidelberg, Germany, 2024; Volume 465, pp. 159–170. [Google Scholar] [CrossRef]
- Nikseresht, A.; Golmohammadi, D.; Zandieh, M. Empirical Modeling Approaches in Sustainable Supply Chain Management: A Review with Bibliometric and Network Analyses. Bus. Strategy Environ. 2024, 33, 8759–8783. [Google Scholar] [CrossRef]
- Sun, X.; Yu, H.; Solvang, W.D.; Govindan, K. A Two-Level Decision-Support Framework for Reverse Logistics Network Design Considering Technology Transformation in Industry 4.0: A Case Study in Norway. Int. J. Adv. Manuf. Technol. 2024, 134, 389–413. [Google Scholar] [CrossRef]
- Beigizadeh, R.; Delgoshaei, A.; Ariffin, M.K.A.; Hanjani, S.E.; Ali, A. A Comprehensive Model for Determining Technological Innovation Level in Supply Chains Using Green Investment, Eco-Friendly Design, and Customer Collaborations Factors. RAIRO Oper. Res. 2022, 56, 2775–2800. [Google Scholar] [CrossRef]
- Donmezer, S.; Demircioglu, P.; Bogrekci, I.; Bas, G.; Durakbasa, M.N. Revolutionizing the Garment Industry 5.0: Embracing Closed-Loop Design, E-Libraries, and Digital Twins. Sustainability 2023, 15, 15839. [Google Scholar] [CrossRef]
- Lou, S.H.; Tan, R.J.; Zhang, Y.R.; Lv, C. Human-Robot Interactive Disassembly Planning in Industry 5.0. In Proceedings of the IEEE/ASME International Conference on Advanced Intelligent Mechatronics (AIM), Seattle, WA, USA, 28–30 June 2023; pp. 891–895. [Google Scholar] [CrossRef]
- Pizoń, J.; Cioch, M.; Kański, Ł.; Sánchez García, E. Cobots Implementation in the Era of Industry 5.0 Using Modern Business and Management Solutions. Adv. Sci. Technol. Res. J. 2022, 16, 166–178. [Google Scholar] [CrossRef] [PubMed]
- Farooq, M.U.; Eizad, A.; Bae, H.K. Power Solutions for Autonomous Mobile Robots: A Survey. Robot. Auton. Syst. 2023, 159, 104285. [Google Scholar] [CrossRef]
- Varriale, V.; Cammarano, A.; Michelino, F.; Caputo, M. Industry 5.0 and Triple Bottom Line Approach in Supply Chain Management: The State-of-the-Art. Sustainability 2023, 15, 5712. [Google Scholar] [CrossRef]
- Waheed, A.; Alharthi, M.; Khan, S.Z.; Usman, M. Role of Industry 5.0 in Leveraging the Business Performance: Investigating Impact of Shared-Economy on Firms’ Performance with Intervening Role of i5.0 Technologies. Sage Open 2022, 12, 21582440221094608. [Google Scholar] [CrossRef]
- Haloui, D.; Oufaska, K.; Oudani, M.; El Yassini, K. Bridging Industry 5.0 and Agriculture 5.0: Historical Perspectives, Opportunities, and Future Perspectives. Sustainability 2024, 16, 3507. [Google Scholar] [CrossRef]
- Ferreira, J.; Morira, P.A.; Silva, M.; Santos, F. A Survey on Localization, Mapping, and Trajectory Planning for Quadruped Robots in Vineyards. In Proceedings of the 2022 IEEE International Conference on Autonomous Robot Systems and Competitions (ICARSC), Santa Maria da Feira, Portugal, 29–30 April 2022; IEEE: Piscataway, NJ, USA, 2022. [Google Scholar] [CrossRef]
- Milburn, L.; Gamba, J.; Fernandes, M.; Semini, C. Computer-Vision-Based Real-Time Waypoint Generation for Autonomous Vineyard Navigation with Quadruped Robots. In Proceedings of the 2023 IEEE International Conference on Autonomous Robot Systems and Competitions (ICARSC), Tomar, Portugal, 26–27 April 2023; IEEE: Piscataway, NJ, USA, 2023. [Google Scholar] [CrossRef]
- Oliveira, L.F.P.; Silva, M.F.; Moreira, A.P. Agricultural Robotics: A State of the Art Survey. In Proceedings of the 23rd International Conference Series on Climbing and Walking Robots and the Support Technologies for Mobile Machines, Moscow, Russia, 24–26 August 2020; Volume 279. [Google Scholar] [CrossRef]
- Ravankar, A.; Ravankar, A.A.; Rawankar, A.; Hoshino, Y. Autonomous and Safe Navigation of Mobile Robots in Vineyard with Smooth Collision Avoidance. Agriculture 2021, 11, 954. [Google Scholar] [CrossRef]
- Lytridis, C.; Bazinas, C.; Pachidis, T.; Chatzis, V.; Kaburlasos, V.G. Coordinated Navigation of Two Agricultural Robots in a Vineyard: A Simulation Study. Sensors 2022, 22, 9095. [Google Scholar] [CrossRef]
- Droukas, L.; Doulgeri, Z.; Tsakiridis, N.L.; Triantafyllou, D.; Kleitsiotis, I.; Mariolis, I.; Giakoumis, D.; Tzovaras, D.; Kateris, D.; Bochtis, D. A Survey of Robotic Harvesting Systems and Enabling Technologies. J. Intell. Robot. Syst. 2023, 107, 21. [Google Scholar] [CrossRef]
- Băișan, C.E.; Gheorghe, M. Sustainable Development Achievements in a Database System. J. Appl. Mech. Mater. 2014, 657, 1016–1020. [Google Scholar] [CrossRef]
- Dijmarescu, M.R.; Parvu, C.; Gheorghe, M. Knowledge Database for Functional Design of Mechanical Products. Appl. Mech. Mater. 2015, 760, 15–20. [Google Scholar] [CrossRef]
- Gheorghe, M.; Tarara, A. A Web-Based Application Design for Product Data Engineering and Management. UPB Sci. Bull. Ser. C 2018, 80, 13–22. [Google Scholar]
- International Standards. Available online: https://www.iso.org/ (accessed on 7 January 2025).
- Abraham, K.T. Responsible Leadership and Triple Bottom Line Performance: Imperatives for Corporate Sustainability. J. Glob. Responsib. 2024, 15, 485–500. [Google Scholar] [CrossRef]
- Pasamar, S.; Bornay-Barrachina, M.; Morales-Sánchez, R. Institutional Pressures for Sustainability: A Triple Bottom Line Approach. Eur. J. Manag. Bus. Econ. 2023. [Google Scholar] [CrossRef]
- Nogueira, E.; Gomes, S.; Lopes, J.M. Triple Bottom Line, Sustainability, and Economic Development: Theoretical Insights and the Research Agenda. In Proceedings of the 5th International Conference on Production Economics and Project Evaluation (ICOPEV 2022); IPCB: Pozzuoli, Italy, 2023; pp. 405–420. [Google Scholar] [CrossRef]
- Srivastava, A.K.; Dixit, S.; Srivastava, A.A. Criticism of Triple Bottom Line: TBL (With Special Reference to Sustainability). Corp. Reput. Rev. 2022, 25, 50–61. [Google Scholar] [CrossRef]
- Palau-Pinyana, E.; Llach, J.; Bagur-Femenías, L. Mapping Enablers for SDG Implementation in the Private Sector: A Systematic Literature Review and Research Agenda. Manag. Rev. Q. 2023, 73, 1559–1588. [Google Scholar] [CrossRef]
- Lindner, J. Entrepreneurship Education for a Sustainable Future. Discourse Commun. Sustain. Educ. 2018, 9, 115–127. [Google Scholar] [CrossRef]
- Moore, A.F.; Hawarden, V. Discovery Digital Health Strategy: COVID-19 Accelerates Online Health Care in South Africa. Emerald Emerg. Mark. Case Stud. 2020, 3, 1–18. [Google Scholar] [CrossRef]
- Rosário, A.T.; Raimundo, R. Sustainable Entrepreneurship Education: A Systematic Bibliometric Literature Review. Sustainability 2024, 16, 784. [Google Scholar] [CrossRef]
- Diepolder, C.S.; Weitzel, H.; Huwer, J. Exploring the Impact of Sustainable Entrepreneurial Role Models on Students’ Opportunity Recognition for Sustainable Development in Sustainable Entrepreneurship Education. Sustainability 2024, 16, 1484. [Google Scholar] [CrossRef]
- Johnson, M.P.; Hörisch, J. Reinforcing or Counterproductive Behaviors for Sustainable Entrepreneurship? The Influence of Causation and Effectuation on Sustainability Orientation. Bus. Strategy Environ. 2021, 31, 908–920. [Google Scholar] [CrossRef]
- Kumari, R.; Kwon, K.S.; Lee, B.H.; Choi, K. Co-Creation for Social Innovation in the Ecosystem Context: The Role of Higher Educational Institutions. Sustainability 2019, 12, 307. [Google Scholar] [CrossRef]
- Orazbayeva, B.; van der Sijde, P.; Baaken, T. Autonomy, Competence, and Relatedness: The Facilitators of Academic Engagement in Education-Driven University-Business Cooperation. Stud. High. Educ. 2021, 46, 1406–1420. [Google Scholar] [CrossRef]
- Mihalache, F. Branding and Export Strategies of Romanian Wines: Fetească Neagră and Its Global Market Potential. Rom. J. Agric. Econ. 2020, 18, 45–55. [Google Scholar]
- Hospido, A.; Rivela, B.; Gazulla, C. Life Cycle Methods and Experiences of Environmental Sustainability Assessments in the Wine Sector. In Improving Sustainable Viticulture and Winemaking Practices; Academic Press: Cambridge, MA, USA, 2022; pp. 351–370. ISBN 9780323851503. [Google Scholar] [CrossRef]
- Giacosa, S.; Segade, S.G.; Cagnasso, E.; Caudana, A.; Rolle, L.; Gerbi, V. SO2 in Wines: Rational Use and Possible Alternatives. In Red Wine Technology; Morata, A., Ed.; Academic Press: Cambridge, MA, USA, 2019; pp. 309–321. ISBN 9780128143995. [Google Scholar] [CrossRef]
- Tancelov, L.; Dobre Gudei, C.S. Sustainable Viticulture and Organic Farming in Romania: Challenges and Opportunities for Future Development. In Proceedings of the International Conference on Business Excellence, The Bucharest University of Economic Studies, Bucharest, Romania, 21–23 March 2024; Volume 18, pp. 1592–1601. [Google Scholar] [CrossRef]
- Jităreanu, A.F.; Mihăilă, M.; Robu, A.-D.; Lipșa, F.-D.; Costuleanu, C.L. Dynamic of Ecological Agriculture Certification in Romania Facing the EU Organic Action Plan. Sustainability 2022, 14, 11105. [Google Scholar] [CrossRef]
- IVV. Annual Report on the Portuguese Wine Sector; Instituto da Vinha e do Vinho: Lisbon, Portugal, 2021. Available online: https://www.ivv.gov.pt/np4/estatistica/ (accessed on 12 November 2024).
- Cunha, M.C.; Serpa, D.; Marques, J.; Keizer, J.J.; Abrantes, N. On Sustainable Improvements of Agricultural Practices in the Bairrada Region (Portugal). Environ. Dev. Sustain. 2023, 25, 2735–2757. [Google Scholar] [CrossRef]
- Trigo, A.; Fragoso, R.; Marta-Costa, A. Sustainability Awareness in the Portuguese Wine Industry: A Grounded Theory Approach. Int. J. Agric. Sustain. 2022, 20, 1437–1453. [Google Scholar] [CrossRef]
- Swiatkiewicz, O. The Wine Sector Management in Portugal: An Overview on Its Three-Dimensional Sustainability. Manag. Sustain. Dev. J. 2021, 13, 39–48, ISSN: 2066-9380. Available online: http://hdl.handle.net/10400.26/36856 (accessed on 7 January 2025). [CrossRef]
- Audrey, L. Organic and Natural Wines in Portugal; AIP: College Park, MD, USA, 2024; Available online: https://americanportugal.com/organic-and-natural-wines-in-portugal/ (accessed on 12 November 2024).
- Da Silva, L.P.; Da Silva, J.C.E. Evaluation of the Carbon Footprint of the Life Cycle of Wine Production: A Review. Clean. Circ. Bioeconomy 2022, 2, 100021. [Google Scholar] [CrossRef]
- Fragoso, R.; Figueira, J.R. Sustainable Supply Chain Network Design: An Application to the Wine Industry in Southern Portugal. J. Oper. Res. Soc. 2020, 72, 1236–1251. [Google Scholar] [CrossRef]
- Dinis, I.; Simões, O.; Cruz, C.; Teodoro, A. Understanding the Impact of Intentions in the Adoption of Local Development Practices by Rural Tourism Hosts in Portugal. J. Rural Stud. 2019, 72, 92–103. [Google Scholar] [CrossRef]
- Trigo, A.; Silva, P. Sustainable Development Directions for Wine Tourism in Douro Wine Region, Portugal. Sustainability 2022, 14, 3949. [Google Scholar] [CrossRef]
- USDA. Foreign Agricultural Services, Report: Portuguese Wine Exports Rise in 2020 Despite COVID-19 Challenges. Available online: https://apps.fas.usda.gov/newgainapi/api/Report/DownloadReportByFileName?fileName=Portuguese%20Wine%20Exports%20Rise%20in%202020%20Despite%20COVID-19%20Challenges%20_Madrid_Portugal_01-29-2021 (accessed on 12 November 2024).
- OIV. State of the World Vitivinicultural Sector in 2020. April 2021. Available online: https://www.oiv.int/public/medias/7909/oiv-state-of-the-world-vitivinicultural-sector-in-2020.pdf (accessed on 12 November 2024).
- Eurostat. People at Risk of Poverty or Social Exclusion. Eurostat Statistics Explained 2020. Available online: https://ec.europa.eu/eurostat/web/products-eurostat-news/w/ddn-20240612-1 (accessed on 12 November 2024).
- STATISTA. Wine market in Europe—Statistics & Facts. Available online: https://www.statista.com/topics/4034/wine-market-in-europe/ (accessed on 12 November 2024).
- SR 13595:2022; Agricultură Ecologică. Cerințe și Recomandări Pentru Produse Ecologice Sustenabile. ASRO: Bucharest, Romania, 2022. Available online: https://magazin.asro.ro/ro/standard/278124 (accessed on 12 November 2024).


| One-Way ANOVA (Welch’s) | F | df1 | df2 | p |
|---|---|---|---|---|
| Consumption | 78.41 | 1 | 18.8 | <0.001 |
| Area | 1.83 | 1 | 13.8 | 0.197 |
| Production | 119.96 | 1 | 18.8 | <0.001 |
| Volume | 1911.25 | 1 | 10.3 | <0.001 |
| Export value | 937.2 | 1 | 10.1 | <0.001 |
| Cronbach’s Alpha | rho_A | Composite Reliability | AVE | R Square | F Square | |
|---|---|---|---|---|---|---|
| Threshold | CA > 0.7 | r > 0.5 | CR > 0.7 | AVE > 0.5 | Max 1 | F > 1.96 |
| Factors | 0.709 | 0.951 | 0.801 | 0.625 | 85.69 | |
| Export | 1.000 | 1.000 | 1.000 | 1 | 0.988 |
| Saturated Model | Estimated Model | |
|---|---|---|
| SRMR | 0.009 | 0.009 |
| d_ULS | 0.001 | 0.001 |
| d_G | 0.040 | 0.040 |
| Chi-Square | 4.421 | 4.421 |
| NFI | 0.971 | 0.971 |
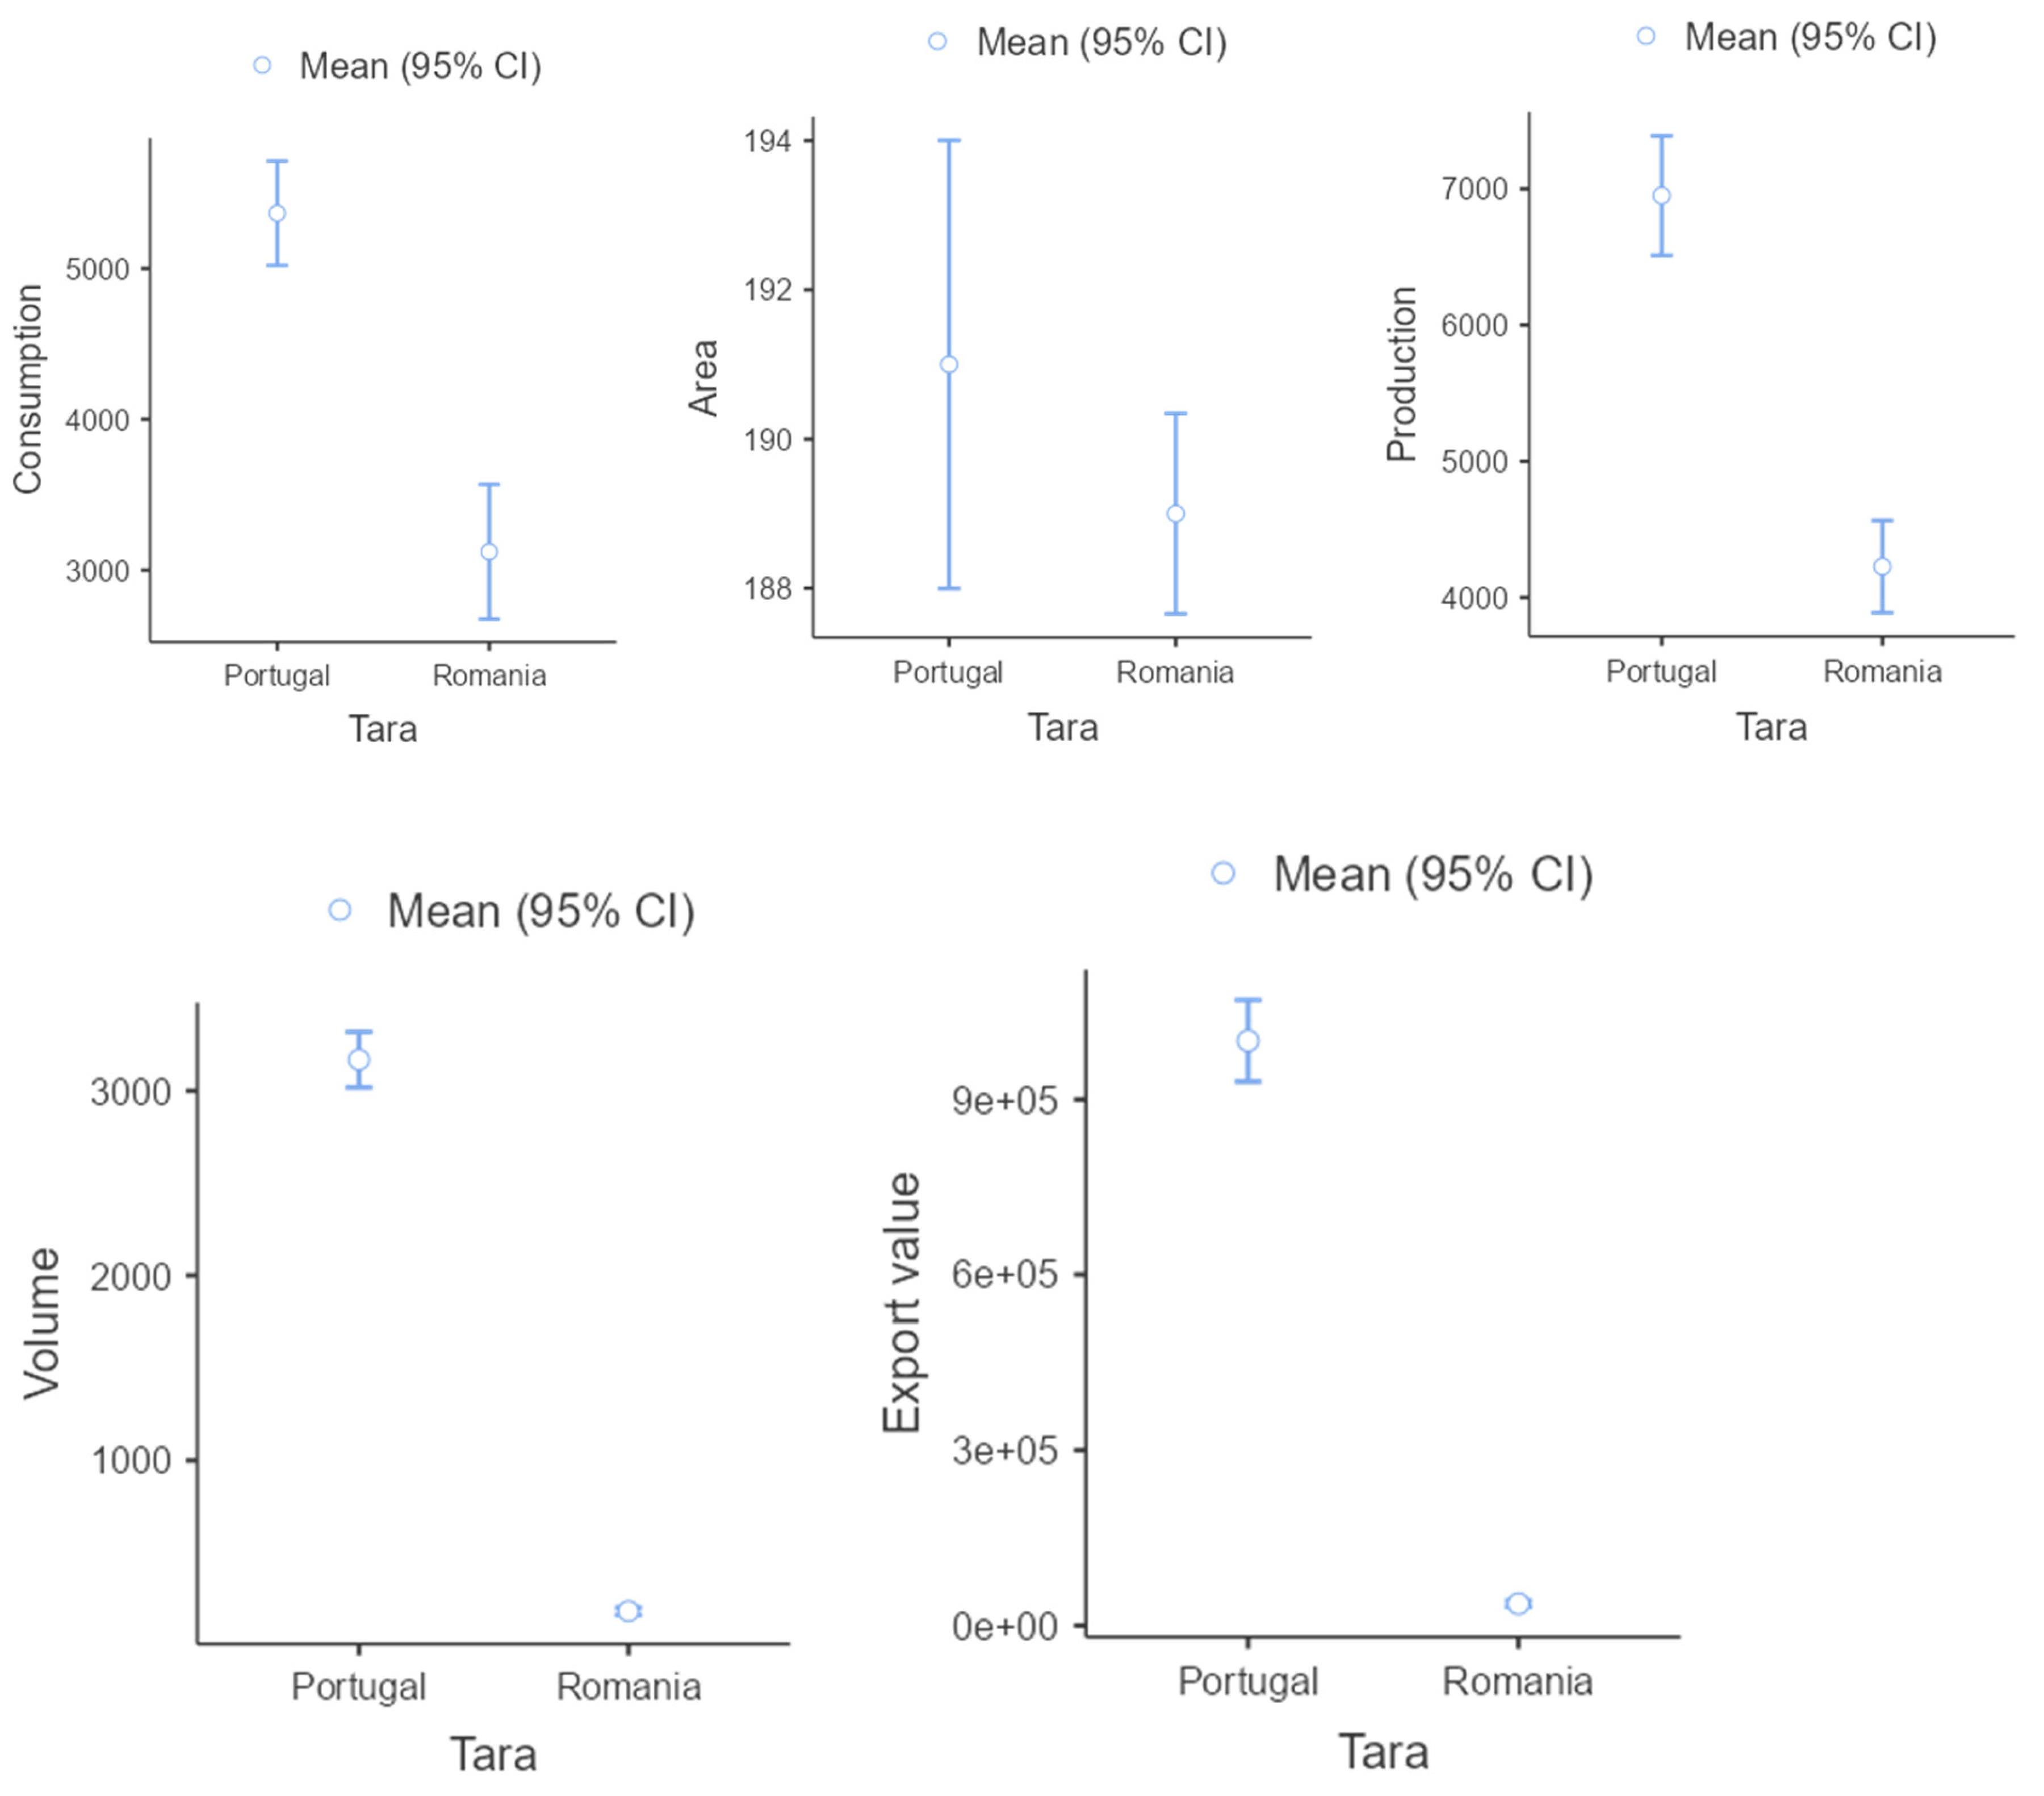
| Variable/Factor | Portugal | Romania | Statistical Insight |
|---|---|---|---|
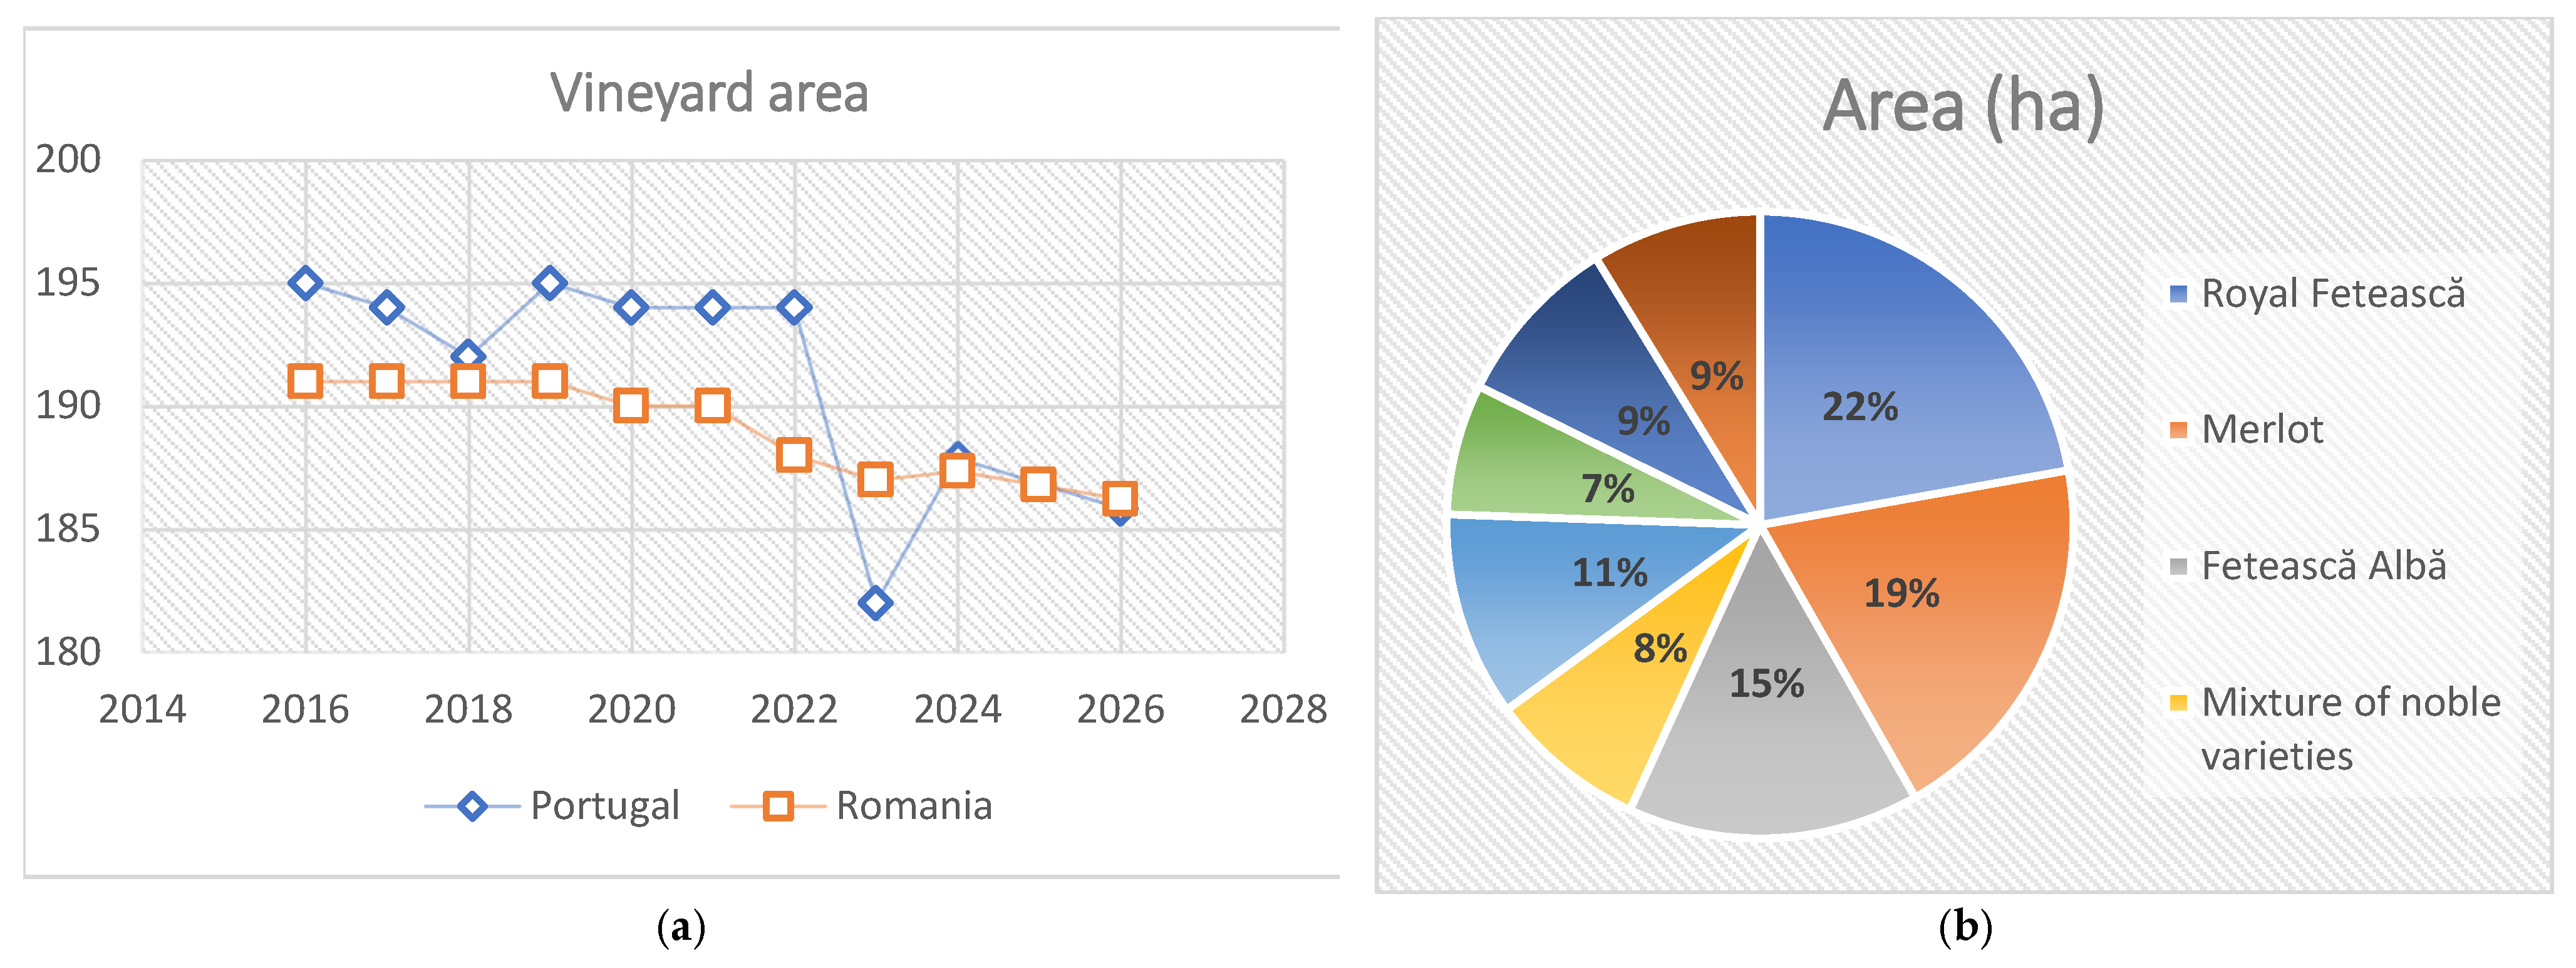
| Vineyard Area | Similar to Romania (~194 k ha), slight annual decline | Similar to Portugal (~189 k ha), minor decrease | No (p = 0.197) |
| Wine Production Volume | High and stable (e.g., 7359 k hl in 2021) | Lower (e.g., 4451 k hl in 2021) | Yes (p < 0.001), strong export predictor |
| Grape Production | High (e.g., ~6951 k tons) | Lower (e.g., ~4227 k tons) | Yes (p < 0.001) |
| Domestic Consumption | High (e.g., ~5269 k hl in 2021) | Lower (e.g., ~3709 k hl in 2021) | Yes (p < 0.001), strong export predictor |
| Export Value | Very high (e.g., USD 1.09 B in 2021) | Low (e.g., ~USD 40 M in 2021) | Yes (p < 0.001), key outcome variable |
| Triple Bottom Line (TBL) Adoption | Mature, widespread across regions, strong organic and biodynamic focus | Developing, fragmented adoption, growth in organic certifications | Strategic alignment with export competitiveness |
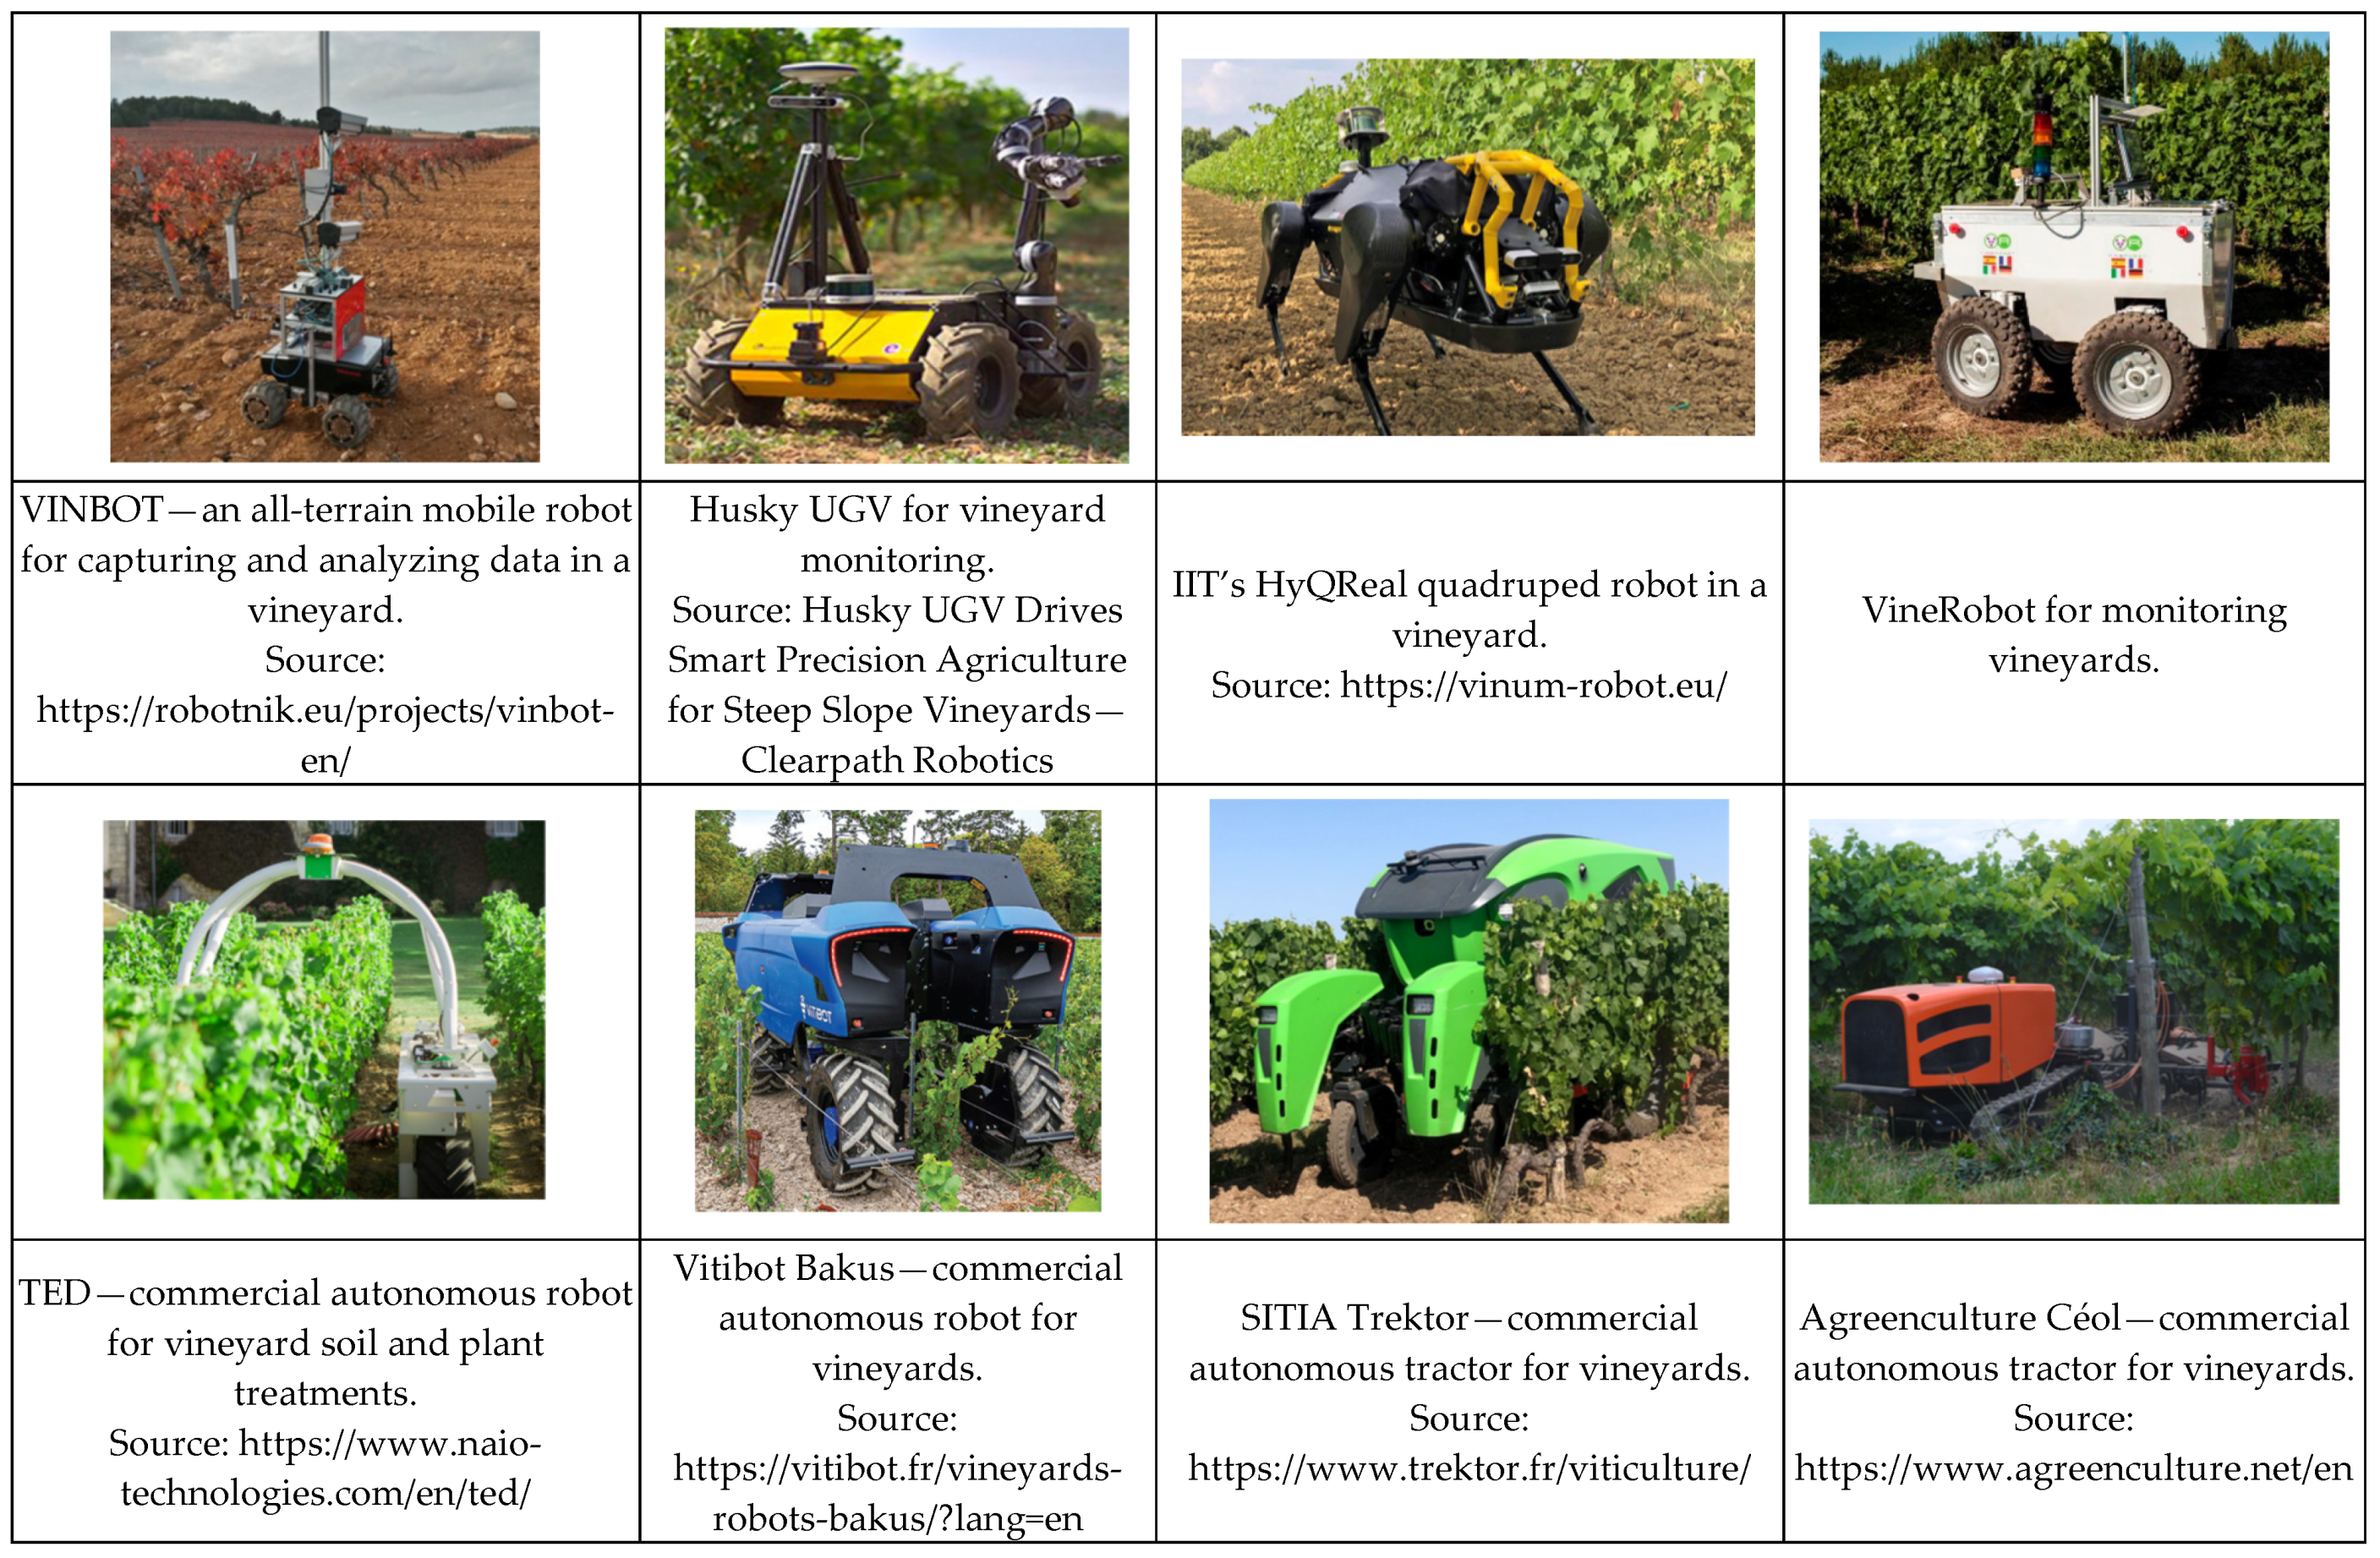
| Industry 5.0 Integration | Advanced (robotics, precision viticulture, sustainability reporting) | Emerging stage, high potential, early-stage robotics | Influences sustainability and efficiency |
| Main Export Markets (Romania) | France, UK, USA, Brazil, Germany | Germany, Netherlands, UK, USA, Belgium | Export volume and value are modest |
| Main Export Markets (Portugal) | France, UK, USA, Brazil, Germany | High global presence, strong brand perception |
Disclaimer/Publisher’s Note: The statements, opinions and data contained in all publications are solely those of the individual author(s) and contributor(s) and not of MDPI and/or the editor(s). MDPI and/or the editor(s) disclaim responsibility for any injury to people or property resulting from any ideas, methods, instructions or products referred to in the content. |
© 2025 by the authors. Licensee MDPI, Basel, Switzerland. This article is an open access article distributed under the terms and conditions of the Creative Commons Attribution (CC BY) license (https://creativecommons.org/licenses/by/4.0/).
Share and Cite
Dobre Gudei, S.C.; Tancelov, L.; Bucea-Manea-Țoniș, R.; Manolache, D.; Ionescu, N. Sustainable Competitiveness and Applicative Comparative Analysis of Wine Production Through the Lens of Triple Bottom Line, Robotics, and Industry 5.0 Strategies. Sustainability 2025, 17, 3767. https://doi.org/10.3390/su17093767
Dobre Gudei SC, Tancelov L, Bucea-Manea-Țoniș R, Manolache D, Ionescu N. Sustainable Competitiveness and Applicative Comparative Analysis of Wine Production Through the Lens of Triple Bottom Line, Robotics, and Industry 5.0 Strategies. Sustainability. 2025; 17(9):3767. https://doi.org/10.3390/su17093767
Chicago/Turabian StyleDobre Gudei, Simona Corina, Liane Tancelov, Rocsana Bucea-Manea-Țoniș, Daniel Manolache, and Nicolae Ionescu. 2025. "Sustainable Competitiveness and Applicative Comparative Analysis of Wine Production Through the Lens of Triple Bottom Line, Robotics, and Industry 5.0 Strategies" Sustainability 17, no. 9: 3767. https://doi.org/10.3390/su17093767
APA StyleDobre Gudei, S. C., Tancelov, L., Bucea-Manea-Țoniș, R., Manolache, D., & Ionescu, N. (2025). Sustainable Competitiveness and Applicative Comparative Analysis of Wine Production Through the Lens of Triple Bottom Line, Robotics, and Industry 5.0 Strategies. Sustainability, 17(9), 3767. https://doi.org/10.3390/su17093767